




Abstract
Blast-induced shock waves (BSWs) are responsible for several aspects of psychiatric disorders that are collectively termed mild traumatic brain injury (mTBI). The pathophysiology of mTBI includes vascular leakage resulting from blood–brain barrier (BBB) disruption. In this study, the precise sequence of BBB breakdown was examined using an Evans blue and fluorescein isothiocyanate (FITC)-dextran double labeling technique. Evans blue solution was injected into the tail vein of male C57BL6/J mice just before and 4 h, 1 day, 3 days, and 7 days after a single BSW exposure at as low as 25-kPa peak overpressure. In contrast, the FITC-dextran solution was transcardially injected just before perfusion fixation. Differences in the labeling time-point revealed that BBB breakdown was initiated after approximately 3 h, with significant remodeling by 1 day, and continued until 7 days after BSW exposure. BBB breakdown was upregulated in three distinct regions, namely the brain surface and subsurface areas facing the skull, regions closely associated with capillaries, and the circumventricular organ and choroid plexus. These regions showed distinct responses to BSW; moreover, clusters of reactive astrocytes were closely associated with the sites of BBB breakdown. In severe cases, these reactive astrocytes recruited activated microglia. Our findings provide important insights into the pathogenesis underlying mTBI and indicate that even mild BSW exposure affects the whole brain.
Introduction
Supersonic objects are sources of shock waves in the air. Blast-induced shock waves (BSWs) arise from natural phenomena such as meteor crashing, volcanic eruption, and lightning strike, and man-made sources including plant explosions, fireworks, and electronic devices, as well as war and terrorism. Growing evidence has indicated that BSWs cause several psychiatric disorders, including post-traumatic stress disorder, depression, and dementia. 1 –5 Veterans exposed to BSWs are 3.76 times more likely to attempt suicide. 6 However, diagnostic imaging techniques, including X-ray photography, computed tomography, and magnetic resonance imaging, cannot effectively visualize the underlying lesions as if there are invisible scars in the brain. Therefore, these symptoms are termed blast-induced “mild” traumatic brain injury (mTBI). 7,8 Among deployed soldiers, mTBIs vastly outnumber moderate-to-severe TBIs, 1 with a single explosive incident causing more mTBIs than higher grade TBIs.
The pathophysiology of mTBI includes vascular leakage due to blood–brain barrier (BBB) disruption. 5,9 –14 Dyes impermeable to the BBB, including Evans blue, fluorescein isothiocyanate (FITC)-dextran, and other tracers, have been used to visualize the extent of BBB breakdown. 15,16 Numerous reports have indicated that BBB breakdown in mTBI models continues for approximately a week. 7,17 –21 However, it remains unclear how BBB breakdown initiates. High-intensity BSW exposure induces immediate BBB breakdown whereas a sub-mild overpressure of 35 kPa does not. 19 Significantly increased immunoglobulin G extravasation occurs between 3 and 24 h, but not until 3 h, after BSW exposure with a peak overpressure of 120 kPa. 17 Intense BSW exposure immediately destroys the junctional integrity between endothelial cells and can cause bleeding in extreme cases. 5 However, whether low-intensity BSW causes delayed onset of BBB breakdown leading to mTBI and how the defect is distributed in the brain remain unclear.
Astrocytes, 22 -24 microglia, 25,26 and oligodendrocytes 27,28 are glial cells involved in the pathophysiology of mTBI. At the interface between vascular and nervous components, astrocytes and microglia are crucially involved in regulating BBB integrity. 29,30 When mTBI occurs, reactive astrocytes and activated microglia are widely distributed in the brain. 31 However, this evidence is largely based on experiments using relatively high-intensity BSW, with the evidence for low-intensity BSW remaining inconclusive. Additionally, whether the glial responses are the initial step of pathogenesis or a consequence of BBB breakdown remains unclear.
This study aimed to examine the pathogenesis underlying the diverse psychiatric disorders in mTBI using low-intensity BSW. We previously found that a single BSW exposure as low as 25 kPa in peak overpressure results in social deficits and depression-like behaviors, which could be prevented through hydrogen gas inhalation in mice. 32 Using this model, we examined the spatiotemporal sequence of BBB breakdown and the glial responses from the period immediately after BSW exposure to after 1 week following the exposure.
Methods
Animals
In this study, we used 8-week-old male C57BL6/J mice. The mice were housed under standard laboratory conditions with a 12-h light/dark cycle and room temperature maintained at 24 ± 1°C. The mice had ad libitum access to water and food. All experiments were conducted following the institutional ethical guidelines for animal experiments of the National Defense Medical College (Tokorozawa, Japan). This study was approved by the Committee for Animal Research at the National Defense Medical College.
BSW exposure
We have previously described the BSW exposure condition. 32 Briefly, each mouse was placed at 5 cm from the exit end of the shock tube with the body axis parallel to, but away from, the axis of the shock tube to reduce direct blast flow to the mice (Supplementary Fig. S1). Each animal received a single BSW exposure with a peak overpressure of 25 kPa at the head. The experiments were performed with the mice under anesthesia induced by a mixture of medetomidine hydrochloride, midazolam, and butorphanol. 33 Control mice were sham-operated in the same room.
Tracer labeling and transcardial perfusion
Evans blue and 10-/40-kDa FITC-dextran were purchased from Sigma-Aldrich (E2129, FD10S, and FD40S; Sigma-Aldrich, Tokyo, Japan). Evans blue solution (4% w/v in saline) was injected intravenously (2.5 μL/g) through the tail vein just before or 4 h, 1 day, 3 days, and 7 days after BSW exposure. After labeling, the mice were transcardially perfused for 2 min with heparinized phosphate-buffered saline (PBS) including 10- or 40-kDa FITC-dextran (3 mg/mL), followed by 10% formalin neutral buffer solution (062-01661, FUJIFILM Wako Chemicals, Osaka, Japan). Figure 1A shows a schematic outline of the procedure.
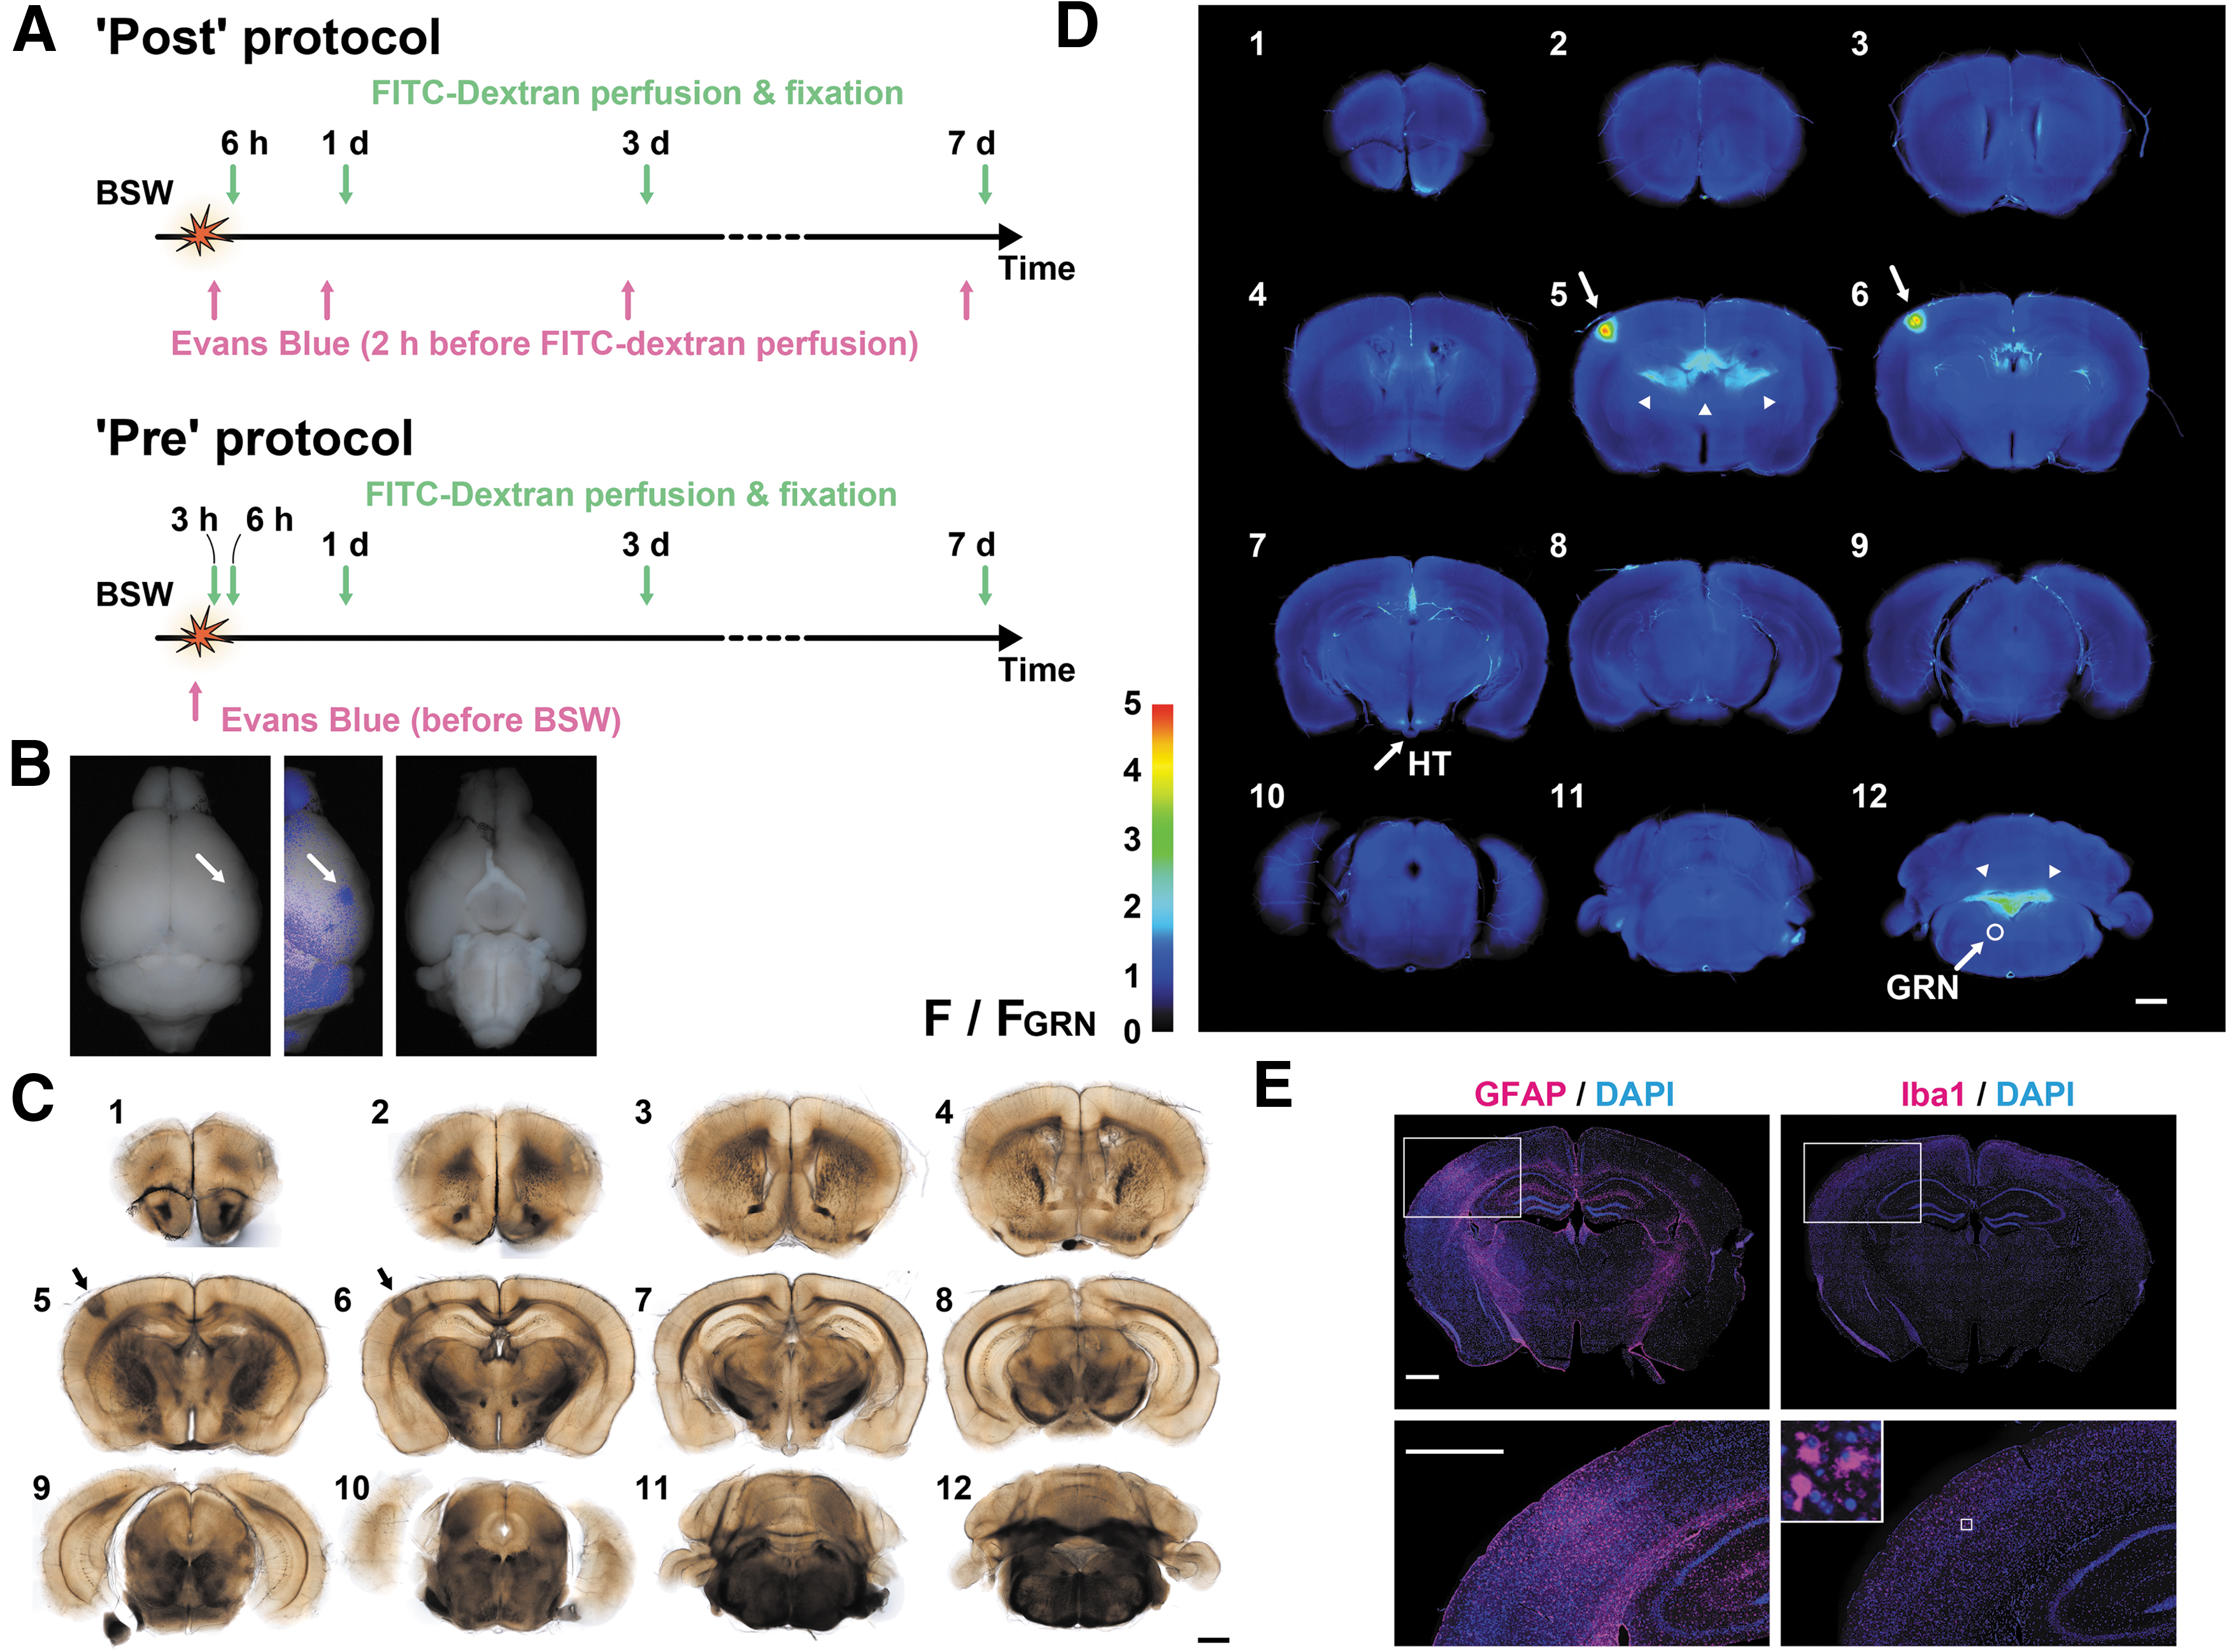
Experimental design. Evans blue solution was intravenously injected after or immediately before blast-induced shock wave (BSW) exposure, while fluorescein isothiocyanate (FITC)-dextran was transcardially perfused for 2 min before fixation.
Brain tissue processing and analysis of dye extravasation
After perfusion, the brains were removed and post-fixed overnight in the same fixative at 4°C. Subsequently, the brains were washed with PBS and coronally sectioned into 12 slices of 1-mm thickness using a brain slicer (RBM-2000C; ASI Instruments Inc., Warren, MI, USA). Slices were cleared in a graded series of glycerol, beginning at 20% glycerol in phosphate buffer (PB; pH 7.4), followed by 50% and 100% glycerol-PB. The duration of each step was ≥2 h at 4°C. The cleared slices were transferred into a coverglass chamber (5212-002; AGC TECHNO GLASS Co. Ltd., Yoshida-cho, Shizuoka, Japan). Bright-field and fluorescence images were obtained through a UPlanFl 4 × objective using an IX83 inverted microscope (Olympus IX83 Automated Fluorescence Microscope, RRID:SCR_020344, OLYMPUS, Tokyo, Japan). Fluorescence intensities of the dyes in the selected regions of the control brains are demonstrated in Supplementary Figure S2.
Immunohistochemistry
After obtaining image scans of the dye extravasation, slices were transferred to 50% glycerol-PB overnight and then to 30% glycerol-PB for ≥2 h at 4°C. Subsequently, the slices were embedded in Tissue-Tek OCT compound, cryo-sectioned at 6-μm thickness, and mounted on glass slides. Antigen retrieval was performed using 10 mM sodium citrate (pH 6.0) at 100°C for 1 h. 34 After extensive washing in distilled water and then in PBS, the mounted sections were incubated in a blocking solution (PBS containing 5% normal goat serum) for 1 h, followed by overnight incubation at 4°C in the blocking solution containing primary antibodies specific against 2',3'-cyclic nucleotide 3'-phosphodiesterase (CNPase, 1:100, Sigma-Aldrich Cat# C5922, RRID:AB_476854, Sigma-Aldrich, Tokyo, Japan), glial fibrillary acidic protein (GFAP, 1:1, IR524, DAKO-Agilent, Tokyo, Japan), and ionized calcium-binding adapter molecule 1 (Iba1, 1:250, FUJIFILM Wako Shibayagi Cat# 019-19741, RRID:AB_839504, FUJIFILM Wako Chemicals, Osaka, Japan). The CNPase antibody was a mouse 11-5B mAb used to label oligodendrocytes, while the GFAP and Iba1 antibodies were rabbit polyclonal antibodies used to label astrocytes and microglia, respectively; the mouse mAb was applied with either of the rabbit polyclonal antibodies.
After extensive washing using PBS, the samples were incubated for 2 h with Alexa Fluor 488 chicken anti-mouse antibody and Alexa Fluor 546 donkey anti-rabbit antibody (Molecular Probes Cat# A-21200, RRID:AB_2535786, and Thermo Fisher Scientific Cat# A10040, RRID:AB_2534016, Invitrogen, Tokyo, Japan) at a concentration of 5 μg/mL in the blocking solution. In another set of immunohistochemical staining, the primary antibody against CNPase was omitted. In this case, the sections were incubated for 2 h with the Alexa Fluor 488 donkey anti-rabbit antibody (5 μg/mL in the blocking solution, Thermo Fisher Scientific Cat# A21206, RRID:AB_2535792; Invitrogen), together with TL-DyLight 594 (2 μg/mL, L32471; Invitrogen) used to label blood vessels. Finally, the samples were extensively washed using PBS and mounted in VECTASHIELD with 4′,6-diamidino-2-phenylindole (DAPI; Vector Laboratories Cat# H-1200, RRID:AB_2336790; Vector Laboratories Inc., Burlingame, CA), which counterstains nuclei. Fluorescence images were scanned with UPlanFL N 10x and UCPlanFL N 20 × objectives using the Olympus IX83 inverted microscope.
Statistical analysis
A total of 124 mice were used in this study. The cellSens imaging software (Olympus cellSens Software, RRID:SCR_014551; OLYMPUS, Tokyo, Japan) and ImageJ (ImageJ, RRID:SCR_003070, National Institutes of Health, Bethesda, MD) were used for visualization and analysis of microscopic data, respectively. The ImageJ plugin “SixteenBit Histogram” was used for extraction of pixel values. Data processing was conducted using Microsoft Excel (Microsoft Excel, RRID:SCR_016137). Statistical analyses, including correlation analysis, were performed using GraphPad Prism 8 (GraphPad Prism, RRID:SCR_002798; GraphPad Software, San Diego, CA). Group comparisons of mean values were conducted using ANOVA, followed by Dunnett's multiple comparison test (p < 0.05 were considered significant). Group comparisons of variance values were performed using the F-test. To avoid the effect of multiple comparisons, p values <0.01 were considered significant for the latter test.
Results
Figure 1 shows the study flowchart. Tracer labeling was conducted using two protocols (Fig. 1A). In the “Post” protocol, Evans blue solution was injected 2 h before FITC-dextran perfusion, which was performed 6 h, 1 day, 3 days, and 7 days after BSW exposure. In the “Pre” protocol, Evans blue solution was injected just before BSW exposure. We obtained fluorescence images of 12 slices from each brain to examine dye extravasation (Fig. 1B–D). Next, we performed immunohistochemical staining of thinner sections prepared from the slices (Fig. 1E). Each slice was labeled as “Pre3D#6,” with “Pre,” “3D,” and “#6” representing the labeling protocol, elapsed time after BSW exposure, and slice number (if necessary), respectively. Figure 1B illustrates a representative Pre3D brain with Evans blue staining on its surface. In the corresponding Pre3D#5 and Pre3D#6 slices, dark staining in the bright-field image was positive for intense fluorescence emitted by Evans blue staining (Fig. 1C, 1D, arrows). The Pre3D#6 cryosection showed reactive astrogliosis, which was characterized by GFAP upregulation as well as active and amoeboid microglia, in the same region where dye extravasation occurred (Fig. 1E). After BSW exposure, red blood cells were not detected outside the blood vessels. Unless otherwise noted, controls were obtained from the sham-operated mice, which were labeled in the “Post” protocol at 6 h, 1 day, 3 days, and 7 days.
Image processing and evaluation of Evans blue extravasation
Since a labeling duration of 2 h is widely accepted for Evans blue, we initially examined the occurrence of dye extravasation in the mouse brain using the “Post” protocol (Fig. 2). In our low-intensity BSW model, variations in the region, extension, and intensity of Evans blue fluorescence were observed among brains. To quantitatively evaluate the extravasation, the mean fluorescence intensities of all, top 10%, 1%, and 0.1% pixels of the brain slices were calculated—that is, the intensities of all pixels represent the overall brightness of the brains, and as the percentage decreases, the intensities of the pixels represent those from the brightest region among the slices (Fig. 2A). There was a significant difference in the variance but not mean values of fluorescence intensity within the “Post” protocol at 6 h [F(5, 7) = 467.6, p < 0.0001], 1 day [F(6, 7) = 24.73, p = 0.0004], and 3 days [F(5, 7) = 262.6, p < 0.0001]. In distinction to the result of the “Post” protocol, there was a consistent increase in fluorescence intensity in the “Pre” protocol from 1 day and onwards (Fig. 2C). The highest intensity of Evans blue fluorescence occurred within the pia mater and cortex, around the brain vessels, and in the circumventricular organs of the third ventricle (CVO) and choroid plexuses (Fig. 2D). Notably, there was no Evans blue dye extravasation in Pre3H (p = 0.4320, Dunnett's multiple comparison test). This finding indicated that BBB breakdown did not occur immediately after BSW exposure.
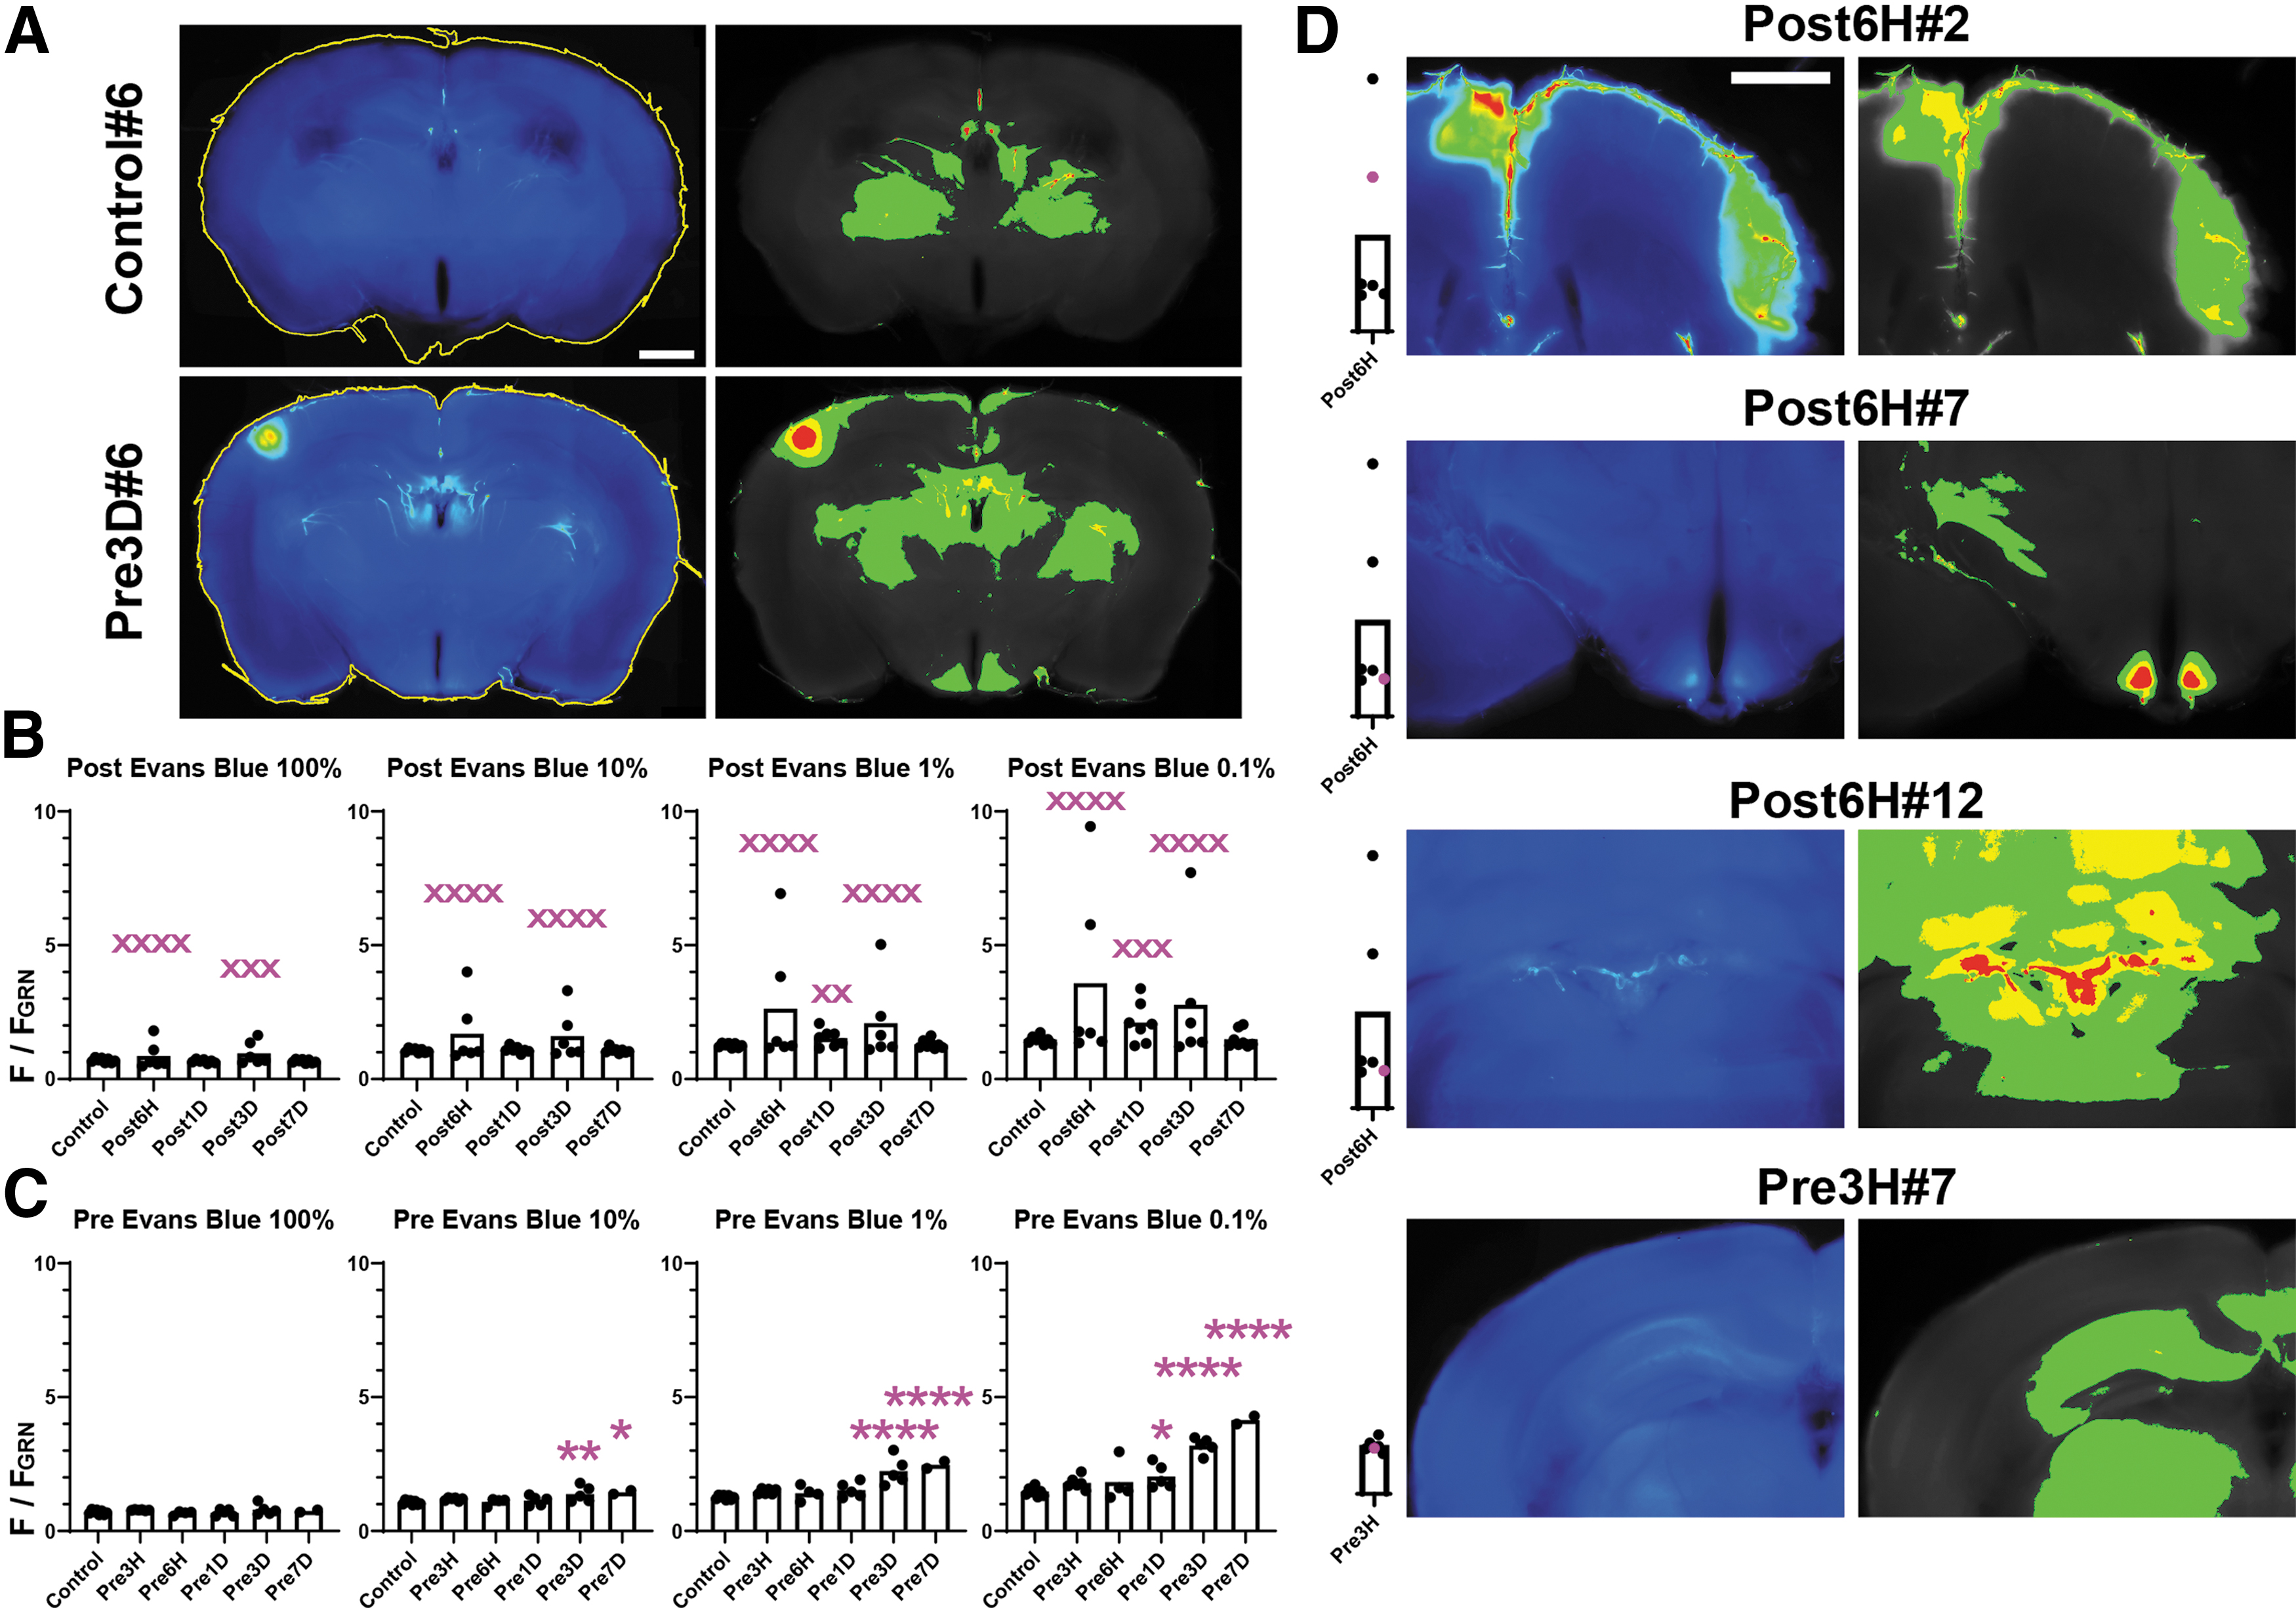
Evans blue image analysis. Regions of interest (ROIs; yellow lines) are shown in the left panels in
Diffuse Evans blue extravasation in the cerebral cortex facing the skull
In addition to the aforementioned foci of marked Evans blue extravasation, relatively vague Evans blue fluorescence was observed in the cerebral cortical layers, cerebellum, and brainstem (Fig. 3A; Supplementary Fig. S3). The fluorescent zone became visible after image enhancement and always faced the skull. The intensity of the fluorescence and the involved layers were highly variable among the brains. The fluorescence intensity in the cortex was divergent in the “Post” protocol, similar to that in the entire brain shown in Figure 2B at 6 h [F(5, 7) = 98.40, p < 0.0001], 1 day [F(6, 7) = 1.312, p = 0.7239], and 3 days [F(5, 7) = 18.90, p = 0.0012]. However, in the “Pre” protocol, a consistent increase in the fluorescence intensity was not observed, contrary to that observed in the entire brain (Fig. 3B). In the “Post” protocol, a significant positive correlation of the fluorescence intensity between the cortical subsurface zone and the top 0.1% pixels was observed (Fig. 3C). This finding suggested that the primary damage was positively correlated with the diffuse cortical extravasation.
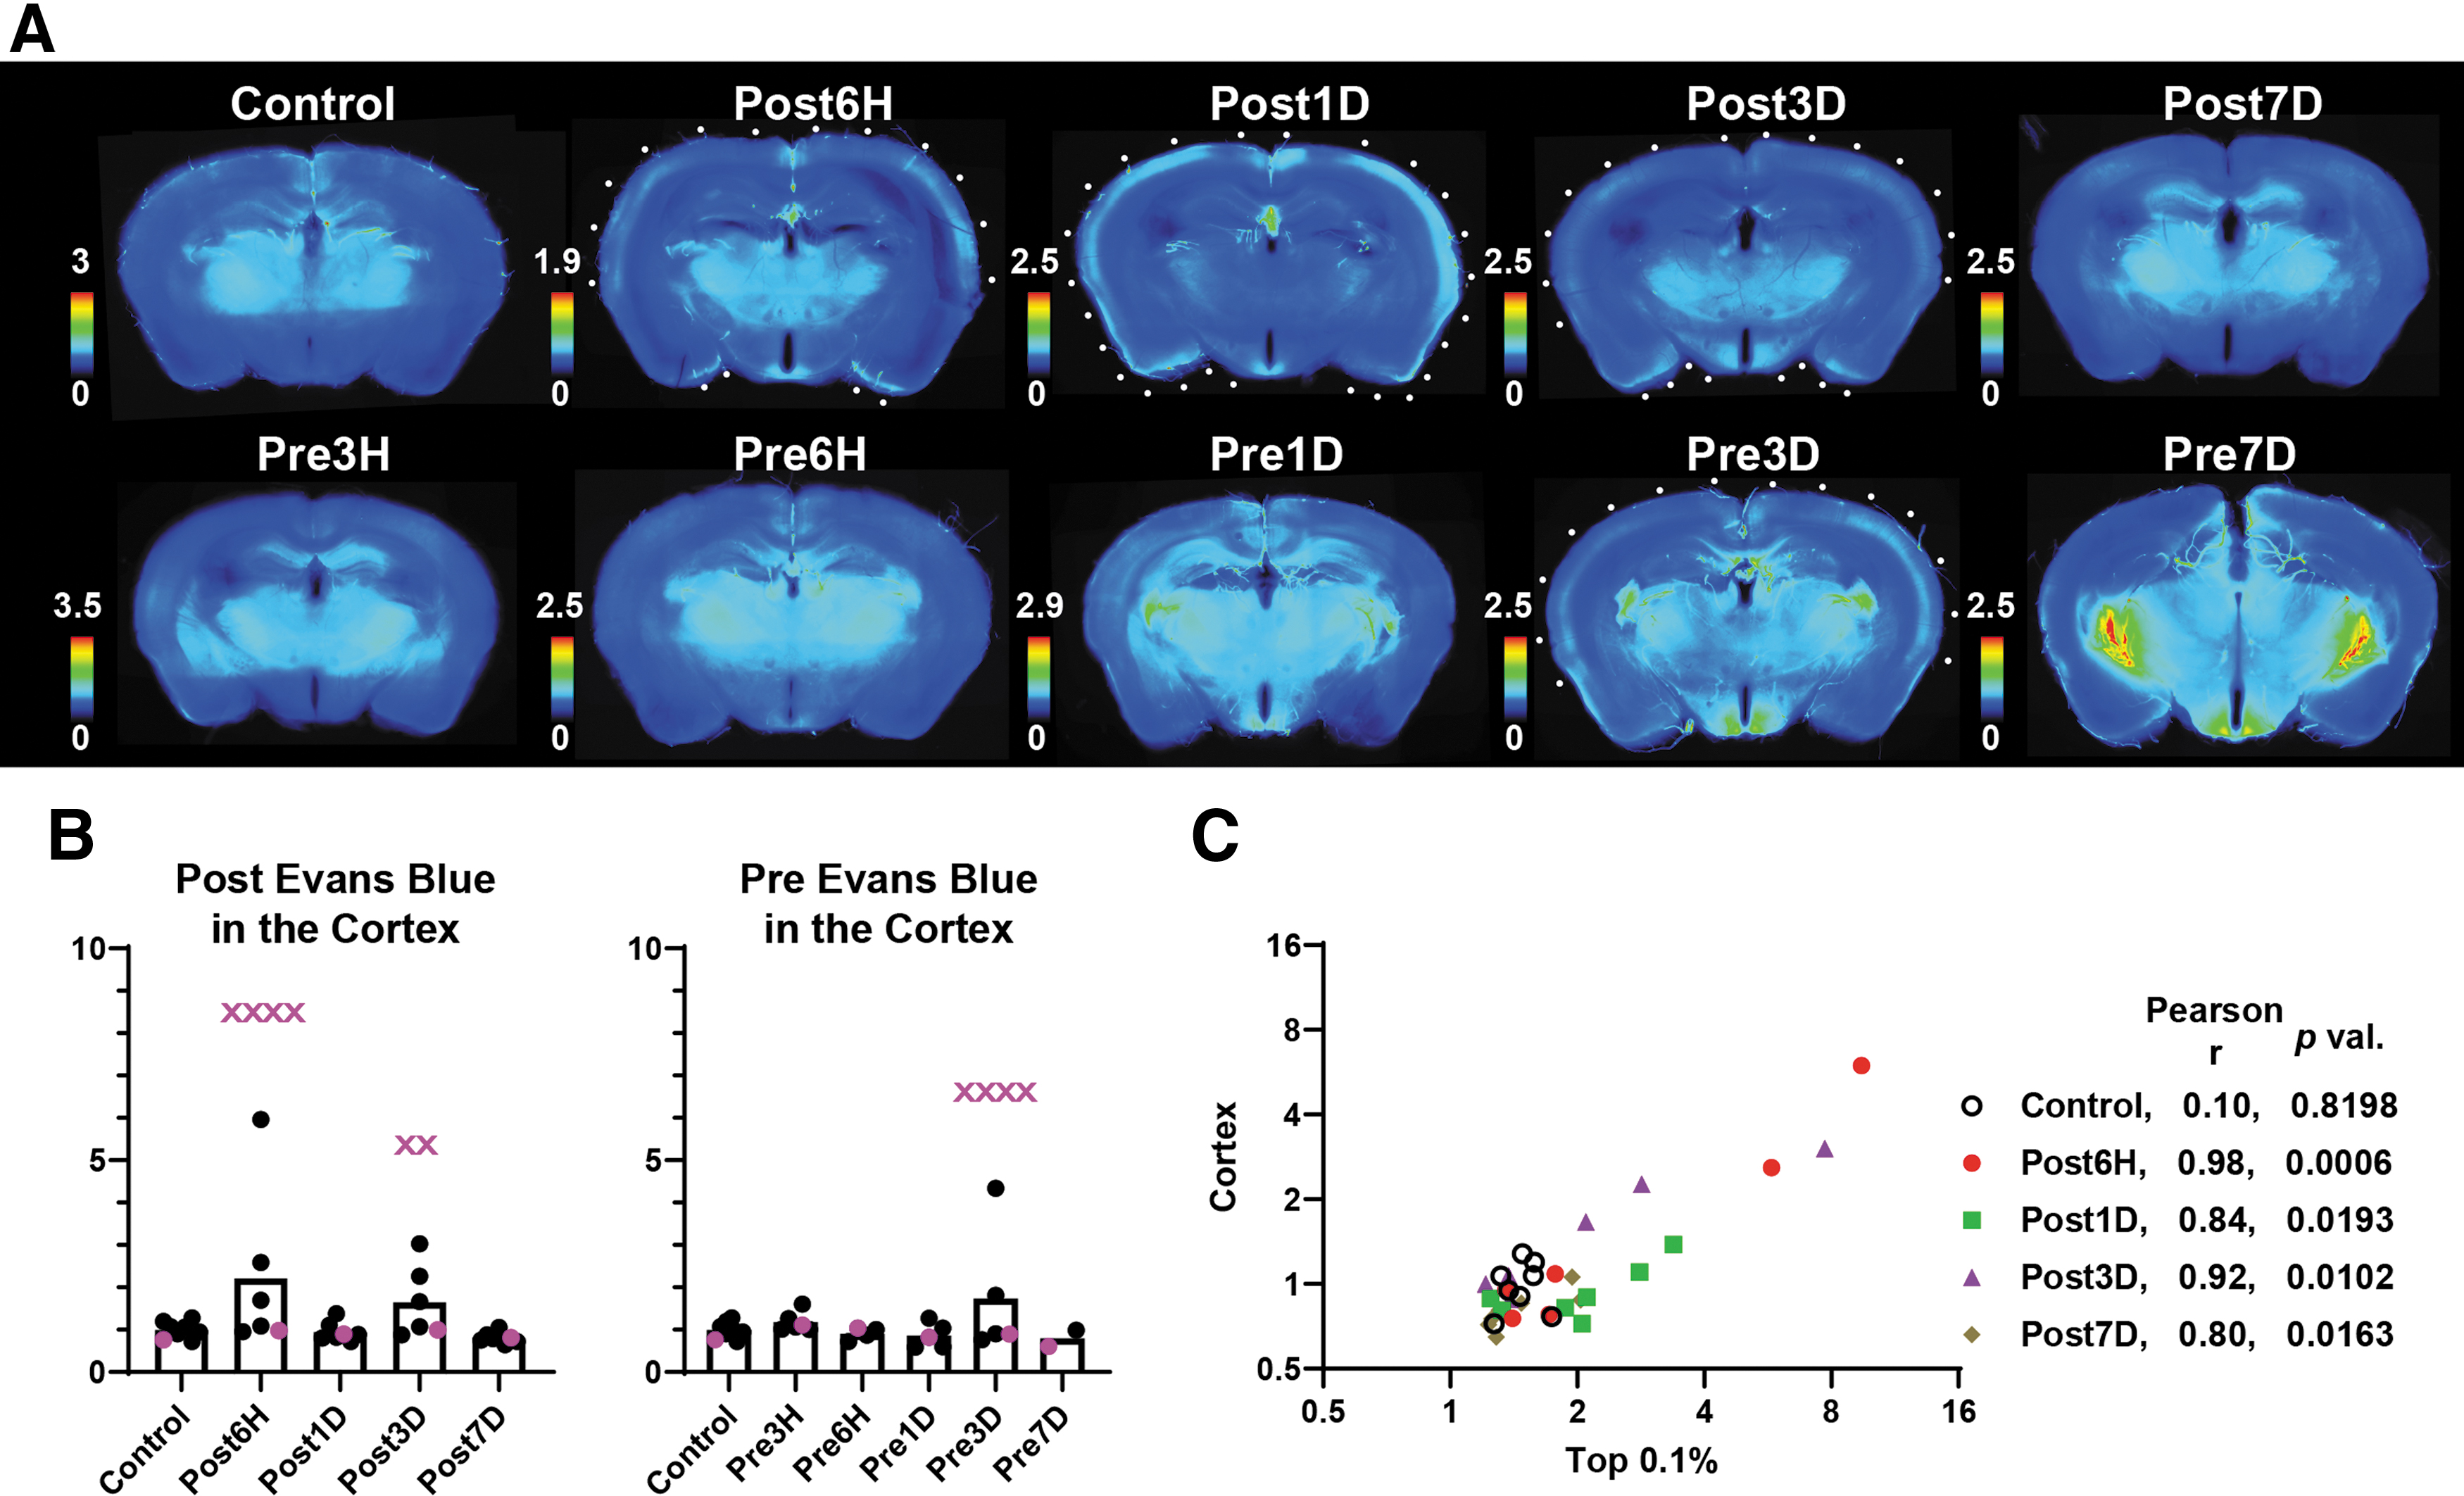
Diffuse cortical extravasation of Evans blue.
Evans blue extravasation in the CVO and choroid plexus
Under normal conditions, the BBB is incomplete or absent in the CVO and choroid plexus. 11,30 These regions showed fluorescence from Evans blue (Fig. 4A, 4B); further, BSW-exposed brains exhibited a higher fluorescence intensity than control brains. In the “Post” protocol (Fig. 4A), the fluorescence in the CVO changed at the different time-points at 6 h [F(5, 7) = 138.1, p < 0.0001], 1 day [F(6, 7) = 3.498, p = 0.1260], 3 days [F(5, 7) = 43.15, p < 0.0001], and 7 days [F(7, 7) = 3.078, p = 0.1611]; the fluorescence in the choroid plexus of the lateral ventricle changed at 6 h [F(5, 7) = 32.54, p = 0.0002], 1 day [F(6, 7) = 9.617, p = 0.0086], 3 days [F(5, 7) = 105.9, p < 0.0001], and 7 days [F(7, 7) = 5.690, p = 0.0354]; the fluorescence in the choroid plexus of the fourth ventricle changed at 6 h [F(5, 7) = 55.72, p < 0.0001], 1 day [F(6, 7) = 2.909, p = 0.1884], 3 days [F(5, 7) = 7.030, p = 0.0236], and 7 days [F(7, 7) = 3.878, p = 0.0944]. The extravasation degree was strongly correlated with that in the cortex in the “Post” protocol (Fig. 4C). The daily increase in fluorescence intensity in the “Pre” protocol (Fig. 2C) was attributed to that observed in the CVO and choroid plexuses (Fig. 4B). Although a similar daily increase was observed in the sham-operated brain (Fig. 5), dye accumulation in other regions was a characteristic feature of BSW-exposed brains in the “Pre” protocol (Fig. 1-3).

Evans blue fluorescence in the circumventricular organs of the third ventricle (CVO) and choroid plexuses with respect to that in the cortex.

Evans blue accumulates in the circumventricular organs of the third ventricle and choroid plexuses but not in other regions of the sham-operated brain at 7 days of the “Pre” protocol. Arrowheads indicate the choroid plexuses. HT, hypothalamus; GRN, gigantocellular reticular nucleus
40-kDa FITC-dextran extravasation
Labeling with 40-kDa FITC-dextran was performed for 2 min before perfusion fixation in both the “Post” and “Pre” protocols (Fig. 1A). This molecule has a similar molecular mass to that of the Evans blue-albumin complex in the serum and depicts a similar extent of BBB breakdown to Evans blue (Fig. 6). We used this feature, together with the short labeling period, to determine the precise sequence of BBB breakdown. The fluorescence intensity of 40-kDa FITC-dextran extravasation tended to increase from 3 h to 3 days after BSW exposure, which was probably similar to the extravasation pattern for Evans blue in the “Post” protocol (Fig. 6B). In addition, 40-kDa FITC-dextran labeling revealed diffuse extravasation in the cerebral cortex, cerebellum, and brainstem, but not in the CVO and choroid plexuses (Fig. 6A; Supplementary Fig. S3 and Supplementary Fig. S4). Extravasation of a low molecular weight tracer, 10-kD FITC-dextran, was much more pronounced than 40-kD FITC-dextran, including that in the choroid plexus of the lateral ventricle (Supplementary Fig. S5).

Fluorescence images of 40-kDa fluorescein isothiocyanate (FITC)-dextran in the cortex. The images are from the same slices shown in Figure 3. The color bars indicate image enhancement that rendered cortices in light blue. Similar to Evans blue, 40-kDa FITC-dextran showed diffuse cortical extravasation in varying degrees and extents within the subsurface zone (
Temporal sequence of BBB breakdown
Since two different dyes were introduced into the brain at intervals of 2 h (“Post”) or longer (“Pre”), differences in the dye distribution provided information regarding the temporal changes of the BBB integrity. Dye extravasation occurred in the Pre3H brain; specifically, 40-kDa FITC-dextran, but not Evans blue, labeled the BBB disruption at 3 h after BSW exposure (Fig. 7). This finding indicated that the labeling performance of Evans blue would expire by 3 h. There were numerous fluorescence hotspots of various sizes. Although some hotspots were brilliant enough for inclusion in the top 0.1% pixels, many hotspots were only slightly brighter than the surrounding tissue (Fig. 2 and Fig. 7A). A between-dye mismatch indicated changes within the interval. Specifically, hotspots only showing Evans blue fluorescence demonstrated that ongoing BBB breakdown during Evans blue injection was repaired by the time of 40-kDa FITC-dextran injection. Hotspots only showing 40-kDa FITC-dextran fluorescence indicated that BBB disruption emerged between the two dye injections. Finally, hotspots showing fluorescence for both dyes indicated ongoing BBB breakdown throughout the injection periods.

Blood–brain barrier breakdown at different time-points observed using Evans blue and 40-kDa fluorescein isothiocyanate (FITC)-dextran double labeling.
Figure 7B presents the numbers of the hotspots positive for Evans blue (Evans blue-only hotspots plus Evans blue/40-kDa FITC-dextran double-positive hotspots), 40-kDa FITC-dextran (40-kDa FITC-dextran-only hotspots plus Evans blue/40-kDa FITC-dextran double-positive hotspots), and both dyes (Evans blue/40-kDa FITC-dextran double-positive hotspots). Numerous 40-kDa FITC-dextran-only hotspots were found in Pre3H. In Post6H and Post1D, both Evans Blue-only and 40-kDa FITC-dextran-only hotspots were found. In Post3D and Post7D, the hotspots were almost positive for both dyes. These results indicated that BBB breakdown emerged at 3 h, remodeled by 1 day, and persisted until 7 days after BSW exposure. Notably, the degree of BBB breakdown tended to decrease toward 7 days, as mentioned above.
Glial responses in the normal and BSW-treated brains
After the dye extravasation experiments, we performed immunohistochemical staining of the slices (Fig. 1E). We always compared immunohistochemical image scans with those of the dye extravasations, and there was a limited carry-over effect from the fluorescent substances (Supplementary Fig. S6). The GFAP gene has multiple exons; moreover, the respective isoforms are expressed according to the astrocyte state. 35,36 Specifically, not all astrocytes are GFAP-positive. 37 We used the polyclonal GFAP antibody to label astrocytes within and around the white matter as well as in nervous tissue adjacent to the pia mater (Fig. 8A). We identified white matter through CNPase expression. In the control brains, the GFAP-positive astrocytes were rare in the brain parenchyma (Fig. 8A). In brain sections at ≤3 h after BSW exposure, no immunohistochemical staining alterations were detected (not shown). However, at 6 h, we found clusters of GFAP-positive astrocytes in regions other than the aforementioned regions (Fig. 8B), with (b1–b3, Fig. 8B) or without (a1–a3, Fig. 8B) related dye extravasation. Table 1 summarizes the numbers of reactive astroglioses, 40-kDa FITC-dextran hotspots, and double-positive hotspots. There were several inconsistencies between the regions of reactive astrogliosis and ongoing dye extravasation.

Expression of 2',3'-cyclic nucleotide 3'-phosphodiesterase (CNPase), glial fibrillary acidic protein (GFAP), and ionized calcium-binding adapter molecule 1 (Iba1) as markers for oligodendrocytes, astrocytes, and microglia, respectively. In the control slice
Relationship Between Reactive Astrogliosis and Dye Extravasation
FITC, fluorescein isothiocyanate.
As discussed above, the labeling efficiency of Evans blue dropped to nearly zero by 3 h after administrations. However, there was gradual and continuous accumulation of Evans blue in the CVO and choroid plexuses in the “Pre” protocol (Fig. 4 and Fig. 5). This result indicated that the blood dye concentration remained low even at ≥3 h after administration; additionally, the dye accumulated in tissues that consistently lacked BBB. Moreover, the dye accumulated in regions showing BBB breakdown in the “Pre” protocol (Fig. 1 and Fig. 8B). In this case, since dye extravasation is a transient process, we speculate that the labeling intensity would be proportional to the severity and duration of BBB breakdown as well as the blood concentration of Evans blue; however, it would exponentially decay after being repaired. Both the Pre1D (c1) and Pre3D (d1) slices shown in Figure 8B demonstrated Evans blue accumulation, which was associated with reactive astrogliosis (c3 and d3, Fig. 8B). The ongoing BBB breakdown in the Pre1D slice was confirmed through the fluorescence of 40-kDa FITC-dextran (c2).
Conversely, the BBB breakdown was repaired within 3 d in the Pre3D slice, as confirmed by the negative 40-kDa FITC-dextran fluorescence (d2). In the Pre3D cryosection, highly activated and amoeboid microglia as well as reactive astrocytes were detected (d3 and d4). At 7 days, although clear dye hotspots were seldom found, reactive astrogliosis was observed as frequently as at the earlier stages (Table 1, e1–e3). All three reactive astroglioses in Pre6H were not labeled with Evans blue; however, all two and three reactive astroglioses in Pre1D and Pre3D, respectively, were in the Evans blue hotspots. Conversely, all of the Evans blue hotspots in Pre1D and Pre3D were associated with reactive astrogliosis (Fig. 1 and Fig. 8B). The Pre7D slices did not show Evans blue hotspots (Fig. 3A). These results demonstrated that Evans blue accumulation was a good indicator of reactive astrogliosis between 1 and 3 days after BSW exposure in the “Pre” protocol.
We further found that capillaries, <10 μm in diameter, were the blood vessels that were distributed within the site of reactive astrogliosis (Fig. 8C). In the severest case, the capillaries were fragmented and associated with amoeboid microglia. However, in all of the other cases, we did not notice apparent microscopic changes in the microvasculature.
Discussion
This is the first study to provide a detailed description of the BBB breakdown process, including the glial responses after mild BSW exposure with peak overpressure at 25 kPa. Since the foci of post-BSW damages vary across cases, analysis of temporal changes of the damages within a single brain could be highly informative. Herein, we developed an Evans blue and FITC-dextran double labeling technique for revealing the precise sequence of BBB breakdown in a single brain. The same brain slices were subjected to immunohistochemical analysis, which allowed direct comparison between BBB breakdown and glial responses.
BBB breakdown was observed in approximately three brain regions (Fig. 9). The first region was the brain surface and subsurface areas facing the skull. This distribution strongly suggested that BSW deformed the skull, which resulted in brain surface damage. Almost all brains showed dye extravasation in these areas from 6 h to 3 d after BSW exposure (Fig. 3 and Fig. 6). Notably, these areas could be closely related to previously described psychiatric disorders. 32 Secondly, we observed fluorescence hotspots of various sizes and intensities that were distributed in numerous brain regions. Since the cross-sections of most hotspots were circular or columnar, they could have resulted in BBB breakdown of a single point or section of capillaries, respectively. In numerous slices, the blood vessel walls emitted bright fluorescence (for example, Pre3H#5 and Post6H#5 slices in Fig. 7). The torso exposed to BSW acts as the source of blood surges that are harmful to the brain. 38 Computer-simulated distribution of the peak maximum principal strain, with the assumption of blood surge from the torso, appeared to resemble the fluorescence hotspot patterns in this study. 39 Therefore, blood surges originating from outside of the skull could lead to the second type of BBB breakdown.

Summary of dye extravasation and immunohistochemical analyses. The darker the magenta color, the higher the fluorescence intensity. See Discussion for details. Sites such as “a,” “a',” etc., are referred to in the text. BSW, blast-induced shock waves; CP, choroid plexus; CVO, circumventricular organs of the third ventricle.
In a stroke model, endothelial transcytosis is upregulated in the early stage of BBB breakdown. 40 BBB breakdown involves four distinct stages of vascular damage and occurs with tight junction remodeling; therefore, temporal changes occur in the permeability to different tracers. 41,42 Vascular damage in the fluorescence hotspots could have followed a similar process. The first and second type of BBB breakdown have been predicted using mathematical models. 43 However, the third type of BBB breakdown was unexpected and involved the CVO and choroid plexus. These organs have increased vascular permeability to allow the secretion of hormones and cerebrospinal fluid. Therefore, vascular permeability in the CVO and choroid plexus may be sensitive to minute body changes and may show sensitivity to BSW exposure.
In the second type of BBB breakdown, the fluorescence hotspots indicated significant remodeling between 3 h and 1 d (sites “a–d” in Fig. 9). Regions such as site “a” in Figure 9 had bright hotspots, indicating persistent dye extravasation from 3 h to 7 days. Moreover, regions such as sites “b” and “c” exhibited transient BBB breakdown between 3 h and 1 day, which could only be labeled by one dye. The remodeling process stopped at around 1 day. For stable hotspots such as sites “a” and “d,” a gradual reduction in dye extravasation occurred until 7 days. These hotspots presented with or without reactive astrogliosis (“a'–c'” but not “d'” in Fig. 9). Since the half-life of GFAP is at least a few days long, 44 reactive astrogliosis is unlikely to disappear within a short period. Taken together, reactive astrogliosis could have emerged concurrently or shortly after the initiation of BBB breakdown. A similar context has been observed in an impact-acceleration weight-drop model. 45 The degree of reactive astrogliosis may be dependent on the severity of BBB breakdown: in some regions, reactive astrogliosis may disappear in a few days (e.g., “b'”), while in other regions, it might become chronic (e.g., “a'” and “c'”). Additionally, some fluorescence hotspots (e.g., “d”) may not show detectable GFAP expression.
We observed activated and amoeboid microglia only at 3 days (Fig. 1 and Fig. 8B, and “a''” in Fig. 9). This phenomenon might have been a sequela of reactive astrogliosis, and it occurred only in regions with severe BBB breakdown. Given its rarity, we could not determine whether it started earlier and whether it persisted. Microglia show diverse morphological responses after brain injuries. 46 -48 Unfortunately, we could not detect such relatively minor morphological alterations. Future studies should describe the glial responses using higher spatiotemporal resolutions.
Evans blue is a blue dye with a molecular weight of 961 Da; however, it emits red fluorescence when excited with green light. 49 Given its high affinity to serum albumin, it is considered to be a tracer of 69 kDa remaining in the blood for >2 h. 50 The use of Evans blue for detecting BBB breakdown has received criticism owing to the uncertainty of its kinetics and potential toxicity. 16 However, this study revealed two advantages of Evans blue. Firstly, Evans blue could estimate vascular permeability in the CVO and choroid plexus, and, secondly, the extravasated dye accumulated in the tissues lacking BBB for several days. These features are useful when used in combination with other dyes—as in this study. Notably, three unique types of BBB breakdown were revealed using Evans blue; the intensities of BBB disruption in these regions were significantly correlated with each other (Fig. 4). These findings suggest that mild BSW exposure simultaneously affects the whole brain. In support of this hypothesis, the low molecular weight tracer extravasated much more extensive than Evans blue (Supplementary Fig. S5). Therefore, treatment for mTBI should consider the whole brain, regardless of whether the injuries are visible.
In contrast, this study has several limitations. Firstly, although it is ideal to perform as many analyses as possible from a single brain, multi-step experiments may interfere with each other. Specifically, two dyes were administered to the mice at two different time-points in this study, and it is possible that the precedence of Evans blue attenuated the labeling efficiency of 40-kDa FITC-dextran. Notably, fluorescence of 40-kDa FITC-dextran tends to be weaker under the “Post” protocol only at the 2 h dosing interval (Fig. 6B). Secondly, the cryosections we subjected to immunostaining were from the slices already used for the analysis of dye extravasation. Though the protocol allowed for direct comparison between BBB breakdown and glial responses, we also found that many commercially available antibodies were ineffective under these conditions (unpublished data). The experiment will be much more efficient if genetically modified animals can express molecules such as GFP upon BBB breakdown. Most of the limitations discussed above can hence be alleviated because of omission of the dye-labeling procedure; moreover, real-time visualization of BBB breakdown can be achieved.
To prevent the progression of mTBI, it is very important to know what occurs soon after BSW exposure. As this study indicates, the sites of injury have both variable and invariable components, and early responses are usually subtle. This study provides a snapshot of the fundamentals of the early pathophysiology after BSW exposure that can be useful in validating new experimental systems in the future.
Conclusions
We demonstrated the spatiotemporal distribution of BBB breakdown and glial responses over a 7-day period after blast exposure. This study uniquely used two dyes to render the distribution of BBB breakdown at two time-points, with subsequent immunohistochemical examinations revealing the direct relationship between BBB breakdown and the glial responses. The results provide important insights into the pathogenesis underlying mTBI and indicate that even mild BSW exposure affects the whole brain.
Transparency, Rigor, and Reproducibility Statement
Pre-registration was not performed because it was not possible to do so in a meaningful way in the context of this exploratory pathophysiological study. In total, 124 mice were purchased from the breeder and assigned to sham- and BSW-treated groups based on experimenter's choice. Of those, 37 were sham-treated, one died during anesthesia, and complete data were obtained for 30; 87 were BSW-treated, one died during anesthesia, two died 3 days after BSW exposure, and complete data were obtained for 61. Samples with any defect in dye injection, perfusion, and tissue processing were excluded from the succeeding analysis. Actual numbers of the mice used for the experiment are demonstrated as dots in the presented figures. BSW exposure was conducted between 1000 and 1200 in a fed state. An experimental batch consisted of 1–2 sham- and 3–5 BSW-treated mice. Handling of histological samples was performed by team members blinded to trauma status. Analyses of experimental samples were performed by K.N. who was aware of relevant characteristics of the mice. Images and region of interest settings were reviewed and corrected by blinded team members. The homemade shock tube equipment is unique to our facility. Other analytical reagents are commercially available. The data and analytic code used for image quantitation are available upon request from the corresponding author. Additionally, a limited number of histological samples from each of the experimental groups are available for future analyses on request. The authors agree to provide the full content of the manuscript upon request by contacting the corresponding author.
Footnotes
Acknowledgments
We extensively used Mayumi Watanabe's cryosectioning technique. We thank Shiho Fujita for her technical assistance and Dr. Takahiro Nakamura (of the Department of Mathematics) for his advice on statistical methods.
Authors' Contributions
The authors contributed as follows: Kiyomasa Nishii: conceptualization, methodology, investigation, formal analysis, data curation, writing—original draft; Yasushi Satoh: methodology, investigation, writing—review and editing; Takahito Higashi: investigation, data curation, writing—review and editing; Toshiyasu Matsui: investigation; Toshiaki Ishizuka: writing—review and editing; Masashi Kashitani: methodology; Daizoh Saitoh: conceptualization, writing— review and editing, project administration; Yasushi Kobayashi: conceptualization, writing—review and editing, supervision.
Funding Information
This work was supported by the budget for Advanced Research on Military Medicine from the Ministry of Defense, Japan.
Author Disclosure Statement
No competing financial interests exist.
Supplementary Material
Supplementary Figure S1
Supplementary Figure S2
Supplementary Figure S3
Supplementary Figure S4
Supplementary Figure S5
Supplementary Figure S6
References
Supplementary Material
Please find the following supplemental material available below.
For Open Access articles published under a Creative Commons License, all supplemental material carries the same license as the article it is associated with.
For non-Open Access articles published, all supplemental material carries a non-exclusive license, and permission requests for re-use of supplemental material or any part of supplemental material shall be sent directly to the copyright owner as specified in the copyright notice associated with the article.
