
Abstract
Traumatic brain injury (TBI) causes significant white matter injury, which has been characterized by various rodent and human clinical studies. The exact time course of imaging changes in a pediatric brain after TBI and its relation to biomarkers of injury and cellular function, however, is unknown. To study the changes in major white matter structures using a valid model of TBI that is comparable to a human pediatric brain in terms of size and anatomical features, we utilized a four-week-old pediatric porcine model of injury with controlled cortical impact (CCI). Using diffusion tensor imaging differential tractography, we show progressive anisotropy changes at major white matter tracts such as the corona radiata and inferior fronto-occipital fasciculus between day 1 and day 30 after injury. Moreover, correlational tractography shows a large part of bilateral corona radiata having positive correlation with the markers of cellular respiration. In contrast, bilateral corona radiata has a negative correlation with the plasma biomarkers of injury such as neurofilament light or glial fibrillary acidic protein. These are expected correlational findings given that higher integrity of white matter would be expected to correlate with lower injury biomarkers. We then studied the magnetic resonance spectroscopy findings and report decrease in a N-acetylaspartate/creatinine (NAA/Cr) ratio at the pericontusional cortex, subcortical white matter, corona radiata, thalamus, genu, and splenium of corpus callosum at 30 days indicating injury. There was also an increase in choline/creatinine ratio in these regions indicating rapid membrane turnover. Given the need for a pediatric TBI model that is comparable to human pediatric TBI, these data support the use of a pediatric pig model with CCI in future investigations of therapeutic agents. This model will allow future TBI researchers to rapidly translate our pre-clinical study findings into clinical trials for pediatric TBI.
Introduction
Traumatic brain injury (TBI) causes post-acute and chronic changes in white matter that are associated with cognitive dysfunction. 1,2 In the last 15 years, diffusion tensor imaging (DTI) has been touted as a sensitive method of detecting white matter injury with even subjects with mild TBI showing areas of injury given the sensitivity of this imaging modality. 3,4 Among subjects who have TBI, there is a reduction in fractional anisotropy and increase in mean diffusivity after TBI. 5 –7 In addition, fiber tractography of white matter has been described as a valuable tool to locate and specify the degree of damage. 8 –12
In addition to DTI, magnetic resonance spectroscopy (MRS) is sensitive to white matter injury. For example, even in normal appearing white matter of patients with multiple sclerosis compared with control subjects, there was a decreased N-acetylaspartate/creatinine (NAA/Cr) ratio. 13 The MRS can be used as a sensitive method of detection of injury in various other conditions that are inflammatory, neoplastic, or metabolic. 14 Reduction in key brain metabolites such as NAA has been demonstrated in TBI, which reflects neuronal injury. 15 –17 In addition, markers of oxidative stress (glutathione) and membrane turnover (choline [Cho]) are elevated in pericontusional regions. 18
In clinical TBI, NAA/Cr reduction and Cho/Cr increase have been demonstrated to indicate pathological changes, 19 and these changes predicted functional outcomes. 20 This reduction of NAA and elevation of Cho can be simplified to NAA/Cho ratio to also predict clinical outcomes. 21
Using these two imaging modalities, we aimed to identify the extent of white matter injury over a 30-day time course after controlled cortical impact (CCI) injury in a pediatric porcine model of TBI. We then compared the fiber tractography results to the biomarkers of injury such as neurofilament light (NFL) and glial fibrillary acidic protein (GFAP), which have been described recently as valid biomarkers reflecting the severity of TBI. 22,23 In addition, we compared fiber tractography results to pericontusional tissue levels of mitochondrial oxidative phosphorylation as a marker of biological function to validate the imaging findings with tissue biological parameters.
Methods
Surgical procedures
Twelve female pigs at four weeks of age, weighing 7–10 kg were used for this study. The experimenters were blinded to the analysis of these data, and each animal was identified by a numerical code that did not reveal the group assignment until the analysis was completed. As shown in Figure 1, there were five animals in the Sham group and seven animals in the TBI group. Both groups received identical preparation using intramuscular injection of ketamine (20 mg/kg) and xylazine (2 mg/kg). They were then intubated with 4% inhaled isoflurane for induction, then 2% isoflurane for maintenance. Pigs then received central venous catheter placement into cephalic veins, followed by tunneling between the animals' scapula to preserve their function for 30 days.
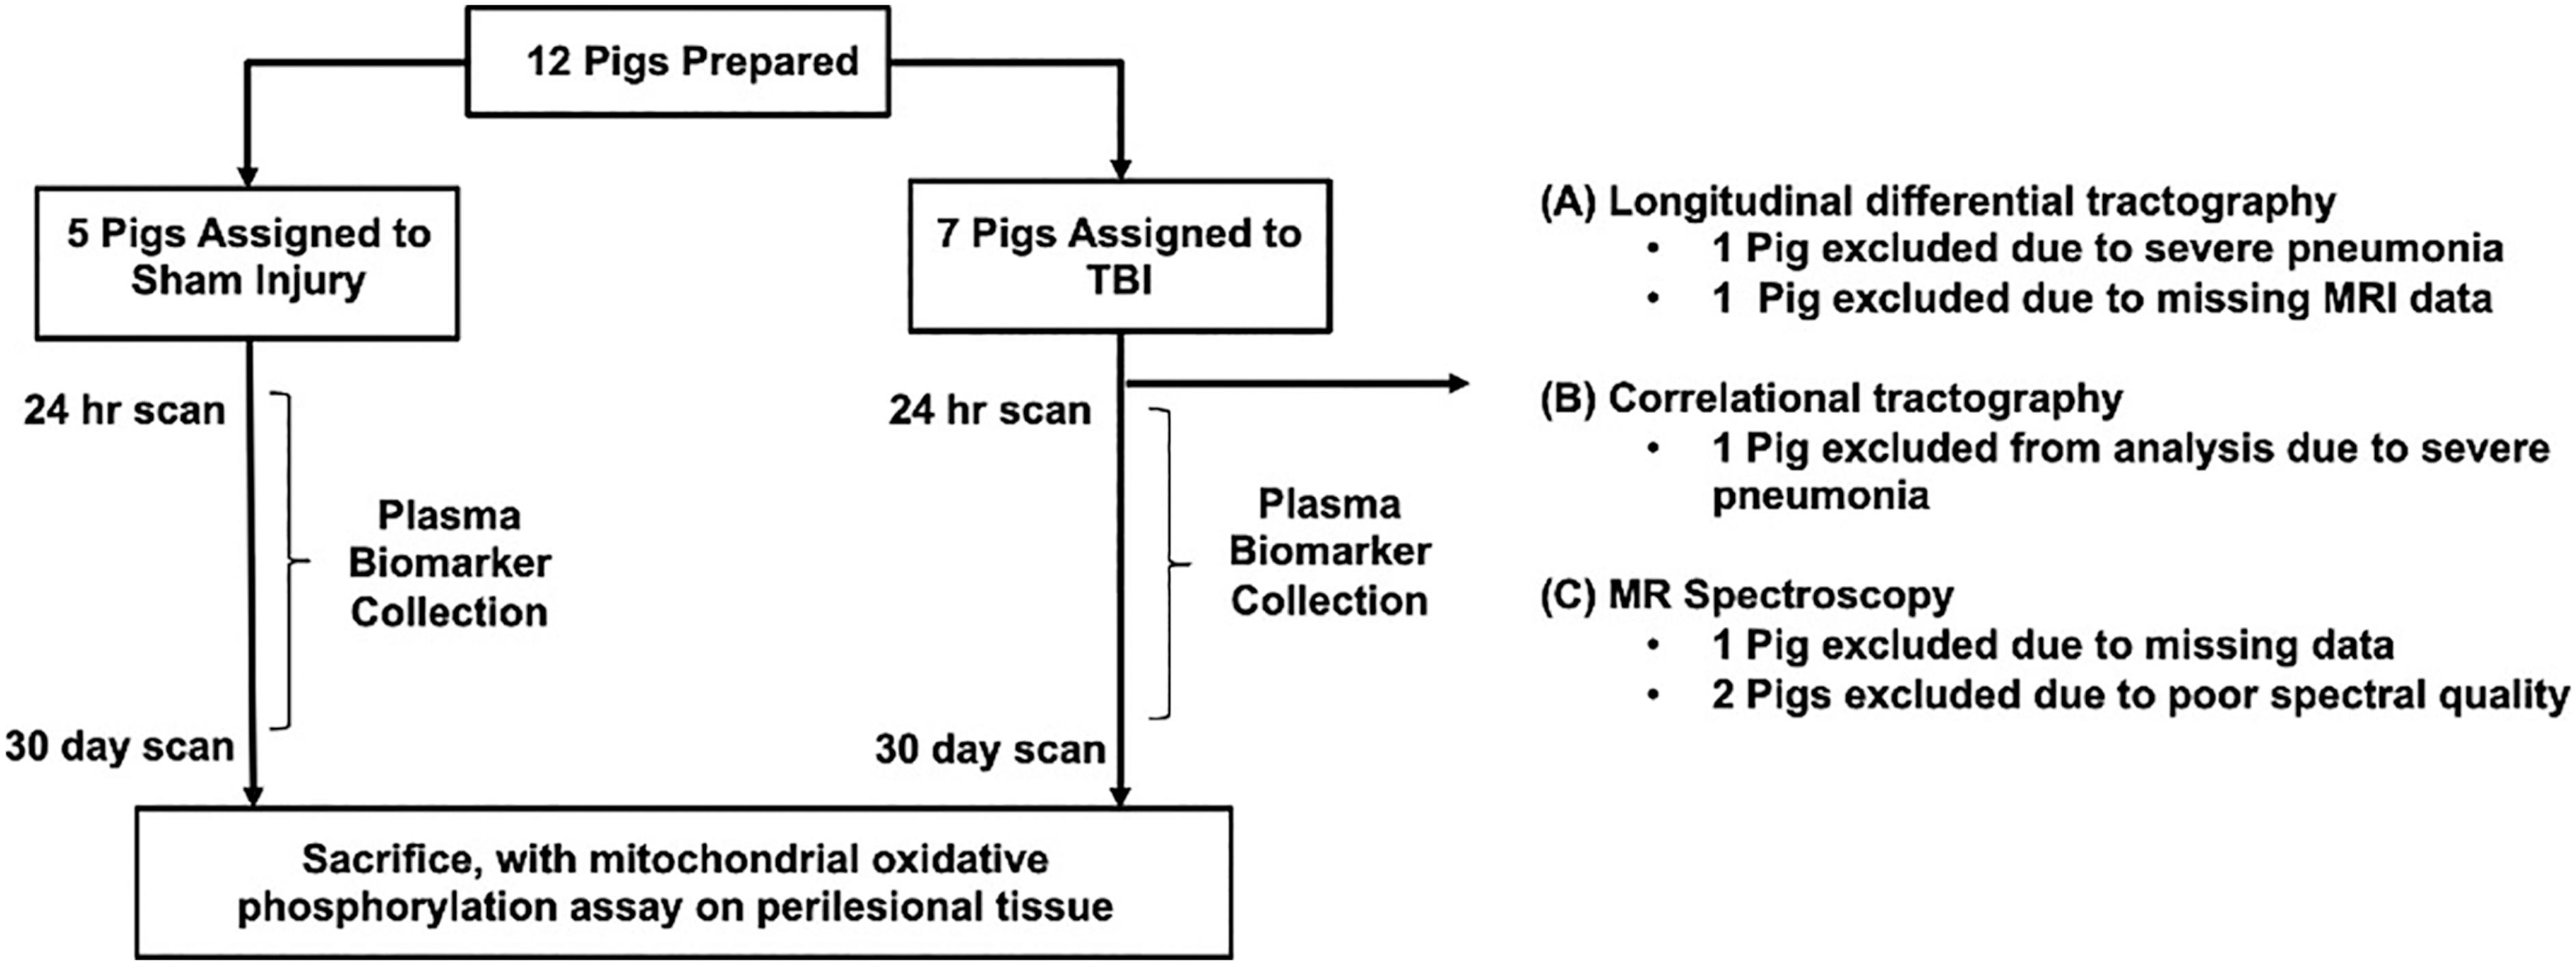
Schematic of the study. The Sham group and traumatic brain injury (TBI) group received the same dose of anesthesia and housing treatment. The study coordinators and researchers were blinded to the group assignments of each animal for the analysis. MR, magnetic resonance; MRI, magnetic resonance imaging.
Pigs assigned into TBI group had right frontoparietal craniotomy approximately 2.5–3 cm in diameter. Then, CCI at 0.7 cm depth over the rostral gyrus was delivered using a 1 cm diameter indentor tip as described previously. 24 This was considered a moderate severity injury for pigs. Pigs that were randomized into the Sham group had skin incision only without craniotomy. After the injury, pigs were monitored for 24 h to ensure normal recovery before transferring them to normal housing.
Plasma based biomarkers
Blood samples were collected at one day, five days, and 30 days from the time of injury before sacrifice. After collection, blood samples were immediately centrifuged at 4400 × g for 5 min. Plasma aliquots were stored at -80°C until analysis using single molecule array (Simoa). Using a custom-made Simoa 2-plex assay for GFAP and NFL developed by Quanterix Corporation, plasma samples were analyzed on an HD-1 Analyzer.
Tissue extraction and preparation (isolated cortical mitochondria)
On completion of the protocol described above, animals were euthanized with intracardiac injection of pentobarbital (150 mg/kg) before brain tissue collection. Brain tissue then immediately underwent rapid but gentle dissection (pericontusional cortical tissue) to specifically obtain isolated mitochondria and was then transferred into ice-cold isolation buffer solution (320 mM sucrose, 2 mM ethylene glycol tetraacetic acid [EGTA], 10 mM Trizma base, pH 7.4). Brain tissue was then transferred into ice-cold 1X brain buffer (made from 0.5 L of 2X buffer: 225 mM D-mannitol, 75 mM sucrose, 5 mM HEPES, 1 mM EGTA, and 0.5 L of double deionized water, pH 7.4), manually homogenized in 0.2% BSA buffer (catalog A6003), and centrifuged at 1300 g and 4°C to separate the fatty pellet from supernatant.
Consequently, the supernatant was centrifuged for 10 min at 21,000 × g to extract pellet. Brain mitochondria were isolated from the derived pellet by differential centrifugation and application of density gradients using 15%, 23%, and 40% Percoll (GE Healthcare cat. no. 17089101). Protein count for isolated mitochondria was obtained with a Pierce BCA Protein Assay kit (catalog 23227) from Thermo Fisher Scientific (Waltham, MA).
Measurement of mitochondrial respiration in isolated brain mitochondria
Mitochondrial respiratory function was analyzed using Oroboros O2k-FluoRespirometers (Oroboros Instruments, Innsbruck, Austria). The substrate–uncoupler–inhibitor titration (SUIT) protocol measures oxidative phosphorylation capacity with electron flow through both Complex I and the convergent electron input of Complex I and II (CI and CII, respectively) using the nicotinamide adenine dinucleotide-linked substrates malate, pyruvate and glutamate as well as the flavin adenine dinucleotide-linked substrate succinate, both in the presence of adenosine diphosphate. Oligomycin was used to assess leak respiration.
Maximal convergent non-phosphorylating respiration of CI and CII of the electron transport system (ETSCI+CII) is evaluated by titrating the protonophore, carbonyl cyanide p-(trifluoromethoxy) phenylhydrazone. The complex III (CIII) inhibitor antimycin A is added to measure the residual non-mitochondrial oxygen consumption, and this value was subtracted from each of the measured respiratory states to provide only mitochondrial respiration. Complex IV-linked respiration was measured by the addition of N,N,N,N-tetramethyl-phenylenediamine together with ascorbate. Further details such as chamber final concentration can be found in our previous works. 25,26 All data were acquired using DatLab 7 (Oroboros Instruments, Innsbruck, Austria), and respiration value was normalized to protein count for the brain.
Longitudinal differential tractography
The animals underwent diffusion imaging on a 3T Tim Trio whole body magnetic resonance imaging (MRI) scanner (Siemens, Germany) with 12-channel phased array head coil at 24 h and 30 days. This scanner and coil were used for all imaging sequences in the study, including MRS. At the time of the diffusion MRI, pigs were anesthetized in the same way as described for surgical procedures. Physiological monitoring including pulse oximetry and vital signs (oxygen saturation and heart rate) were recorded before and during the entire scanning period.
The following parameters were used for imaging: echo time (TE): 103 msec, repetition time (TR): 4200 msec, resolution: 2
To quantify the progression of white matter injury, we performed differential tractography as described previously. 28 To track pathways with decrease in anisotropy, criteria of greater than 20% change were set. Similarly, to track pathways with increase in anisotropy, greater than 20% criteria were also set.
Differential tractography with different values of change and length threshold have been tested and displayed on Supplementary Table S1. As described previously, 28 the optimal percentage change and length threshold can be estimated by testing the number of fiber tracks generated at various settings comparing decreased and increased anisotropic diffusion. Briefly, because pigs with TBI undergo progressive loss of white matter over time, differential fiber tracks generated for decreased QA setting would be considered true positive findings. Differential fiber tracks generated for increased QA setting, however, would be considered false positive findings. The ratio of the fiber tracks at these two settings (track number for decreased QA/track number for increased QA) would be the false discovery rate (FDR). Low FDR (less than 0.05) would be considered highly specific, and this table shows that percentage change and length values (20%, 40 mm) previously described in the original manuscript 28 also yielded very low FDR for our dataset (FDR <0.00001).
Correlational tractography
Correlational tractography was performed by the connectometry function in DSI Studio, as detailed previously. 29 We first reconstructed diffusion MRI data into PNI50 space 27 using q-space diffeomorphic reconstruction (QSDR), and spin distribution function (SDF) was calculated. 30 The SDFs of uninjured pigs from our laboratory database were averaged to create a common diffusion atlas. This atlas then provided the principal directions to sample each pig's SDFs for each voxel to create local connectome vectors. Each subject pig's local connectome vectors were compiled into a single local connectome matrix.
There were 11 pigs (n = 5 Sham, n = 6 TBI) that had data on NFL, GFAP, mitochondrial Complex I, Complexes I and II, Complex IV, and leak respiration data. As part of the quality control for correlational tractography, individual pig's QA map and the template's QA map were compared using automated function of DSI Studio to generate the mean Pearson correlation coefficient. This showed R2 value ranging from 0.64–0.73 indicating sufficient quality registration. Local connectome matrix was then positively and negatively correlated with these biological parameters.
The details of the mathematical basis of this algorithm have been outlined previously. 29 Briefly, pre-defined thresholds were automatically generated by using the Otsu threshold 31 before making positive or negative association analysis. Positive associations were analyzed by including local connectomes with coefficients greater than this pre-defined threshold. Negative associations were analyzed by including local connectomes with coefficients less than a pre-defined threshold. Then the fiber tracking algorithm connected these local connectomes into tracks for negative or positive associations. Associations were then statistically tested by a permutation test, where both permuted and non-permuted local connectome matrices are associated with the physiological parameter such as NFL. The FDR was then calculated as a ratio of track count between a non-permuted and permuted condition.
As shown in Supplementary Figure S1, when correlational tractography was performed for NFL levels, there is large discrepancy between the histogram of tracks that express negative association (non-permuted) compared with the null distribution (permuted), and FDR = 0.05 was set for fiber track generation. In contrast, there is only a small difference between tracks that express positive association (non-permuted) compared with the null distribution (permuted). Using the DTI data from 11 animals (5 Sham, 6 TBI), T score threshold of 2 was assigned and deterministic fiber tracking algorithm was used. 32 False connections were removed by topology-informed pruning by two iterations. Seeding number used for each permutation was 50,000. To estimate the FDR, 2000 randomized permutations were applied to the group label to obtain the null distribution of the tract length.
MRS Imaging (MRSI)
All MRSI sequences were obtained during the same sessions as diffusion MRI. 1 H MRSI from one animal with TBI was lost in data handling. Moreover, 1 H MRSI data were excluded from two other TBI cases because of poor spectral quality secondary to lipid contamination and/or incomplete suppression of water signal. The spectral quality was assessed by visual inspection, and Cramer Rao Lower Bound (CRLB) values as obtained from LC model software were also used to evaluate the spectral quality.
Single slice two-dimensional multi-voxel proton MR spectroscopic imaging ( 1 H MRSI) was performed using a spin echo (point resolved spectroscopy) sequence with water suppression by means of a chemical shift selective saturation (CHESS) pulse. The 1 H MRSI sequence was acquired twice to cover almost the entire supratentorial brain region. Sequence parameters included: TR/TE = 2500/30 msec, number of excitations = 16, field of view = 55 × 55 mm2, matrix size = 16 × 16, slice thickness = 9mm resulting in a voxel size of 3.4 × 3.4 × 9.0mm3, bandwidth = 1500 Hz, flip angle = 90°, and vector size = 1024.
The volumes of interest (VOIs) were selected to include regions of injury and multiple gray-matter and white-matter regions avoiding the scalp, skull base, or sinuses. Outer volume saturation slabs (30 mm thick) were placed outside the VOIs to suppress lipid signals from the scalp. The data sets were acquired using elliptical k-space sampling with weighted phase encoding to reduce the acquisition time. Manual shimming was performed to achieve an optimal full width half maximum of <20 Hz (magnitude spectrum) of the water signal. Water unsuppressed 1 H MRSI spectra were also acquired to use the water signal for correcting eddy current induced distortions.
The 1 H MRSI data were analyzed using a user-independent spectral fit program (Linear Combination [LC] Model) 33,34 from animals (n = 9) scanned at day 30. The region between 0.2 and 4.0 ppm of the spectrum were analyzed, and the following metabolites were evaluated: NAA, Cr, Cho, myo-inositol (Ins), Glx (glutamate + glutamine), lipid + lactate (Lip+Lac). The error in the spectral fitting routine (LC Model) were used to assess the spectral quality for a particular voxel; metabolite concentrations from only those voxels were used that had the value of Cramer-Rao lower bounds/standard deviations (SD) less than 20%.
The metabolite ratios (NAA/Cr; Cho/Cr; Glx/Cr, and Lip+Lac/Cr) were computed from multiple gray-matter and white-matter regions covering right and left cerebral hemispheres independently and together. The number of voxels (n) encompassing these regions were cortical regions (n = 8–12); subcortical white-matter regions (n = 8–12); thalamus (n = 3–4); basal ganglia (n = 4); internal capsule (n = 8); genu of corpus callosum (n = 2); and selenium of corpus callosum (n = 2). These voxels' metabolite levels were averaged for each animal, and Sham animals were compared with TBI animals for ipsilateral and contralateral sides.
Statistical analysis
Once differential tracks were generated, the fiber track volume estimations were collected from DSI Studio. These volumes from corona radiata, fornix, and inferior fronto-occipital fasciculus were compared between ipsilateral and contralateral sides using the Mann-Whitney
Results
Differential tractography was generated for animals with TBI at one day (24 h) and 30 days after injury (Fig. 2a). These fiber tracks depict the region of decreased QA values. Although there was significant variability in the regions of decreased QA, several regions showed consistent reduction in anisotropy such as bilateral corona radiata, fornix, and inferior fronto-occipital fasciculus. In comparison, Sham animals showed no major changes in QA (Supplementary Fig. S2). Several majorly affected white-matter tracks, shown by two different views for Pig 5, are displayed in Figure 2b. There was no statistical significance between the decreased volumes of ipsilateral and contralateral fiber tracks (Fig. 2c).
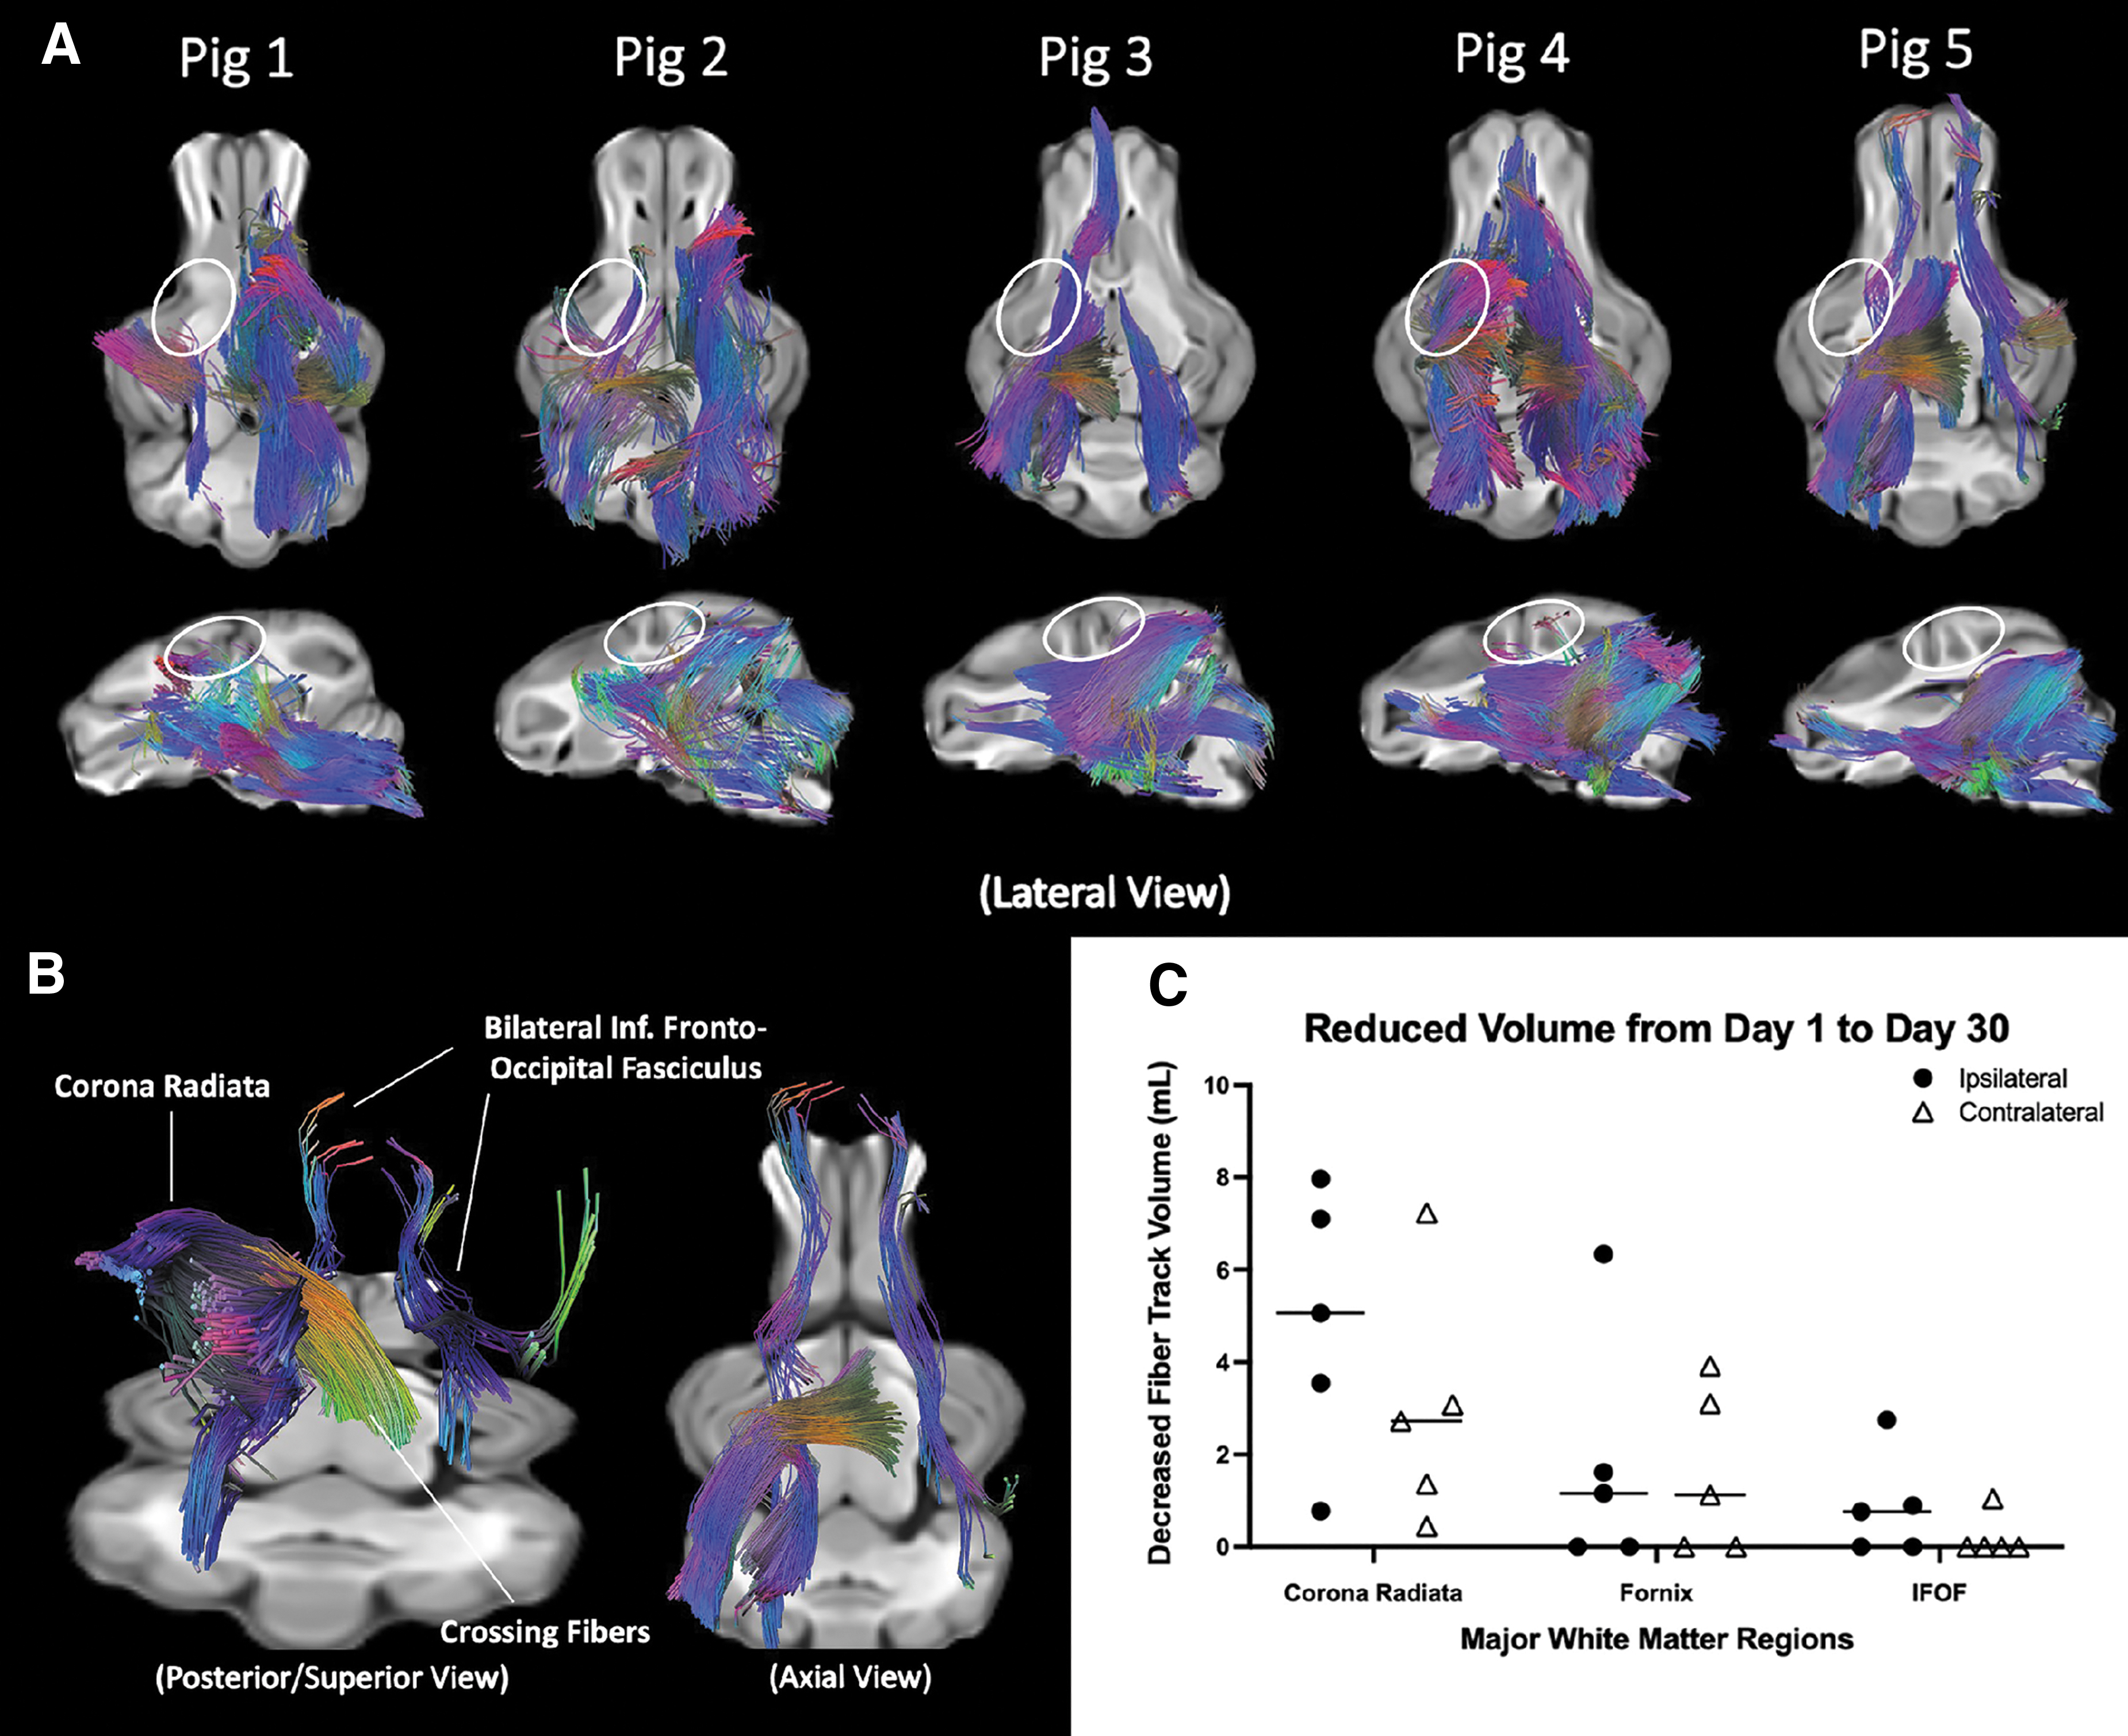
Longitudinal tractography of five pigs with traumatic brain injury over 30 days. White matter fiber tractography that showed decreased anisotropy over 30 days are displayed in (
Using correlational tractography analysis as described previously, 35,36 we studied the correlation between white-matter tractography and biological markers of either injury or physiological function. Because there were only six pigs in the TBI group, five pigs from the Sham group were also included to study correlational tractography with biological parameters for further robustness of data. Mitochondrial function showed no differences between Sham and TBI groups for Complex I (p = 0.082), Complex I and II combined (p = 0.177), Complex IV (p = 0.930) oxygen consumption, as well as leak respiration (p = 0.537) from pericontusional tissue as demonstrated in Figure 3a. Positive correlation was found between a small number of fiber tracks in the contralateral inferior fronto-occipital fasciculus (Fig. 3b) and plasma NFL levels as well as GFAP levels at day 30.
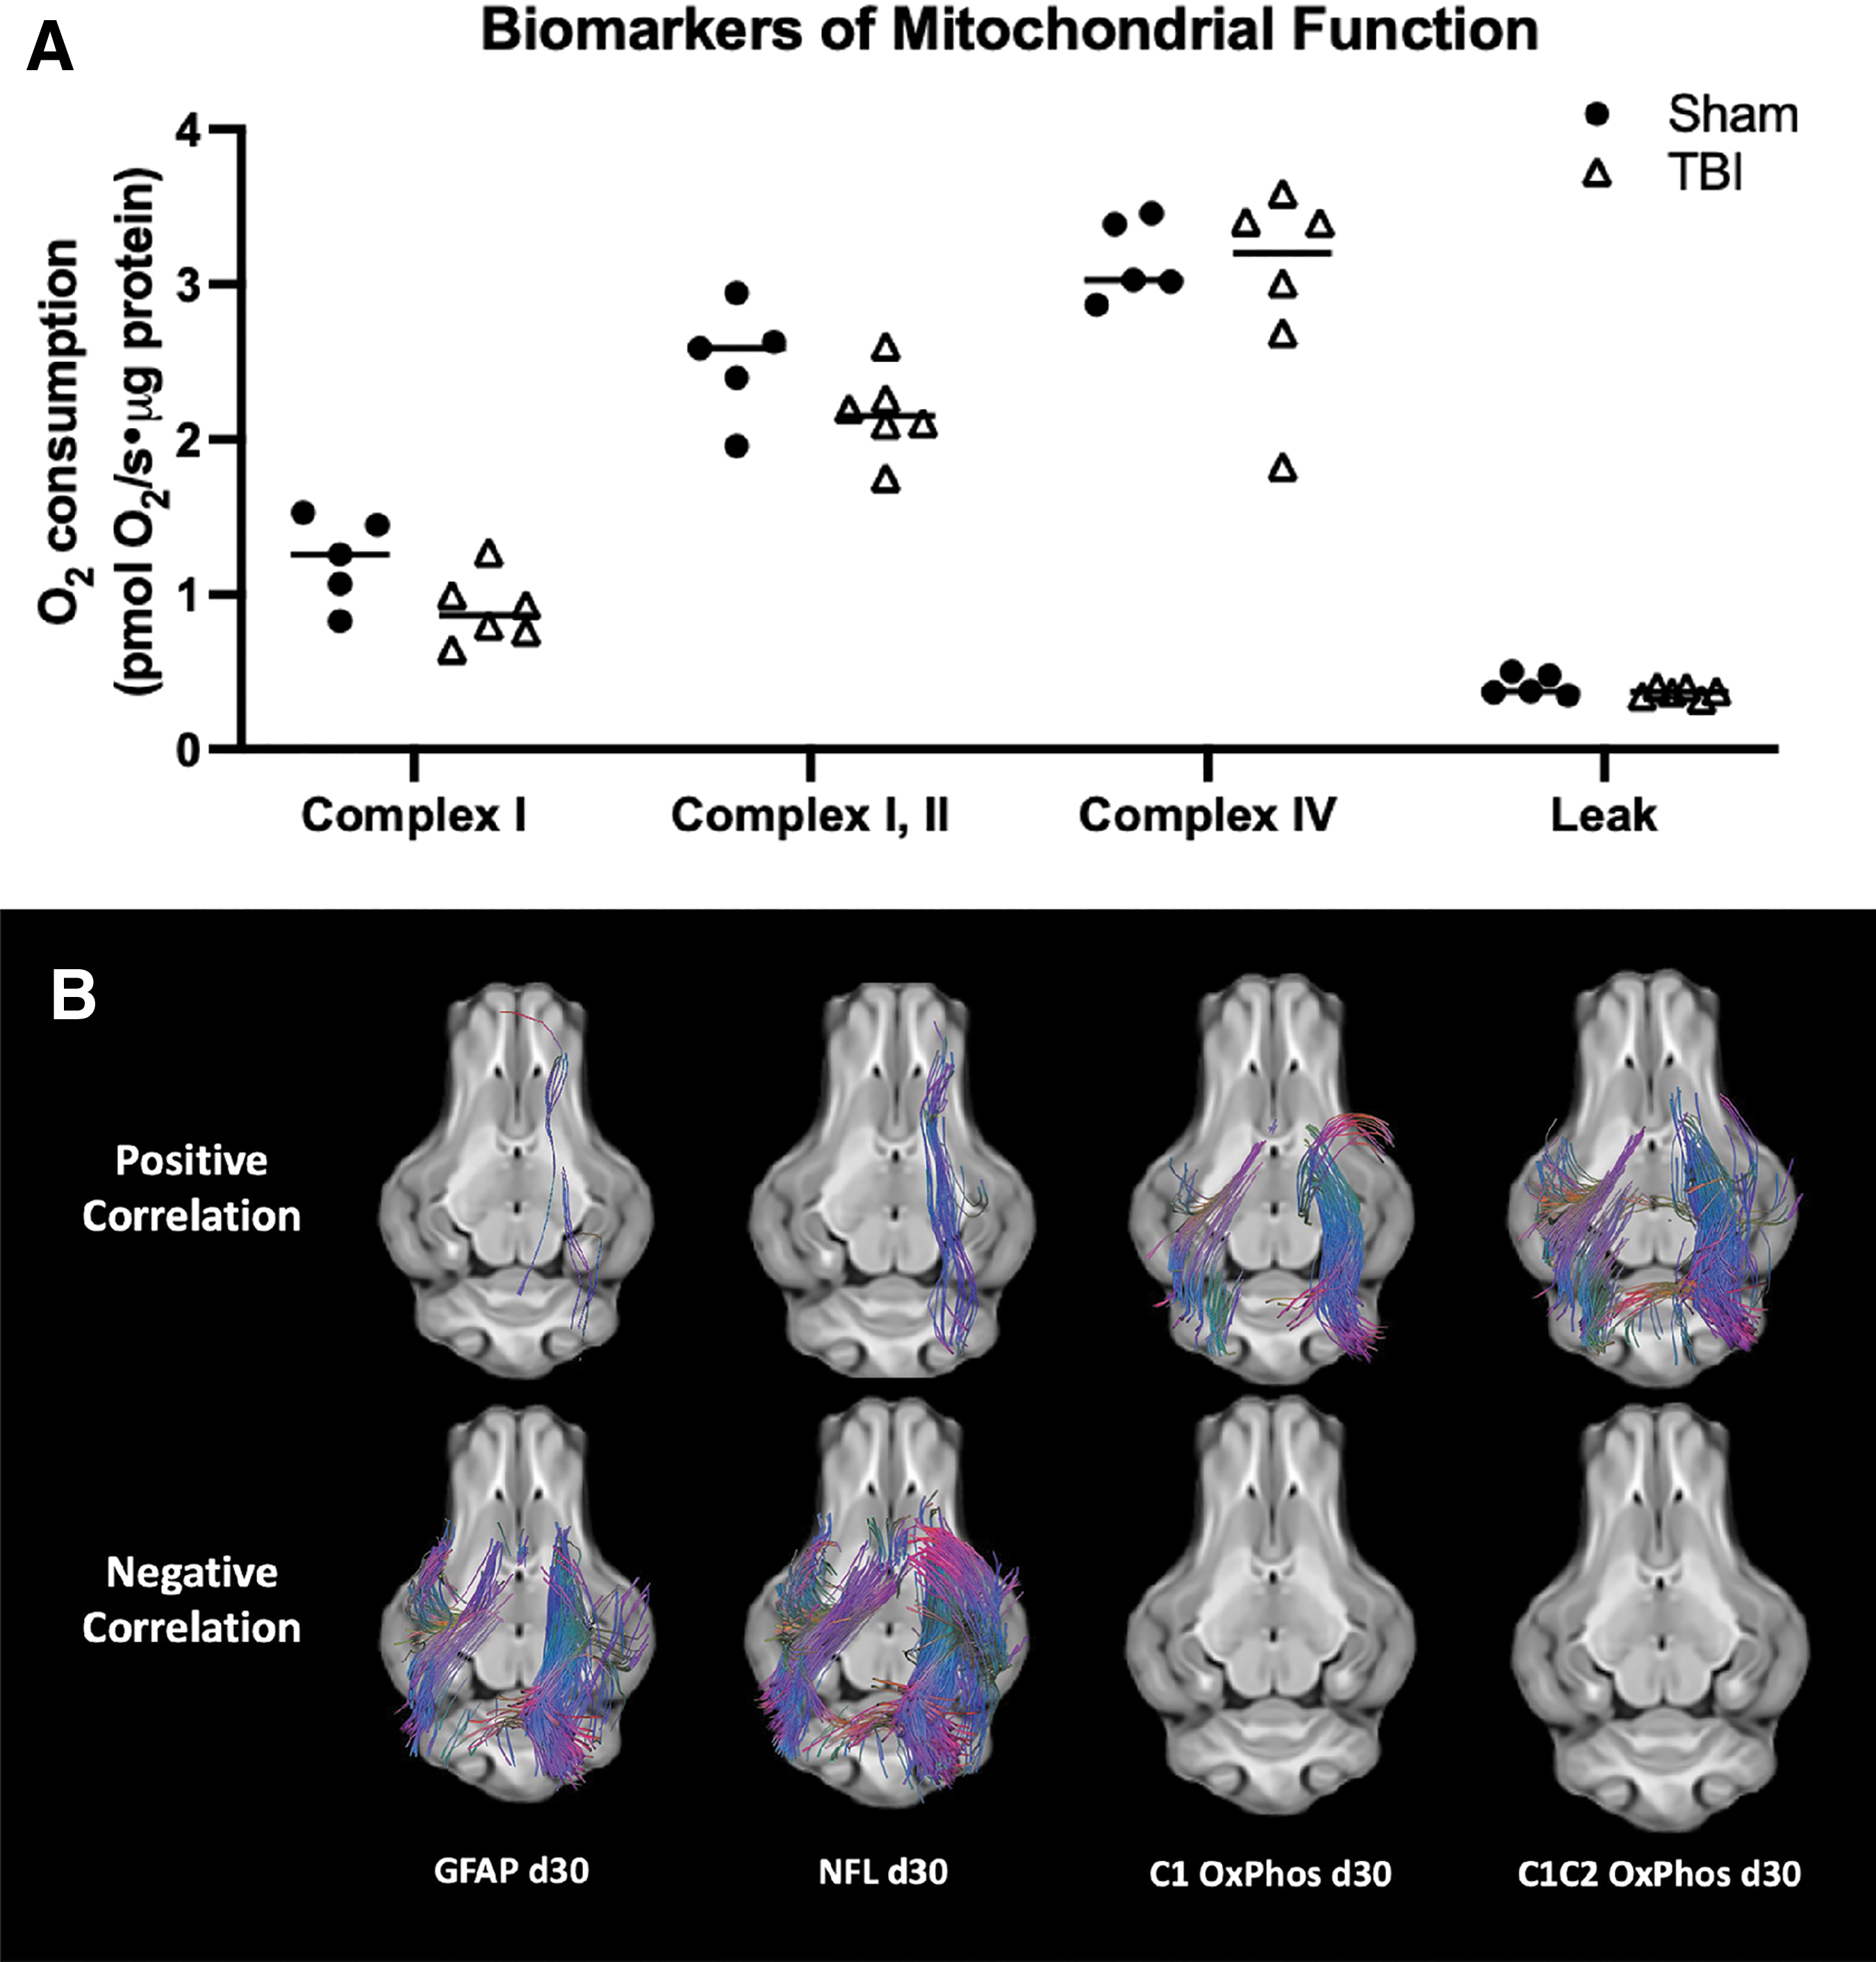
Correlational tractography to biological parameters. Mitochondrial respiration is displayed (
The majority of the fibers in the white-matter tracks, however, had negative correlation with the plasma NFL and GFAP levels at day 30. These tracts included both ipsilateral and contralateral corona radiata as well as cerebellar fibers. A majority of the bilateral corona radiata tracks showed positive correlation with Complex I and Complex I and II combined oxidative phosphorylation. Correlational tractography showed no positive or negative correlation with tracks at day 1 and day 5. The time course of plasma biomarker levels over the 30-day time course has been reported previously 37 ; thus, is not reported in this article.
Then, single voxel MRS was performed in six regions: pericontusional cortex, thalamus, subcortical white matter, corona radiata, genu of corpus callosum and splenium (Fig. 4). The NAA level was normalized by Cr, and NAA/Cr is reported in Figure 5 to demonstrate the degree of injury. Normalized Cho level: Cho/Cr is also reported in Figure 5 to demonstrate the degree of membrane damage in these regions. Throughout predominantly white-matter regions such as corona radiata and corpus callosum, NAA/Cr decrease and Cho/Cr elevation is seen consistent with injury.
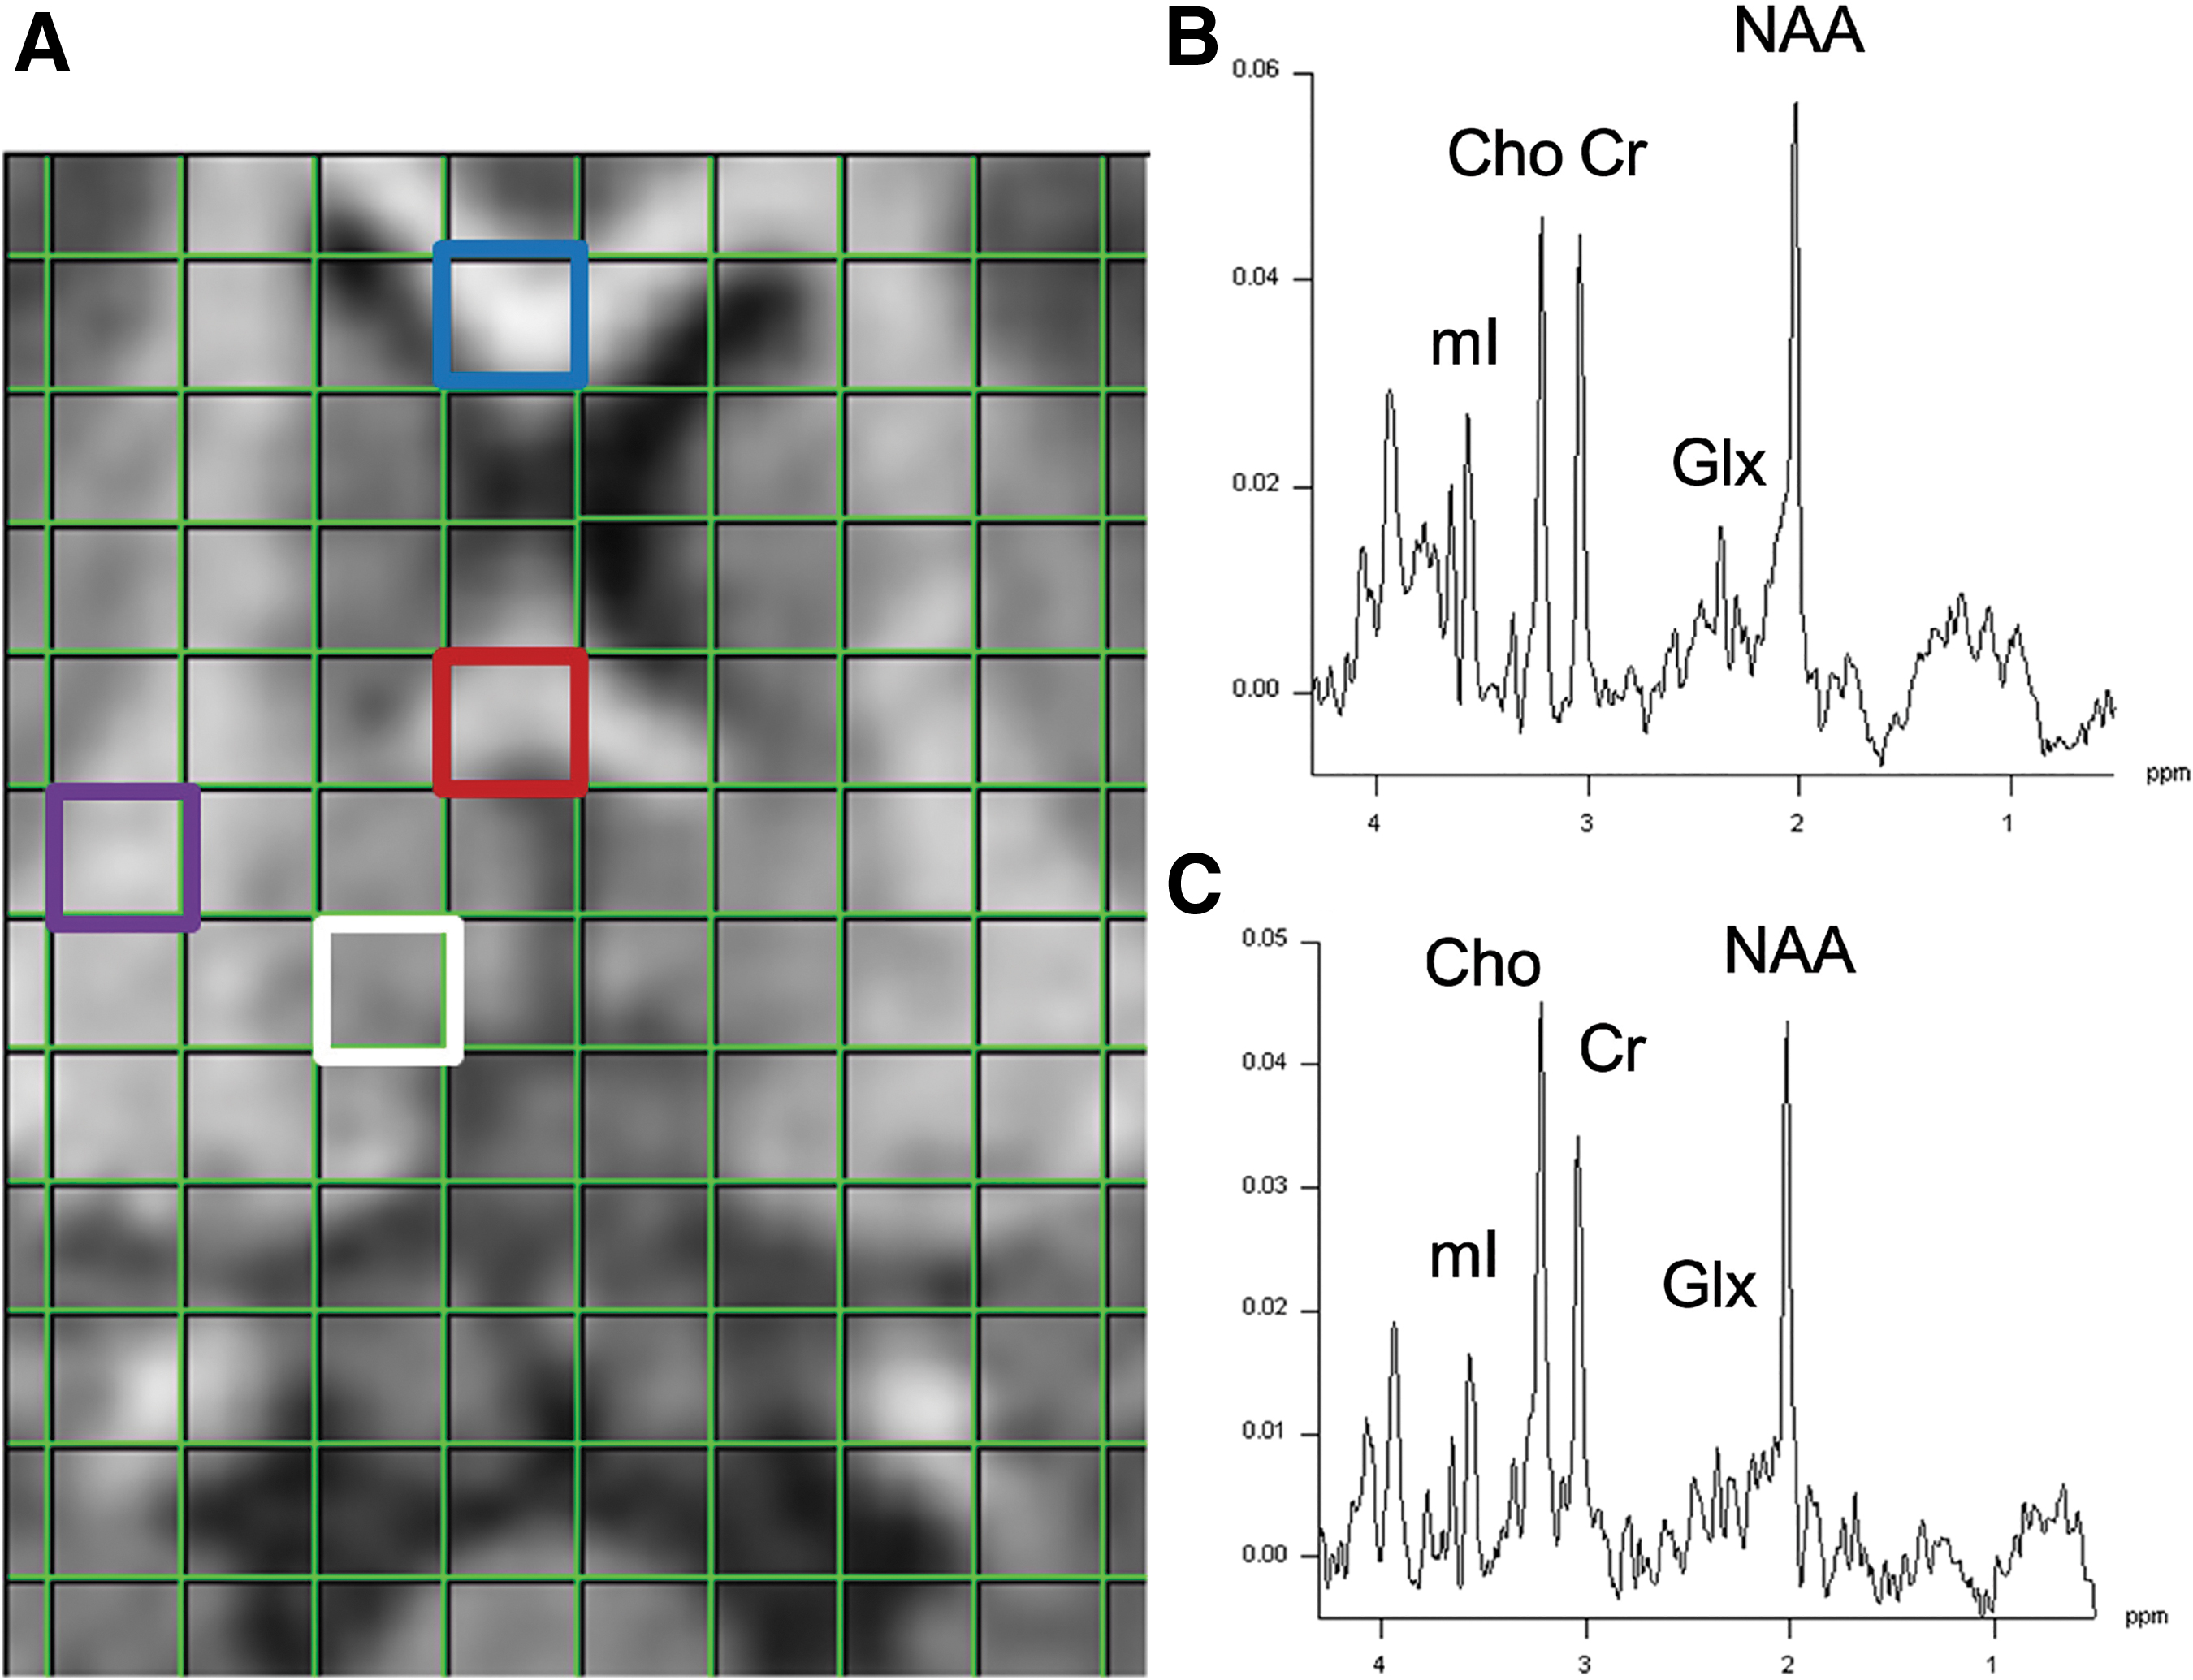
Example voxels for magnetic resonance spectroscopy (
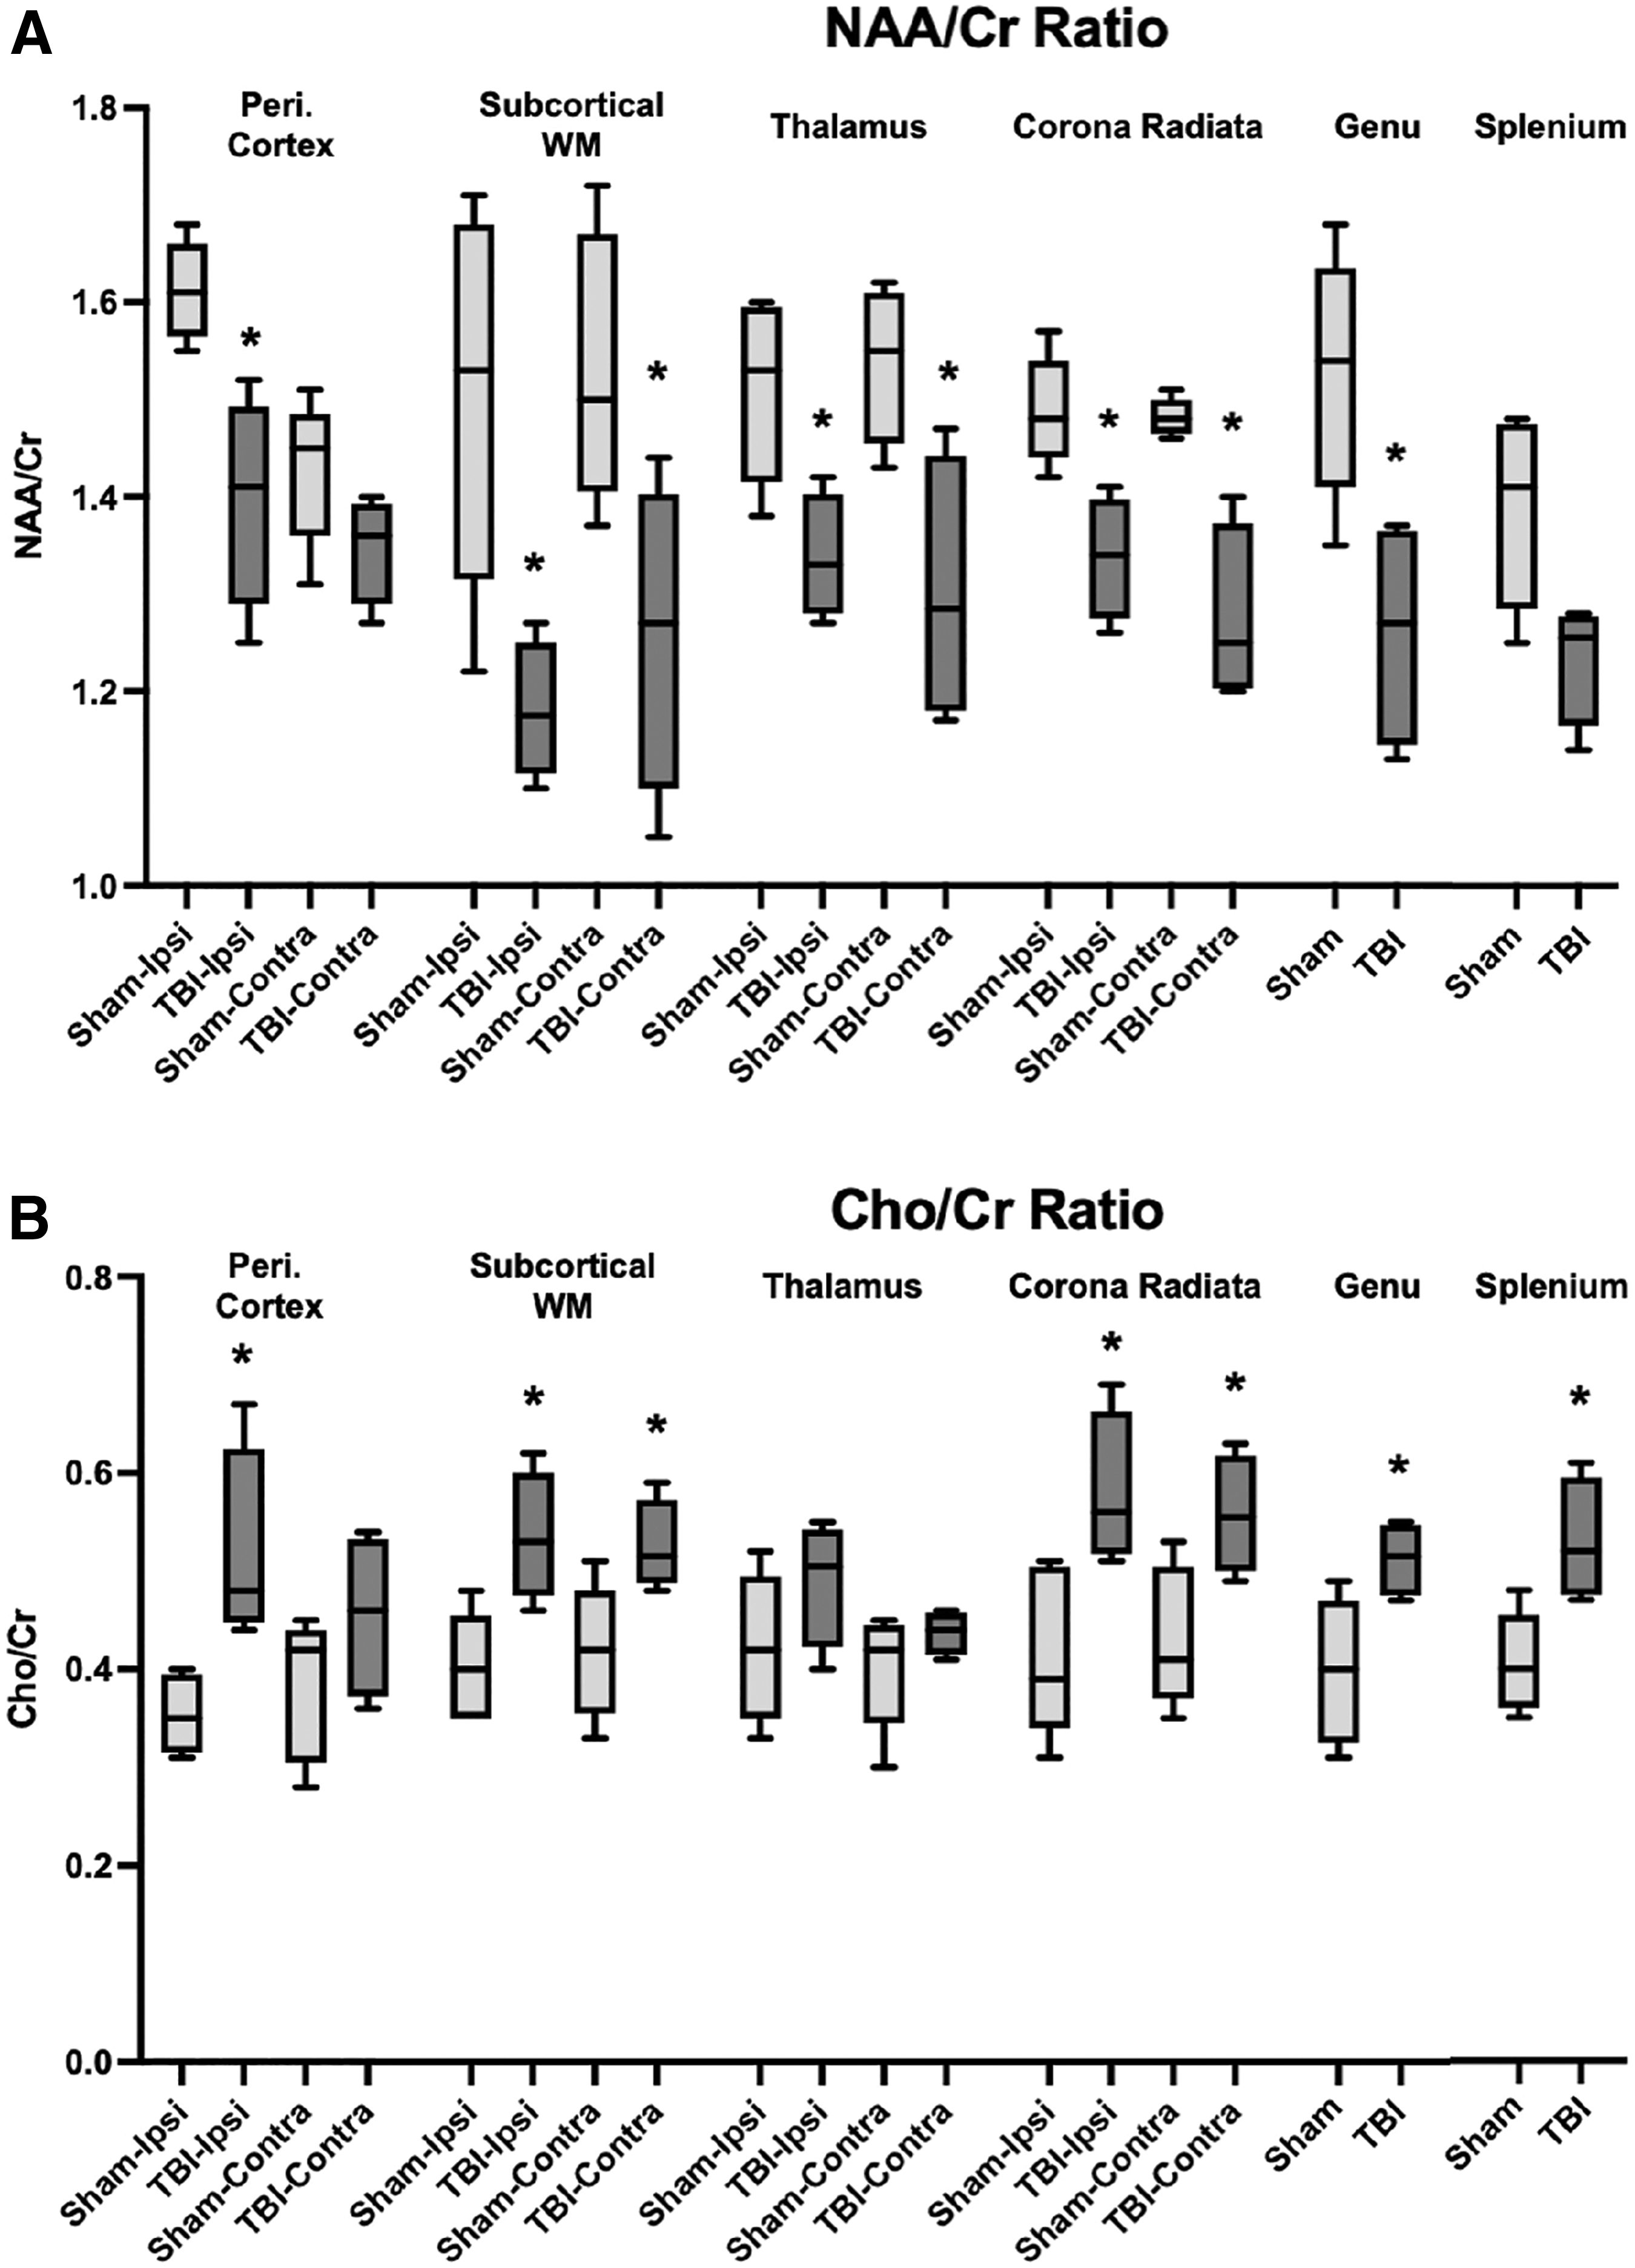
Magnetic resonance spectroscopy of multiple brain regions at day 30 after injury. NAA/Cr Ratio
For NAA/Cr, comparison of Sham and TBI groups showed significant differences in the following regions: ipsilateral subcortical white matter (p = 0.032), ipsilateral thalamus (p = 0.032), ipsilateral corona radiata (p = 0.016), genu of corpus callosum (p = 0.040), contralateral subcortical white matter (p = 0.040), contralateral thalamus (p = 0.032), contralateral corona radiata (p = 0.016). For Cho/Cr, comparison of Sham and TBI groups showed significant differences in the following regions: ipsilateral subcortical white matter (p = 0.032), ipsilateral corona radiata (p = 0.024), genu of corpus callosum (p = 0.040), splenium of corpus callosum (p = 0.032), contralateral subcortical white matter (p = 0.040), contralateral corona radiata (p = 0.040).
In addition, areas of gray matter also showed the same findings in NAA/Cr: ipsilateral pericontusional cortex (p = 0.016), and Cho/Cr ratios: ipsilateral pericontusional cortex (p = 0.016). Basal ganglia did not show significant difference between the Sham and TBI groups; thus, it was not displayed in Figure 5.
Discussion
The results of this study demonstrated that white-matter imaging in a pediatric porcine model of TBI shows changes that are consistent with human studies. Both by structural (DTI) imaging and metabolic (MRS) imaging, prominent injury in the white matter has been observed at a post-acute period of 30 days. To further validate the findings of white-matter imaging, we correlated DTI tractography findings with biological parameters of injury and tissue function such as NFL and mitochondrial complex activity, respectively. Given the gray-white matter ratio and the gyrencephalic brain structure that makes this model much more comparable to human injury than a rodent model, these imaging findings support the validity of using a porcine model of TBI.
Differential tractography between day 1 and day 30 was performed, as described previously.
28
This technique has been described as a method to capture neuronal injury shown by a decrease in anisotropic diffusion of the same individual over two time points. Instead of comparing the mean fractional anisotropy of each region, baseline and follow-up scans of each subject were aligned and the differences in anisotropy of each fiber orientation were computed. There was good reliability with low FDR as shown in
Although corpus callosum was described previously commonly to be an area with reduced anisotropy and prominent white-matter injury, 7,41,42 differential tractography results did not find any corpus callosum tracks to have significantly reduced anisotropy over the 30 days. This may be attributable to the difference in technique compared with Yeh and colleagues. 28 Because our protocol utilized only three b-values with a total of 64 diffusion sampling directions compared with the previous study with 22 b-values with 257 diffusion sampling directions, 28 one possibility is the sensitivity of the diffusion imaging to corpus callosum fibers. Additional consideration is that the corpus callosum may be profoundly injured even at one day after injury such that repeat imaging at 30 days shows no difference in anisotropy change.
Differential tractography of fiber tracks near the site of impact would be important to study the pathophysiology of progressive white-matter damage between day 1 and day 30. These lesioned areas were included in the differential tractography analysis, but no major tracks were detected around the site of impact. One possibility is that there is profound white-matter damage in the pericontusional area already at day 1, and that by day 30, no additional white-matter damage could be found. Another possibility is that the combination of early edema and post-acute white-matter degeneration yielded reduced QA at both time points leading to no significant difference in fiber tracks over time. Although our previous work showed significant pericontusional white-matter injury using amyloid precursor protein labeling at 30 days after TBI in pigs, 37 we did not compare this result to histology at one day after TBI to confirm this point given that animals had to survive until 30 days post-injury for this study.
Aside from white-matter injury, mitochondrial complex activity was assessed in Sham and TBI pigs. Because mitochondrial dysfunction is a well characterized phenomenon after TBI, this was used as another parameter to assess the severity of injury. 43 –45 Because TBI leads to mitochondrial permeability transition pore activation, disruption of metabolic support for the cells, and apoptotic cascades, mitochondrial pathology is at the core of TBI pathophysiology. Specifically, it was shown that there is reduced Complex I and II function after TBI. 46 Thus, mitochondrial bioenergetic failure is considered a major contributor to cell death after TBI.
In our current data, there were no statistically significant differences but only a trend for reduction in Complex I as well as Complex I and II function in TBI animals compared with Sham animals. Correlational tractography, however, detected positive correlation in major fiber tracks (Fig. 3) when mitochondrial complex function was used as variables. In other words, higher white-matter integrity was correlated with higher mitochondrial function, lower white-matter integrity was correlated with lower mitochondrial function in pericontusional areas. This is consistent with expected mitochondrial function for varying degrees of injury severity.
As discussed previously in our recent review, 47 TBI leads to accumulation of mitochondria at specific points along the axon, mitochondrial swelling, and excessive fission. Thus, mitochondrial dysfunction may underlie axonal injury after TBI, and the correlation of these parameters is consistent with our understanding of TBI pathophysiology.
We also explored and validated the fiber tractography findings with biological parameters as described previously. 35 The findings here were consistent with the expected changes: major white-matter tracks had positive correlation with mitochondrial complex activity. This meant that higher preservation of white-matter tracts correlated with the higher physiological activity whereas lower white-matter tract integrity correlated with lower physiological activity.
Negative correlation, however, was found with biomarkers of injury compared with the white-matter tract anisotropy. In other words, lower anisotropy or higher degree of white-matter injury correlated with higher levels of NFL and GFAP. We utilized both biomarkers of injury (NFL and GFAP) as well as the parameters of physiological function (Complex I, Complex I and II oxidative phosphorylation). The data for plasma NFL and GFAP over 30 days have been reported previously by our group. 37
In addition, we have also analyzed correlational tractography for day 1 and day 5 NFL and GFAP levels with no significant white-matter tracts showing positive or negative correlation. Despite the highest elevation of NFL levels for injured animals at day 5, the large variability of the data may have contributed to the lack of significant correlation with NFL levels at that time point. As the variability of NFL reduced toward day 30, however, robust negative correlation was found when compared with major white-matter fiber tracts.
In recent clinical TBI studies, the delayed elevation of NFL has been reported. 22,48 Specifically, the peak elevation occurs between six to 13 days, 48 but it can remain elevated for several years after injury. 22 Because NFL is a structural component of axons and white matter, its delayed release into the plasma and continued elevation in its levels are consistent with ongoing white-matter injury chronically. This is consistent with the delayed loss in white-matter fiber tracks that we have identified in our differential tractography analysis (Fig. 2). Given this continued injury in the post-acute period, there is a therapeutic window for white matter that we can explore with various interventions targeting mechanisms of delayed injury in future studies.
Proton MRS ( 1 H-MRS) allows non-invasive and quantitative assessment of the brain metabolic landscape. Because TBI impacts cerebral metabolism, several previous studies have used 1 H-MRS to identify metabolite changes in regions of injury, to define the extent of pathology, and as a biomarker to evaluate treatment outcomes. 33,49,50 Recently, our group reported the clinical utility of 1 H-MRS in evaluating neuroprotective effects of cyclosporine in a porcine model of TBI. 51 In the present study, we also investigated the potential of multi-voxel 1 H-MRS in assessing the degree of tissue damage in a pediatric porcine model of TBI.
Significant decreases in NAA/Cr ratios are noted throughout various white-matter tracks, thalamus, and pericontusional cortex in animals with TBI compared with those of Sham animals. There are also similar elevations of choline/Cr levels that signify high membrane turnover consistent with injury. Previous studies have also shown that after TBI, there is a decrease in NAA levels, 52 –54 signifying neuroaxonal injury. This NAA reduction has also been found to relate to injury severity. 52,53 The NAA/Cr reduction was also previously noted to be persistent, because in severe TBI, there are prolonged decreases. 54 The current data show consistent decrease of NAA/Cr at both acute and post-acute time points, validating this model of TBI as clinically relevant.
Limitations
In addition to the lack of significant changes in corpus callosum, the degree of other major fiber track loss over the 30-day period may be underestimated in our current study. As briefly described in discussion, our diffusion imaging method uses limited diffusion directions and b-values, and higher parameters will allow higher resolution of various fiber tracks that have high angle turns as well as crossing fibers. In addition, significant degree of injury at both sides (possibly because of coup/contra-coup injury) and large variability of white-matter injury is notable in our data.
While it is evident that both ipsilateral and contralateral sides have significant reduction in QA for corona radiata, fornix, and inferior fronto-occipital fasciculus, there is a wide range of volume reduction within each group. This is likely a major reason for the lack of statistically significant difference between the ipsilateral and contralateral sides for these major tracks. Larger group sizes would be necessary in the future to address this variability.
The limitation in our differential tractography method is that only changes between two different time points after injury were analyzed. Only the progression of white-matter loss between day 1 and day 30 was studied, and the effects of initial injury were not assessed. This can be overcome in future analysis by performing a pre-injury scan, then doing acute time point and post-acute time point follow-up scans to further delineate the progression of white-matter injury at various time points.
In addition, there are multiple contributors to the changes in diffusion imaging during the acute to post-acute window after TBI. Aside from degeneration of white-matter pathways, hematoma or edema near white matter can alter the diffusion data. As edema and hematoma resolve over time, diffusion parameters such as QA may appear more significant. In addition, other biological processes, such as re-myelination of initially injured pathways, can occur alongside other degenerating fibers, and the general direction of these changes may be difficult to assess. Given these limitations, a larger scale study with multiple time points for imaging and histological analysis of white matter that parallels imaging time points are important considerations in the future.
Conclusion
In the current study, we analyzed the changes in imaging parameters of white matter over 30 days after TBI. The process of Wallerian degeneration of axons after injury is classically described in TBI, but this is a first time that a progression of white-matter injury is characterized in a pediatric porcine model. There is progressive reduction in anisotropy in major white-matter tracks over this post-acute period. White-matter region's anisotropy was positively correlated with biomarkers of mitochondrial activity and negatively correlated with plasma biomarkers of injury. Moreover, major white-matter regions had decreased NAA/Cr and increased Cho/Cr, which were spectroscopic markers of injury and membrane turnover, respectively. Given the imaging findings that are consistent with what is known in human TBI, the current data support the usage of a pediatric porcine model of TBI in future studies that focus on therapeutic interventions for TBI.
Footnotes
Acknowledgments
We acknowledge the technical support provided by Thomas Hallowell and Sara Morton for animal surgery, and tissue dissection and handling provided by Jonathan Starr. We would also like to thank Human Immunology Core at the University of Pennsylvania for their help in development and processing of single molecule array for NFL and GFAP.
Authors' Contributions
Samuel S. Shin: Investigation, Formal Analysis, Writing – Original draft preparation; Sanjeev Chawla: Investigation, Formal Analysis, Methodology, Writing – Original draft preparation; David H. Jang: Formal Analysis, Writing – Revision; Vanessa M. Mazandi: Formal Analysis, Writing – Revision; Katie Weeks: Investigation, Writing – Revision; Todd J. Kilbaugh: Conceptualization, Funding acquisition, Project Administration.
Funding Information
This study was supported by Resuscitation Science Center institutional discretionary funds at the Children's Hospital of Philadelphia.
Author Disclosure Statement
No competing financial interests exist.
Supplementary Material
Supplementary Table S1
Supplementary Figure S1
Supplementary Figure S2
References
Supplementary Material
Please find the following supplemental material available below.
For Open Access articles published under a Creative Commons License, all supplemental material carries the same license as the article it is associated with.
For non-Open Access articles published, all supplemental material carries a non-exclusive license, and permission requests for re-use of supplemental material or any part of supplemental material shall be sent directly to the copyright owner as specified in the copyright notice associated with the article.