




Abstract
Mild traumatic brain injury (mTBI) mostly causes transient symptoms, but repeated (r)mTBI can lead to neurodegenerative processes. Diagnostic tools to evaluate the presence of ongoing occult neuropathology are lacking. In a mouse model of rmTBI, we investigated MRI and plasma biomarkers of brain damage before chronic functional impairment arose. Anesthetized adult male and female C57BL/6J mice were subjected to rmTBI or a sham procedure. Sensorimotor deficits were evaluated up to 12 months post-injury in SNAP and Neuroscore tests. Cognitive function was assessed in the novel object recognition test at six and 12 months. Diffusion tensor imaging (DTI) and structural magnetic resonance imaging (MRI) were performed at six and 12 months to examine white matter and structural damage. Plasma levels of neurofilament light (NfL) were assessed longitudinally up to 12 months. Brain histopathology was performed at 12 months. Independent groups of mice were used to examine the effects of 2-, 7- and 14-days inter-injury intervals on acute plasma NfL levels and on hyperactivity. Twelve months after an acute transient impairment, sensorimotor functions declined again in rmTBI mice (p < 0.001 vs sham), but not earlier. Similarly, rmTBI mice showed memory impairment at 12 (p < 0.01 vs sham) but not at 6 months. White matter damage examined by DTI was evident in rmTBI mice at both six and 12 months (p < 0.001 vs sham). This was associated with callosal atrophy (p < 0.001 vs sham) evaluated by structural MRI. Plasma NfL at one week was elevated in rmTBI (p < 0.001 vs sham), and its level correlated with callosal atrophy at 12 months (Pearson r = 0.72, p < 0.01). Histopathology showed thinning of the corpus callosum and marked astrogliosis in rmTBI mice. The NfL levels were higher in mice subjected to short (2 days) compared with longer (7 and 14 days) inter-injury intervals (p < 0.05), and this correlated with hyperactivity in mice (Pearson r = 0.50; p < 0.05). These findings show that rmTBI causes white matter pathology detectable by MRI before chronic functional impairment. Early quantification of plasma NfL correlates with the degree of white matter atrophy one year after rmTBI and can serve to monitor the brain's susceptibility to a second mTBI, supporting its potential clinical application to guide the return to practice in sport-related TBI.
Introduction
Mild traumatic brain injury (mTBI) is a matter of public health concern because it constitutes the majority of all TBI cases 1,2 affecting approximately 42 million people worldwide every year 2 with higher prevalence in sport athletes and military personnel. 3 Mild TBI is commonly caused by a blunt nonpenetrating head impact, resulting in transient cognitive impairment, typically without acute brain damage detectable by conventional magnetic resonance imaging (MRI) or computerized tomography (CT) scans of the brain. 4,5
The consequences of mTBI are often underestimated because of the lack of objective diagnostic methods and the fact that initial symptoms can be so subtle that people do not seek hospital treatment. Hence, mTBI is considered a “silent epidemic.” 6,7
Transient neurological impairment occurs after mTBI and lasts up to several weeks, 8,9 thus increasing the risk of repeated injury while the brain is still recovering from the first. This is especially relevant for some athletes because if activity is resumed too early after a trauma, they are at risk of a second injury in a vulnerable phase during which repetitive mTBI (rmTBI) exacerbates the course of the injury. 10 –12 When repeated, the long-term consequences of mTBI are far from transient, with a substantial number of patients having persistent neurocognitive impairments. 13,14
Recent studies show that repeated brain trauma is a major risk factor for later development of neurodegenerative diseases in contact sports, 4,5,15 –17 but also in sports not typically associated with violent direct contact, such as soccer. 14 Nevertheless, the precise pathophysiological mechanisms underlying the chronic consequences of rmTBI are still elusive.
The biomechanical forces involved in TBI lead to diffuse axonal injury, because white matter tracts are particularly susceptible to mechanical loading. 18 Axonal damage can then result in excitotoxicity and release of damage-activated molecular patterns 19 ; indeed, areas of axonal injury often present micro- and astrogliosis. 18,20,21 Importantly, experimental data suggest that axonal injury and neuroinflammation play significant roles in the neuropathological events that follow single or repetitive mTBI, correlating with chronic functional impairments. 22
Imaging and diagnostic tools can serve as biomarkers to predict the long-term consequences of mTBI. MRI techniques, such as diffusion tensor imaging (DTI), can accurately assess axonal injury, shown to be associated with a reduction of fractional anisotropy (FA) after mTBI. 23 –26 High-resolution 3D structural MRI acquisition can be used to identify early small changes in brain volumes, often reported only at chronic stages. 27
Importantly, the examination of axonal damage by analysis of fluid biomarkers at acute time points has now become feasible with micro-ELISA technology. Studies across different TBI severities have shown that the levels of neurofilament light (NfL), present in long myelinated axons, are elevated after injury and correlate with measures of functional and structural outcomes. 28,29 Higher NfL levels have been reported in contact sports' athlethes 30,31 and have been seen to increase progressively over the course of a sports season in American football players, suggesting that NfL may be sensitive to repetitive subconcussive head impacts. 32
The broad heterogeneity of the human situation has posed limitations on the validation of diagnostic tools to identify early and delayed biomarkers of rmTBI. Highly reproducible animal models of mTBI, keeping under control the biomechanics of the injury, can help overcome this limitation. To model sport-related rmTBI, it is possible to expose mice to several injuries within a temporal window of 72h in which the brain is still recovering and more vulnerable, 33 with several studies showing progressive cognitive impairment and neuroinflammation at chronic times. 22,34
In the present work, we aimed to monitor the consequences of rmTBI by behavioral, MRI, and histopathological assessments, and assess whether acute plasma NfL levels could help indicate the development of chronic white matter pathology and functional impairment.
Methods
Ethics statement
The IRFMN adheres to the principles set out in the following laws, regulations, and policies governing the care and use of laboratory animals: Italian Governing Law (D.lgs 26/2014; Authorisation n.19/2008-A issued March 6, 2008 by Ministry of Health); Mario Negri Institutional Regulations and Policies providing internal authorisation for persons conducting animal experiments (Quality Management System Certificate – UNI EN ISO 9001:2008 – Reg. N° 8576-A); the NIH Guide for the Care and Use of Laboratory Animals (2011 edition) and EU directives and guidelines (EEC Council Directive 2010/63/UE). These were reviewed and approved by the Mario Negri Institute Animal Care and Use Committee that includes ad hoc members for ethical issues, and by the Italian Ministry of Health (Decreto no. 317/2018-PR).
Mice
A total of 78 mice were randomly assigned to either: (1) a chronic experiment: repetitive sham (n = 8 male, n = 8 female), rmTBI (n = 9 male, n = 9 female), single sham (n = 10, male), single mild TBI (smTBI; n = 12, male); or (2) an acute experiment: two rmTBI (x2 rmTBI) interinjury interval 2 days (n = 7), inter-injury interval 7 days (n = 7), inter-injury interval 14 days (n = 8). During the chronic experiment, two smTBI and one repetitive sham mice died from intercurrent illnesses unrelated to TBI before the 12-month assessments.
Male and female C57BL/6J mice (9 weeks of age) from Envigo (Horst, Netherlands) were housed in a specific pathogen-free vivarium at a constant temperature (21 ± 1 °C) and relative humidity (60 ± 5%) with a 12h light/dark cycle and free access to pellet food and water. All animal experiments were designed in accordance with the ARRIVE guidelines, with a commitment to refinement, reduction, and replacement, minimizing the numbers of mice, and using biostatistics to optimize mouse numbers on the bases of our preliminary results.
Thus, for statistical validity, we used 12 to 18 mice for the behavioral tests, and seven to eight mice for histology. The mice were assigned to the different experimental groups using randomization lists. Behavioral, imaging, circulating biomarker and histological assessments were performed by researchers blinded to the experimental groups.
Experimental brain injury
Mice were anesthetized with isoflurane inhalation (induction 3%; maintenance 1.5%) in an N2O/O2 (70%/30%) mixture and the head was fixed in a stereotaxic frame. The animals were placed on a heating pad to keep their body temperature at 37°C. The mTBI was induced using a 5-mm diameter rigid impactor driven by an electromagnetic controlled impact device (impactOne, Leica), mounted at an angle of 20 degrees to the vertical plane and applied to the intact scalp, between bregma and lambda, over the left parieto-temporal cortex (anteroposteriority: -2.5 mm, laterality: -2.5 mm), at impactor velocity 5 m/sec and deformation depth 1 mm.
The criteria for a mTBI were a short period of post-traumatic apnea (<30 sec), a short period of righting reflex (<6 min), no sign of skull fractures, and no hemorrhages. 22 At the end of the procedure, animals were allowed to recover on a pad and then returned to their home cages when ambulatory.
The rmTBI mice received five anesthesia and hits, with a 48h inter-injury interval; single mild TBI (smTBI) mice received a single anesthesia and hit; sham animals were subjected to the same procedures and anesthesia duration as the sm or rmTBI mice, but did not receive the head impact, to control for the effects of single or repeated anesthesia (five times). The effects of inter-injury interval were explored by increasing the interval between two (2x) mTBIs from two to seven or 14 days (2x mTBI mice were anesthetized two times).
Experimental design
Chronic experiment
Mice were subjected to either one or five mTBI (smTBI and rmTBI, respectively) or one or five repeated sham procedures (single or repetitive sham respectively).
Mice were longitudinally analyzed as detailed in Fig. 1A. Sensorimotor deficits were evaluated in Simple Neuroassessment of Asymmetric imPairment (SNAP) and Neuroscore tests (1 and 5 weeks, 3, 6, and 12 months) by the same operator for the duration of the study. Cognitive impairments were evaluated in novel object recognition (NOR) and open field (OF) tests at six and 12 months after injury. Imaging studies were performed as T2 weighted (T2WI) and DTI (6 and 12 months) MRI. All mice were euthanized at 12 months for histopathological analysis. Blood samples were taken one and five weeks, and three, six, and 12 months post-injury. Body weight at all time points was recorded in all mice.

Schematic representation of the experimental design. Mild TBI was induced by electromagnetic controlled impact over the left parietal bone in anesthetized mice. (
Acute experiment
Mice were subjected to two mTBI (2x rmTBI) with a two, seven, or 14 days (d) inter-injury interval (2d, 7d, 14d, respectively). Blood samples were taken at three and seven days after the last repeated injury, and cognitive impairment was evaluated at three days after the last injury in OF test, as detailed in Fig. 1B. For the 14d inter-injury interval only, an additional blood sample was taken 7d after the first injury to evaluate the correlation between NfL at one week and the righting reflex.
Behavioral tests
Simple Neuroassessment of Asymmetric imPairment (SNAP)
Mice were tested as previously described 35,36 to assess eight test's measure: interaction with handler, grip strength, visual placing, pacing/circling, gait and posture, head tilt, visual field, coordination and proprioception. Scores range from 0 (normal) to 5 (severely impaired) for each test and were summed to give an overall score that ranges from 0 (best) to 40 (worst).
Neuroscore
Mice were scored from 4 (normal) to 0 (severely impaired) for each of the following indices: (1) forelimb function while walking on the grid, and flexion function response during suspension by the tail; (2) hindlimb function while walking on the grid and extension function during suspension by the tail; and (3) resistance to lateral right and left pulsion. The scores in each test were summed to give an overall score, from 0 (worst) to 12 (best). 37
Novel object recognition (NOR)
Mice were tested in an open-square gray arena (40 × 40 cm), 30 cm high, under dim illumination, as described previously. 38,39 The task started with a habituation trial during which mice were placed in the empty arena for 5 min and their movements were recorded (Ethovision XT 15.0, Noldus). The next day mice were placed in the same arena containing two identical objects (familiarization phase). Exploration was recorded in a 10-min trial by an investigator blinded to the experimental group.
Sniffing, touching and stretching the head toward the object at a distance of no more than 2 cm were scored as object investigation. Twenty-four hours later (test phase) mice were placed in the arena containing two objects: one identical to one of the objects presented during the familiarization phase (familiar object), and a new, different one (novel object), and the time spent exploring the two objects was recorded for 10 min. Memory was expressed as a discrimination index (DI), i.e. (seconds on novel – seconds on familiar) / (total time on objects).
Open field (OF)
Mice were tested in the same arena and under the same conditions as for the NOR. Their behavior was video-recorded for 5 min (Ethovision XT 15.0, Noldus). The time spent moving and total distance moved (a measure of locomotor activity) were recorded.
MRI acquisition
Mice were anesthetized with isoflurane (induction 3 vol %, maintenance 1.5 vol %) in a mixture of N2O/O2 (70%/30%). The head was fixed using a stereotaxic frame and positioned in the magnet. Respiratory frequency was monitored throughout the experiment, and body temperature was maintained at 37°C with a heating pad. Brain imaging was performed on a 7T small-bore animal scanner (BioSpec®; Bruker, Ettlingen, Germany) running ParaVision 6.01 and equipped with a quadrature 1H CryoProbeTM (Bruker, Ettlingen, Germany) surface coil as transmitter and receiver.
The DTI and 3D T2-weighted imaging (T2WI) were obtained to quantify white matter damage and brain volumes/cortical thickness respectively. DTI: echo-planar imaging sequences were acquired (TR/TE = 7000/32 msec, resolution 125 × 125 μm2; FOV 1. 5 × 1.5 cm2; acquisition matrix 120 × 120, slice thickness 0.3 mm). Diffusion encoding b factors of 800 mm2/s were applied along 19 isotropic directions and two B0 unweighted images for each repetition.
Anatomical images: T2WI were obtained with a 3D fast low-angle shot magnetic resonance imaging (FLASH) sequence (TR/TE 250/3 ms; Flip angle 15°; image resolution 100 × 100 × 100 μm3; FOV 3 × 0.8 × 1.1 cm2; acquisition matrix 300 × 80 × 110).
MRI analysis
DTI
To investigate the white matter integrity, a tract-based spatial statistics (TBSS) 40,41 method was adopted. The diffusion tensor was computed using FSL software. 42 A group mean full tensor template was first created with a population-based DTI atlas construction algorithm that uses a tensor-based registration procedure embedded in the DTI-TK software. 43 The average template was resampled to an in-plane resolution of 100 × 100 μm2 and slice thickness 0.2 mm. A high-resolution FA map of the population-based template was then generated and skeletonized.
The FA images of all subjects were normalized to the mean template with a diffeomorphic transformation, and the transformations were applied to all the DTI metrics (mean density, MD; radial diffusivity, RD; axial diffusivity, AD), which were warped to the mean FA skeleton, permitting voxel-wise statistical comparison of the DTI metrics. The skeleton of the FA map generated from the population-based DTI template was binarized and manually divided into four white matter regions of interest (ROIs, Fig. 3B) allowing the computation of the mean value of each DTI metric for each mouse.
Brain volumes
After the creation of an in-house set of mouse brain atlases (for details see Supplementary Data), all the anatomical brain images acquired in the study were pre-processed, applying a non-uniform bias field correction (N4BiasFieldCorrection). A multi-atlas segmentation approach
44
was then adopted (Supplementary Fig. S1), using the
Cortical thickness
As previously described, 45 the labels were combined into two labels, one representing the cortical region and the other the non-cortical regions of each mouse. The cortical thickness maps were then computed with the KellyKapowsky command within the ANTs toolkit 46 using a gradient step size for the optimization of 0.1. All brains, and all the cortical thickness maps, were then normalized to a common template, allowing a voxel-based analysis (VBA).
Blood collection and NfL quantification
Blood was collected from the facial vein in awake mice, transferred to BD microvacutainer tubes (Becton Dickinson, Milan, Italy), and centrifugated at 4°C for 5 min at 5000 rcf. After, centrifugation plasma was collected and stored at -80°C until analysis. Levels of NfL were recorded using commercially available single molecule array assay kits (#103400, Quanterix, Billerica, MA) on an SR-X Analyzer (Quanterix, Billerica, MA). We followed the manufacturer's directions, samples were run in duplicate, and experiments were conducted by researchers blinded to the experimental conditions. The assay's dynamic range for plasma was 0− ∼2000 pg/mL and lower limit of detection was 0.0552 pg/mL (range 0.0152-0.108 pg/mL).
Histology
Mice were euthanized with deep anesthesia (ketamine 150 mg/kg and medetomidine 2 mg/kg, intraperitoneally [i.p.]) and perfused transcardially with 30 mL of phosphate-buffered saline (PBS) 0.1 mol/L pH 7.4. Brains were removed and fixed in 10% formalin for 24h, dehydrated in graded ethanol solutions, cleared in xylene, and embedded in paraffin. A subset of six mice were perfused with 30 mL of PBS 0.1 mol/L pH 7.4 and 60 mL of 4% paraformaldehyde (PFA) in PBS 0.1 mol/L pH 7.4 and their brains post-fixed in 4% PFA in PBS 0.1 mol/L pH 7.4 overnight at 4°C, dehydrated with 30% sucrose in 0.1 mol/L PBS for 24h at 4°C, frozen in n-pentane for 3 min at -45°C and stored at -80°C.
Serial sagittal formalin-fixed paraffin-embedded (FFPE) sections (8 μm thick) ipsilateral to the injury were cut on a microtome and collected at 80 μm intervals starting from -0.5 mm from midline. Histological analyses were performed in the ipsilateral hemisphere. The slices were first deparaffined in a stove at 58°C for 20 min, then rehydrated in a decreasing ethanol scale.
Nissl staining was performed to detect neuronal damage in the cortex, as described. 37 To detect white matter damage, we used Luxol Fast Blue (LFB) staining to assess the area of corpus callosum (CC) and of the cerebellar (CRB) white matter, as described. 37
Neuroinflammation was examined by immunohistochemistry. For heat-induced antigen retrieval, sections were incubated in sodium citrate buffer pH 6.0 in a microwave for 5 min at 750 Watt. After cooling to room temperature (RT), slices were incubated with 3% hydrogen peroxide and 0.25% Triton X-100 in water for 30 min at RT to inactivate (or block) endogenous peroxidases, then the sections were incubated for 1h at RT with 10% fetal calf serum (FCS) and 1% Triton X-100 in PBS, followed by overnight incubation at 4°C with the primary antibody (anti-IBA1 1:2000; Wako, Neuss, Germany) for microglia/macrophage activation and anti-GFAP (1:4000; Dako, Glostrup, Denmark) for astrocytes activation.
After washing with PBS, sections were incubated with a secondary antibody solution (1:200, biotinylated anti-rabbit Vector Laboratories, Burlingame, CA) for 1h at RT, followed by incubation with the Vectastain Elite ABC reagent (Vector Laboratories, Burlingame, CA). Immunoreactivity was tested using DAB as a chromogen (Dako, Glostrup, Denmark). Negative controls were run in parallel for each staining, and no staining was observed.
Axonal damage was assessed on the subset of frozen brains, from which two 40μm thickness coronal sections were cut and stained using FD NeuroSilver Kit II (FD NeuroTechnologies Inc, Columbia) according to the manufacturer's protocol.
Acquisition and quantification of histological markers
Two FFPE brain sagittal sections including the core impact (-0.5 mm, -0.58 mm from midline) per marker for each mouse were acquired at 20x with an Olympus BX-61-VS microscope (Olympus, Tokyo, Japan) with 10% overlap for stitching, z-axis 5μm (step size 1μm). For Nissl staining, we measured the neuronal cell area (μm2) in the cortex over an area between 0.6 mm and 0.8 mm deep; for measuring the area of CC and of CRB white matter with LFB, we manually selected a ROI.
For quantification of IBA1 and GFAP, the cortex was analyzed over an area 0.2 mm deep form the brain surface containing the sensorimotor cortex, and CC divided into: genu (GCC), body (BCC), and splenium (SCC). For each animal, two different mediolateral slices were analyzed.
Images were analyzed using Fiji software. For IHC markers, the immunostained area was expressed as percentage of the stained area.
Two frozen brain coronal sections at -1.2 mm and -1.5 mm from bregma were stained with FD NeuroSilver Kit II and acquired at 40x with Olympus BX-61-VS microscope (Olympus, Tokyo, Japan) with 10% overlap for stitching, z-axis 10μm (step size 2μm). A semiquantitative scale ranging from 0 to 3 was developed to score silver staining intensity. The scale was based on the presence of argyrophilic structures within the ipsilateral CC. Every image was independently scored by two trained raters who were blinded to the experimental groups. Scores from the two raters were averaged.
Statistics
Two-way analysis of variance (ANOVA) was used for MRI, plasma NfL, functional and histological data to determine the main effects of injury and sex to screen for significant interactions (Supplementary Table S1). No significant sex-by-injury interactions or main effects of sex were found, so males and females were considered as a single group. Males are indicated in graphs as full dots, while females as empty dots. For graphs presenting longitudinal data, details about the distribution of males and females at significant timepoints are reported in Supplementary Fig. S2.
Statistical analyses were performed with GraphPad Prism 9 (GraphPad Software, USA), using absolute values. The choice of parametric or non-parametric tests was based on passing the Shapiro–Wilk normality test, and data distribution was inspected by QQ plot. For each experiment, the figure legend reports the statistical analysis of the data. Outliers were identified using the ROUT method and excluded from analysis. Differences between groups were reported as statistically significant for p < 0.05. NfL concentrations were analyzed on log10-transformed data.
The VBA on the entire skeletonized white matter and cortical thickness was performed using a SPM12 toolbox. For second level analyses we used a full factorial model defining trauma and time as covariates. Statistical maps were thresholded with a significance level of p < 0.05 and corrected for family-wise error. We examined the patterns of plasma NfL to distinguish smTBI from rmTBI mice using non-parametric receiver operating characteristics (ROC) curves: the area under the curve (AUC) was calculated and compared with chance (AUC = 0.5). The measure was considered excellent for AUC close to 1.
Mice omitted from data analysis are described in the figure legends, where appropriate.
Results
Longitudinal evaluation of functional outcome
At 12 months post-injury, rmTBI had significantly lower weight than sham mice (p < 0.01, Fig 2A). There was acute impairment of sensorimotor function in rmTBI mice, detectable by SNAP (p < 0.001; Fig. 2B) and Neuroscore (p < 0.001; Fig. 2C) tests at one week, with full recovery by five weeks. Interestingly, at 12 months a deficit in the SNAP test emerged again in rmTBI mice (p < 0.01 vs sham at 12 months) (Fig. 2B). No differences were ever detected between sham and smTBI mice (Supplementary Fig. S3A).
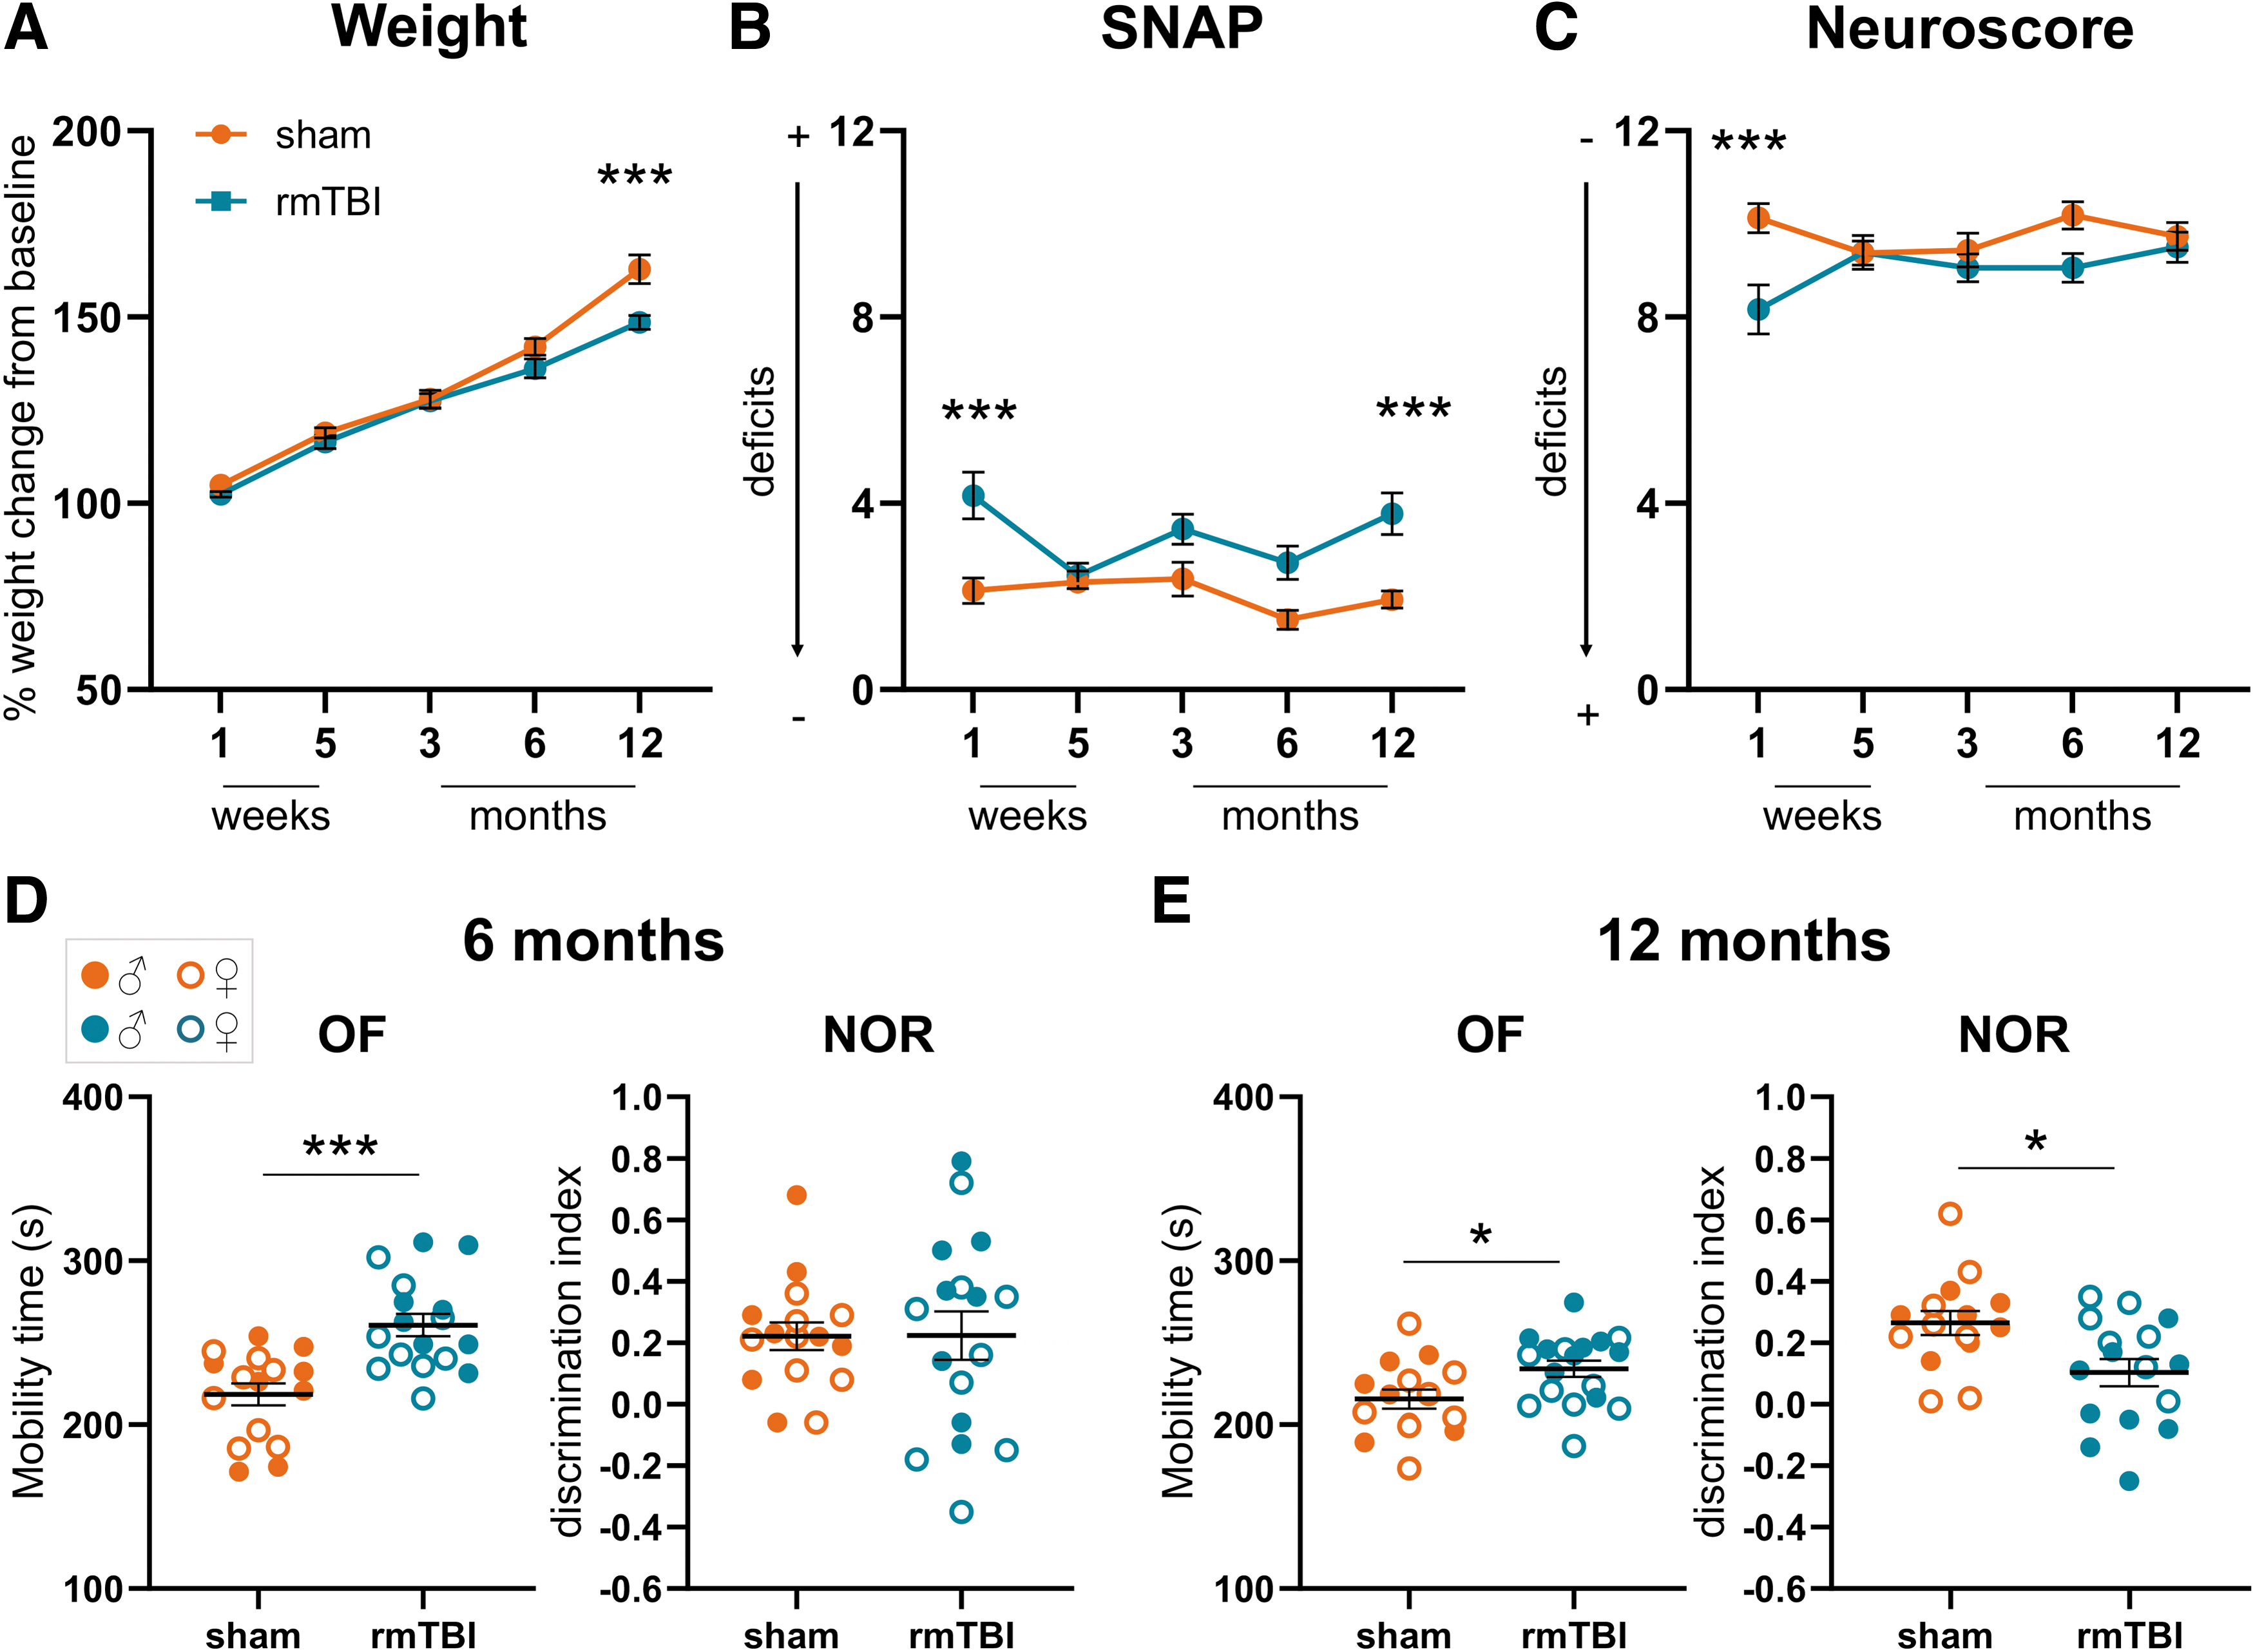
Weight change and behavioral deficits. (
The open field test detected hyperactive behavior in rmTBI mice, with increased mobility time at 6 (+38%; p < 0.001; Fig. 2D) and 12 months (+12%; p < 0.01; Fig. 2E) compared with sham, resulting in a greater distance traveled during the tests (6 m: sham: 1385 cm, rmTBI: 1858 cm; p < 0.05; 12 m: sham: 2304 cm, rmTBI: 2850 cm; p < 0.05; Supplementary Fig. S4).
The NOR test showed a memory impairment at 12 months in rmTBI mice (39% impairment compared with sham, p < 0.05, Fig. 2E) that was not present at 6 months. No effects on memory or locomotor activity were ever detected after smTBI (Supplementary Fig. S3B, C).
DTI-MRI shows chronic and persistent white matter damage
The VBA between rmTBI and sham mice at six months showed a reduction in FA, mostly in the ipsilateral (ipsi) white matter below the injury site, involving the corpus callosum (CC), external capsule (EC) and fimbria (p < 0.05 Fig. 3A), with VBA at 12 months showing similar results (data not shown). The ROI-based analysis (Fig. 3B) confirmed the VBA findings, showing lower mean FA values in ipsi- and contralateral (contra) EC (p < 0.001) and in the subregions of the CC (genu: GCC, p < 0.01; body: BCC p < 0.001; splenium: SCC, p < 0.001) (Fig. 3C-F) that persisted at 12 months. The AD was also lower at both time points in rmTBI than in sham mice in the ipsi-SCC (p < 0.01), ipsi-BCC at 12m (p < 0.01), and ipsi-EC (p < 0.001), and contra-SCC (p < 0.01), contra-BCC at 12m (p < 0.01), and contra-EC (p < 0.05) (Supplementary Fig. S5A).

Diffusion tensor imaging (DTI) analysis of white matter. (
The RD was increased at both time points in rmTBI in the ipsi-SCC (p < 0.01), ipsi-BCC (p < 0.001) and ipsi-EC (p < 0.001), and in contra-SCC (p < 0.01), contra-BCC (p < 0.01) and contra-EC (p < 0.05) (Suppl. Fig. S5B). The RD was higher only at 6 months, in both ipsi- (p < 0.001) and contra-GCC (p < 0.05).
When comparing smTBI with sham mice, no differences were found in the white matter FA by VBA (Supplementary Fig. S6A), while ROI-based analyses in smTBI showed a significant FA reduction only in the ipsi-EC (p < 0.05) (Supplementary Fig. S6B-E). No differences between smTBI and sham were found in the other DTI metrics (Supplmentary Table S2).
Brain atrophy assessed by structural MRI
Cortical thickness was reduced below the site of impact at six months after rmTBI (Fig. 4A). The VBA showed that cortical thinning was more pronounced in the ipsi-hemisphere with only partial involvement of the contra-cortex (p < 0.05, Fig. 4B). Brain volumes indicated that at six months, ipsi-frontal (p < 0.01) and parieto-temporal (p < 0.001) cortices were smaller than in sham mice and a similar reduction persisted up to 12 months (Fig. 4C-D).
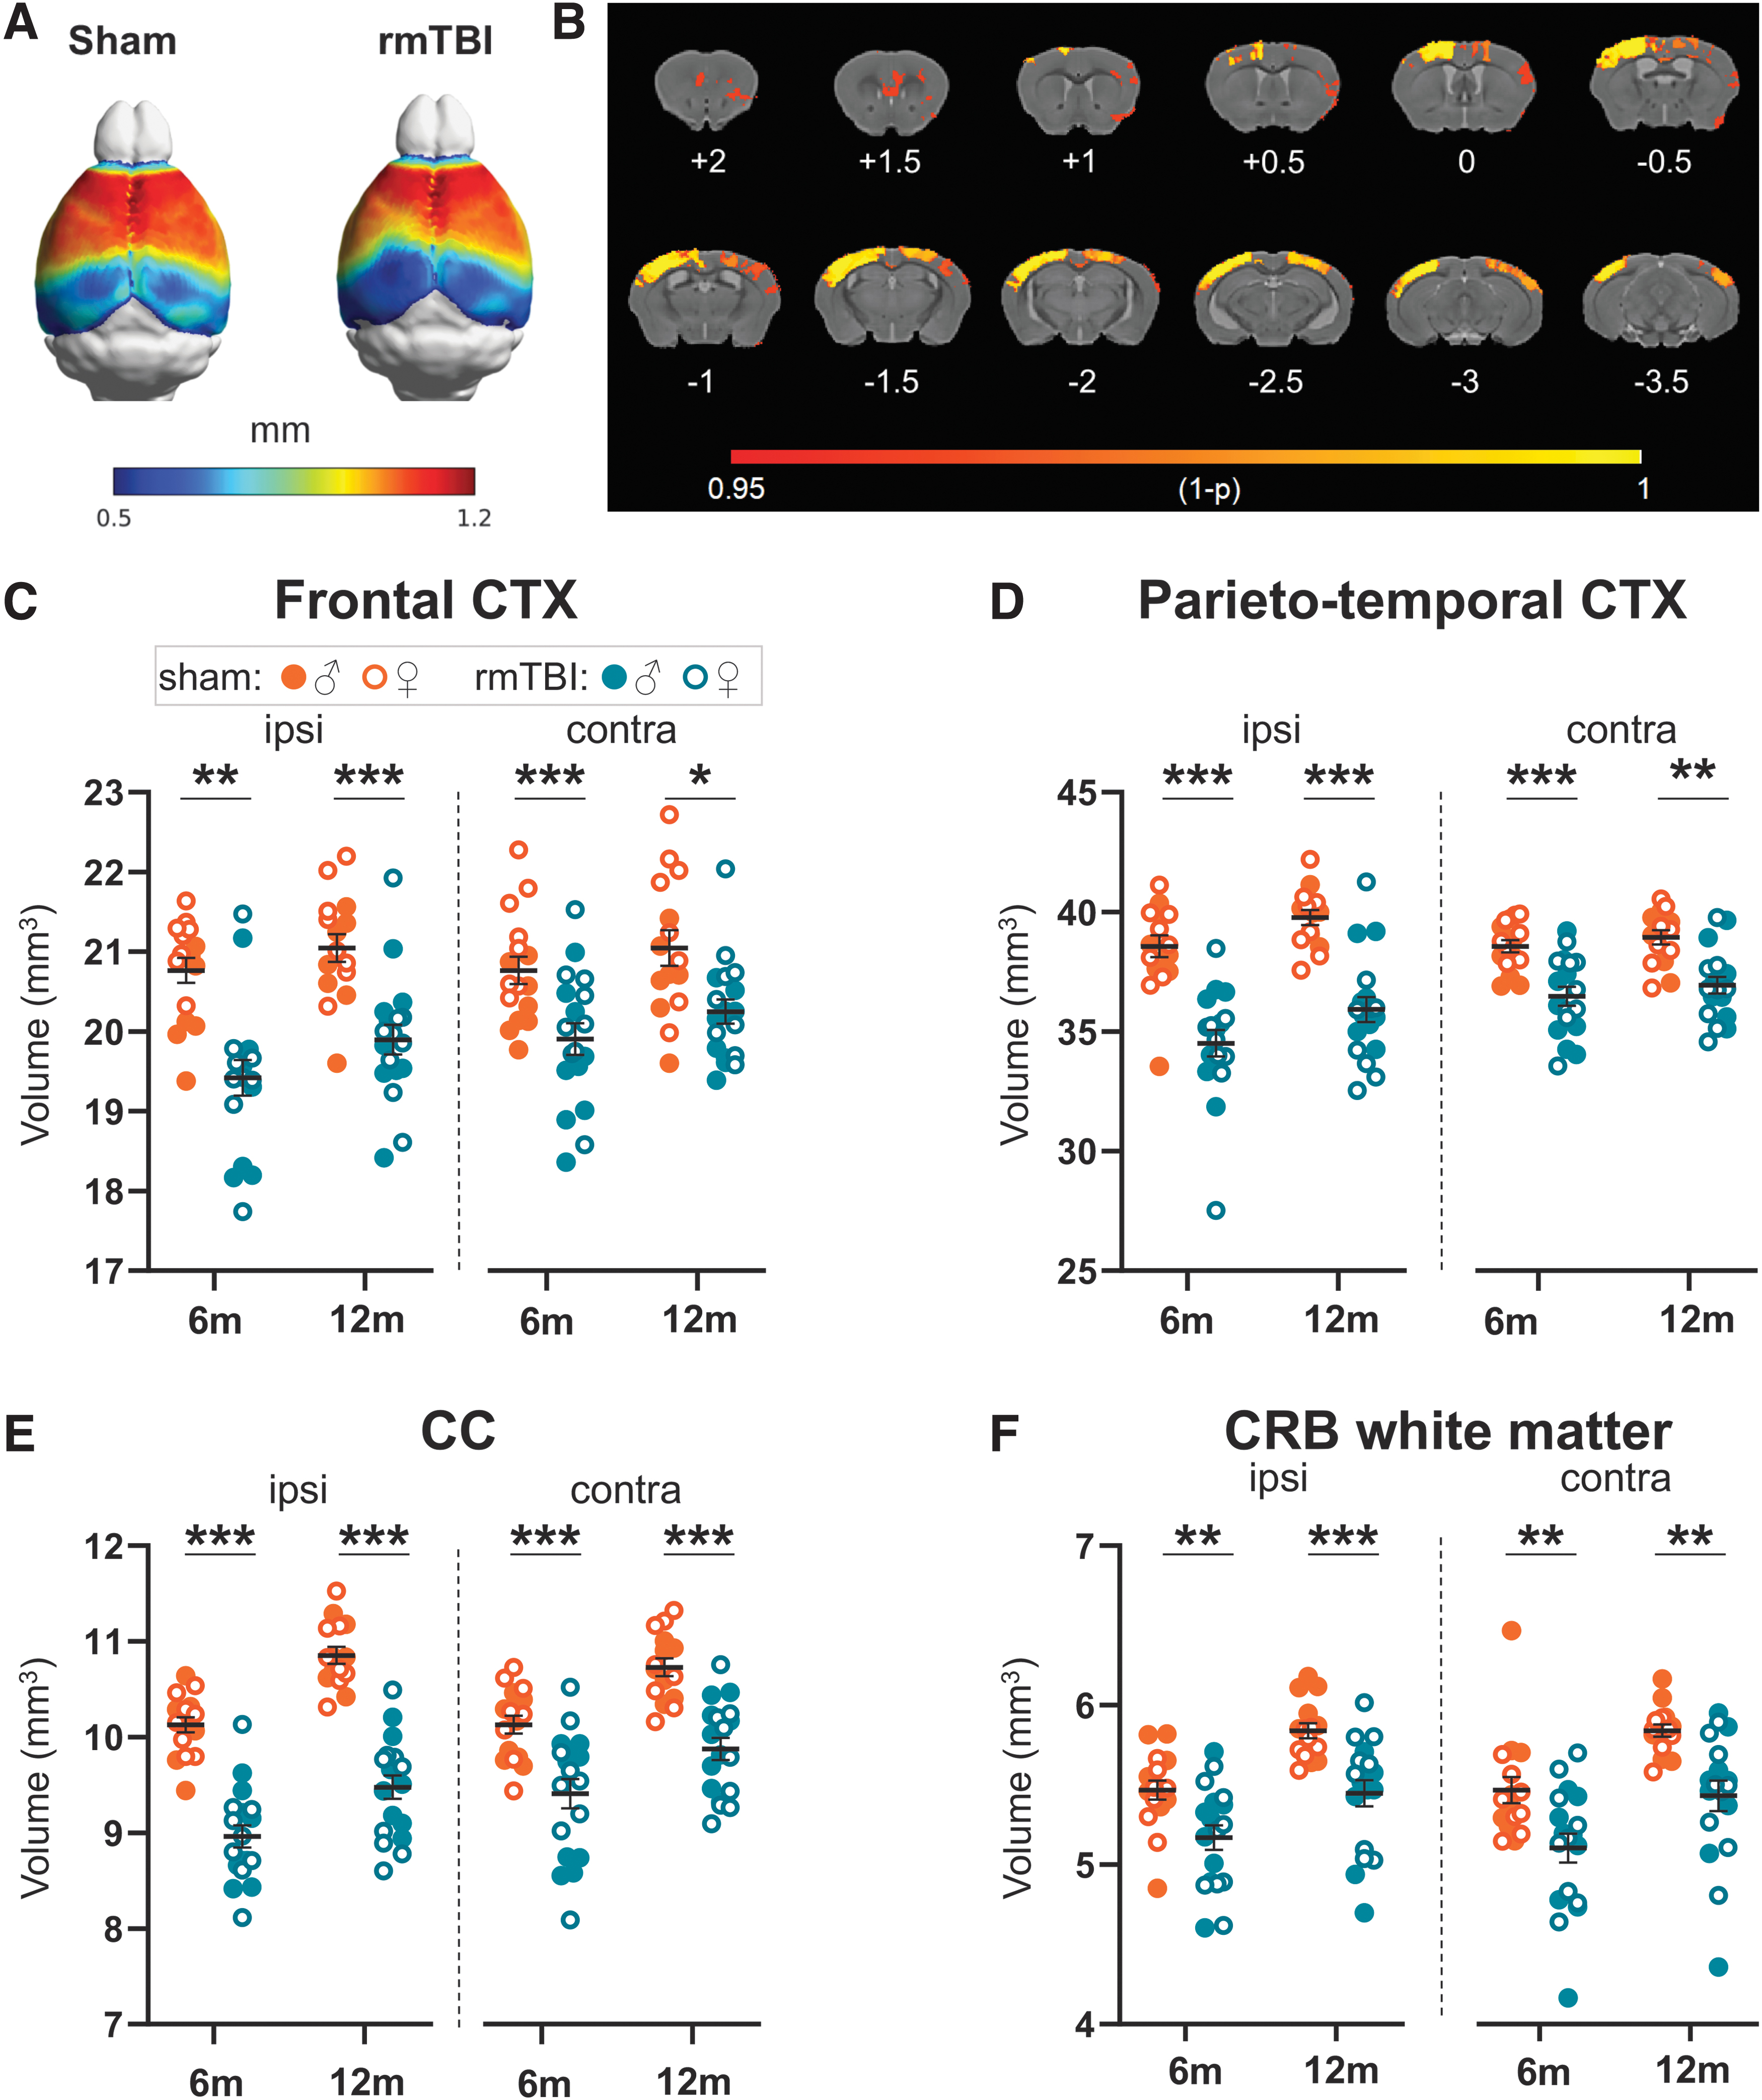
Structural magnetic resonance imaging (MRI) analysis. (
Not only cortical but also subcortical regions, such as the ipsi- and contra-CC (including BCC, SCC, GCC, and EC) were reduced in volume at six and 12 months after rmTBI compared with sham mice (Fig. 4E). Interestingly, ipsi- and contra-CRB white matter (Fig. 4F) and gray matter (Supplementary Fig. S7) were reduced in volume in rmTBI mice at both six and 12 months (p < 0.01) indicating a widespread damage of cerebellar structures.
Hippocampal atrophy was detected at six months in the ipsi-side only (p < 0.01) (Supplementary Fig. S7). No differences in brain volumes were detected at six months between smTBI and sham mice (Supplementary Fig. S8).
Plasma NfL profile and correlation with righting reflex and white matter atrophy
At acute time points (one week), the plasma level of NfL was increased in both rmTBI (p < 0.001 vs sham) and smTBI (p < 0.05 vs sham) groups, and was higher in rmTBI than smTBI (p < 0.01) mice (Fig. 5A). Longitudinal assessment in rmTBI mice showed that after five weeks, plasma NfL had fallen (p < 0.001 vs 1 week) but was still different from sham (p < 0.05) while by three months there were no differences between groups, and no differences between rmTBI and sham mice up to 12 months (Fig. 5A).

Neurofilament light (NfL) in plasma. (
After a single injury, NfL level at one week positively correlated with the righting reflex (Pearson correlation coefficient: r = 0.75, p < 0.05), a measure of loss of consciousness shown to predict long-term histological and behavioral outcomes after TBI (Fig. 5B). 47 Interestingly, NfL levels inversely correlated with the volumes of both the ipsi-CC (Pearson correlation coefficient: r = -0.719, p < 0.01; Fig. 5C), and the ipsi-CRB white matter (Pearson correlation coefficient: r = -0.722, p < 0.001; Fig. 5D), suggesting that chronic white matter atrophy could be predicted at acute time points by plasma NfL.
At one week, NfL levels were proportional to the number of mTBIs, with x2 mTBIs giving higher values than sham (p < 0.001) and smTBI (p < 0.01), and rmTBI (x5 mTBIs) higher than x2 mTBIs (p < 0.05) (Fig. 5E). NfL levels at one week discriminated well between mice that received two or one mTBI (ROC analysis AUC = 0.89, p < 0.01; 95% confidence interval [CI] 0.7370 to 1.000) as well as those that received five or two mTBIs (ROC analysis AUC = 0.88, p < 0.01; 95% CI 0.7187 to 1.000) (Fig. 5F).
Inter-injury interval affects acute plasma NfL and its correlation with functional outcomes
We then examined the effect of the inter-injury interval of two mTBIs on plasma levels of NfL and on hyperactivity three days after the last injury. Levels of NfL were higher in mice subjected to short (2d) than longer (7d and 14d) inter-injury intervals (p < 0.05) with no differences between 7 and 14 days (Fig. 6B). Mobility time during the open field test increased with a shorter inter-injury interval (p < 0.01, 2d vs 14d; p = 0.05, 2d vs 7d) with mice subjected to a short (2d) inter-injury interval showing a hyperactive phenotype (p < 0.01, 2d vs sham) (Fig. 6C).
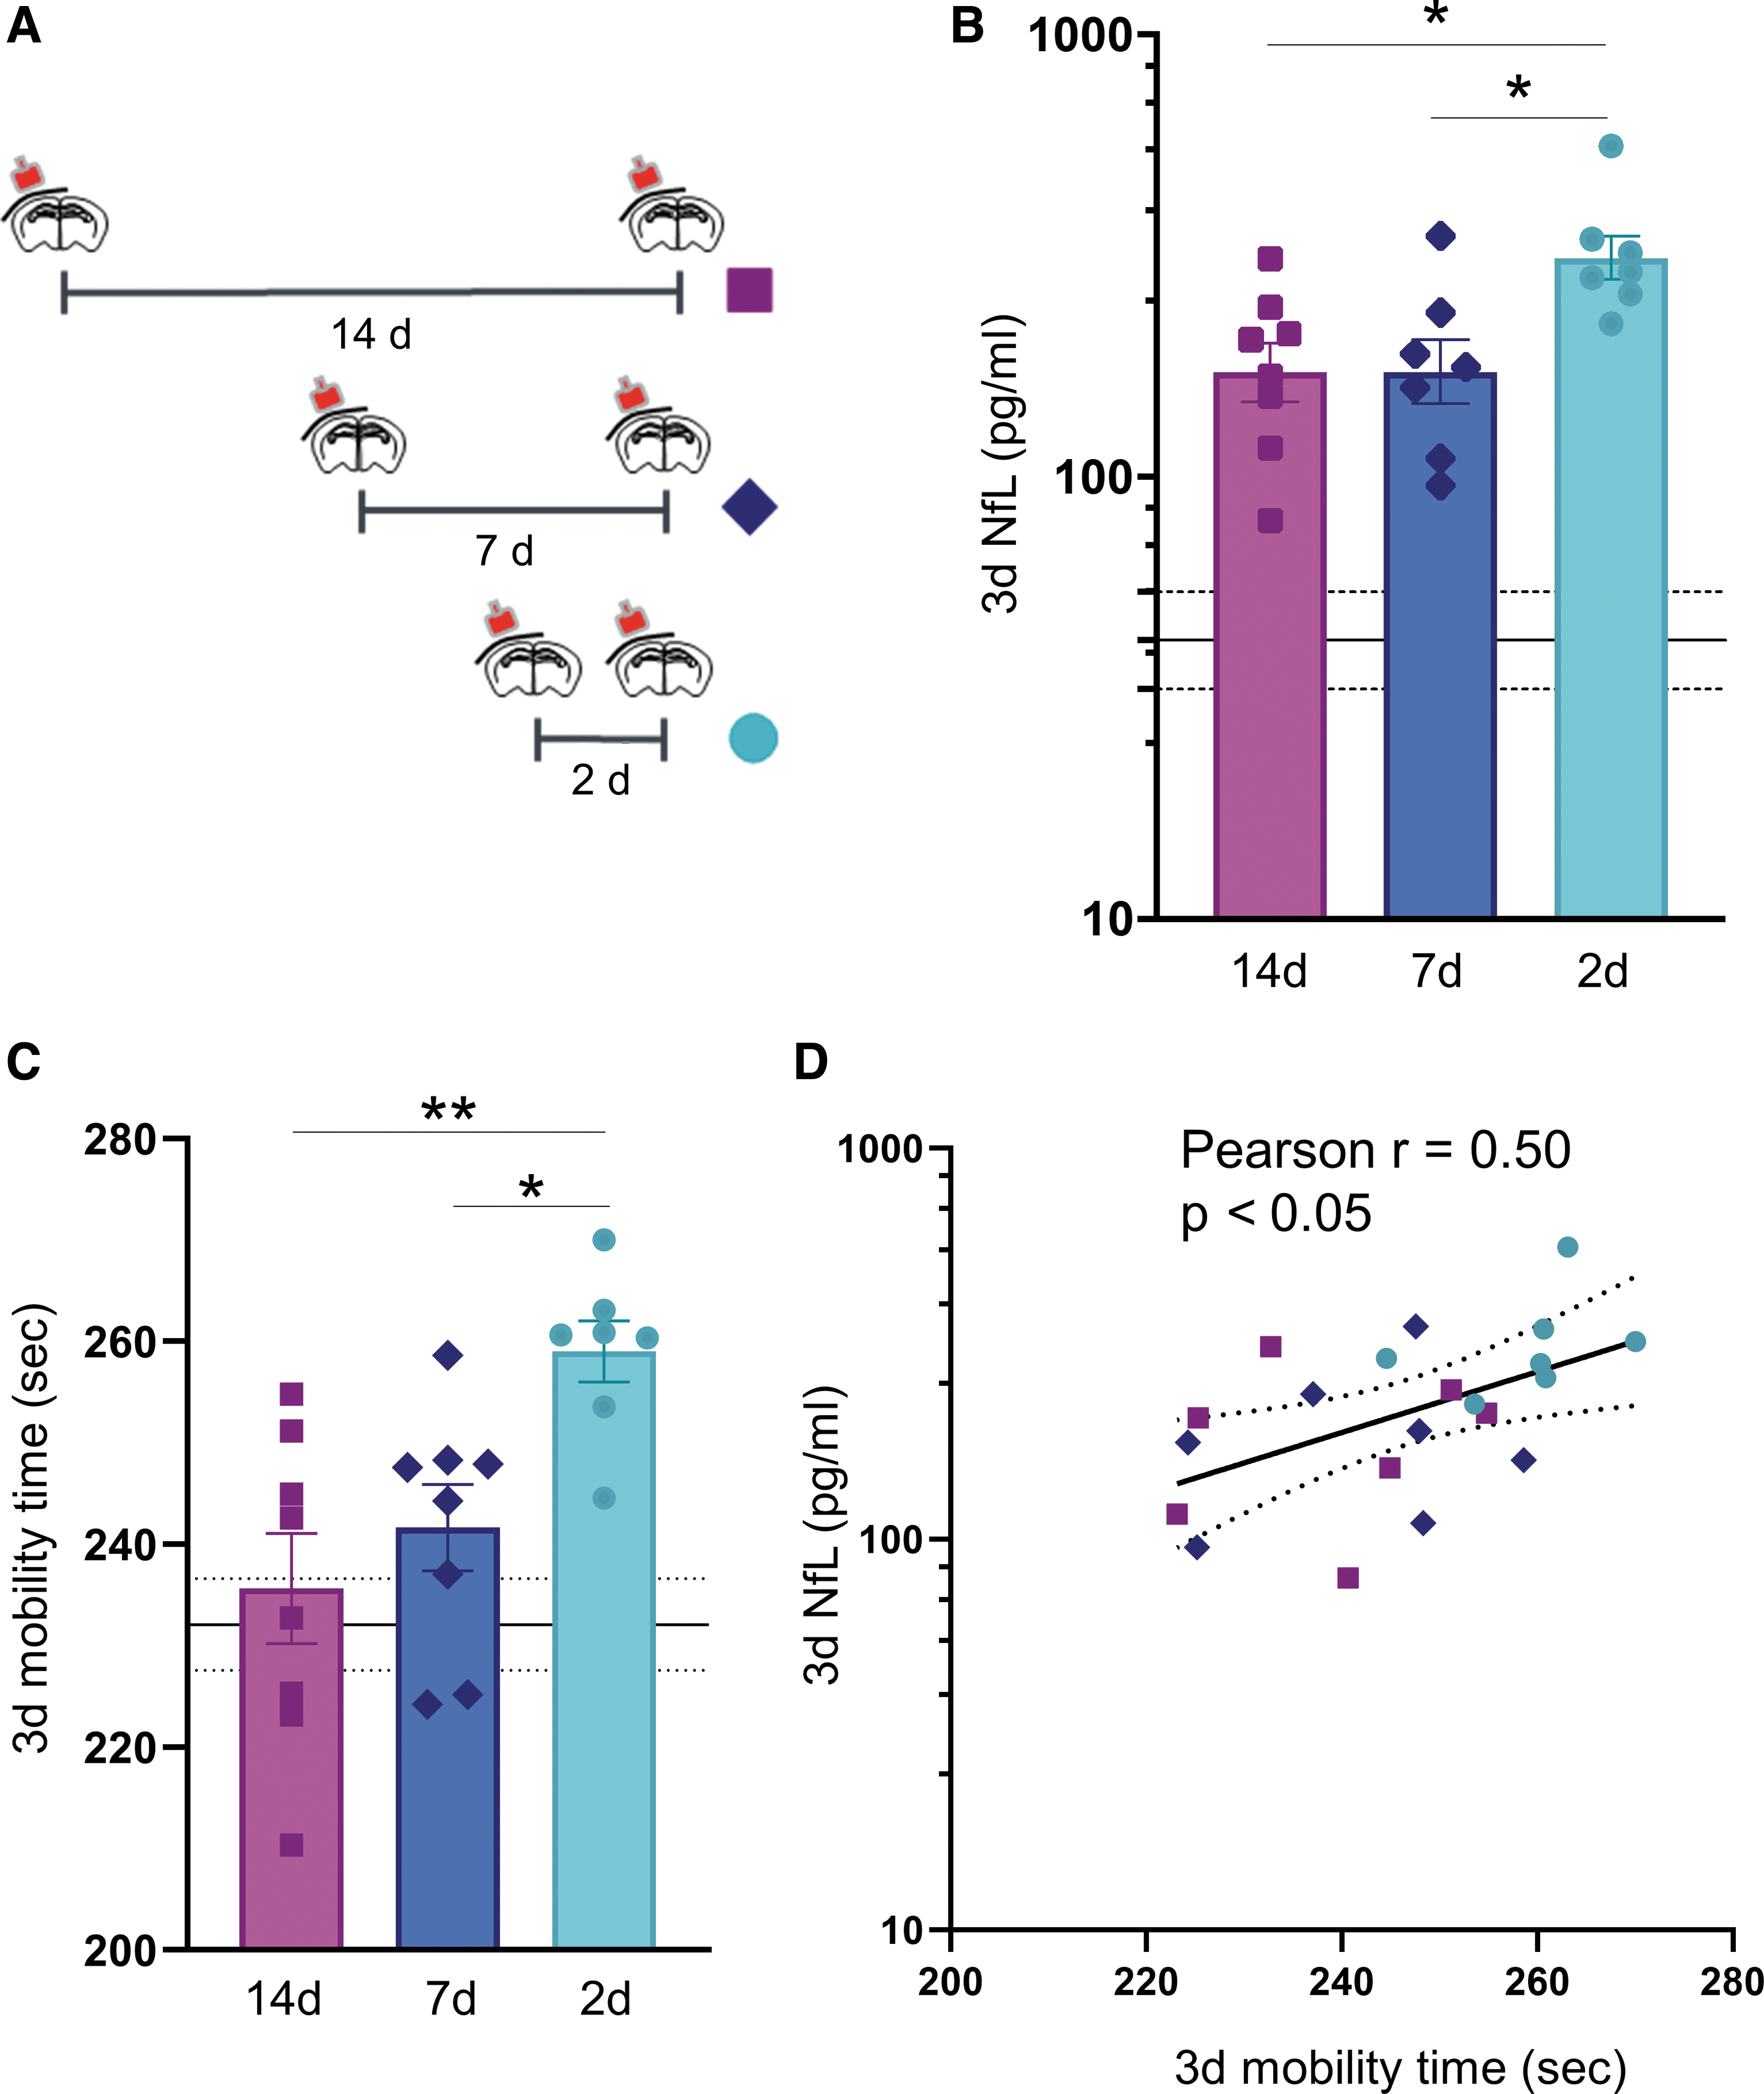
Acute NfL in plasma in relation to the length of the inter-injury interval. (
Importantly, three days after the last injury, NfL levels correlated with the hyperactivity at the same time point (Pearson correlation coefficient: r = 0.50; p < 0.05) (Fig. 6D). No differences in body weight were detected in mice subjected to 2d, 7d, and 14d inter-injury intervals (Supplementary Fig. S9).
Histological evidence of chronic white and gray matter pathology
One year after rmTBI, cortical neurons below the injury site were smaller in rmTBI than in sham mice (p < 0.05, Fig. 7B). In the BCC, silver staining showed axonal injury in rmTBI (p < 0.05 vs sham, Fig. 7C). Callosal and cerebellar white matter atrophy were detected in rmTBI mice by Luxol Fast Blue, as shown by a reduction in CC (51%, p < 0.05, Fig. 7D) and CRB (18%, p < 0.01, Fig. 7E) white matter area.
When evaluating glial markers in the three subregions of the CC, reactive astrogliosis (GFAP staining) and microglia/macrophage activation (IBA-1 staining) were higher in the BCC of rmTBI mice compared with sham (116% increased area staining in GFAP, p < 0.001, Fig. 8B; 69% increased area staining in IBA1, p < 0.01, Fig. 8E) paralleled by an increase in GFAP and IBA1 cell density (Supplementary Fig. S10 A). There were no changes in the GCC and SCC (Fig. 8B, E).

Histological analyses. (

Histological analyses. (
The cortex below the site of impact showed reactive astrogliosis in rmTBI mice (58% increased area staining in GFAP, p < 0.05, Fig. 8C; 40% increase in cell density, p < 0.05) with no differences in IBA-1 stained area (Fig. 8F). The hippocampus and the CRB (both gray and white matter) showed no evidence of reactive astrogliosis and microglia/macrophage activation in rmTBI mice (Supplementary Fig. S10 C-G).
Discussion
The aim of this study was to examine the late evolution of rmTBI in mice by neurobehavioral assessments, advanced brain MRI analyses, and measures of plasma NfL. Our longitudinal measures showed that rmTBI induced axonal injury and cerebral atrophy and was associated with chronic inflammatory cascades in the white matter—all hallmarks of the human pathology. 48 We found that diffusion and structural MRI can already detect the emergence of axonal injury at six months, before the onset of chronic neurological impairment. We also detected axonal injury acutely, on the basis of plasma NfL, which showed an increase dependent on the number of injuries and inter-injury intervals after rmTBI.
NfL levels correlated with acute neurological impairment and white matter atrophy at one year, suggesting its potential application as an early diagnostic and prognostic biomarker for mild TBI.
When evaluating functional outcomes, we found increased sensorimotor deficits at one week and 12 months after injury in the rmTBI group only, while memory impairment was detected at 12 but not six months after rmTBI. No neurological deficits were seen in smTBI or sham mice, indicating that multiple injuries are needed for functional impairment. Delayed manifestations of cognitive impairment often happen as a consequence of rmTBI in athletes, with a distinct clinical and neuropathological profile that becomes symptomatic years after the rmTBI, 4 indicating that this experimental model captures a key pathological feature of human pathology.
Being able to assess these changes or predict long-term dysfunction in vivo with clinically relevant MRI- and blood-based biomarkers would offer opportunities for early identification of pathology and progression management, making it possible to monitor therapeutic strategies to improve overall outcomes.
Human studies on TBI are intrinsically heterogeneous, with patients presenting with various medical histories, sites, and modes of injury, and severity. In the case of mTBI, another layer of complexity must be considered because mTBI(s) not requiring hospital treatment may remain undetected but may still contribute to an increased risk of neurodegenerative pathology. 49 Indeed, when looking at white matter damage after mTBI by diffusion MRI, contrasting results have been reported, with some studies showing increases, 50,51 decreases, 52 –54 or no changes 55 –57 compared with a control population, as recently reviewed. 58
Pre-clinical studies, by keeping under control the biomechanics of the injury, the site of impact, and subject characteristics (sex, age, and genetic heterogeneity), can help clarify the fine relationship between biomarkers of brain damage and the underlying pathology triggered by rmTBI. Models of rmTBI mimic pathological features associated to sport-related TBI, including recovery in diffusion MRI and functional outcomes, 59 and the gradual decline of cognitive performance, 60 white matter damage, 61,62 and neuroinflammation. 63,64
The MRI results are easily translatable from animal studies to clinical research, giving the opportunity to link the imaging findings with the molecular and cellular underpinnings of the pathology. The rmTBI mainly involves axonal injury, 65 and low white matter FA has in fact been reported in human 66 –68 and experimental 69,70 studies. In agreement with previous data using the same experimental procedure, we found that rmTBI, but not smTBI, induced persistent neuropathology in commissural fibers and cortical areas. 22,34,71 DTI showed that, already six months after injury, FA was low in the CC and EC, and this was associated with lower AD and higher RD, reflecting axonal injury and demyelination. 72
A key pathological feature of sports-related TBI is brain atrophy, 73,74 with evidence of cortical thinning, white matter atrophy, reduced frontal and temporal lobe volumes, and hippocampal sclerosis. 4,75 –77 We found marked brain atrophy in cortical and subcortical areas already six months after injury. Histology of the gray matter indicated that the reduction of cortical volumes below the injury site was associated with a decrease in the size but not the number of neuronal cells, similarly to what has been found in aging. 78
Previous pre-clinical studies on rmTBI have shown that at chronic stages the volume of the CC, measured post-mortem by histological analysis 79 or by ex vivo MRI, is reduced. 80 Structural and diffusion-weighted MRI abnormalities have also been reported in the same brain areas at acute and subacute times after repetitive mild lateral fluid percussion injury in rats. 81
We confirm and expand previous findings by showing that in vivo MRI can efficiently monitor white matter atrophy even six months before histological assessment and the development of chronic functional impairment. The CRB was included in our T2WI but not DTI MRI acquisition protocol; thus we limited our analysis to volumetric assessments in this region. Albeit being far from the site of impact, CRB atrophy was detectable six months after rmTBI. These data extend previous findings of cerebellar white matter injury after rmTBI in mice 71 and are in line with neuroimaging data in athletes. 82,83
Growing evidence in both clinical 84 and pre-clinical 85 studies has shown that neuroinflammation is a common pathological feature of concussive and subconcussive injuries, and that it may underlie cognitive impairment and neurodegeneration after rmTBI. 4,5,76,86 We did in fact find that gray and white matter areas were deeply affected by rmTBI, with evidence of glial activation at chronic stages. In particular, CC atrophy was characterized by increased markers of astro- and micro-gliosis.
Ongoing axonal injury was evident in rmTBI, suggesting that at late stages neuroinflammation could be responsible for axonal injury. The fact that there was clear white matter atrophy in rmTBI at six and 12 months and that the axonal injury marker NfL was not elevated three months after injury supports the notion that early axonal injury caused by the biomechanical insult may trigger delayed atrophy and neuroinflammation in the white matter.
Recent advances in detection techniques now allow the quantification of previously unquantifiable levels of circulating biomarkers of white matter damage. Among these, neurofilament proteins can predict long-term outcomes and progressive neurodegeneration after moderate-to-severe TBI. 29,87 NfL is highly expressed in long myelinated axons 88 that are damaged during TBI. 18 NfL levels appear to be elevated across several TBI severities, 28,89 –91 including sport-related TBI. 30 –32,92 Importantly, blood NfL levels can distinguish concussed from non-concussed American football players. 93
Since the original finding that NfL in the CSF was increased after TBI in patients, 94 several studies have explored the relationship between NfL levels and neurological outcome not only in TBI, 95 but also cardiac surgery 96,97 and arrest, 98,99 and critical illness. 100
Recently, increased NfL levels have also been reported in COVID-19 patients. 101 –103 High NfL plasma levels were also found in patients with neurodegenerative diseases. 104,105 Thus, data point to NfL as a sensitive marker of ongoing neurological injury with prognostic and pharmacodynamic validity, 106 –109 but low specificity with regard to the causes of the insult. In the context of professional sport-related TBI monitoring, the low specificity of NfL raises less concerns because the cause and timing of injury (or suspected injury) is known, and in principle plasma samples can be collected from athletes at baseline and post-injury. 95 Moreover, the fact that NfL peaks a few days after injury in both clinical 31,89 and pre-clinical 110 studies makes it a useful biomarker to evaluate brain susceptibility after mTBI.
Thus, high plasmatic levels of NfL in an otherwise healthy athlete could inform on the presence of ongoing brain injury and help guide decisions on the resting period before return to practice. Our data support this view because shortening the inter-injury interval resulted in higher levels of NfL, which correlated with functional outcome.
A fine characterization of NfL dynamics in athletes, evaluating the impact of single brain injuries as opposed to rmTBI, as well as the effect of the inter-injury interval, is currently lacking. The present work provides a detailed assessment of the dynamics of plasma NfL in mice after mTBI. NfL was increased at one week in mice subjected to one, two, or five mild injuries, in a dose-dependent manner. NfL levels were correlated with mice's righting reflex, a measure of loss of consciousness that can predict long-term histological and behavioral outcomes after TBI, 47 supporting the relevance of this biomarker to clinical outcomes.
Importantly, the reduction in white matter volumes in rmTBI observed at one year correlated with the levels of acute NfL. This correlation has recently been reported also in patients with severe TBI and is associated with accelerated brain aging, 111 suggesting that NfL may serve as a more accessible prognostic biomarker to monitor chronic consequences of mild TBI. One clinically relevant question is whether the plasma NfL level could be used to monitor the load of mild injuries sustained even in patients not needing hospitalization. Our pre-clinical data support this because we found that NfL levels discriminated well by ROC analysis between mice that received one, two, or five mTBIs.
Given the potential for plasma NfL to detect ongoing white matter damage, and the evidence of a window of susceptibility to TBI, 33 we investigated whether plasma NfL could also be used as a biomarker to evaluate brain susceptibility to rmTBI. Pre-clinical studies have shown that increasing the frequency of the repetitive impacts leads to chronic behavioral impairments, synaptic changes and astrogliosis assessed post-mortem. 112 –114 With shorter inter-injury intervals, plasma NfL levels increased, highlighting the sensitivity of this biomarker to mild brain damage. Moreover, reducing the inter-injury interval also led to hyperactivity, and the increase in motor restlessness is also common in the early stages of recovery after TBI in humans 115,116 and in athletes with multiple concussions. 117 –119 Importantly, NfL levels correlated with the hyperactivity of mice, indicating a link between the biomarker's levels and the neurological phenotype.
On increasing the biological variability by including both sexes, clear differences were still present between rmTBI and sham mice in imaging and NfL analysis. No main effect of sex was detected. Female rmTBI mice, however, showed a trend to worse sensorimotor function at chronic times compared with rmTBI male mice (p = 0.064), suggesting that sensorimotor deficit might be more prominent in the long term in female mice. It should be noted that sex was not the primary end point, and the study was powered to only detect differences in sex with a large effect size. Further studies designed to address in detail the effect of age are also needed.
Overall, the rmTBI mouse model we used induced highly reproducible pathological features, including the neuroinflammation and brain atrophy reported in other studies, 22,34 in line with human studies of sports-related TBI. 5,28,120 We show that MRI and blood biomarkers of white matter damage can be used to monitor disease progression in vivo. Thus, this model is a valuable asset to test new therapeutic strategies with the possibility of assessing clinically relevant outcomes through early quantification of plasma NfL.
Conclusions
Diagnostic tools to monitor the consequences of concussion are needed. DTI and high-resolution structural MRI detect underlying pathology triggered by rmTBI well before the appearance of chronic neurological impairment. Early quantification of plasma NfL after rmTBI correlates with the level of white matter atrophy one year after rmTBI and can be used to monitor brain susceptibility to a second mTBI, supporting its potential clinical application to guide the return to activity in athletes.
Data Sharing
All data from this manuscript will be publicly available through the open science services Zenodo. 121
Funding Information
This work was partially supported by the American Alzheimer Association (application AARG-17-532633) and Institutional funding.
Footnotes
Author Disclosure Statement
No competing financial interests exist.
Supplementary Material
Supplementary Data
Supplementary Fig. S1
Supplementary Fig. S2
Supplementary Fig. S3
Supplementary Fig. S4
Supplementary Fig. S5
Supplementary Fig. S6
Supplementary Fig. S7
Supplementary Fig. S8
Supplementary Fig. S9
Supplementary Fig. S10
Supplementary Table S1
Supplementary Table S2
References
Supplementary Material
Please find the following supplemental material available below.
For Open Access articles published under a Creative Commons License, all supplemental material carries the same license as the article it is associated with.
For non-Open Access articles published, all supplemental material carries a non-exclusive license, and permission requests for re-use of supplemental material or any part of supplemental material shall be sent directly to the copyright owner as specified in the copyright notice associated with the article.
