




Abstract
A triple network model consisting of a default network, a salience network, and a central executive network has recently been used to understand connectivity patterns in cognitively normal versus dysfunctional brains. This study aimed to explore changes in the dynamic connectivity of triplet network in mild traumatic brain injury (mTBI) and its relationship to cognitive performance. In this work, we acquired resting-state functional magnetic resonance imaging (fMRI) data from 30 mTBI patients and 30 healthy controls (HCs). Independent component analysis, sliding time window correlation, and k-means clustering were applied to resting-state fMRI data. Further, we analyzed the relationship between changes in dynamic functional connectivity (FC) parameters and clinical variables in mTBI patients. The results showed that the dynamic functional connectivity of the brain triple network was clustered into five states. Compared with HC, mTBI patients spent longer in state 1, which is characterized by weakened dorsal default mode network (DMN) and anterior salience network (SN) connectivity, and state 3, which is characterized by a positive correlation between DMN and SN internal connectivity. Mild TBI patients had fewer metastases in different states than HC patients. In addition, the mean residence time in state 1 correlated with Montreal Cognitive Assessment scores in mTBI patients; the number of transitions between states correlated with Glasgow Coma Score in mTBI patients. Taken together, our findings suggest that the dynamic properties of FC in the triple network of mTBI patients are abnormal, and provide a new perspective on the pathophysiological mechanism of cognitive impairment from the perspective of dynamic FC.
Introduction
Patients with mild traumatic brain injury (mTBI) have early cognitive deficits, primarily related to attention, executive, memory, and language deficits. It is estimated that up to 40-50% of patients with mTBI develop symptoms of cognitive impairment 3 months after injury, and 10-25% of patients remain symptomatic after 1 year. 1,2 Post-traumatic cognitive impairment may be associated with changes in brain function, which can be visualized by resting-state functional magnetic resonance imaging (rs-fMRI). Using this method, abnormal changes within brain networks have been shown to be associated with post-traumatic cognitive impairment in patients with mTBI, focusing on the default mode network (DMN), 3,4 central executive network (CEN), 5 and salience network (SN). 6,7 Considering that traumatic encephalopathy is a “disconnection syndrome,” post-traumatic cognitive abnormalities are not only manifested by damage to isolated brain regions, but also by altered information interactions across brain regions. 8
There are different patterns of interaction between the central executive network (ECN) and default mode network (DMN) in mTBI patients and there is a correlation between disconnected functional connectivity between these networks and measures of cognitive impairment. 9 Working memory tasks after mild traumatic brain injury were associated with altered patterns of connectivity between the DMN and the frontoparietal network. 10,11 Impaired emotion regulation in patients after mild traumatic brain injury was associated with abnormal connectivity patterns between the ECN and SN. 12 In addition, mild traumatic brain injury also exhibited abnormal functional connectivity coupling between the SN and the DMN. 13 These studies provide preliminary evidence for abnormal interactions among the triple brain network (including DMN, CEN, and SN) in mTBI.
The triple network model is a theoretical framework used to characterize the structural, 14 functional features of neurological disorders, and deficits in access, binding, and dissociation of the SN, CEN, and DMN may underlie maladaptive behaviors and cognitive deficits. However, time-averaged or static connectivity provides very limited information about the functional organization of brain circuits because the brain is not static, but rather a dynamic and complex system that is constantly changing on a microscopic time scale to adapt to its environment. 15
Previous studies 16 of functional connectivity in “mild brain injury” have assumed that the patient's brain function remains stable over an extended period of time (minutes or even longer), analyzing the functional network from a relatively “resting” perspective, but recent literature suggests that this assumption is not correct. 17 While lower temporal resolution has been considered a major disadvantage in functional MRI studies, the advent of “dynamic” functional network connectivity (dFNC) analysis has improved the temporal resolution of resting-state functional MRI data. Unlike the assumption of “static” connectivity throughout the functional MRI scan, “dynamic” analysis allows the connectivity between brain regions to vary over short periods of time. Thus, connectivity changes can be evaluated in the range of seconds rather than minutes. Dynamic FNC analysis can present different “connectivity states” of the brain, as well as the transition trajectories between them. Dynamic measures allow for a more sophisticated assessment of the spontaneous fluctuating nature of neural signals, may have behavioral relevance, and are increasingly being considered as new biomarkers of disease. 18 Therefore, it is essential to further understand the pathophysiological mechanisms of mTBI by studying and analyzing the dynamic interactions between SN, CEN, and DMN.
Independent component analysis (ICA) has been widely used to identify resting state networks (RSNs) because of its ability to isolate various brain functional networks. Meanwhile, dFNC can be used to represent the dynamic temporal correlations among these RSNs. ICA has been widely used to explore the interactions among CEN, DMN, and SN. 19 -21 In conclusion, this paper will explore the dynamic changes in brain networks of mTBI patients and their relationship with cognitive function within the framework of the triple network model of the brain, which can provide complementary insights to the information obtained from static functional connectivity analysis.
Methods
Participants
All subjects in this study were patients with mTBI who were seen at the Second Affiliated Hospital of Shantou University Medical College, Guangdong Province, from January 2021 to January 2022, and their cause of injury, age, and gender were recorded. Thirty patients with mTBI, 15 males and 15 females with a mean age of 35.96 years, received MRI scans all within 7 days of injury.
Inclusion criteria for patients with mTBI were as follows 22 : 1) age 18 years or older (right-handed); 2) history of head trauma; 3) initial Glasgow Coma Score (GCS) of 13-15 in the emergency department; 4) initial emergency department assessment for mTBI (loss of consciousness <30 min, post-traumatic amnesia <24 h, or documented altered mental status, such as drowsiness, coma, etc.); and 5) no significant abnormalities on computed tomography scan as part of their clinical evaluation. Exclusion criteria were as follows: 1) previous history of brain injury, neuropsychological or neurological disorders, psychotropic substance use, or concurrent substance abuse; 2) history of alcohol or drug abuse; 3) history of hospital or emergency department sedation; and 4) contraindications to MRI.
In addition, 30 healthy subjects (all right-handed; 12 men and 18 women; mean age: 32.07 years) matched for age, sex and education level were recruited as healthy controls (HC). The exclusion criteria for the normal control group were the same as those for the patient group. All normal controls underwent the same neuroimaging examinations as the mTBI patients. All subjects were examined by a professional neurologist regarding the Montreal Cognitive Assessment (MoCA) and Glasgow Coma Score (GCS) before receiving MRI. The ethical committee of the Second Affiliated Hospital of Shantou University Medical College approved the study. The investigator informed all subjects about the study and the MRI examination in advance, and all subjects signed a written informed consent form before participating in the experiment.
Imaging
Resting-state data were acquired using single-shot gradient-echo echo planar imaging sequence (repetition time [TR] = 2000 msec; echo time [TE] = 30 msec; flip angle [FA] = 90°; field of view [FOV] = 240 × 240 mm2; matrix size = 64 × 64; number of slices = 25; and voxel size = 3.43 × 3.43 × 5.0 mm3 with no gap; and 210 volumes acquired in 7 min). Sagittal three-dimensional T1-weighted images were acquired using a brain volume (BRAVO) sequence with the following parameters: TR = 8.15 msec; TE = 3.17 msec; FA = 9°; FOV = 256 mm × 256 mm; matrix = 256 × 256; slice thickness = 1 mm, no gap; 188 sagittal slices; and acquisition time = 250 sec. All data were collected using a 3T GE magnetic resonance scanner. All subjects were asked to rest with their eyes closed but not to fall asleep.
Image pre-processing
The resting- state fMRI data pre-processing steps were conducted using GRETNA toolbox. 23 The first 10 volumes were removed from each time series. Afterwards, slice-timing adjustment and realignment for head motion correction were performed. All of the subjects in this study satisfied our criteria for head motion with displacement <2 mm in any plane and rotation <2° in any direction. In addition, head movements measured by mean frame-wise displacement 24 did not differ between the two groups (HC = 0.12 ± 0.048, CO = 0.106 ± 0.053). Then, each subject's functional image was registered with the corresponding T1WI high-resolution image, and the T1WI image was segmented using tissue probability maps. Afterwards, each subject's functional phase image was normalized to the MNI standard brain template and resampled to 3 mm × 3mm × 3 mm. Finally, the normalized images were spatially smoothed using an isotropic Gaussian kernel of 6 mm full-width-at-half-maximum.
Independent component analysis
Independent component analysis (ICA) is a data-driven blind source separation method used to decompose multi-variate signals. Using spatial ICA on resting-state fMRI data, researchers have successfully extracted a variety of different functional components by identifying associated spontaneous fluctuations. We used the GIFT toolkit for ICA processing of preprocessed Rest-state fMRI data and construction of dFNC analysis. 25 The number of independent components (ICs) was determined using the minimum description length criterion. 26 Two data reduction steps (subject level and group level) were performed. We decompose the grouped data into 30 ICs using the Infomax algorithm 27 and repeat this step 100 times using the ICASSO algorithm 28 to assess the reproducibility or stability of the ICs. Finally, group-level ICs were de-reconstructed to each subject and converted to z-scores. Most brain functional network components were determined based on templates of previously studied functional networks 29 and visual inspections for subsequent analysis.
Finally, we determined the seven ICs, which correspond to the dorsal DMN (dDMN), precuneus network (PN), ventral DMN (vDMN), left CEN (LCEN), right CEN (RCEN), posterior SN (pSN), and anterior SN (aSN). In addition, we applied the following post-processing steps to the time course of each IC, including linear, quadratic, and cubic de-trending; multiple regression of the movement parameters; despising detected outliers; and low-pass filtering with a high-frequency cutoff of 0.15 Hz.
Dynamic functional network connectivity
Dynamic functional network connectivity (dFNC) is estimated by the sliding window method, which calculates the correlation values between components by dividing the segments from the sliding window. By convolving rectangular (width = 22TR) with Gaussian (σ = 3 TRs) for the time series of the seven ICs of interest, W = 178 sliding windows are obtained with a sliding step of 1TR. 15 Finally, a series of dynamic functional matrices (C × C × W) were obtained for each subject. To assess the frequency and structure of repeated dFNC states, we apply k-means clustering (using L1 distance functions) to the correlation matrix. Only seven ICNs matched by CEN, DMN, and SN were used in cluster analysis, yielding 7 × (7-1)/2 = 21 features. We use the elbow rule to determine the number of FNC states as 5. 15
We statistically evaluated the following dynamic connectivity measures: 1) fraction times (the percentage of total time a subject spent in a given state); 2) dwell times (the time a subject spent in a state without switching to another one); 3) numbers of transitions (how often a subject changed states); and 4) transition likelihoods (percentages of transition likelihood between the k connectivity states). Additionally, we tested for group differences in dynamic connectivity pairs within each connectivity state.
Statistical analysis
Statistical analysis was performed using GraphPad Prism 6.0. The t-test for normally distributed data, the Mann-Whitney U test for non-normally distributed data, and the chi-squared test for categorical data were used to analyze differences in demographic and clinical characteristics between groups. To determine significant inter-group differences in dFNC time characteristics, we performed inter-group comparisons using the Mann-Whitney U test, and the statistical significance threshold was set to p < 0.05, and false discovery rate (FDR) was used for multiple comparison and correction. For each dFNC parameter showing significant inter-group differences, Spearman correlation analysis was performed to investigate the relationship between the time characteristics of changes and clinical measurements in the mTBI patient group. The results were considered significant at p < 0.05. In addition, a two-sample t-test was performed to investigate inter-group differences in instantaneous functional connection strength at each state, with statistical thresholds set to false discovery rate (pFDR) corrected threshold, p < 0.05.
Results
Demographics and clinical characteristics
As shown in Table 1, there were 30 cases each of mTBI patients and normal controls, and the differences between the two groups in terms of age and sex ratio were not statistically significant (all p values >0.05), indicating that the characteristics of the populations were matched. The mTBI patient group had a MoCA score of 17.36 ± 6.03, and the normal controls group had a MoCA score of 27.70 ± 1.11, which was significantly lower than the normal control group, with a statistically significant difference (p < 0.05). The mTBI patient group had a GCS score of 13.83 ± 0.83 and Rivermead Post-Concussion Symptom Questionnaire score of 15.70 ± 7.36.
Demographic and Clinical Characteristics
p < 0.05.
Data are presented as ± standard deviation.
MoCA, Montreal score; Rivermead, Rivermead Post-Concussion Symptom Questionnaire score; GCS, Glasgow Coma Score.
Identification of resting-state functional networks of interest
As shown in Figure 1, seven ICs were selected from 30 ICs (one sample t-test, p < 0.01, family-wise error rate corrected), namely dDMN (IC22), PN (IC17), vDMN (IC25), RCEN (IC11), LCEN (IC15), aSN (IC29), and pSN (IC23). We used visual inspection to select the one component with the most similar spatial component based on the brain network template provided by previous studies. 29 All components were visually confirmed by three researchers with many years of experience in brain imaging data processing, and when different observers disagreed on the attribution of components, the results were based on the discussion among all observers, with details referring to Supplementary Figure S1.
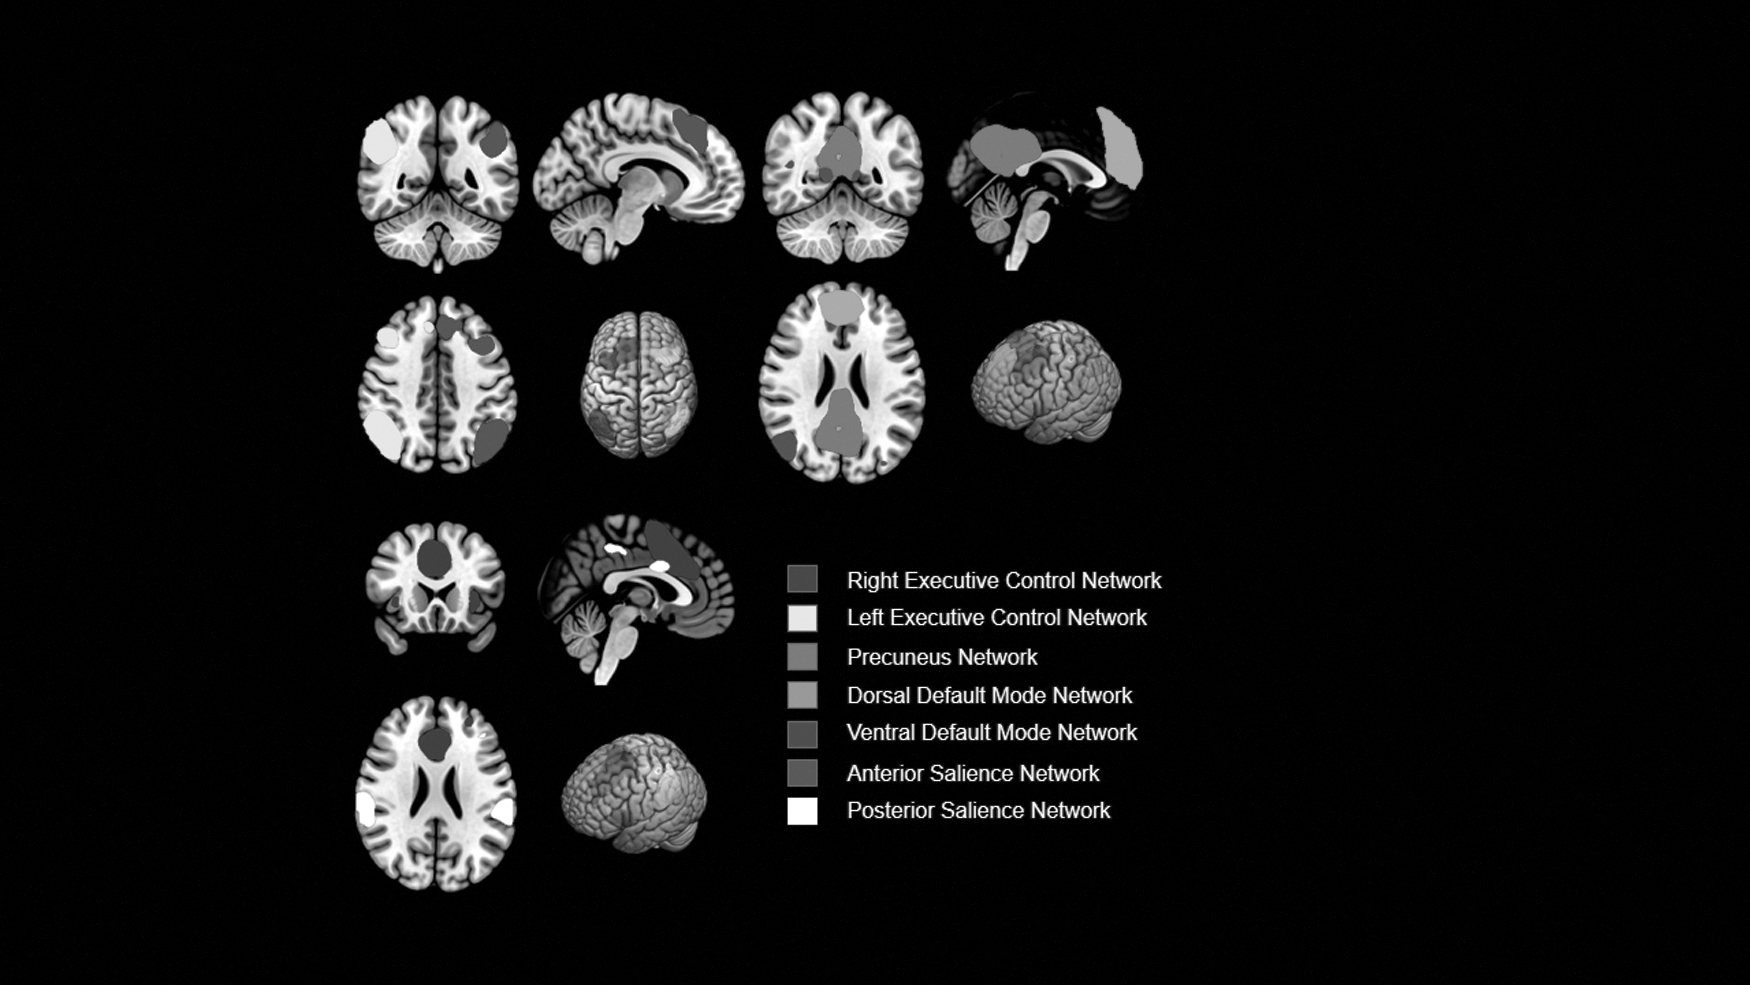
Group-level independent component analysis was used to identify these networks. Maps are displayed at Z > 2.0 (one sample t-test, p < 0.01, family-wise error rate corrected).
dFNC states and properties
Figure 2 shows the five FNC states that recurred between individual scans and subjects, along with their timing and percentage of occurrence. In state 1, PN, dDMN, and LCEN were positively correlated, while SN was weakly negatively correlated with PN, dDMN, and LCEN. In state 2, the FNC was very sparse in the triple network of the brain. In state 3, DMN was positively correlated with SN intra-network connectivity and SN was weakly negatively correlated with DMN. In state 4, SN was significantly negatively correlated with DMN and LCEN, SN was significantly positively correlated with DMN intra-network connections, and in addition, LCEN was significantly positively correlated with DMN. In state 5, DMN, SN, and ECN intra-network connections were positively correlated, SN was negatively correlated with DMN and ECN, and DMN was positively correlated with ECN.

Cluster centroid and its total number of occurrence (percentage) for each state. The grayscale bar represents z value of functional connectivity. dDMN, dorsal default mode network; LCEN, left central executive network; pN, precuneus network; vDMN, ventral default mode network; RCEN, right central executive network; aSN, anterior salience network; pSN, posterior salience network.
For dFNC temporal characteristics, connection strength (two independent samples t-test, pFDR <0.05), we found that mTBI patients had significantly increased fractional windows and dwell times in state 1 compared with controls (Table 2). However, the score window and dwell time were significantly reduced in state 3. In addition, the number of transitions between states was significantly reduced in mTBI patients. We also compared the connection strength between groups in each state and found that mTBI patients had significantly enhanced transient connection strength between dDMN and aSN in state 1 (Fig. 3).
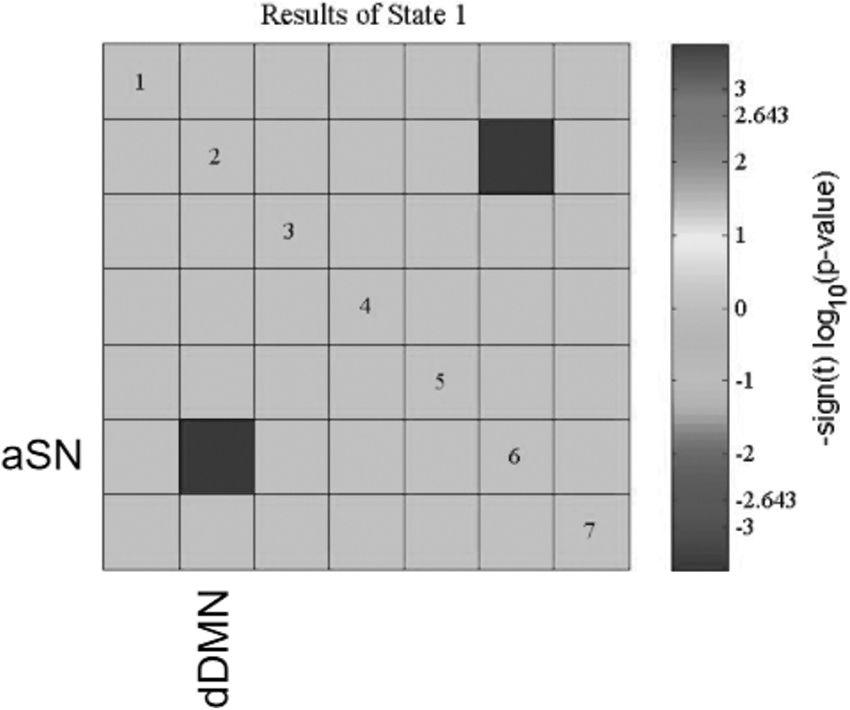
The functional connectivity of aSN to dDMN was significantly reduced in state 1 in mTBI patients compared with healthy controls. Dark rectangles indicate significance (p < 0.05, false discovery rate corrected). dDMN, dorsal default mode network; aSN, anterior salience network.
Results of Mann–Whitney U Test
p < 0.05, false discovery rate corrected.
Data are presented as median (range).
Relationship between dFNC states and properties and clinical symptoms
We did Spearman correlation analysis of the temporal characteristics of the states with significant group differences with clinical assessment. The results showed that MoCA scores of mTBI patients were positively correlated with the score window of state 1 and the mean lag time (Fig. 4A, 4B); GCS scores of mTBI patients were positively correlated with the number of transitions between states (Fig. 4C).
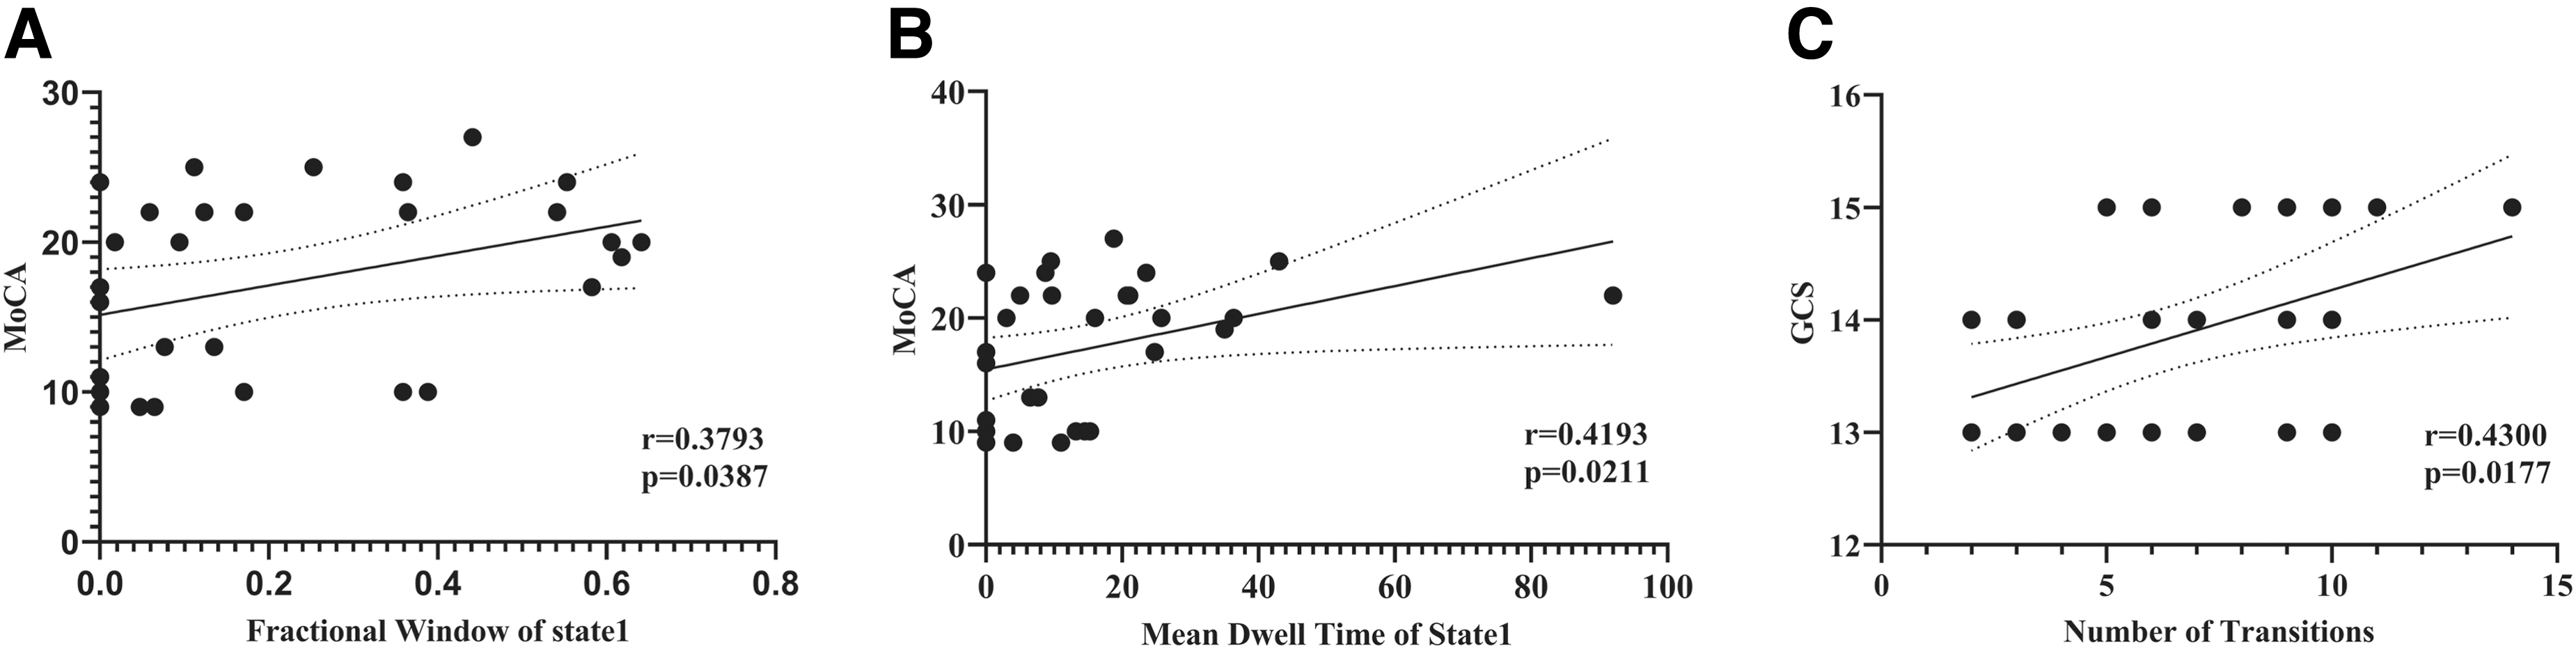
For mild traumatic brain injury patients,
Discussion
This study analyzed the dFNC in a triple network of mTBI patients, emphasizing the temporal characteristics of the dFNC states and the variability of the dFNC. The main findings are as follows: 1) the dFNC in the triple network can be divided into five configuration states, four of which show dense connections (states 1, 3, 4 and 5) and one shows sparse connections (state 2); 2) the analysis of the temporal characteristics of the dFNC states showed that mTBI patients spent more time in both state 1 than controls, with significantly reduced fractional windows and dwell times, and state 1 The instantaneous connection strength was reduced in state 1; the time spent in state 3 was reduced compared with controls, and the fractional window and dwell time were significantly reduced; 3) correlation analysis of the temporal properties of dFNC showed that the temporal properties of state 1 were significantly correlated with patients' neurocognitive performance; and 4) the number of transitions between states was significantly correlated with patients' GCS scores. These results further validate the abnormal alterations of dFNC in the brain of mTBI patients 30 –33 and establish the relationship between clinical symptoms of mTBI and the temporal characteristics of dFNC, providing clinicians with potential imaging biological markers to detect the presence of neuronal damage in mTBI patients and to monitor the severity of their condition. The dFNC provides new insights to further understand the pathophysiological mechanisms of mTBI and highlights the importance of assessing dynamic changes in brain connectivity.
Compared with controls, mTBI patients spent more time in state 1 and showed a stronger negative correlation between dDMN and aSN in the mTBI group in state 1 (Fig. 3). According to the literature, the failure to inhibit the default mode network usually interferes with normal brain network interactions. 34 More importantly, in patients with persistent neurological symptoms after head injury, the failure of inhibition of the default mode network by the salience network was found to be associated with the amount of damage to the white matter fiber tracts connecting the right anterior insula and the midline anterior supplementary motor area, leading to a failure of behavioral inhibition. 35 And indeed, our further correlation analysis revealed that we found a positive correlation between the score window, mean lag time and MoCA scores for state 1 in mTBI patients (Fig. 4A, 4B). The MoCA is a rating tool used to provide rapid screening for abnormalities in cognitive functioning and includes eight cognitive domains including attention and concentration, executive function, memory, language, vision, abstract thinking, computation, and orientation. Therefore, it is reasonable to assume that state 1 is a compensatory state for mTBI patients to meet their cognitive needs.
It is worth pointing out that the results of the present study also found that mTBI patients spent less time in state 3, which has not been previously reported about in mTBI. State 3 showed relatively strong connectivity within the DMN network, a significant negative correlation between DMN and SN, and a strong integration of aSN and pSN. Based on the results of previous studies, 15,36,37 we hypothesize that state 3 is related to thinking about others, and this state is highly overlapping with the brain's “social network.” Thus, we hypothesized that the reduced lingering time in state 3 might be associated with reduced ability to talk to people and impaired emotion regulation in mTBI patients. Unfortunately, we were unable to find a significant correlation between the temporal properties of state 3 and Rivermead Post-Concussion Symptom Questionnaire scores in the present study, and further research is needed to explore the biological value of state 3.
Another important finding of our study is the reduced ability of mTBI patients to switch between different FC states within the triple network, characterized by a reduced number of state transitions. Healthy individuals dynamically switch between different FC states in order to meet changing task demands and can recruit necessary resources faster. 38 In resting-state functional imaging studies of healthy individuals, the probability of transitioning positively correlated with executive function measures, indicating greater functional dynamics and cognitive flexibility. 39 Similar findings have been found in other neurological disorders, for example, in Parkinson's patients, 40 the number of state transitions was positively correlated with cognitive performance and in epilepsy patients, 41 a higher number of transitions was negatively correlated with disease duration. These findings all seem to suggest that a lower number of state transitions is associated with brain disease states, although more research is needed to further prove this. In addition, our study found that patients' state of consciousness was associated with a reduced number of dFNC transitions (Fig. 4C).
There are several limitations to this study. First, dynamic FC analysis is a relatively new method, and gold standards for analysis parameter settings, such as window length and step size, have not yet been established. Inconsistent parameter settings may affect the analysis results. Second, it has been suggested that both high temporal resolution and sufficiently long acquisition time are important factors for reliable results in dynamic FC analysis, 42 and we only collected 7 min of data from each participant in the current study. In future studies, we will utilize longer functional MRI scan times, such as ten minutes, to improve dFNC variability estimation. Finally, the lack of longitudinal studies prevents in-depth exploration of disease translation. Our research team is regularly following recruited volunteers, and we plan to further explore longitudinal changes in dFNC in the future.
Conclusions
The dFNC characteristics in the triple network of mTBI patients were investigated using rs-fMRI data, combined with ICA, sliding window methods and k-means clustering analysis. The results showed that the dynamic FC characteristics of the triple network in mTBI patients were altered compared with HCs, including a longer time in state 1, a reduced time in state 3, and a reduced number of transitions between states. In addition, the altered dFNC properties in mTBI patients were associated with cognitive performance. The present study provides new insights into the pathophysiological mechanisms of mTBI patients from the perspective of dFNC.
Ethics Statement
The studies involving human participants were reviewed and approved by the Second Affiliated Hospital, Medical College of Shantou University. Written informed consent to participate in this study was provided by the participants' legal guardian/next of kin.
Footnotes
Authors' Contributions
WZ: Review and editing (lead); project administration (lead). HL: Conceptualization (lead); writing—original draft (lead); formal analysis (lead); writing—review and editing (equal). GZ and HZ: Methodology (lead); software (lead). WZ and HT: Funding acquisition (lead). HT, JZ, WL and BW: Investigation (lead); visualization (lead). All authors contributed to the article and approved the submitted version.
Funding Information
This study was funded by the Provincial Science and Technology Innovation Strategic Special Project to Support City and County, Guangdong Province, China (Grant Number: 2023-37, and was supported by the Joint Research Fund for Enterprise and basic and applied basic research Programs of Guangdong Province of China (Grant Number: 2021A1515 220112). WZ has received these research grants. This study was funded by the Foundation of Medical Health Science and Technology Project of Shantou City (Grant No. [2022]169-53), Guangdong Province, China, HT has received this research grant.
Author Disclosure Statement
The authors declare that the research was conducted in the absence of any commercial or financial relationships that could be construed as a potential conflict of interest.
Supplementary Material
Supplementary Figure S1
References
Supplementary Material
Please find the following supplemental material available below.
For Open Access articles published under a Creative Commons License, all supplemental material carries the same license as the article it is associated with.
For non-Open Access articles published, all supplemental material carries a non-exclusive license, and permission requests for re-use of supplemental material or any part of supplemental material shall be sent directly to the copyright owner as specified in the copyright notice associated with the article.
