




Abstract
The extant literature investigating the relationship between diffusion tensor imaging (DTI) and cognition following traumatic brain injury (TBI) is limited by small sample sizes and inappropriate control groups. The present study examined DTI metric differences between service members and veterans (SMVs) with bodily injury (Trauma Control; TC), uncomplicated mild TBI (mTBI), complicated mild TBI (compTBI), and severe-moderate TBI combined (smTBI), and how DTI metrics related to cognition within each group. Participants were 226 SMVs (56 TC, 112 mTBI, 29 compTBI, 29 smTBI) with valid neuropsychological testing and DTI at least 11 months post-injury. The smTBI group demonstrated decreased fractional anisotropy (FA) and increased axial diffusivity (AD), mean diffusivity (MD), and radial diffusivity (RD) of the cerebral white matter (CWM) and several individual white matter tracts compared with the TC, mTBI, and compTBI groups (all ps < 0.05; rs = 0.17 to 0.49). The TC, mTBI, and compTBI groups did not differ in terms of any DTI metrics. Within the smTBI group, FA, AD, MD, and RD of the total CWM and several white matter tracts were related to Processing Speed (|rs|: 0.43 to 0.66; ps < 0.05), and/or Delayed Memory (|rs|: 0.41 to 0.67; ps < 0.05). In the compTBI group, Processing Speed was related to left arcuate fasciculus and superior longitudinal fasciculus (SLF) FA, MD, and RD, as well as left uncinate fasciculus MD and RD. In contrast, there were no significant relationships between DTI metrics and cognition/emotional functioning within the mTBI or TC groups. Overall, findings suggest a dose-response relationship between TBI severity and the strength of the relationship between white matter integrity and cognitive performance, with essentially no relationship in mTBI, some findings in compTBI, and several strongly significant relationships in smTBI. In contrast to previously reported findings, there were no differences in DTI metrics between controls, mTBI, and compTBI, and DTI metrics were unrelated to cognition in our relatively large mTBI group.
Introduction
Diffusion tensor imaging (DTI) is commonly used as a research technique to evaluate brain damage following traumatic brain injury (TBI). 1 –4 DTI reveals alterations in white matter through quantification of the dispersion of water molecules in axons, 5 allowing for investigation of axonal integrity.
There have been many studies on DTI and cognition following TBI, with somewhat contradictory findings. Two recent meta-analyses were conducted to investigate the relationship between DTI and cognition following TBI. 6,7 Wallace and colleagues 6 concluded that memory was strongly associated with fractional anisotropy (FA) in the corpus callosum, fornix, and total white matter, and mean diffusivity (MD) in the total white matter. Attention was strongly associated with FA in the corpus callosum (CC), arcuate fasciculus, fornix, and superior longitudinal fasciculus (SLF), and MD in the internal capsule and uncinate fasciculus.
Zhang and colleagues 7 considered FA, MD, axial diffusivity (AD), and radial diffusivity (RD). They found memory related to white matter integrity in the fornix and cingulum, attention/processing speed related to white matter integrity in the CC and internal capsule, and executive functioning related to white matter integrity in the CC, SLF, and internal capsule. The authors concluded that FA was the most sensitive DTI metric for detecting cognitive decline, with specific white matter tracts, including the CC, SLF, and internal capsule, more useful than whole brain white matter integrity. 7 These authors also noted the small sample sizes of the included studies as a main limitation.
After these meta-analyses were published, Wallace and colleagues 8 conducted an independent study investigating the relationship between DTI and cognition in a relatively large sample of patients with mild TBI (mTBI; n = 134) and severe-moderate TBI (smTBI; n = 31), and a combined control group consisting of both orthopedic and healthy controls (n = 106) approximately 7 months post-injury. The investigators found that FA was decreased and MD was increased in all of these regions relative to controls. In contrast, they did not find any difference in FA or MD within the CC, fornix, or SLF between the mTBI group and controls. Neither FA nor MD in any of the regions was associated with performance on cognitive measures (non-verbal delayed memory, reaction time, phonemic verbal fluency) within the smTBI group.
Further, Mohamed and colleagues 9 investigated 23 Vietnam veterans with smTBI, 36 with smTBI and posttraumatic stress disorder (PTSD), 53 with PTSD an average of 50 years following trauma, and 48 veterans without a service-related injury. They found that lower FA and higher MD in several regions correlated with the Boston Naming Test, Montreal Cognitive Assessment (MOCA), and Mini-Mental State Examination (MMSE) in each of the three trauma groups; however, the regions that correlated with cognition differed between MOCA and MMSE, as well as between the three trauma groups.
Overall, the literature investigating the relationship between DTI and cognition following TBI is limited due to small sample sizes, 6,7 as well as the lack of appropriate control groups. 3 Additionally, prior research largely consisted of DTI metrics derived from canonical regions (i.e., using the Mori atlas), 10 skeletonizing the FA map with Tract-Based Spatial Statistics, 11 and diffusion magnetic resonance imaging (MRI) fiber tractography. 12 Recently, white matter bundle segmentation using diffusion MRI fiber tractography has been considered the optimal method for identifying white matter fiber pathways in vivo in human brains. 13 Diffusion MRI fiber tractography offers unprecedented insight into the structural connections of the human brain and is currently the only tool to map the long-range structural brain connectivity in vivo.
The present study aimed to investigate differences in DTI metrics between service members and veterans (SMVs) with (1) bodily injuries without TBI, 14 (2) uncomplicated mTBI, (3), complicated mild TBI (compTBI), and (4) smTBI combined presenting for evaluation 1 year or more post-injury using a tract-based approach to measure DTI metrics. Further, this study aimed to examine how DTI metrics that differ between these four groups are differentially related to cognition. Per prior research, we hypothesized that FA in each tract would be reduced in mTBI compared with controls and reduced in smTBI compared with all other groups, whereas MD and RD in each tract would be increased in mTBI relative to controls and increased in smTBI compared with all other groups.
Methods
Participants
Participants were 226 U.S. SMVs (mean age = 38.2 years, standard deviation [SD] = 10.4; mean education = 15.0 years, SD = 2.3) prospectively enrolled in the Defense and Veterans Brain Injury Center (DVBIC)/Traumatic Brain Injury Center of Excellence (TBICoE) 15-Year Longitudinal TBI Study. Patients were targeted for recruitment and consent at four medical treatment facilities from hospital inpatient wards, outpatient clinics, intensive TBI treatment programs, and community events. This research was conducted in accordance with the Declaration of Helsinki guidelines and approved by the Walter Reed National Military Medical Center (WRNMMC) Institutional Review Board (IRB). Written informed consent was obtained from all participants.
Participants were enrolled in the larger study if they were: an active-duty service member or other Defense Enrollment Eligibility Reporting System-eligible (i.e., eligible to receive military benefits) veteran, and 18 years of age or older and could read and understand English. General exclusion criteria included: a lack of proficiency in conversational English, or a history of significant neurological or psychiatric condition(s) unrelated to the injury event or deployment (e.g., meningioma, bipolar disorder).
For this study, participants were selected from a larger sample of 261 injured controls and TBI participants who underwent MR imaging 11 or more months following their injury. Two individuals who did not undergo neuropsychological testing were excluded. Patients were excluded for invalid neuropsychological test data (n = 31). Individuals with a history of penetrating TBI were also excluded (n = 2). This resulted in a final sample of 226 participants separated into four groups: (1) TC (soft-tissue/orthopedic injury with no lifetime history of TBI; n = 56), (2) uncomplicated mTBI (mTBI, n = 112), (3) complicated mild TBI (compTBI, n = 29), and (4) severe-moderate TBI combined (smTBI; n = 29).
TBI evaluation and classification
Diagnosis and classification of TBI has been described in detail previously. 15 –18 Briefly, a comprehensive lifetime TBI history including the Ohio State University TBI identification method and an extended semi-structured clinical interview was conducted along with medical record review. TBI severity was classified as follows: (a) uncomplicated mTBI (n = 112): (i) Glasgow Coma Scale (GCS) score = 13–15, posttraumatic amnesia (PTA) <24 h, loss of consciousness (LOC) <30 min, and/or alteration of consciousness (AOC) present, and (ii) no trauma-related intracranial abnormality on computed tomography (CT) or structural MRI; (b) complicated mTBI (n = 29): (i) GCS score = 13–15, PTA <24 h, LOC <30 min, and/or AOC present, and (ii) trauma-related intracranial abnormality on CT or MRI; (c) moderate TBI (n = 15): LOC 30 min to 24 h, PTA 1–7 days, and/or lowest reliable GCS score (e.g., not intubated/sedated/intoxicated) of 9–12 > 30 min post-injury; and (d) severe TBI (n = 14): LOC >24 h, PTA >7 days, and/or lowest reliable GCS score >30 min post-injury of <9.
Measures and procedure
The study visit was conducted over a 2- to 3-day period and included clinical interviews, neuroimaging, and a 5-h neuropsychological battery.
Neuropsychological Assessment
Neuropsychological summary scores included those of the Wechsler Adult Intelligence Scale-IV (WAIS-IV) 19 Processing Speed Index, Working Memory Index, and Perceptual Reasoning Index; and the Wechsler Memory Scale-IV (WMS-IV) 20 Immediate Memory Index and Delayed Memory Index (Logical Memory, Visual Reproduction, and California Verbal Learning Test-II). 21 An executive functioning index was computed by averaging scores on the Delis-Kaplan Executive Functioning System (D-KEFS) 22 Verbal Fluency Letter Fluency, D-KEFS Color-Word Interference Test Inhibition, WAIS-IV Similarities, and Trail Making Test B. 23 The Test of Premorbid Functioning 24 was administered to estimate premorbid cognitive functioning. The presence of mild neurocognitive disorder (MNCD) was defined as any cognitive index score falling ≥1 SD below the normative mean (i.e., a standard score of 85 or below).
Participants (n = 31) were excluded if they (a) failed any one stand-alone performance validity test (Medical Symptom Validity Test, 25 Test of Memory Malingering, 26 or Advanced Clinical Solutions Word Choice Test) 24 and/or (b) failed at least two embedded performance validity measures (WAIS-IV Reliable Digit Span, WMS-IV Logical Memory, and WMS-IV Visual Reproduction). 18
PTSD symptoms were assessed with the PTSD Checklist-Civilian version (PCL-C), 27 a 17-item measure designed to assess the Diagnostic and Statistical Manual of Mental Disorders Text Revision, 4th edition (DSM-IV-TR) 28 symptom criteria for PTSD. Total score was used to represent total PTSD symptom burden and individual item responses were mapped onto DSM-IV 28 criteria B, C, and D for PTSD. Individuals who met criteria B, C, and D for PTSD based on mild or greater endorsement of the requisite items were considered to have met criteria for PTSD.
The Minnesota Multiphasic Personality Inventory-2nd Edition-Restructured Form (MMPI-2-RF) 29 was also administered and the Emotional/Internalizing Dysfunction scale was evaluated. Participants were excluded from analyses involving self-reported PTSD symptoms or emotional/internalizing dysfunction if the MMPI-2-RF was considered invalid and/or over- or under-reporting was indicated (i.e., VRIN ≥80T, TRIN ≥80T, F-r = 120T, Fp-r ≥100T, FBS-r ≥100T, RBS ≥100T, Fs ≥100T, Lr ≥80T, Kr ≥70T), or if they skipped too many items (i.e., Cannot Say >14).
Neuroimaging
Participants underwent MR imaging at the WRNMMC. 30,31 MR imaging was performed on a 3T scanner. Preprocessing of diffusion-weighted imaging (DWI) data included correction of echo planar imaging geometric distortion using a B0 fieldmap 32 and correction of motion and eddy current artifacts and digital brain extraction (skull stripping) using software from the FSL toolkits. 33 To further detect and exclude potential outliers prior to tensor estimation, we applied the robust estimation of tensors by the outlier rejection (RESTORE) 34 method shown to be effective in improving tensor estimation on a voxel-by-voxel basis in the presence of physiological noise artifacts in DWI data. 35 This avoids manual and subjective identification of corrupted DWI images and appears to be particularly valuable for data with frequent motion corruption. 36
DTI scalar images (i.e., FA, AD, MD, RD), were created using the RESTORE method. 34 Total cerebral white matter (CWM) was segmented based on the structural T1-weighted image. Bilateral CWM was mapped to DWIs, and tract-of-interest (TOI) analysis was applied. To implement bundle-specific tractography for TOI analysis, an automated method using a convolutional neural-network-based approach, TractSeg segmentation pipeline, 37 was applied to reconstruct 16 TOIs: forceps minor (CC1), forceps major (CC7), and genu (CC2) and body (CC5) of the corpus callosum, as well as bilateral arcuate fasciculus, SLF-III (arcuate fasciculus and SLF-III make up most of the SLF), inferior longitudinal fasciculus (ILF), uncinate fasciculus, fornix, and cingulum. 6,7 To map DTI metrics along streamlines, we implemented tractometry 38 by resampling streamlines, assigning and averaging the DTI metrics for each centroid segment for all assigned streamline segments within the diffusion native space. Finally, the mean DTI metrics of each segmented WM tract were calculated for further group comparisons by averaging and weighting the voxels within the “core” more heavily than those voxels at the outer extremity of the bundle that are only traversed by a small fraction of the streamlines in the pathway.
Statistical analysis
The four participant groups (TC, mTBI, compTBI, smTBI) were first compared in terms of demographics and DTI metrics through analysis of variance (ANOVA), Kruskal-Wallace tests, and Mann-Whitney U tests. Effect sizes were calculated with Cohen's d for parametric data and r for non-parametric data. 39 For between-group comparisons of DTI metrics, the Benjamini-Hochberg false discovery rate (FDR) method 40 was used to keep the FDR at 0.05 within each set of between-group comparisons (e.g., correcting for each of the four DTI parameters: FA, AD, MD, and RD) for 16 tracts and left and right total CWM, for a total of 72 comparisons).
Spearman correlations were conducted with neuropsychological summary scores within each of the four groups. When correlations between the 72 DTI metrics and eight neuropsychological summary scores were significant, the FDR method was used to keep the FDR at 0.05, correcting separately for 72 DTI metrics within each injury group and cognitive domain. Exploratory Mann-Whitney U tests investigating the relationship between biomarkers for individuals who did versus did not meet criteria for MNCD and PTSD were run within the TC group, mTBI group, and a combined compTBI and smTBI group (given the small sample size), similarly using the FDR to correct for 72 comparisons within each group. All analyses involving self-report data were conducted only in individuals who passed symptom validity measures.
Results
Group differences in demographics and DTI metrics
In terms of demographic differences, SMVs in the mTBI group were evaluated at a longer time after their injury compared with those in the compTBI and TC groups (ps < 0.004, Cohen's ds: 0.47 to .055). There were no other demographic differences between the groups, nor differences in time since injury, predicted pre-morbid Full Scale Intelligence Quotient (FSIQ), or PCL-C total score (Table 1).
Demographics and Injury and Clinical Characteristics by Injury Group
For the PCL-C, sample sizes were: TC, n = 50; mTBI, n = 92; compTBI, n = 27; Mod-Sev, n = 25.
B-F, Brown Forsythe; compTBI, complicated mild traumatic brain injury; FSIQ, Full Scale Intelligence Quotient; M, mean; Mod-Sev, moderate-severe traumatic brain injury; mTBI, uncomplicated mild traumatic brain injury; PCL-C, Posttraumatic Stress Disorder Checklist-Civilian Version; SD, standard deviation; TC, trauma control.
In terms of DTI metrics, significant effect sizes ranged from small to large (i.e., 0.1 < r < 0.5; Table 2). After correcting for multiple comparisons, the TC, mTBI, and compTBI groups did not differ in terms of any DTI metrics. In contrast, compared with the TC group, the smTBI group had lower FA and higher AD, MD, and RD in all tracts except for bilateral arcuate fasciculus FA, cingulum AD, uncinate fasciculus FA, and SLF-III AD, and left SLF-III FA, MD, and RD. Compared with the mTBI group, the smTBI group had lower FA and higher AD, MD, and RD in all tracts except for forceps major AD, MD, and RD, bilateral arcuate fasciculi FA, left SLF-III FA, right ILF AD, and right uncinate fasciculus FA. The smTBI group had lower FA and higher AD, MD, and RD compared with the compTBI group in terms of total CWM MD and RD bilaterally, right total CWM FA, genu FA, MD, and RD, CC body AD and MD, right arcuate fasciculus MD and RD, bilateral cingulum FA, MD, and RD, right cingulum AD, right fornix FA, bilateral ILF AD, MD, and RD, right SLF-III FA, MD, RD, bilateral uncinate fasciculus AD, MD, RD, and left uncinate fasciculus FA (rs = 0.30 to 0.46, ps < 0.05).
DTI Metrics between Injury Groups
p < 0.001, survived Benjamini-Hochberg false discovery rate correction; b p < 0.005, survived Benjamini-Hochberg false discovery rate correction; c p < 0.01, survived Benjamini-Hochberg false discovery rate correction; d p < 0.05, survived Benjamini-Hochberg false discovery rate correction; e p < 0.005, did not survive Benjamini-Hochberg false discovery rate correction; f p < 0.05, did not survive Benjamini-Hochberg false discovery rate correction.
In the mTBI group, one individual was missing right fornix DTI metrics. In the compTBI group, one individual was missing right fornix DTI metrics. In the smTBI group, four individuals were missing left fornix DTI metrics and two individuals were missing right fornix DTI metrics.
AD, axial diffusivity; AF, arcuate fasciculus; CC1, forceps minor; CC2, genu; CC5, body; CC7, forceps major; CG, cingulum; compTBI, complicated mild traumatic brain injury; CWM, total cerebral white matter; DTI, diffusion tensor imaging; FA, fractional anisotropy; FX, fornix; ILF, inferior longitudinal fasciculus; IQR, interquartile range; K-W, Kruskal-Wallis; L, left; MD, mean diffusivity; Med, median; smTBI, severe-moderate traumatic brain injury; mTBI, uncomplicated mild traumatic brain injury; R, right; RD, radial diffusivity; SLF, superior longitudinal fasciculus; TC, trauma control; UF, uncinate fasciculus.
White matter integrity and neuropsychological functioning
Spearman correlations were run within each injury group separately between each of the DTI metrics and the eight neuropsychological summary scores (Table 3). Within the smTBI group, Processing Speed and Delayed Memory were related to several DTI metrics after correction for multiple comparisons, with FA positively related to performance and AD, MD, and RD negatively related to performance in all cases.
Spearman Correlations between DTI and Neuropsychological Findings
p < 0.01, survived Benjamini-Hochberg false discovery rate correction; b p < 0.05, survived Benjamini-Hochberg false discovery rate correction; c p < 0.01 level (two-tailed), did not survive Benjamini-Hochberg false discovery rate correction; d p < 0.05, did not survive Benjamini-Hochberg false discovery rate correction.
In the TC group, one individual was missing data in each of the following cognitive domains: PRI, WMI, IMI, DMI, EFI. In the mTBI group, three individuals were missing PRI, six were missing WMI, one was missing PSI, four were missing IMI, four were missing DMI, and four were missing EFI; additionally, one individual was missing right fornix DTI metrics. In the compTBI group, one individual was missing IMI, one was missing DMI, and one was missing EFI, whereas a separate individual was missing right fornix DTI metrics. In the smTBI group, no individuals were missing cognitive data, but four individuals were missing left fornix DTI metrics and two individuals were missing right fornix DTI metrics. Missing data were not replaced. For self-report data sample sizes were: TC, n = 50; mTBI, n = 92; compTBI, n = 27 (in this group, one individual was missing right DTI metrics); smTBI, n = 26 (in this group one individual was missing PCL-C; three individuals were missing left fornix DTI metrics and one individual was missing right fornix DTI metrics)
AD, axial diffusivity; AF, arcuate fasciculus; CC1, forceps minor; CC2, genu; CC5, body; CC7, forceps major; CG, cingulum; CG, cingulum; compTBI, complicated mild traumatic brain injury; CWM, total cerebral white matter; DMI, Delayed Memory Index; EFI, Executive Functioning Index; EID, Minnesota Multiphasic Personality Inventory-2-Revised Emotional/Internalizing Dysfunction; FA, fractional anisotropy; FX, fornix; ILF, inferior longitudinal fasciculus; IMI, Immediate Memory Index; IQR, interquartile range; K-W, Kruskal-Wallis; L, left; MD, mean diffusivity; smTBI, severe-moderate traumatic brain injury; mTBI, uncomplicated mild traumatic brain injury; PCL, Posttraumatic Stress Disorder Checklist-Civilian Version total score; PRI, Perceptual Reasoning Index; PSI, Processing Speed Index; R, right; RD, radial diffusivity; SLF, superior longitudinal fasciculus; TC, trauma control; UF, uncinate fasciculus; WMI, Working Memory Index.
Processing Speed was associated with bilateral total CWM FA, right total CWM MD and RD, forceps minor, genu, forceps major, and right ILF FA, AD, MD, and RD, right arcuate fasciculus MD and RD, left cingulum RD, right cingulum FA, MD, and RD, right fornix FA, MD, and RD, right SLF-III RD, and left ILF FA.
Within the smTBI group, Delayed Memory was associated with genu and bilateral fornix FA, AD, MD, and RD, bilateral total CWM, SLF-III, and arcuate fasciculus AD, MD, and RD, forceps minor AD and MD, CC body AD, bilateral UF AD, MD, right cingulum AD and MD, and left ILF AD. There were also some associations with Perceptual Reasoning, Working Memory, Immediate Memory, Executive Functioning, and MMPI-2-RF Emotional/Internalizing Dysfunction; however, none of these survived correction for multiple comparisons.
Within the compTBI group, Processing Speed was associated with left arcuate fasciculus and SLF-III FA, MD, and RD, as well as left uncinate fasciculus MD and RD. There were also several other associations between DTI metrics and Processing Speed, Perceptual Reasoning, Working Memory, and Executive Functioning within the compTBI group; however, these did not survive correction for multiple comparisons.
Within the mTBI group, there were some associations between DTI metrics and Processing Speed, Immediate Memory, Delayed Memory, PTSD symptoms, and MMPI-2-RF Emotional/Internalizing Dysfunction; however, none of these survived correction for multiple comparisons.
Similarly, within the TC group, there were some associations between DTI metrics and Processing Speed, Working Memory, Immediate Memory, Delayed Memory; however, after applying the FDR correction, none of these correlations remained significant. Within the TC group, no DTI metrics were related to Perceptual Reasoning, Executive Functioning, MMPI-2-RF EID, or PCL-C total score. See Figure 1 for sample scatterplots showing the differential relationship between DTI metrics and Processing Speed/Delayed Memory.
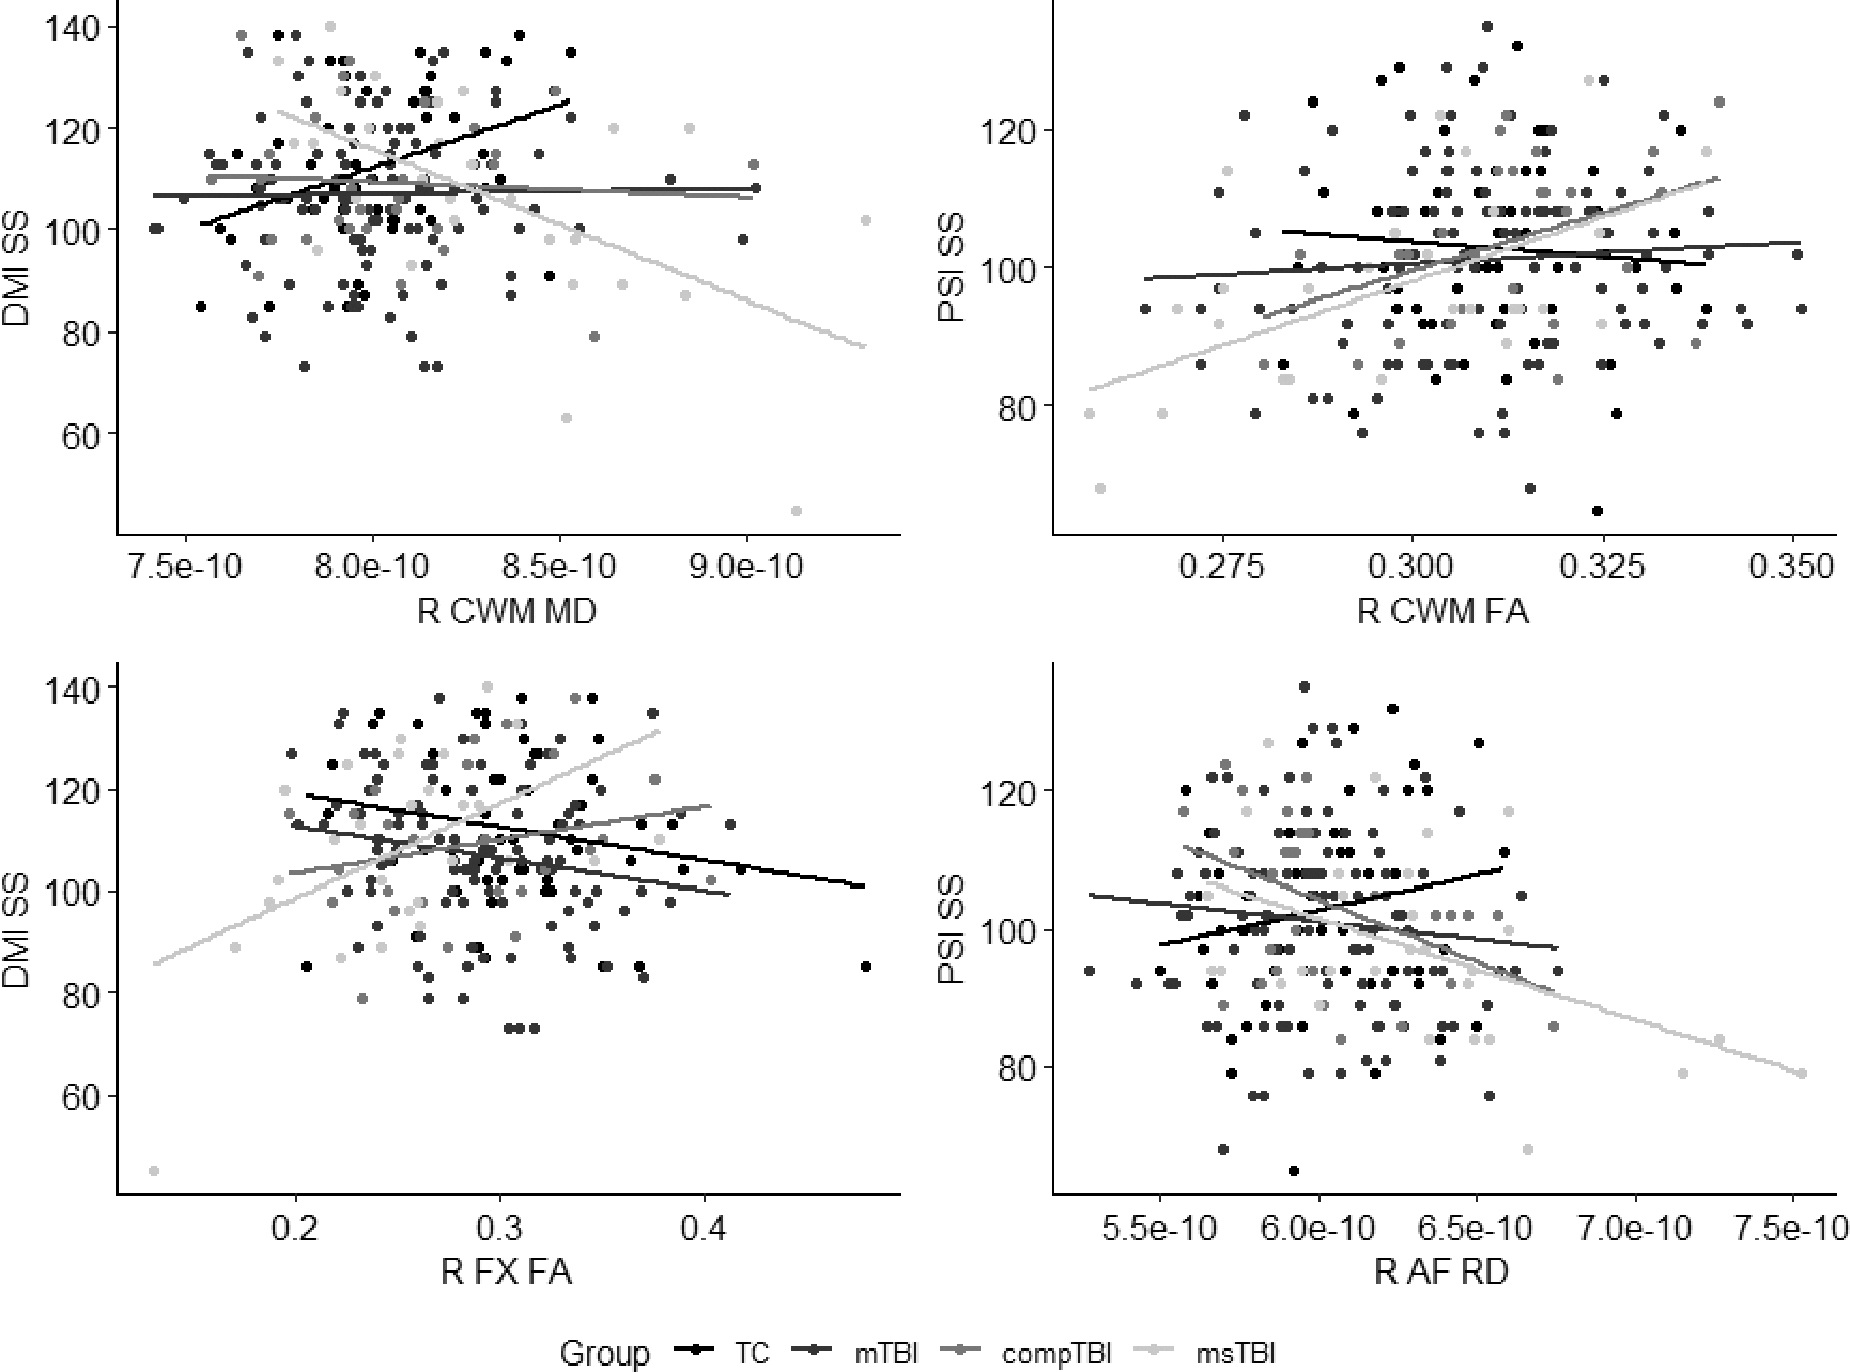
Scatterplots showing relationship between selected DTI metrics and Delayed Memory and Processing Speed performance in each injury group. AF, arcuate fasciculus; compTBI, complicated mild traumatic brain injury; CWM, total cerebral white matter; DMI, Delayed Memory Index; DTI, diffusion tensor imaging; FA, fractional anisotropy; FX, fornix; MD, mean diffusivity; msTBI, moderate-severe traumatic brain injury; mTBI, uncomplicated mild traumatic brain injury; PSI, Processing Speed Index; R, right; RD, radial diffusivity; SS, Standard Score; TC, trauma control.
Relationship between biomarkers and MNCD/PTSD
In a series of exploratory Mann-Whitney U tests comparing DTI metrics between individuals who did versus did not meet criteria for MNCD, no comparisons in the TC and mTBI groups survived the FDR correction. In contrast, within the combined compTBI and smTBI group, FA in the forceps minor, genu, forceps major, bilateral total CWM, cingulum, fornix, ILF, and left uncinate fasciculus was lower in individuals who met criteria for MNCD compared with those who did not meet criteria for MNCD. Additionally, MD and RD were higher in all regions, except for CC body MD and RD, left cingulum MD, and right uncinate fasciculus RD in those who met criteria for MNCD. AD in the genu, forceps major, bilateral fornix, and right total CWM was higher in individuals who met criteria for MNCD compared with those who did not meet criteria for MNCD (Supplementary Table S1).
In similar exploratory Mann-Whitney U tests comparing DTI metrics between individuals who did versus did not meet DSM-IV criteria for PTSD, no comparisons in the TC, mTBI, or combined compTBI and smTBI groups survived the FDR correction (Supplementary Table S2).
Discussion
This study aimed to investigate differences in DTI metrics between TC, mTBI, compTBI, and smTBI groups. Further, it aimed to evaluate the relationship between DTI metrics and cognition and identify how these relationships differ between the four injury groups. The smTBI group consistently demonstrated reduced white matter integrity relative to the TC group, mTBI, and/or compTBI group; however, there were very few other group differences. These findings are consistent with those of our longitudinal DTI study of remote TBI in service members and veterans. 41 After correcting for multiple comparisons, processing speed within the smTBI group was related to total CWM FA, right total CWM RD, forceps minor, genu, forceps major, right ILF FA, AD, MD, and RD, right arcuate fasciculus MD and RD, bilateral cingulum RD, right cingulum FA and MD, right fornix FA, MD, and RD, left ILF FA, and right SLF-III RD. Delayed Memory within the smTBI group was inversely related to total CWM, genu, bilateral fornix bilateral arcuate fasciculus, bilateral SLF-III AD, MD, and RD, AD, MD, and RD, forceps major AD and MD, CC body AD, right cingulum AD and MD, left ILF AD, and bilateral uncinate fasciculus AD and MD.
Conversely, bilateral fornix and genu FA were positively related to Delayed Memory. In the compTBI group, Processing Speed was related to left arcuate fasciculus and SLF-III FA, MD, and RD, as well as left uncinate fasciculus MD and RD. In contrast, there were no significant relationships between DTI metrics and cognition/emotional functioning within the mTBI or TC groups. These findings generally held when evaluating the relationship between DTI metrics and whether or not the participants met criteria for MNCD. Within the combined compTBI and smTBI group, most metrics were related to MNCD; however, there were no relationships between any DTI metrics and MNCD in the mTBI group or TC group.
These findings support past research suggesting total CWM integrity and several specific white matter tracts have implications for cognition following TBI. Whole brain FA has been previously associated with delayed memory and accuracy on a visual 2-back test in 15 patients with acute severe TBI. 42 It has also been correlated with learning and memory in 27 patients with severe TBI assessed an average of 4 years post-injury. 43 Although several studies have also supported a relationship between specific white matter tracts and cognition, 6,7 not all do. For instance, unlike the current study, a study by Wallace and colleagues 8 found no relationship between cognition and FA/MD in any tract in their sample of patients with moderate to severe TBI. This could be due to a difference in neuropsychological assessment techniques (e.g., Wallace et al. used a single measure of non-verbal delayed memory, whereas our measure incorporated three tests of verbal and non-verbal delayed memory), sample size, or statistical techniques.
Whereas our findings in the smTBI group were largely consistent with past research, our findings were notable in that they did not demonstrate relationships between DTI and cognition previously supported by the literature within patients with mTBI, including in the corpus callosum, 44 –49 cingulum, 46,47,50 fornix, 48 uncinate fasciculus, 51,52 SLF, 47,50 or ILF. 50 Indeed, the TOIs included in the present analysis were carefully selected a priori based on these and systematic review/meta-analytic findings. One consistent flaw in the past research has been the use of very small sample sizes, 7,8 which likely contributed to the discrepancy between our findings and past findings, as our sample size of participants with mTBI was relatively large. Additionally, our findings may have been attenuated compared with some prior findings because our participants were assessed a year or more post-injury, whereas many of the significant relationships cited above were demonstrated within the acute/subacute period.
Another surprising finding was the lack of differences in DTI metrics between the mTBI group and TCs. Only the fornix was consistently different between mTBI and controls. This stands in stark contrast to prior research demonstrating differences in DTI metrics, and particularly FA, between participants with mTBI and controls. 51 –54 It is possible this discrepancy is due to including a TC group, rather than a healthy control group as in past studies. It has been observed that effects are often significantly reduced when TBI groups are compared with TCs, rather than healthy controls. 3 It is also possible that most white matter tracts are not negatively impacted many months or years following mTBI. Indeed, our findings are consistent with prior findings in a relatively large sample, where there were no differences in DTI metrics between participants with mTBI and controls. 8 Similarly, there have been other, smaller studies reporting no differences in DTI metrics between participants with mTBI and controls. 49,55,56
Taken together, it seems likely that any disruption of white matter tracts several months/years following mTBI is much smaller than previous studies have suggested. This could be the result of publication bias, as studies with null results are much less likely to be submitted for publication and ultimately published. 57 Unfortunately, this publication bias is reflected even in recent systematic reviews/meta-analyses, 6,7 where the initial article's lack of inclusion of statistics in the manuscript presumably excludes the data from being included in the summary statistics. For instance, the significant results from Xiong and colleagues 52 are reported in Wallace and colleagues 6 recent review, and the significant results from Kraus and colleagues 58 are reported in Zhang and colleagues 7 review/meta-analysis, but the non-significant results from the original manuscripts, for which there are no statistics provided, are not mentioned, nor are they included in the summary statistics/figures in the meta-analyses.
With regard to psychological functioning, we found no relationship between DTI metrics and self-reported PTSD or emotional/internalizing dysfunction. Similar to our findings, a prior study found no relationship between whole brain peak FA and depressive symptoms in retired National Football League (NFL) players. 59 This stands in contrast to most existing literature, in which depression has been associated with reduced FA in the uncinate fasciculus, 60,61 cingulum, 60,62 CC, 62 forceps minor, 61 and SLF. 61,62
Findings on the relationship between PTSD symptoms and white matter integrity following TBI have been mixed. Many studies have found no relationship between PTSD symptoms and DTI metrics. 63 –65 In contrast, Li and colleagues 66 found individuals with mTBI and PTSD had reduced FA and increased MD in the SLF, ILF, CC, cingulum, and/or UF compared with individuals with mTBI only. Sorg and colleagues 46 previously reported that in veterans with a history of mild-moderate TBI, whereas FA did not correlate with PTSD symptoms, CC genu AD and RD were inversely related to PTSD symptomology.
It may be that the most severe cases of mood disturbance following TBI are the result of white matter disruptions. Spitz and colleagues 67 found that patients with mild-severe TBI with mood disorder evidenced lower FA in the right arcuate fasciculus, right ILF, and anterior CC. Although the present study did not specifically examine mood disturbance, we did investigate differences in DTI metrics between those who did and did not meet DSM-IV criteria for PTSD, and we did not find any significant differences. However, this may be due to the reliance on self-report data as well as the lack of incorporation of all DSM-IV criteria for PTSD (due to limitations of the PCL-C), as well as lack of consideration of other mood disorders. Given the considerable variance between existing studies, further investigation of the relationship between white matter integrity and mood disturbance is warranted.
Additional limitations of the current analysis include that the participants with moderate and severe TBI were grouped together due to small sample size within each of these subgroups. It may be that the relationships between DTI and cognition are driven by the most severe injuries within the smTBI group. Further, it is likely that our sample of patients with severe TBI is not representative of the larger military population with severe TBI, as participation in this study required traveling, often on an airplane, to participate in a multi-day visit. It seems likely that inclusion of more severe injuries may have led to identification of additional group differences in DTI metrics, as well as increased associations between DTI and cognition.
Nevertheless, this study is an important addition to the existing literature in that it included a large sample of patients with mTBI, as well as patients with compTBI and smTBI, and an appropriate TC group. Other strengths include a comprehensive injury history to diagnose TBI and determine severity of injury, standardized cognitive testing with removal of individuals who failed performance validity tests, and TOI analysis (rather than the more commonly used canonical region approach) with models that controlled for relevant covariates.
Transparency, Rigor, and Reproducibility Summary
This study was not formally registered. The analysis plan was not formally pre-registered, but the lead author certifies that the analysis plan was pre-specified. A minimum sample size of 176 participants was planned based on an expected medium effect size of f2 = 0.25 for the primary outcome measure(s), calculated to yield 80% power to detect an effect with four groups and a p-value of <0.05. Imaging acquisition and analyses were performed by team members blinded to relevant characteristics of the participants, and clinical outcomes were assessed by team members blinded to imaging results. Participants were blinded to imaging results. The time required for image acquisition was around 10 min for diffusion MRI. The spatial resolution was 2 mm*2mm*2mm. Complete imaging parameters are presented in the Methods section.
The time required for preprocessing and analysis was approximately 3 h for each individual's diffusion MRI data. Quality control was assessed via a visualization of the local tensor orientations and fiber orientation distribution (see Methods section). Quantitative test-retest reproducibility using the same participants imaged repeatedly was not performed. Quantitative reproducibility using different imaging equipment was not performed. All equipment and software used to perform imaging and pre-processing are widely available from non-commercial sources. The key inclusion criteria and outcome evaluations are established standards. Statistical analysis and/or review was performed by the lead author. Correction for multiple comparisons was performed using the Benjamini-Hochberg FDR. No replication or external validation studies have been performed or are planned/ongoing at this time to our knowledge.
Summary/aggregate data and additional information on the methods and statistical analyses will be provided on request. However, individual data elements including individual imaging data are not available due to Department of Defense (DoD) legal requirements and current IRB-approved language in the subject consent forms. Analytic code used to conduct the analyses presented in this study are not available in a public repository. They are available by e-mailing the corresponding author as of April 5, 2022. The authors agree to provide the full content of the manuscript on request by contacting the corresponding author.
Conclusions
Overall, findings suggest a dose-response relationship between TBI severity and the strength of the relationship between white matter integrity and cognitive performance, with essentially no relationship in mTBI, some findings in compTBI, and several strongly significant relationships in smTBI. Within the smTBI group, overall white matter integrity, and in particular, white matter integrity in the genu, forceps minor, forceps major, cingulum, arcuate fasciculus, fornix, uncinate fasciculus, ILF, and SLF-III was related to worse Processing Speed and Delayed Memory in SMVs 1 year or more after moderate to severe TBI. There was also evidence to suggest a relationship between the left arcuate fasciculus, SLF-III, and uncinate fasciculus and Processing Speed in the compTBI group. Importantly, in contrast to previously reported findings, despite expecting the DTI to be more sensitive to brain injury and cognitive impairment within the mTBI group because we used white matter tractography rather than traditional space atlases, we did not find a relationship between DTI metrics and cognition in our relatively large mTBI group, nor did our findings support previously demonstrated differences in DTI metrics between controls, mTBI, and compTBI.
Footnotes
Acknowledgments
The views expressed in this article are those of the authors and do not necessarily reflect the official policy of the DoD or the U.S. government.
This study is part of the larger DVBIC-TBICoE 15-Year Longitudinal TBI Study designed to respond to a congressional mandate (Sec721 NDAA FY2007). The authors would like to thank the service members and veterans for their time and commitment to participating in the research. The authors would also like to acknowledge the efforts of the larger team of research coordinators, research associates, research assistants, program managers, and senior management who contribute to the DVBIC/TBICoE 15-Year Longitudinal TBI Study.
Authors' Contributions
The authors contributions are as follows: Sara Lippa: conceptualization, methodology, formal analysis, data curation, writing original draft, visualization; Ping-Hong Yeh: formal analysis, resources, data curation, writing-review and editing; John Ollinger: supervision; writing-review and editing; Tracey Brickell: resources; supervision; writing-review and editing; Louis French: resources, writing-review and editing, supervision, project administration; Rael Lange: resources, writing-review and editing, supervision, project administration.
Funding Information
This work was prepared under Contract HT0014-19-C-0004 with DHA Contracting Office (CO-NCR) HT0014 and, therefore, is defined as U.S. government work under Title 17 U.S.C.§101. Per Title 17 U.S.C.§105, copyright protection is not available for any work of the U.S. government. For more information, please contact dha.TBICOEinfo@mail.mil.
Author Disclosure Statement
No competing financial interests exist.
Supplementary Material
Supplementary Table S1
Supplementary Table S2
References
Supplementary Material
Please find the following supplemental material available below.
For Open Access articles published under a Creative Commons License, all supplemental material carries the same license as the article it is associated with.
For non-Open Access articles published, all supplemental material carries a non-exclusive license, and permission requests for re-use of supplemental material or any part of supplemental material shall be sent directly to the copyright owner as specified in the copyright notice associated with the article.
