




Abstract
This study aimed to assess intracranial hypertension in patients with traumatic brain injury non-invasively using computed tomography (CT) radiomic features. Fifty patients from the primary cohort were enrolled in this study. The clinical data, pre-operative cranial CT images, and initial intracranial pressure readings were collected and used to develop a prediction model. Data of 20 patients from another hospital were used to validate the model. Clinical features including age, sex, midline shift, basilar cistern status, and ventriculocranial ratio were measured. Radiomic features—i.e., 18 first-order and 40 second-order features— were extracted from the CT images. LASSO method was used for features filtration. Multi-variate logistic regression was used to develop three prediction models with clinical (CF model), first-order (FO model), and second-order features (SO model). The SO model achieved the most robust ability to predict intracranial hypertension. Internal validation showed that the C-statistic of the model was 0.811 (95% confidence interval [CI]: 0.691–0.931) with the bootstrapping method. The Hosmer Lemeshow test and calibration curve also showed that the SO model had excellent performance. The external validation results showed a good discrimination with an area under the curve of 0.725 (95% CI: 0.500–0.951). Although the FO model was inferior to the SO model, it had better prediction ability than the CF model. The study shows that the radiomic features analysis, especially second-order features, can be used to evaluate intracranial hypertension non-invasively compared with conventional clinical features, given its potential for clinical practice and further research.
Introduction
Traumatic brain injury (TBI) is one of the major public health problems in the world; more than 50 million people incur a TBI per year, which means that about half of the world's population will have one or more TBIs during their lifetime. 1 It is also a major cause of death and long-lasting disability, 2,3 especially among young adults. 4
Intracranial pressure (ICP) monitoring, considered an effective method in TBI management, 5 improves the 6-month mortality rate in persons with severe TBI. 6 The primary technique of ICP monitoring is invasive, however, which may lead to many inevitable complications, such as intracranial infection, hemorrhage, and even severe dangers such as contusion or transduction disconnection in rare cases. 7 –9 Non-invasive ICP monitoring methods have recently been used in clinical practice owing to their accuracy, low cost, and fewer complications. 8,10,11
Meanwhile, radiomic analysis, which is a process of converting digital medical images into mineable high-dimensional data via extraction of quantitative features and subsequent data analysis for decision support, has increasingly attracted attention in recent years. 12 Radiomic features consist of first-order, second-order, and higher-order elements based on the distribution and relationship of pixel or voxel gray-levels in the image. 13 Our previous study had shown that the computed tomography (CT) radiological features analysis could be an effective way to characterize intracranial hypertension. 14 It included only first-order features, however, and higher-order features were lacking.
The major aim of this study was to further validate whether CT radiomic features could show a remarkable ability to predict intracranial hypertension compared with clinical features by extracting and developing prediction models, and to compare the performance abilities of first-order and second-order radiomic features.
Methods
Study design and setting
The primary cohort of clinical data of 50 patients with TBI from the department of neurosurgery, Shanghai General Hospital, from January 2020 to December 2021 were collected and analyzed. Inclusion criteria were as follows: (1) patients admitted to the emergency department for acute closed TBI; (2) received invasive ICP monitoring according to the guidelines for the management of severe TBI; (3) received emergency cranial CT scan within 60 min of ICP monitoring. Exclusion criteria included: patients with previous intracranial anatomical structural changes caused by TBI, cerebral infarction, brain tumors, or other neurological diseases or cranial surgical intervention.
The study protocol conformed to the ethical guidelines of the Declaration of Helsinki, and this study was approved by the Ethics Committee of Shanghai General Hospital, Shanghai Jiao Tong University School of Medicine. The participants' right to know was fully guaranteed and indicated in the ethical approval document.
The external cohort of 20 patients was selected following the same criteria mentioned above from January 2021 to December 2021 at the department of neurosurgery of Qian nan People's Hospital.
Data sources and measurements
This study included age, sex, midline shift, basilar cistern, and ventriculocranial ratio as clinical features. With regard to midline shift, basilar cistern, and ventriculocranial ratio, two clinicians extracted these data from the CT images independently, and their average measurements were used as the final results. The slice with the maximum midline shift was selected to examine the midline shift by measuring the perpendicular distance between the septum pellucidum and cranial midline (the median ridge of the frontoparietal bone).
The lateral ventricle width between the heads of the caudate nuclei and the width of the same horizontal cranial cavity were measured at the slice with the body of the lateral ventricle, which was 5 cm above the orbitomeatal plane; the ratio of the two widths was the ventriculocranial ratio. The status of the basilar cistern was observed in the slice of the basilar cistern plane, and we used 0, 1, and 2 scores to represent normality, compression, and obliteration, respectively. These five clinical features were then included in the multi-variate logistic regression model as the clinical features model (CF model) to evaluate the probability of intracranial hypertension (ICP >22 mm Hg).
All the included patients underwent ICP monitoring using an ICP sensor (Integra LifeSciences, Princeton, NJ) placed in the frontal corner of the ventricle before performing craniotomy. We collected the patients' initial ICP values immediately after the ICP sensor insertion.
Apart from the clinical features, we collected and analyzed the patients' most recent pre-operative cranial CT images. The CT radiological features were acquired from the Digital Imaging and Communications in Medicine (DICOM) file of the most recent cranial CT before ICP monitoring, using a 64-slice spiral CT machine (General Electric Medical System, Shanghai, China). As per the routine protocol of a CT scan, the CT slices were parallel to the orbitomeatal plane from the foramen magnum to the vertex. The scanning slice thickness was 5 mm.
We chose the slice with the body of the lateral ventricle to extract CT radiomic features. The DICOM files of the CT were imported into the three dimensional slicer (3.6.0,

Selection of a rectangular region of interest (ROI) with size of 20 pixels. *20 pixels.
PyRadiomics module was used to extract 18 first-order features of the grayscale frequency distribution of the pixel intensity histograms and 40 second-order features involving gray-level co-occurrence matrix (GLCM, 24 features) and gray-level run-length matrix (GLRLM, 16 features) from the ROI. The first-order group and second-order group data were then standardized. The minimum of 50 each feature data is subtracted from corresponding feature data and divided by the difference between the maximum and minimum of the respective feature. The standardization formula is expressed as:
The least absolute shrinkage and selection operator (LASSO) method, applicable for the high-dimensional data, 15 was used to select the most significant features in the two groups. To avoid overfitting, the optimal λ value was determined by the mean squared error (MSE) based on the 5-fold cross-validation. According to the features selected for the two groups, two logistic models were established to evaluate the probability of intracranial hypertension (ICP >22 mm Hg), which contains first-order features model (FO model) and second-order features model (SO model). The development and analysis process of the above models are shown in Figure 2.

Model establishment and analysis process. CT, computed tomography; CF, clinical features; FO, first-order features; SO, second-order features.
Statistical analysis
Data analysis was statistically performed using Python and Statistical Package for Social Sciences (SPSS 22.0, IBM, Armonk, NY). Data manipulation and sorting were performed using NumPy and pandas modules, and the logistic regression module of SPSS for model building and mapping. Continuous variables subject to normal distribution were expressed as mean (M) ± standard deviation (SD), continuous variables not subject to normal distribution were expressed as the median and interquartile range (IQR), and categorical variables were expressed as frequency and percentage.
Accuracy, precision, recall, and F1 score were used to evaluate the performance of each model. All three models used the area under the receiver operator characteristic (ROC) curve to assess the discriminative power. The Hosmer Lemeshow test was used to determine whether the calibration curve varies from the ideal curve and to measure the accuracy of the model prediction. p < 0.05 was considered a statistically significant difference.
Results
Clinical characteristics
In the primary cohort, we screened 89 patients with TBI for our study based on the inclusion criteria, and 50 of them were finally included. There were 33 male patients and 17 female patients with a median age of 62.3 years, ranging from 37–61 years. The cause of injuries included traffic accidents (27, 54%), fall from heights (8, 16%), and falls (15, 30%). In addition, 39 patients had brain contusion, 22 had intracranial hematoma, 25 had subdural hematoma, 8 had epidural hematoma, and 13 had coexistent subarachnoid hemorrhage.
As shown in Table 1, there were no statistically significant differences between the intracranial hypertension group and the normal group in age, sex, location of the lesions, midline shift, and ventriculocranial ratio (p = 0.13, p = 0.27, p = 0.73, p = 0.18, and p = 0.89, respectively) except the condition of the basilar cistern.
Clinical Features of Patients with Traumatic Brain Injury in the High and Normal Intracranial Pressure Level Groups
In the intracranial hypertension group, the classification scores of patients with basilar cistern compression or obliteration were more than in the normal group. The multi-variate logistic regression analysis also revealed that the condition of the basilar cistern was an independent factor for evaluating intracranial hypertension based on the CT images (Table 2). The clinical features of age, sex, midline shift, ventriculocranial ratio, and the condition of the basilar cistern were used to build the CF model.
Results of Multi-Variate Logistic Regression Analysis for Evaluation of Intracranial Hypertension Based on Clinical Features
B, regression coefficient; SE, standard error; Wald, Wald score; df, degrees of freedom; Sig, level of significance.
CT radiomic features
As mentioned above, radiomic features were divided into two groups—the first-order features group and the second-order group—to better compare their discriminatory power. The illustration of all the features can be found in Supplementary Table S1. In the first-order features group, 18 features were finally reduced to three including IQR, maximum, and total energy by the LASSO method with the corresponding coefficients representing the weights among all the features. In this condition, MSE was the lowest to minimize the error and improve the performance of the model (Fig. 3). The three features and their coefficients are shown in Table 3.
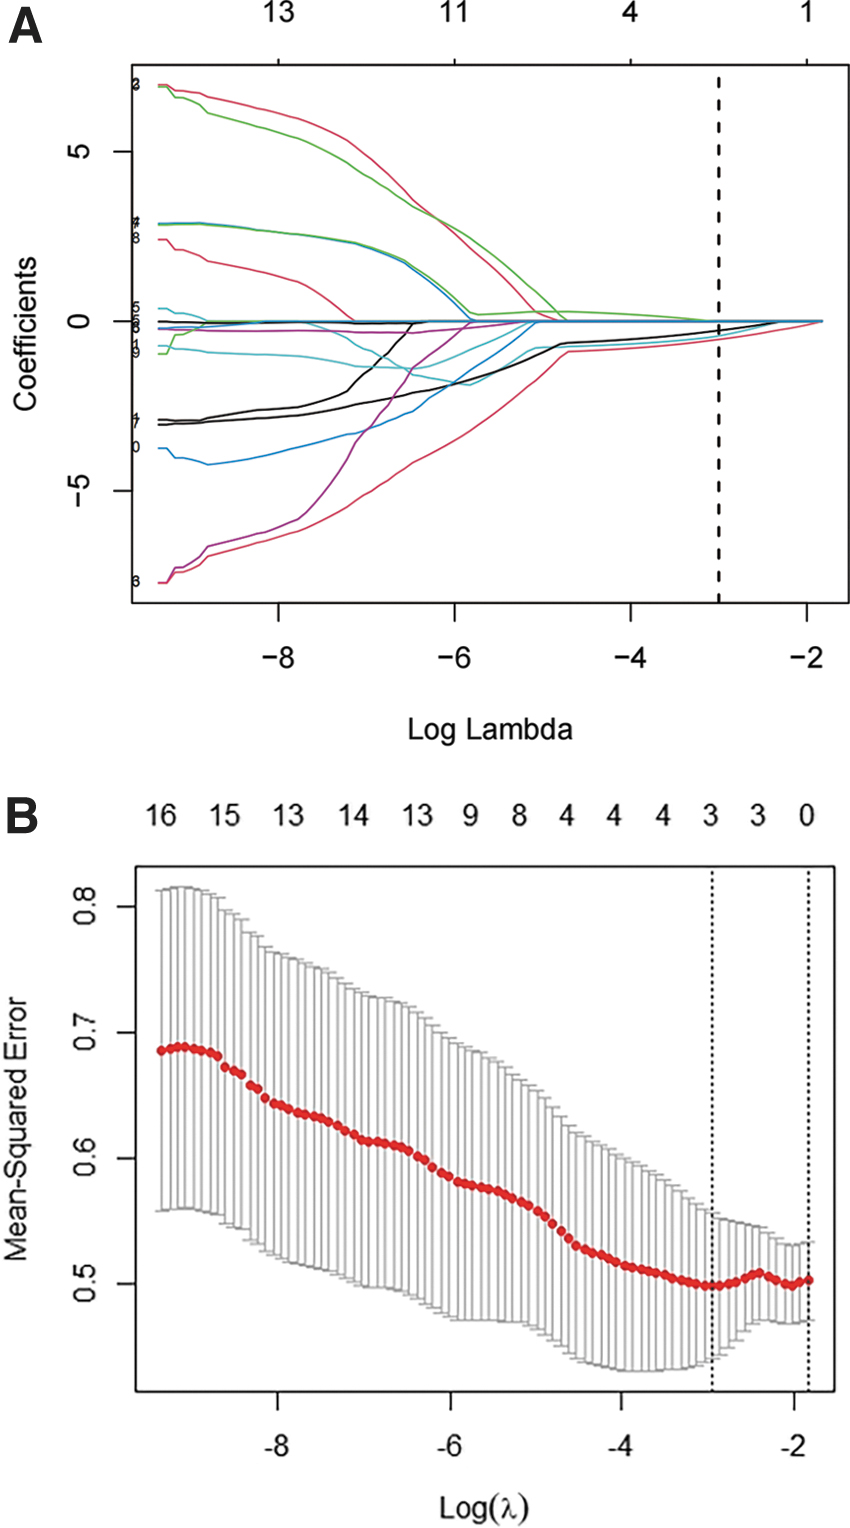
First-order feature selection using the least absolute shrinkage and selection operator (LASSO) binary logistic regression model. (
Results of Lasso Selection and Multi-Variate Logistic Regression Analysis for Evaluation of Intracranial Hypertension Based on First-Order Features
Similarly, 40 features were screened to three potential predictors in the second-order group (Fig. 4), and they were gray-level non-uniformity, run variance, and short-run low gray-level emphasis (Table 4). Two first-order and two second-order features were screened to further establish the prediction models based on the statistical differences in the multi-variate logistic regression.
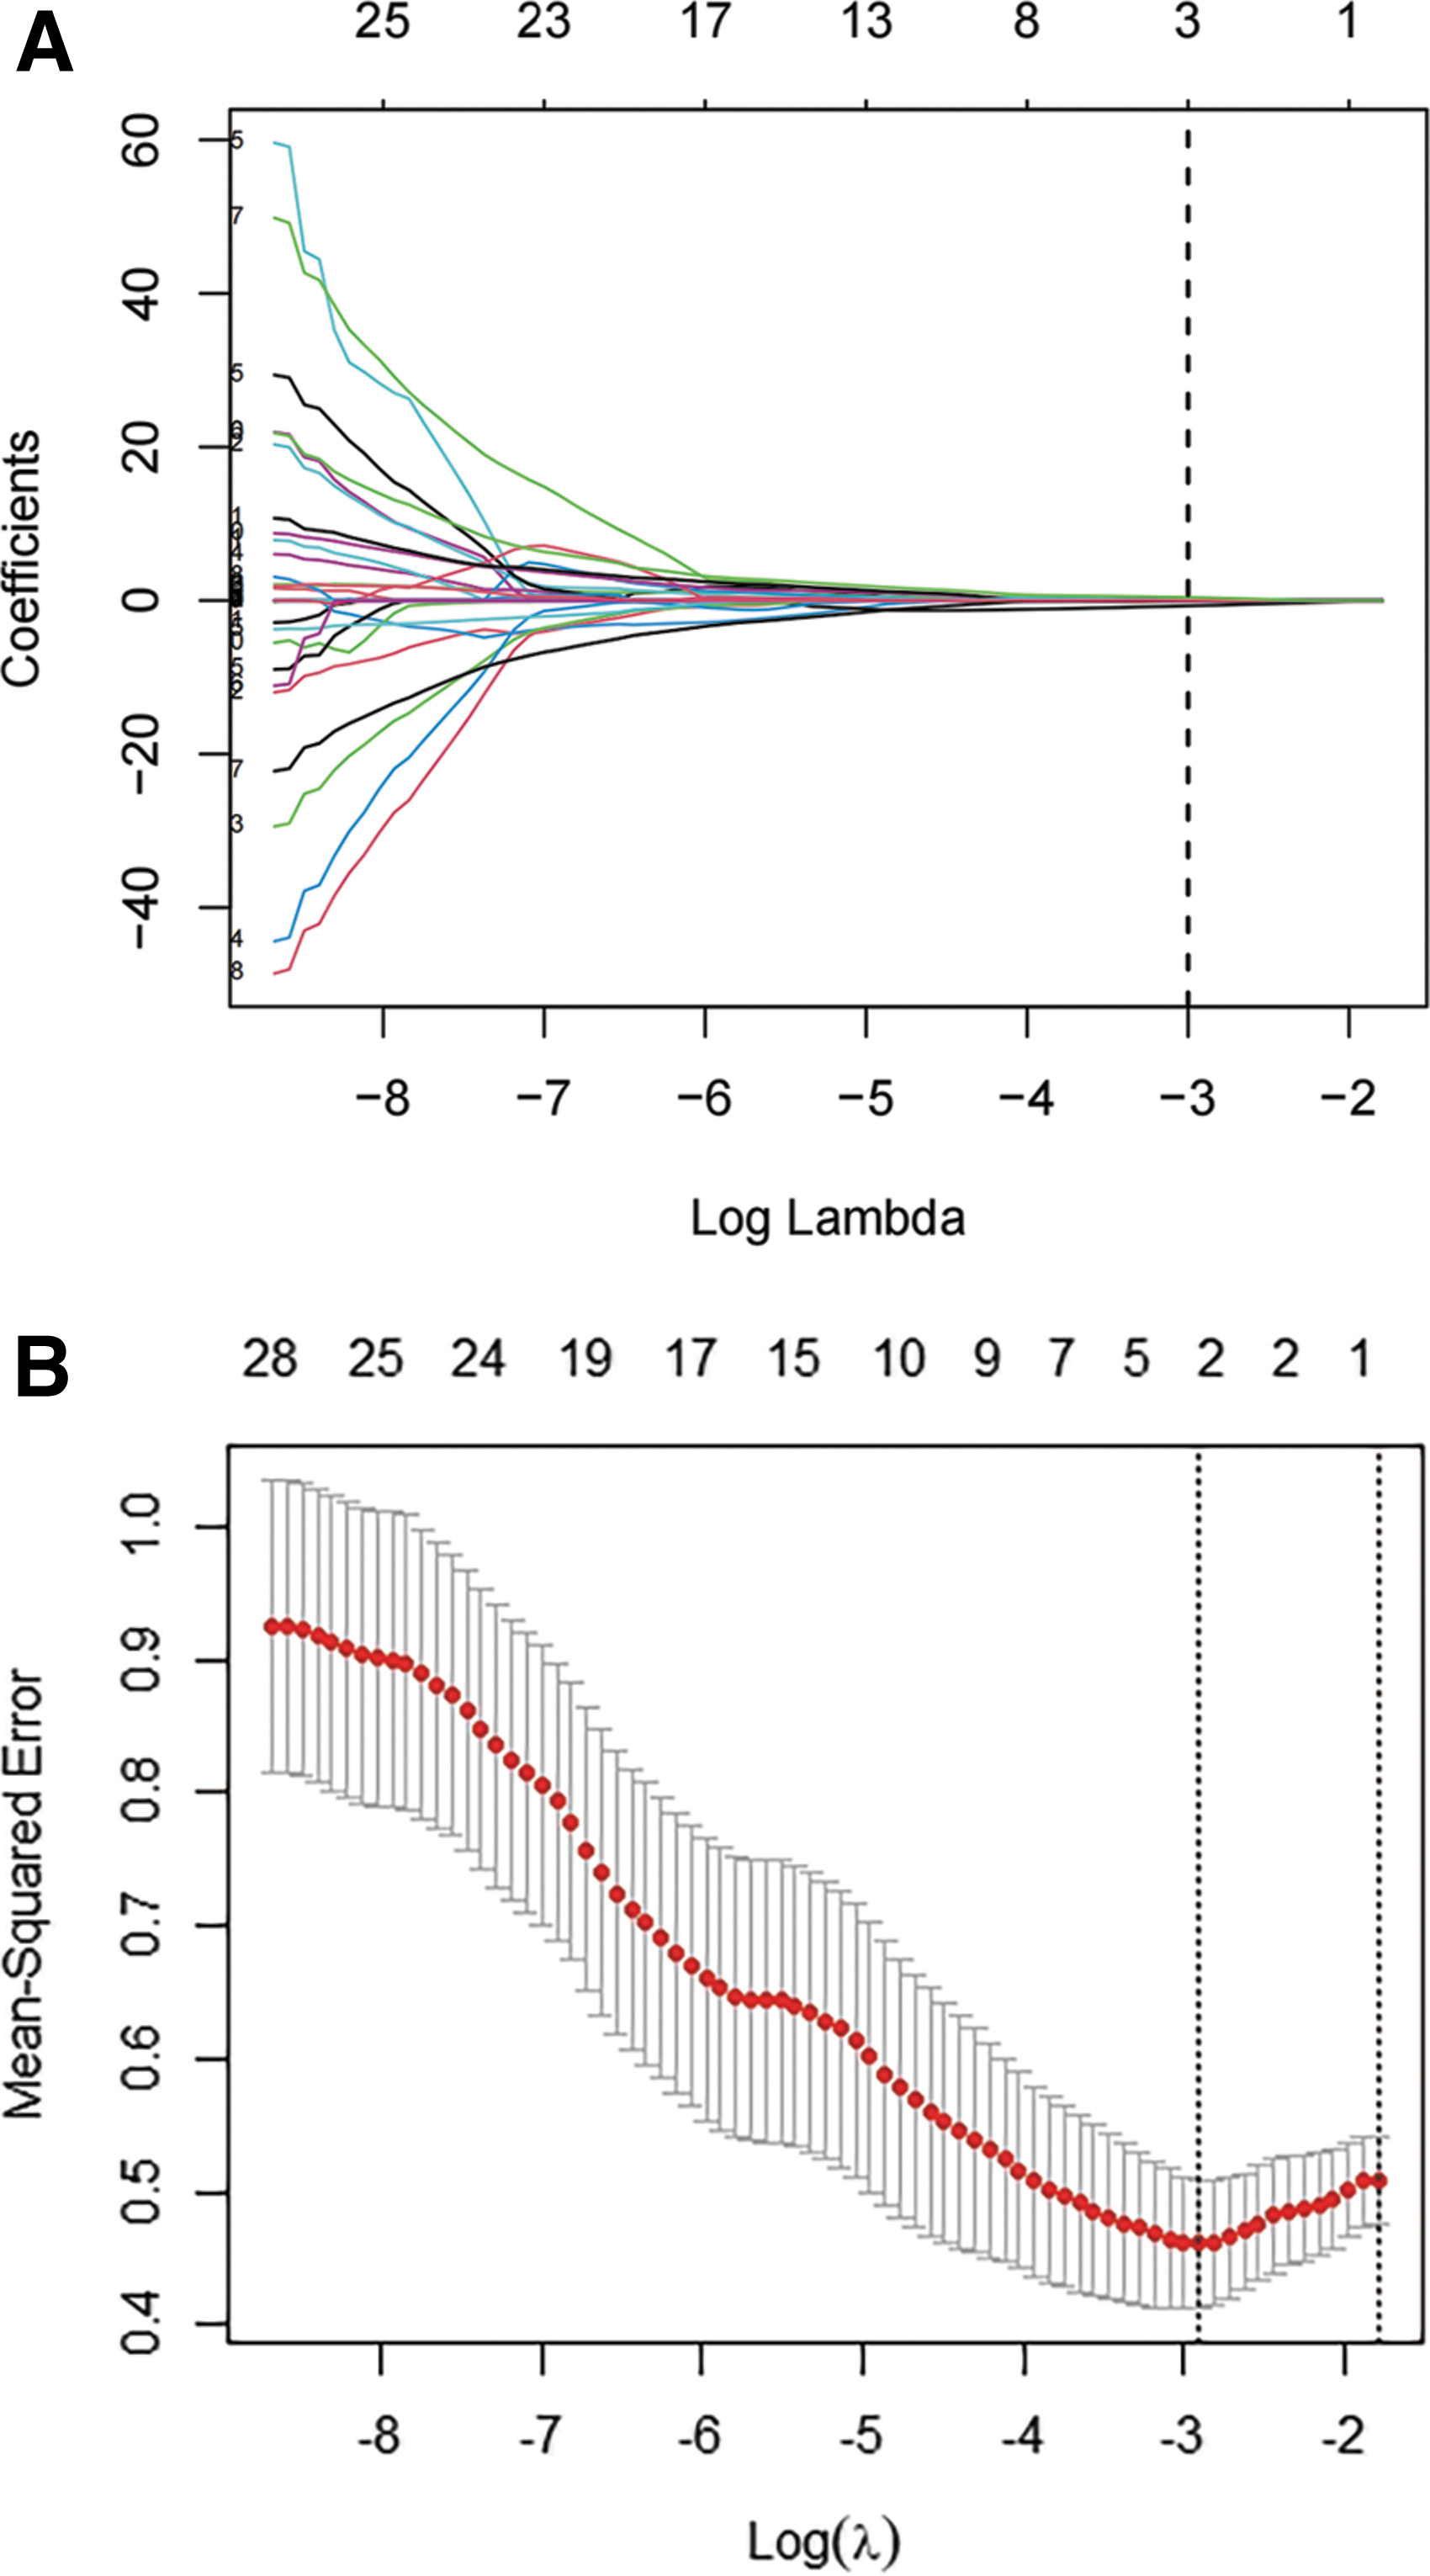
Second-order feature selection using the least absolute shrinkage and selection operator (LASSO) binary logistic regression model. (
Results of Lasso Selection and Multi-Variate Logistic Regression Analysis for Evaluation of Intracranial Hypertension Based on Second-Order Features
Performance of three models
The performance of the CF, FO, and SO models in predicting intracranial hypertension is demonstrated in Table 5 and Figure 5. The SO model achieved the most robust ability in predicting intracranial hypertension with an area under the ROC curve (AUC) of 0.81. Although the FO model was inferior to the SO model, it still showed good discriminatory power with an AUC of 0.76. The CF model, however, had the worst ability to predict intracranial hypertension with an AUC of 0.65. The Hosmer Lemeshow test and calibration curve showed that the SO model had a good prediction ability, which is displayed in Figure 5.
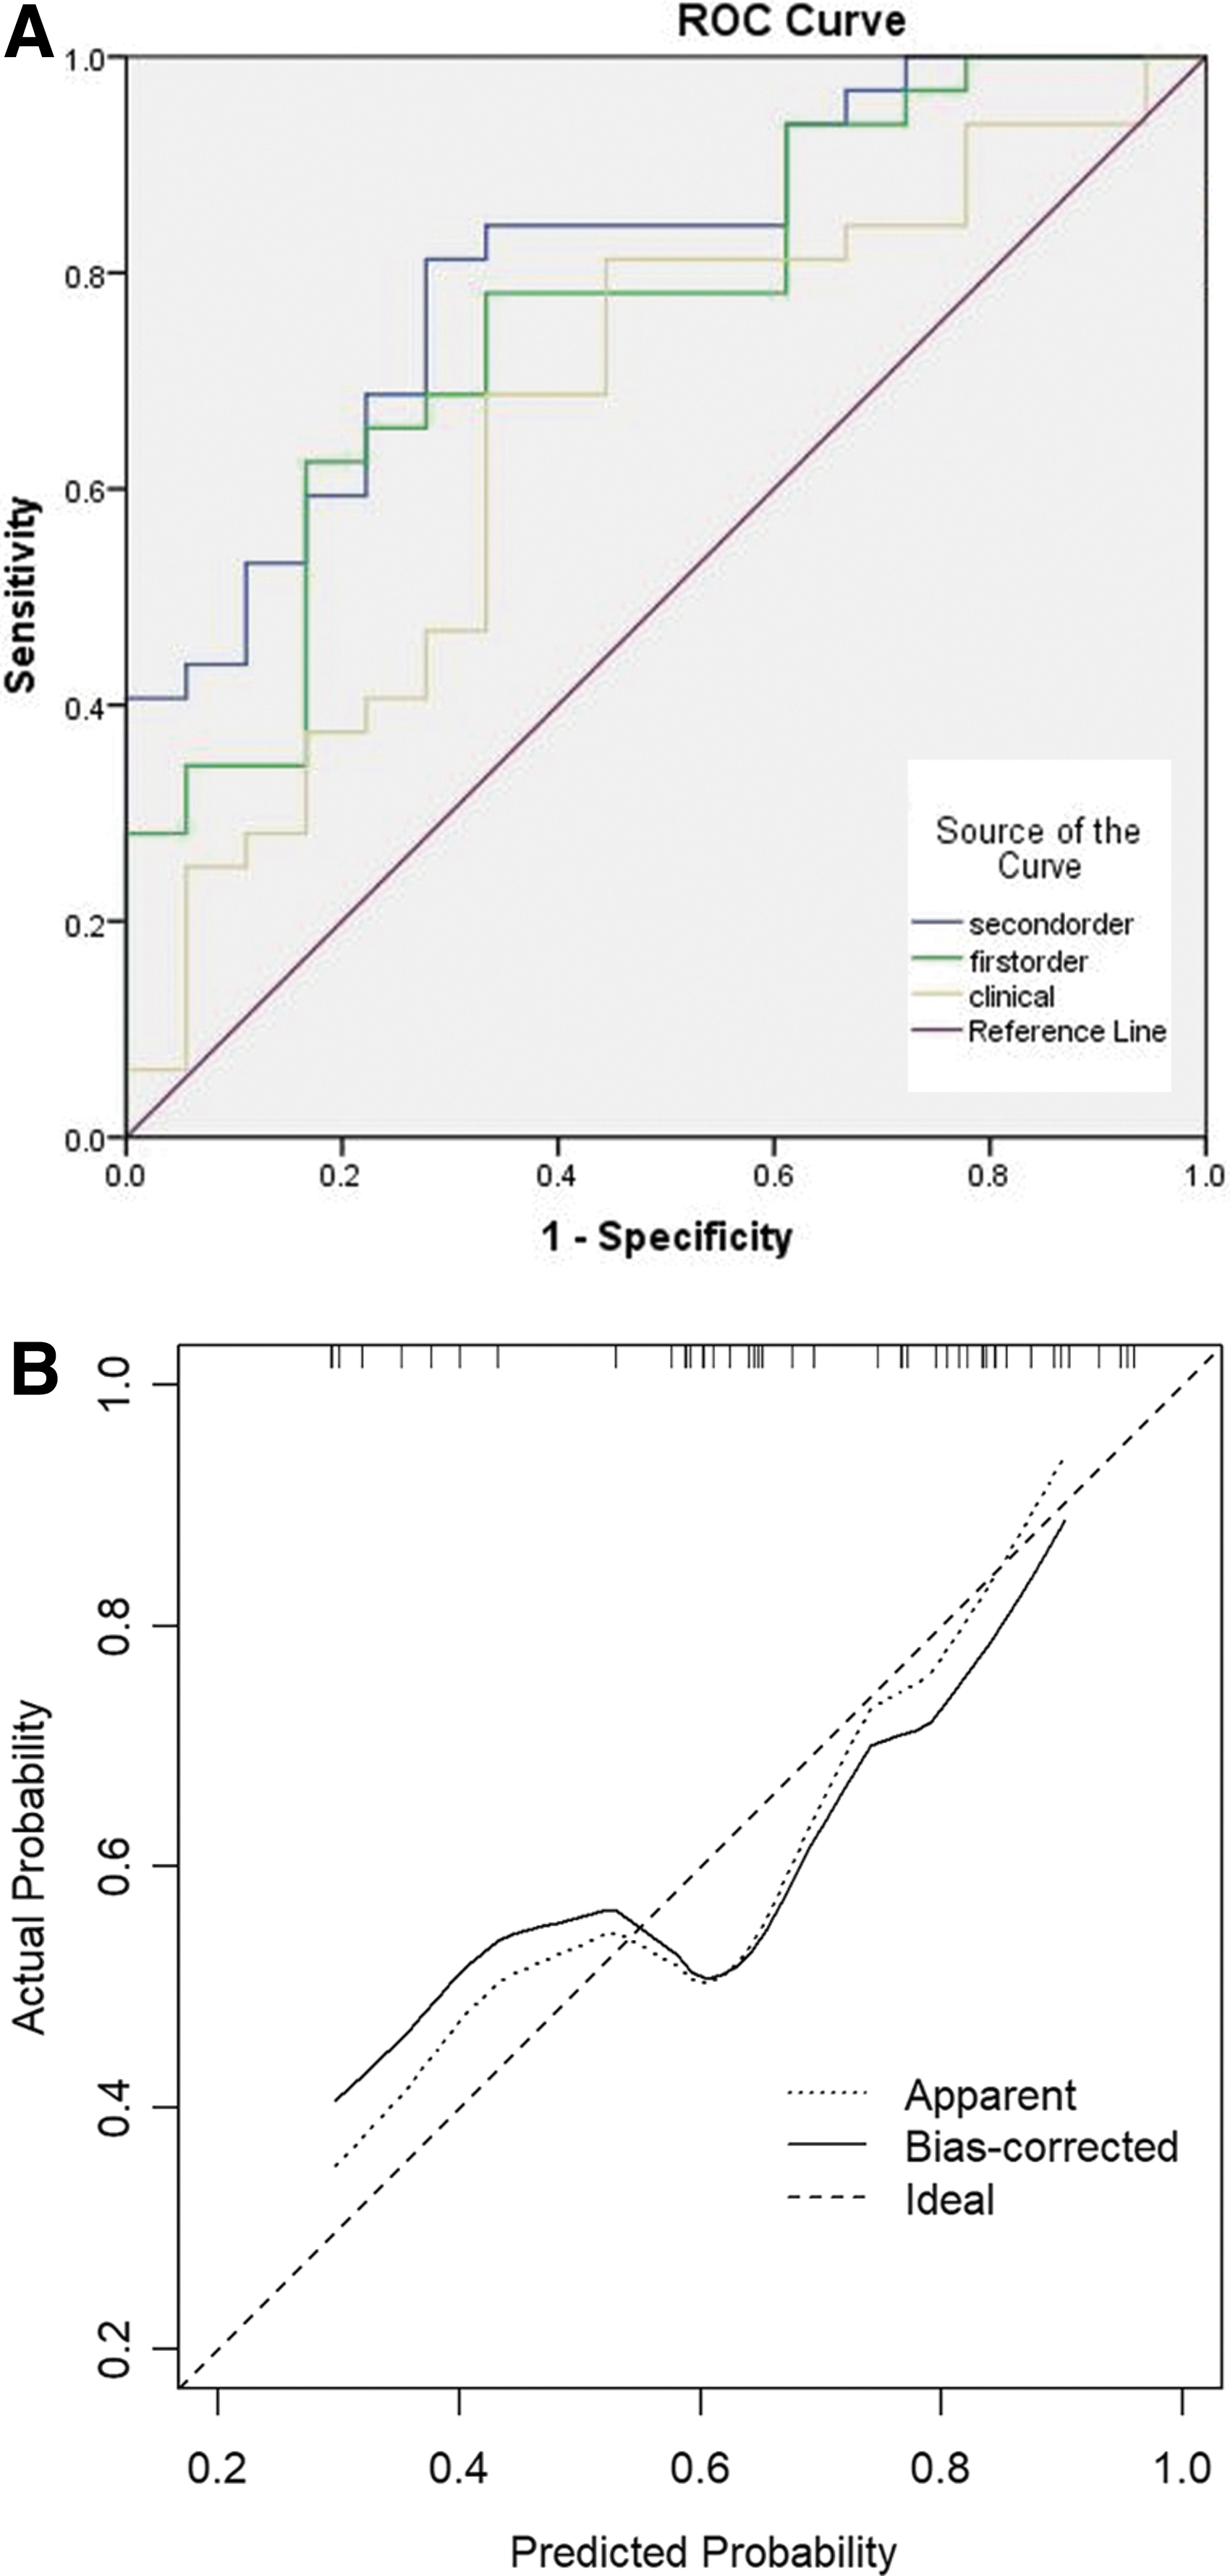
(
Performance of Models Based on Three Features
ROI, region of interest; AUC, area under the curve.
Twenty patients with TBI were screened in the external cohort, to validate the prediction ability of the SO model. It consisted of seven patients with intracranial hypertension and 13 with normal ICP. There were 14 male patients and six female patients with a median age of 58.2 years. The ROC curve analysis of external validation showed that the AUC of the SO model was 0.725 (95% confidence interval: 0.500–0.951). In addition, the calibration curve also revealed a good agreement in the validation cohort (Fig. 6).
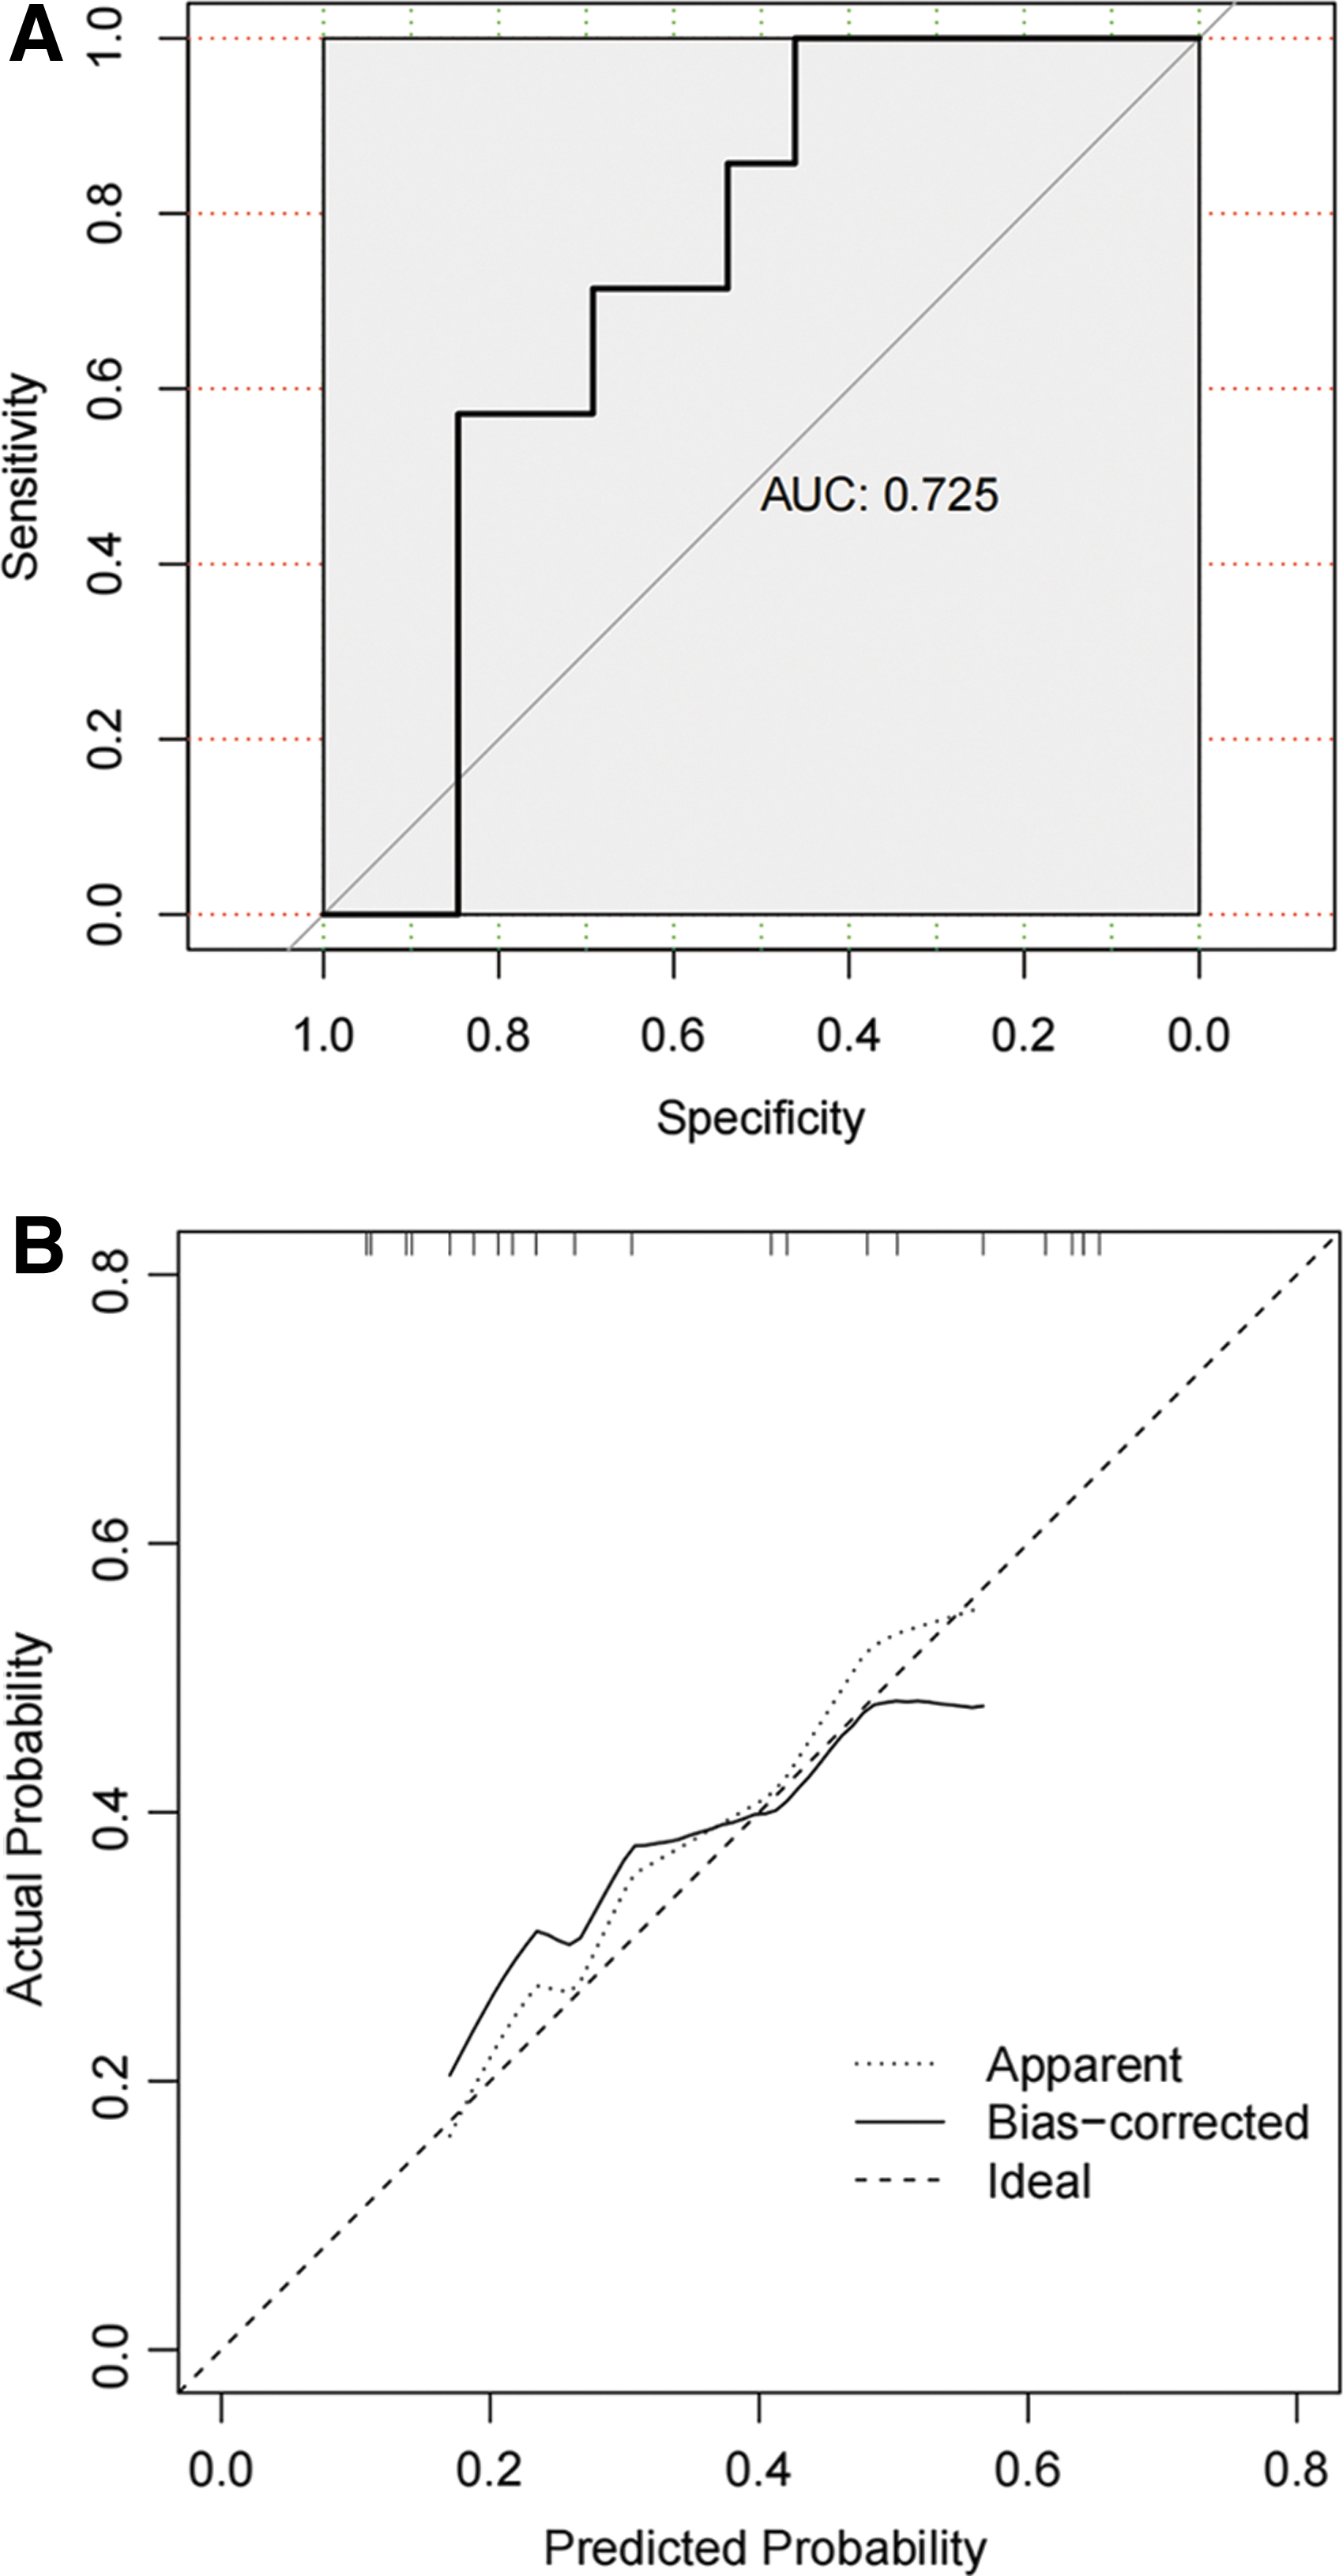
The results of ROC curve analysis and calibration for predicting intracranial hypertension in the external validation cohort (using second-order model). (
Discussion
This study analyzed the clinical features and related CT radiomic features of patients with closed TBI, developed regression models to predict ICP levels, and compared their performance. Consequently, it was demonstrated that radiomic features, especially second-order features, had better prediction potential than other traditional clinical features. The external validation results also proved that second-order features possessed greater advantages in identifying intracranial hypertension than first-order features.
The placement of intracranial monitors to measure ICP is important to guide clinical decisions in patients with TBI. 16,17 Considering the complications of invasive methods, monitoring ICP precisely and non-invasively may be the goal in the management of TBI in patients.
In the past decade, CT image-based ICP evaluation has been developed. Clinicians usually assess intracranial hypertension using conventional CT radiological features such as midline shift, basilar cistern compression, and lesions volume. Murray and colleagues 18 found that younger age, modified Fisher Score, and volume of contusion were factors associated with ICP evaluation in patients with severe TBI. Pappu and coworkers 19 showed that the ratio of cerebrospinal fluid volume to the size of the intracranial vault or volume inside the skull could predict the risk of increased ICP. 19
Approaches to measuring the optic nerve sheath diameter (ONSD) on CT images also exhibit excellent discriminatory ability to predict patients with intracranial hypertension. 20 In addition, CT images were also utilized to predict the severity and prognosis of patients with TBI based on CT scoring systems such as Marshall classification and Rotterdam CT score. 21
These methods mentioned above usually need manual calculations such as intracranial volume and ONSD, which are highly subjective and difficult to quantify precisely. A recent study questioned the correlation between ONSD and raised ICP in pediatric patients in neurocritical care, 22 probably because of a loss of elasticity of the ONSD after a pressure spike. CT scores can be affected by artificial errors because of subjective judgment. The differences in the methods and the heterogeneity of the diseases limit the use of these tools. In our study, the extraction of radiomic features, which was manipulated digitally, may reduce the subjective effect as much as possible. The features data were standardized through the standardization formula to minimize statistical error.
Radiomics analysis, usually known as textural analysis, holds great promise in the diagnosis and prognosis prediction of diseases and is applied in different clinical scenarios. 13 Different kinds of medical images (X-rays, CT, magnetic resonance imaging [MRI]) can be used to extract radiomic features. 23,24 Radiomic features generally consist of first-order, second-order, and higher-order features, according to the current theory of radiomics. 25,26
The first-order features describe the gray-level frequency distribution based on pixel intensity histogram in the ROI, including entropy, mean value, range, root mean square, skewness, SD, consistency, variance, and other parameters, without concern for spatial relationships between the gray values. Shan and associates 14 found that the Houndsfield unit-related method showed better performance in assessing ICP levels (ICP >22 mm Hg) than other commonly used ICP assessment methods. This study, however, only involved entropy, which is one of the first-order features, and did not analyze the regions near the lesions.
The current study aimed to systematically cover 18 first-order features to elucidate further their relationships by analyzing the brain tissue near the anterior horn of the lateral ventricle on the side of the major lesion in patients with TBI. We verified the ability to evaluate the ICP levels using two screened features. In addition, second-order features were also included in our study.
Second-order features, known as texture features in a narrow sense, were first introduced by Haralick and colleagues. 27 Unlike first-order features, they describe the spatial distribution of voxel intensity levels based on co-occurrence matrixes such as GLCM and GLRLM. We included 40 features based on these two matrixes in this study. The results showed that the two features, gray-level non-uniformity and short-run low gray-level emphasis, were different between the different ICP levels groups. These two features both reflect the distribution and similarity of gray-level intensity values in the image. In elevated ICP, the brain tissue was compressed, which led to a change in its density, thus presenting these two extracted features.
Several similar studies have been conducted in the neurosurgery field. Zhang and coworkers 28 used a radiomics model to predict hematoma progression and clinical outcomes in patients with cerebral contusions successfully. Chen and colleagues 29 extracted second-order features to predict ICP levels (elevated if ICP >12 mm Hg and normal if ICP ≤12 mm Hg) in patients with TBI. The result was not significant, possibly because the threshold of elevated ICP level was not appropriate.
In addition, the 11 second-order features included in that study lacked sufficient discriminatory ability to identify the differences in the CT images, and it was probably limited by the development of radiomics. In the current study, using modified methods from the previous study and more radiomic features to assess their relationships comprehensively may have led to significant results.
In TBI, intracranial hypertension is the typical pathophysiological outcome because of the secondary injuries after brain trauma. 30 A recent report showed that patients with an ICP more than 22 mm Hg have poor outcomes. 31 Because of hematoma or edema, the brain tissue may shift with the midline and the ventricles, and the basilar cistern may also be compressed to various extents. These clinical features can be read on the CT images, and clinicians use them routinely to determine whether patients have intracranial hypertension.
There were no significant statistical differences for the clinical features mentioned above in our study except for the condition of the basilar cistern, which indicated that the basilar cistern may be the effective predictor of elevated ICP for clinicians. The result also indicated that the CF model lacked significant judgment ability. Radiomic features analysis, especially second-order features with an AUC of 0.81 and 80% accuracy, can be regarded as a novel method to assess high ICP levels. The structure and density changes in the brain tissue in patients with TBI can be reflected through our method for analyzing feature data from the region near the lesions.
First-order features also demonstrated good performance compared with the clinical features. Total energy from first-order features is the value of energy feature scaled by the volume of the voxel in ROIs, and the IQR represents the variability and dispersion of gray-level intensity within the ROI. In elevated ICP, the voxel intensity in the anterior horn of the lateral ventricle on the side of the major lesion also increases to observe these two features. The emphasis of first-order features is total voxel distribution, and the local voxel relationship is ignored, which results in better judgment ability of the second-order features.
In summary, our study showed evidence that radiomic features can be used to predict ICP levels. Further, second-order features outperform first-order features and clinical features. There are also some limitations to this study. (1) The sample size in our study was relatively small and from a single center. Because of the inadequate elevated ICP events, the number of radiomic features that our models could contain was also limited, which could reduce the accuracy as a result.
(2) This study was a retrospective analysis, and further prospective studies should be conducted to prove this approach. In addition, data of external validation were quite small, and a more extensive external validity testing needs to be conducted subsequently. (3) Manual segmentation of ROIs could cause unavoidable interference with experimental results, increase inaccuracy, and lead to errors. (4) The radiomics method of predicting elevated ICP is semi-quantitative, lacking the ability to predict continuous ICP values.
(5) Because the pre-operative cranial CT scan and the ICP value were measured non-concurrently, the time gap between the two could yield discordance between the results. (6) ICP value was measured at instant time rather than taking average value over a time period, which may cause variability. (7) Individual factors of patients with TBI may have different thresholds when experiencing clinically significant intracranial hypertension, which introduce the inaccuracy on the results.
Conclusions
Our study illustrated that radiomic features analysis, especially second-order features, can be used to evaluate ICP non-invasively compared with conventional methods, and the results derived from the model need to be further validated in other independent datasets. The findings in this study may enable further research combined with machine learning to validate and improve the prediction model performance. Besides, it lays the foundation for utilizing radiomics analysis of MRI images in the field of TBI management. Also, the result of this pilot study paves the way for exploring a novel method of evaluating ICP in low- and middle-income areas that lack radiological resources.
Transparency, Rigor, and Reproducibility Summary
The study was pre-registered at
Footnotes
Data Availability Statement
The raw data supporting the conclusion of this article will be made available by the authors, without undue reservation.
Ethics Statement
This study was approved by the Ethics Committee of Shanghai General Hospital, Shanghai Jiao Tong University School of Medicine. The patients/participants provided their written informed consent to participate in this study.
Acknowledgments
We would like to thank all colleagues in the department of neurosurgery for their work.
Authors' Contributions
Yihua Li: conceptualization (equal); formal analysis (lead); methodology (lead); resources (equal); validation (equal); writing–original draft (lead); writing–review and editing (equal); Guoqing Zhang: conceptualization (equal); resources (equal); validation (equal); software (lead); Yingchi Shan: conceptualization (equal); resources (equal); supervision (equal); Xiang Wu: conceptualization (equal); resources (equal); supervision (equal); Jiaqi Liu: conceptualization (equal); resources (equal); supervision (equal); Yajun Xue: conceptualization (equal); resources (equal); supervision (equal); Guoyi Gao: conceptualization (lead); funding acquisition (lead); project administration (lead); writing–review and editing (equal).
Funding Information
The study was supported by the National Natural Science Foundation of China (grant Nos. 81671198 and 81971699) and the Clinical Research Innovation Plan of Shanghai General Hospital. The funders had no role in the design of the study; in the collection, analysis, or interpretation of data; in the writing of the manuscript, or in the decision to publish the results.
Author Disclosure Statement
No competing financial interests exist.
Supplementary Material
Supplementary Table S1
References
Supplementary Material
Please find the following supplemental material available below.
For Open Access articles published under a Creative Commons License, all supplemental material carries the same license as the article it is associated with.
For non-Open Access articles published, all supplemental material carries a non-exclusive license, and permission requests for re-use of supplemental material or any part of supplemental material shall be sent directly to the copyright owner as specified in the copyright notice associated with the article.
