




Abstract
In the last decade, computational models of the brain have become the gold standard tool for investigating traumatic brain injury (TBI) mechanisms and developing novel protective equipment and other safety countermeasures. However, most studies utilizing finite element (FE) models of the brain have been conducted using models developed to represent the average neuroanatomy of a target demographic, such as the 50th percentile male. Although this is an efficient strategy, it neglects normal anatomical variations present within the population and their contributions on the brain's deformation response. As a result, the contributions of structural characteristics of the brain, such as brain volume, on brain deformation are not well understood. The objective of this study was to develop a set of statistical regression models relating measures of the size and shape of the brain to the resulting brain deformation. This was performed using a database of 125 subject-specific models, simulated under six independent head kinematic boundary conditions, spanning a range of impact modes (frontal, oblique, side), severity (non-injurious and injurious), and environments (volunteer, automotive, and American football). Two statistical regression techniques were utilized. First, simple linear regression (SLR) models were trained to relate intracranial volume (ICV) and the 95th percentile of maximum principal strain (MPS-95) for each of the impact cases. Second, a partial least squares regression model was constructed to predict MPS-95 based on the affine transformation parameters from each subject, representing the size and shape of their brain, considering the six impact conditions collectively. Both techniques indicated a strong linear relationship between ICV and MPS-95, with MPS-95 varying by approximately 5% between the smallest and largest brains. This difference represented up to 40% of the mean strain across all subjects. This study represents a comprehensive assessment of the relationships between brain anatomy and deformation, which is crucial for the development of personalized protective equipment, identifying individuals at higher risk of injury, and using computational models to aid clinical diagnostics of TBI.
Introduction
Traumatic brain injury (TBI) is a significant public health issue, accounting for nearly one-third of all injury-related deaths in the United States. 1 The majority of TBIs are sustained during accidental falls, motor vehicle crashes, and blunt impacts to the head, and in 2010 alone, they resulted in approximately 2.5 million emergency department visits (87%), hospitalizations (11%), and deaths (2%). 2,3 In addition to the general public, TBI is also a prominent injury sustained by athletic and military populations. 4,5 As a result, substantial research efforts have focused on investigating injury mechanisms and designing novel protective equipment and safety countermeasures.
TBIs can be classified as either focal or diffuse-type injuries. 6 In general, focal TBIs are those that cause localized damage to the brain, and include contusions, hematomas, and gross damage to the brain parenchyma. 6,7 Although focal injuries are typically classified as moderate-to-severe TBI and may be life-threatening, the vast majority of reported TBIs are diffuse-type injuries. 2 These injuries, such as concussions, are associated with widespread cellular damage or dysfunction 8 and can span the entire range of injury severity, from mild to fatal. 7,9
Diffuse TBIs are typically closed-head injuries sustained due to blunt impact or inertial loading of the head. Given the prevalence of diffuse TBI, many studies have been conducted to understand its mechanopathology, or the process by which these mechanical forces, transmitted to the brain during an injurious exposure, initiate the pathological processes associated with TBI. For diffuse TBI, for many decades 10,11 brain deformation has been the prevailing hypothesis for initiating the mechanisms of acute and chronic pathology and has since been supported through in vitro neurotrauma studies. 12 –14 Although many mechanisms for brain deformation have been proposed, both experimental and computational studies have demonstrated that brain deformation is highly sensitive to rotational motion of the head. 10,15 –20 Central to elucidating these relationships has been the development and utilization of finite element (FE) models of the brain, which provide detailed, and quantifiable, assessments of the brain's mechanical response as a function of head motion. 21,22 These models have been critical in demonstrating correlations between tissue-level deformation and injury risk, 19,23,24 elucidating novel injury mechanisms and contributing factors, 25 –29 and supporting the development of safety countermeasures. 30 –32
Historically, computational studies of TBI have been performed using models that represent the neuroanatomy of a target demographic, most commonly the 50th percentile male. 33 –36 Although this is certainly a pragmatic approach and is suitable for evaluating the efficacy of safety countermeasures, the use of demographic-specific models neglects anatomical variations present in the population and their influences on the brain's biomechanical response. As a result, the relationships between neuroanatomy and brain deformation are not well characterized, and previous studies have been limited to investigating how head size relates to brain deformation under limited sets of kinematic boundary conditions.
For example, Kleiven and von Holst 37 investigated how head size affected brain stresses during a single frontal impact using six models with anatomies ranging from a small female to a large male. As brain size (i.e., brain mass) increased, max shear and von Mises stresses increased. More recently, Wu and colleagues 38 developed a frequency-based scaling law for equivalent brain deformation. According to this scaling relationships, to attain equivalent brain deformation, a brain with higher natural frequency (i.e., smaller mass) would require a greater amplitude and frequency of head kinematics. The authors concluded that a brain's natural frequency is inversely proportional to brain mass, indicating that small brains will have less deformation for the same level of impact, which is consistent with the findings of Kleiven and von Holst. 37 Recent studies have corroborated the relationships between brain size and deformation 25 –27,39,40 ; however, additional work is required to generalize this relationship over a wide range of impact conditions, severities, and modes. These are important considerations given the normal anatomical variability of the brain. 41,42
Recognizing the limitations of demographic-specific models, recent studies have focused on developing techniques for generating subject-specific models of the brain by leveraging various image processing techniques widely used in the neurosciences. 26,43,44 The most basic approach to create subject-specific models is to scale a baseline model in the three anatomical directions to approximate the volume of a specific subject's brain. 40,45 An improvement over scaling is to morph the baseline model to the geometry of a subject's brain based on differences in their external surfaces, ensuring that both the size and shape of the subject's brain are represented in the model. A limitation to both techniques is that they assume internal neuroanatomical structures (e.g., ventricles) scale, or morph, as a function of the external surface, which can affect the veracity of the brain strain prediction for a specific subject. 45
The most advanced techniques to develop subject-specific brain models utilize the non-linear transformations resulting from image registration. Image registration is a process by which two images are geometrically aligned using a series of optimized mathematical transformations. 46,47 If the baseline image corresponds to the anatomy of the baseline model, the numerical transformations required to align the baseline image to the subject image can be directly applied to the baseline model, resulting in a subject-specific model that accurately represents both external and internal neuroanatomical features. 43,44 As a result, large databases of anatomically fidelic subject-specific models can be developed automatically and with minimal user intervention.
The objective of this study was to train and evaluate a set of statistical regression models that relate measures of skull and brain anatomy to brain deformation and use these models to elucidate which anatomical characteristics are related to brain deformation. Understanding these relationships will be crucial for informing the development of personalized protective equipment, identifying individuals at higher risk of brain injury, and potentially aiding clinical diagnostics.
Methods
Development of subject-specific models
Subject-specific models were generated for 125 subjects from the Enhanced Nathan Kline Institute–Rockland Sample (NKI-RS) database. 48 The inclusion criteria included males and females 21–65 years of age. Of the 374 total subjects in the NKI-RS database that satisfied the inclusion parameters, 125 were randomly selected and subject-specific models were generated for each participant using registration-based morphing (RBM). 43 RBM uses non-linear registrations to ensure that the subject-specific brain models accurately represent the subject's external and internal anatomical features. For the statistical models constructed in this study, 100 of these models served as a training set and the remaining 25 served as a testing set.
In this study, the CAB-20MSym template model 49 served as the template from which all subject-specific models were derived. This heterogeneous model was calibrated and extensively verified using in situ and in vivo brain deformation data obtained from cadavers and human volunteers, respectively. 50 –52 Further details regarding the implementation, development, and validation of the CAB-20MSym template model are available. 49
Kinematic boundary conditions
Each of the subject-specific models and the CAB20-MSym template model were simulated under an identical set of six loading conditions (Table 1). These boundary conditions were selected from a larger database of head kinematics 16 to capture a wide range in impact severity, with DAMAGE 24 values between 0.1 and 0.6, and loading directions, with frontal, side, and oblique loading modes selected. These impacts included cases from human volunteer studies (Case 1), 23 American football impact reconstructions (Cases 2 and 3), 53,54 and automotive crashes conducted by the Insurance Institute for Highway Safety (IIHS; Cases 4) 55 or as part of the National Highway Traffic Safety Administration (NHTSA) New Car Assessment Program (NCAP; Cases 5 and 6). 56 A detailed summary of these loading conditions is shown in Table 1 and 6 degree-of-freedom (DOF) kinematic plots and related references are provided in Supplementary Figures S1–S6 and the Supplementary References. Head kinematics were prescribed to a rigid shell element dura part that encased the brain model. 16 All simulations were run using the LS-Dyna explicit solver (mpp971R9.1.0 with double precision; LSTC, Livermore, CA, USA) using 40 CPUs.
Summary of Impact Cases
Case 157; Player 1 from publication by Sanchez and colleagues 54 ; non-injurious.
Case 71; Player 2 from publication by Sanchez and colleagues 54 ; resulted in a mild TBI.
Assessment of brain deformation
For all simulations, the global deformation response was assessed using the 95th percentile of maximum principal strain (MPS-95) across all elements over the duration of the simulation. The 95th percentile value was selected to avoid the influence of spurious elements that could be associated with the 100th percentile value. 22,57 –63 To facilitate a quantitative assessment of element-wise MPS distributions, the MPS results were mapped to the common CAB-20MSym template image space. 43 Elements within fluid-filled spaces (e.g., ventricles) were not included in these assessments.
Statistical analysis
In this study, three statistical analyses were performed to identify the relationships between brain size and shape and the resulting MPS-95. At the simplest level, the intracranial volume (ICV) for each subject was computed and a simple linear regression (SLR) model was fit to predict MPS-95 independently for each impact condition. ICV was determined by measuring the volume of all solid elements in each subject-specific model, which represented the brain parenchyma and all cerebrospinal fluid (CSF) filled spaces. In SLR the dependent variable,
where,
To identify regions of the brain where the MPS response is more sensitive to brain size, a secondary SLR assessment was performed at the voxel-level. Using the subject-specific MPS distributions mapped to the template image space, a SLR regression was performed for each voxel to assess the correlation between each individual voxel's MPS and the global volume of the brain. For each regression, the R2 value was computed and mapped to the template space, resulting in a single R2 image for each loading case. Areas with larger R2 values indicated a stronger relationship between MPS in those regions and brain size. Voxels with MPS exceeding the 75th percentile voxel-wise MPS and the 75th percentile voxel-wise R2 were mapped to the template image for each impact condition.
The third statistical analysis utilized partial least squares regression (PLSR) to identify latent variables (LV), or linear combinations, that maximize the covariance between the LV of the input variables,
where
In this study,
where
Finally, each column of
Because the affine transformation matrix is a linear transformation, operating equally on all voxels in the brain image, this approach identified a single, generalized relationship between the size and shape of the brain and the MPS-95 across all six impact conditions. The PLSR model was fit using the “plsregress” function in Matlab, which uses the SIMPLS algorithm.
68
A 10-fold cross-validation was utilized to determine the optimal number of LV to include in the PLSR.
70
The optimal number of LV (N
LV) used in the PLSR was determined using the adjusted Wold's R criteria,
65
where, MSE(m) is the mean squared error obtained from cross-validation after including the first m LV. N
LV was determined as the LV where Wold's R surpassed a threshold of 0.95. This threshold ensures that additional LV will not be included in the PLSR unless they provide a significantly better prediction.
65
For the determined N
LV and the corresponding LV scores (

The test subjects (n = 25) were used to evaluate the PLSR fit. The Matlab “plsregress” function determined the PLSR regression coefficients in the original data space; therefore, the predicted values were a simple linear combination of the coefficients and test subject variables,
PLSR constructs LV using linear combinations of the original variables, defined in the loading matrix of
The SLR and PLSR models were fit using 100 subjects assigned as the training set and evaluated using 25 subjects assigned as the test set. Model accuracy was assessed by comparing the statistical model-predicted MPS-95 with the corresponding value from the simulation. For a “perfect” model a linear regression between the true and predicted MPS-95 would have a slope (β) of 1, intercept (β 0) of 0, and R2 of 1.
Results
General brain deformation
Across the six impacts included in this study, mean MPS-95 values ranged from 0.10 in Case 1 to 0.36 in Case 6 (Fig. 1). For any given case, MPS-95 values varied by 0.04–0.08 strain between subjects sustaining lowest and highest deformation amounts (Table 2).

Violin plot indicating the spread and distributions of MPS-95 for each impact across 100 subjects in the training set. MPS-95; 95th percentile of maximum principal strain.
Range of MPS-95 Values for Each Impact Case Including the CAB-20MSym Template Model and Subject-Specific Models
Mean and standard deviation are shown in parentheses for subject-specific simulations.
MPS distributions for subjects sub-A00035378 and sub-A00035562 under the boundary conditions of Case 3 are shown in Figure 2. These subjects represent the models that sustained the lowest (0.23) and largest (0.28) MPS-95, respectively. Although both subjects experienced large deformations at the periphery of the brain, sub-A00035562 experienced larger deformation within the cerebrum, especially in regions proximal to the lateral ventricles.
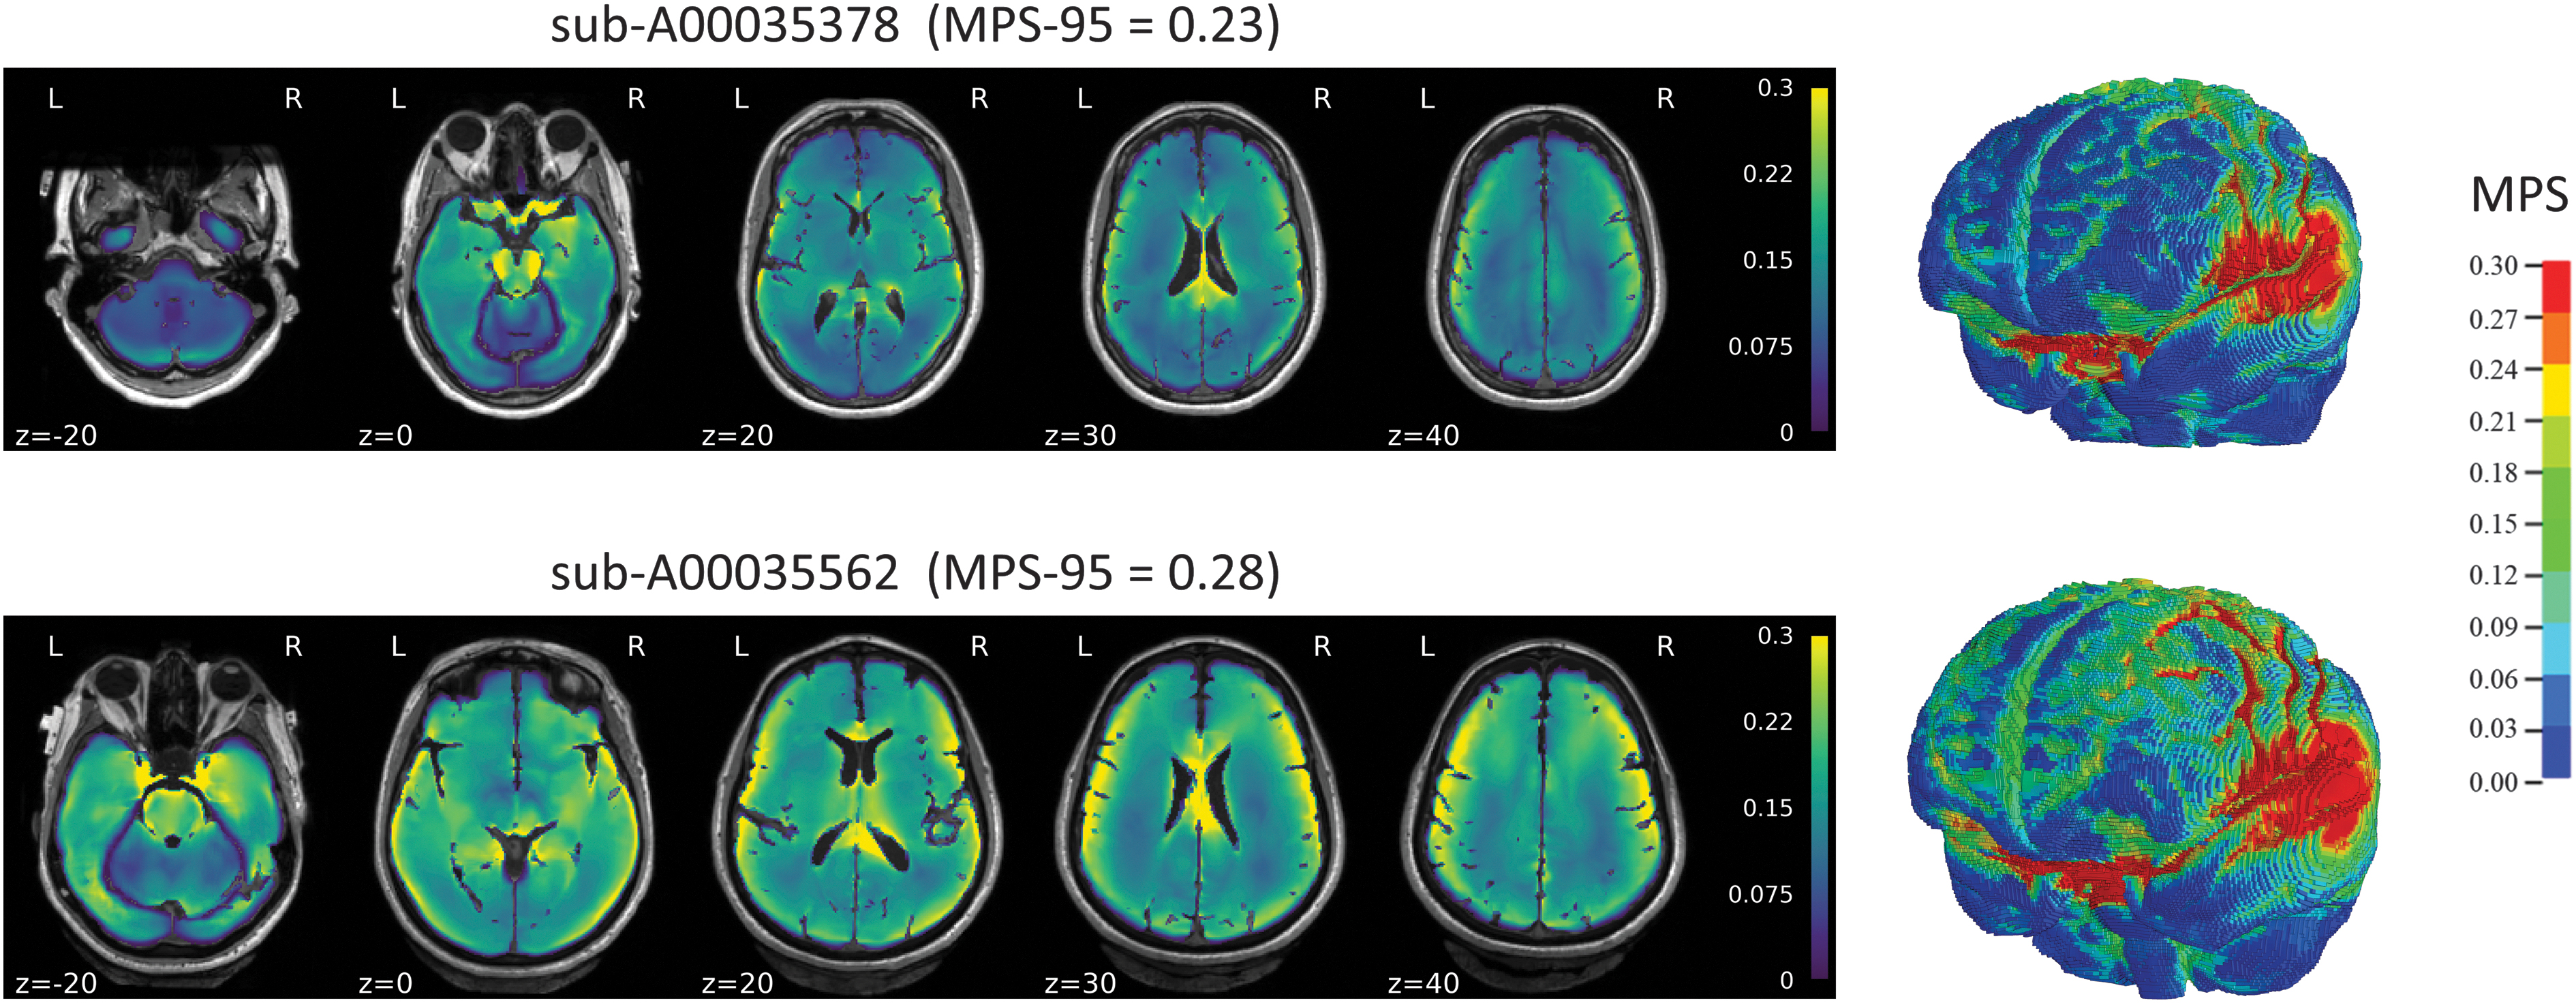
MPS distributions for the subjects sustaining lowest and greatest MPS-95 under the boundary conditions of Case 3. Results are shown in subject space. MPS-95; 95th percentile of maximum principal strain.
Although the MPS distributions varied across the six impact cases, larger deformations were typically observed along the periphery of the brain. However, additional regions with large deformation were also observed in the different impact cases, including portions of the corpus callosum, periventricular areas, pons, and brainstem.
Simple linear regression
The SLR model for Case 3 is shown in Figure 3 and similar plots for the remaining cases are shown in Supplementary Figures S1–S6. In these figures, model performance for both training and testing data sets are shown. R2 values for the six SLR models are shown in Table 3. Strong linear relationships between ICV and MPS-95 were observed across the six impact conditions, with R2 values between 0.84 and 0.95 using the training data. When assessed using independent test data, similarly strong linear relationships between the true and predicted MPS-95 were observed, with R2 values between 0.84 and 0.95, slopes between 0.80 and 1.00, and intercepts between 0 and 0.04 (Table 3). These results suggest that ICV is a strong predictor of MPS-95 for each of the six cases.

SLR model for Case 3. Left: regression between ICV and MPS-95 using training data. Right: regression between true and predicted MPS-95 using the test data. ICV, intracranial volume; MPS-95; 95th percentile of maximum principal strain; SLR, simple linear regression.
SLR Models for Each of the Impact Cases
Performance using training (left) and testing (right) data are shown.
ICV, intracranial volume; MPS-95; 95th percentile of maximum principal strain; SLR, simple linear regression.
Regional sensitivity to brain size
Voxel-wise R2 values were computed to identify brain regions where the deformation response was particularly sensitive to the size of the brain. Across the six impact cases, sensitive regions were primarily located at the periphery of the brain, where white and gray matter interface; however, the location of these peripheral regions varied across the six cases. For instance, in Cases 1, 3, and 6 these sensitive peripheral regions were relatively symmetric, whereas in Cases 2, 4, and 5 the sensitive regions were unilateral. Additional sensitive regions included periventricular areas in Cases 3 and 4, the pons and brainstem in Cases 1, 3, and 6, and corpus callosum in Case 4. Although there was some overlap between these sensitive regions and areas of large deformation, this was not always the case. For example, in Case 5, large deformations were sustained throughout the corpus callosum, where the sensitivity to brain anatomy was relatively low.
Partial least squares regression
Two LV were utilized to construct the PLSR model. Combined, these LV explained approximately 72% of the variance observed in the MPS-95 responses. The first LV, accounting for 70% of the total variance in MPS-95, was clearly related to the ICV of the skull. The second LV was more challenging to interpret but was primarily related to the shape of the sagittal plane of the brain. This included the length-to-height ratio and cross-sectional area of the sagittal plane, as well as the brain's orientation within the head, relative to the Frankfurt plane (Fig. 4). Supplementary Videos S1 and S2 depict these geometric modes.
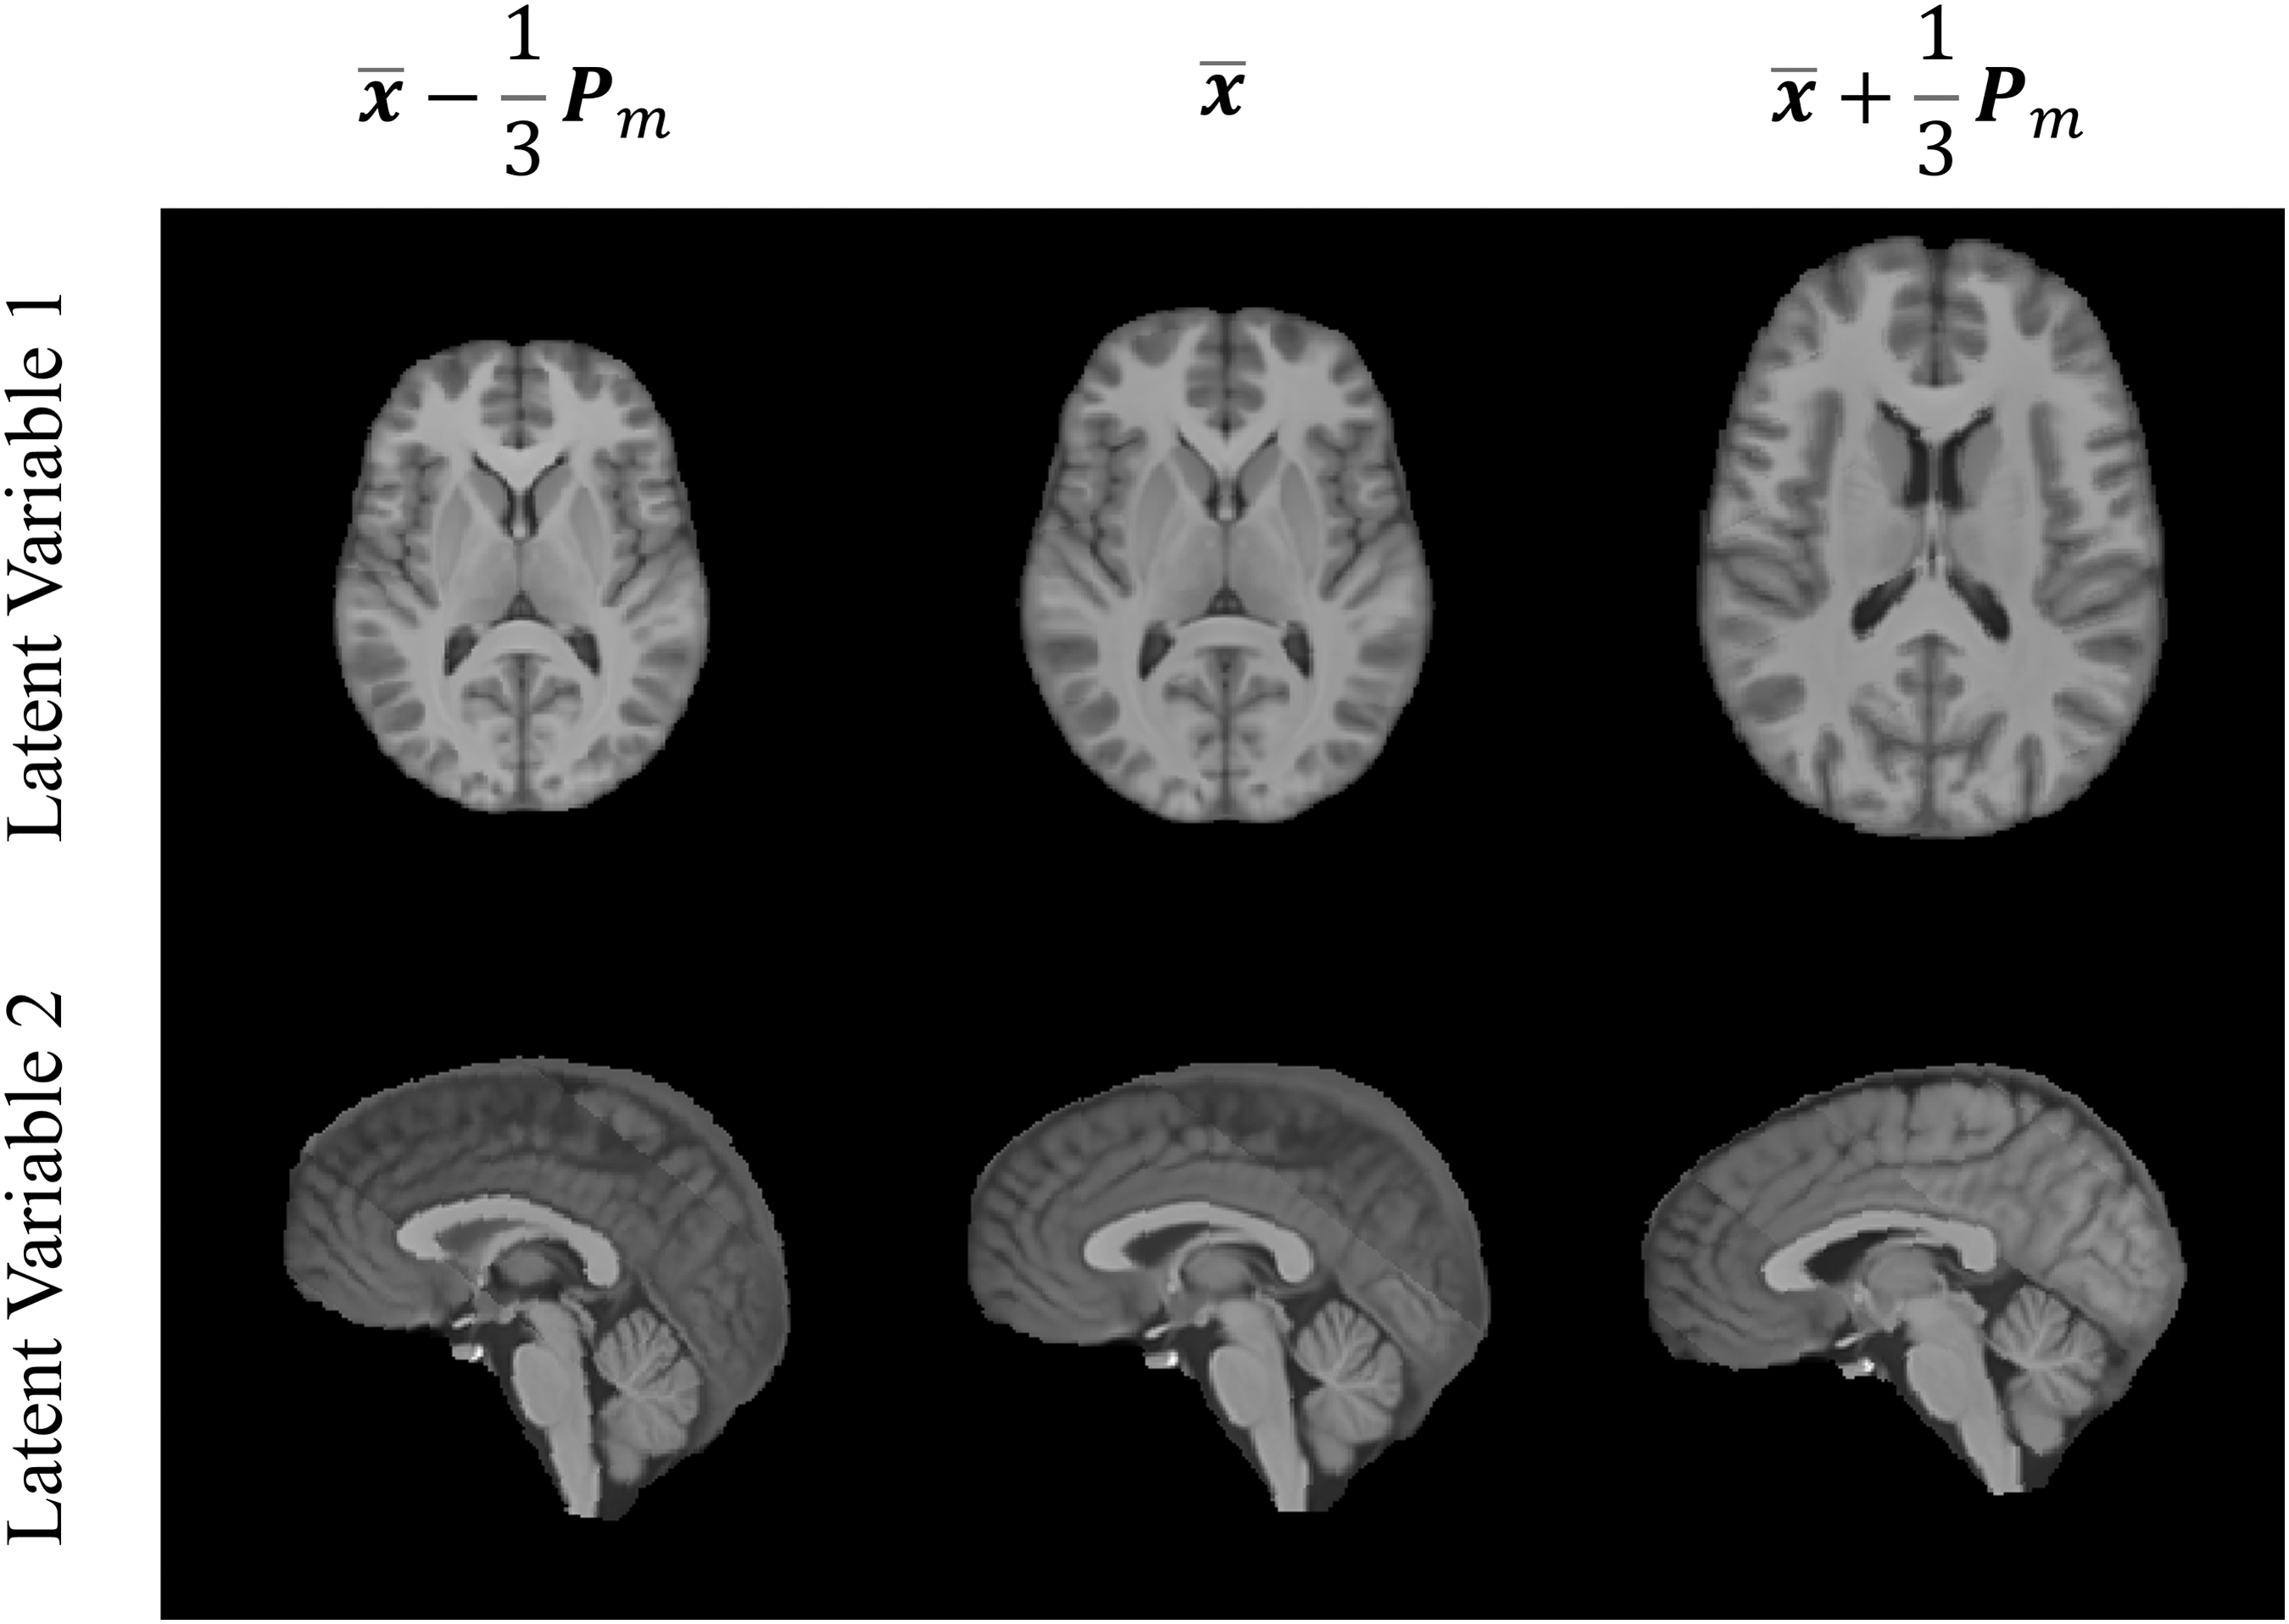
Geometric modes of the first two latent variables, demonstrated by scaling the loadings of each latent variable and applying them to the CAB-20MSym template image.
The PLSR model is shown in Figure 5. Considering the six cases simultaneously, the PLSR model could predict MPS-95 using both training and testing data, with R2 and slopes greater than 0.99 and intercepts of 0 (Table 4).
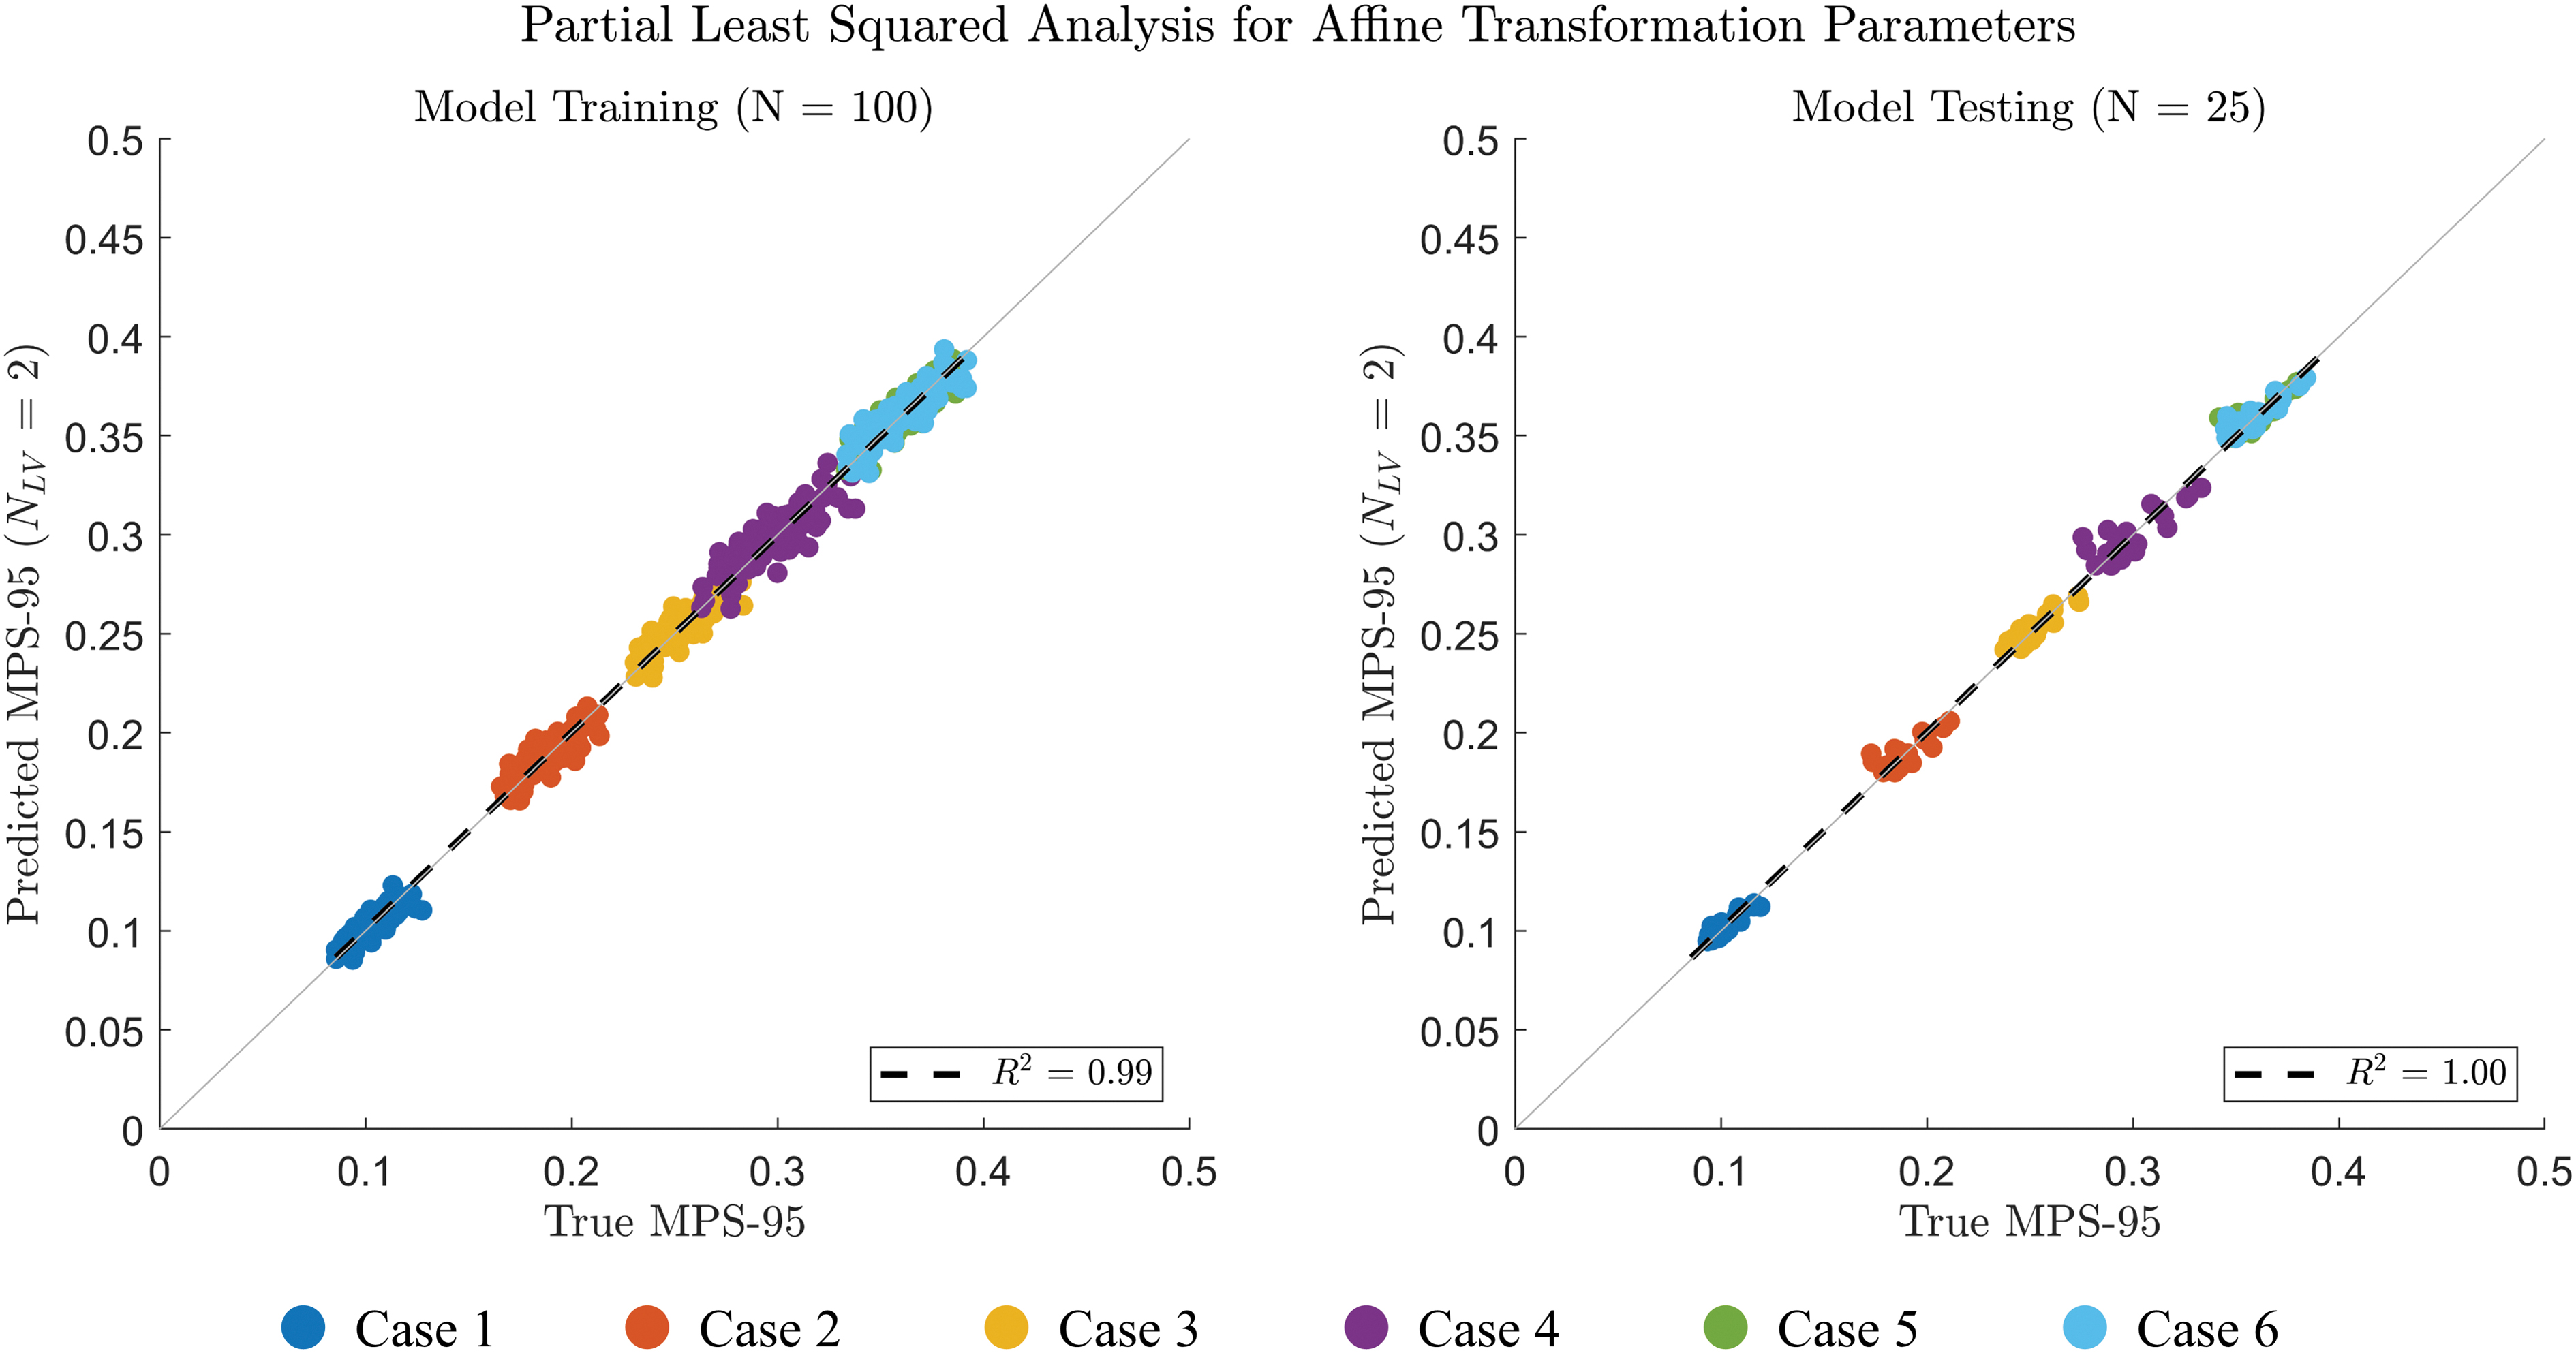
Partial least squares model. Left: regression between true and predicted MPS-95 using training data. Right: regression between true and predicted MPS-95 using the test data. Note data for Cases 5 and 6 are overlapped. MPS-95; 95th percentile of maximum principal strain.
Partial Least Squares Regression Model Performance Using Training (left) and Testing (right) Data
Discussion
In this study, 125 subject-specific models were simulated under six real-world head kinematic boundary conditions to assess the relationships between brain size and deformation. Overall, the techniques utilized in this study demonstrated strong relationships between ICV and MPS-95 when considering each impact case individually (using SLR) and all cases collectively (using PLSR).
The boundary conditions simulated in this study spanned loading environments (controlled volunteer tests, football impacts, automotive crash), directions (frontal, side, oblique), and overall injury severities, with the six cases selected to span 6 decades of DAMAGE values (0.1–0.6). 24 DAMAGE was developed using the Global Human Body Models Consortium (GHBMC) 50th percentile male brain model 34 and predicts the MPS-95 value of this model under a set of head kinematics. The GHBMC model utilizes a linear viscoelastic constitutive model for the brain tissue, whereas the models in this study utilized a Ogden rubber quasi-linear viscoelastic material, which accounts for the non-linearity in the brain tissue material response. 49,71,72 This is responsible for the differences in MPS-95 predicted using the subject-specific models and DAMAGE for the higher-severity impact cases (Cases 4–6). Nonetheless, DAMAGE was used as a general guideline to select impact cases from a much larger database with over 1000 impact cases, and these differences do not reflect on the utility or accuracy of DAMAGE, or influence the results of this study.
Across the six impact cases, the difference in MPS-95 between the smallest and largest brains was approximately 5.5% strain (4–8% strain). In general, the difference in MPS-95 was greater in cases where brain deformation was largest. For example, the range in MPS-95 was 4% in Cases 1 and 2, compared with 6% in Cases 5 and 6. Although the magnitudes of these MPS-95 differences are small, when considered relative to the mean strain they become more consequential. Across the six cases, these MPS-95 ranges represented 17–40% of the mean strain. This suggests that in the most extreme scenario, differences in ICV may influence brain deformation by up to 40%; however, this is dependent on the impact condition. These may also have significant implications on injury risk assessments; however, additional work is required to understand how the differences in brain deformation observed in this study relate to differences in injury risk. Across the six cases, the relationship between ICV and MPS-95 was strongly linear, with R2 values ranging between 0.84 and 0.95 (Fig. 3 and Table 3). Additional SLR models were constructed to investigate the relationships between the length, width, and height of the brain and MPS-95 independently; however, these variables demonstrated considerably weaker relationships to MPS-95 than ICV (R 2 between 0.44 and 0.60). The relationship between ICV and MPS-95 was also evident from the PLSR model, which was constructed considering all six impact cases collectively. The geometric mode of the first LV, which explained 70% of the variance in the MPS-95 across all cases, was clearly related to variation in ICV (Fig. 4). These results agree with previous studies that have investigated relationships between brain size and deformation. 10,25,27,37,38,73 Although these studies have reported that brain deformation increases with brain size, this is the first to derive a single statistical model that generalizes the strength and linearity of this relationship over a range of loading directions, severities, and modes.
A voxel-level regression analysis was performed to highlight areas of the brain where the deformation response was sensitive to changes in ICV. In this analysis, only voxels with high MPS and R2 values were considered. Therefore, the regions indicated in Figure 6 were those that had a high dependency on ICV, and the related differences in MPS in these regions were meaningful from a biomechanical, and potentially clinical, perspective. Across the six impact conditions, sensitive regions were primarily located where gray and white matter interfaced. However, the exact locations of gray-white interface affected varied across the six impact cases. Additional sensitive regions were also observed in periventricular areas (Cases 3 and 4), in the pons and brainstem (Cases 1, 3, and 6), and in portions of the corpus callosum (all cases). The spatial variability of these regions across impact conditions reconciles with neuroimaging observations of a general traumatic “pattern” of brain injury that varies considerably across individual injury conditions. 74 The regions identified by the regression are among those regions that have been repeatedly implicated in biomechanical and neuroimaging studies of TBI 75 –84 and may account for differences in injury risk across subjects under seemingly identical loading conditions.
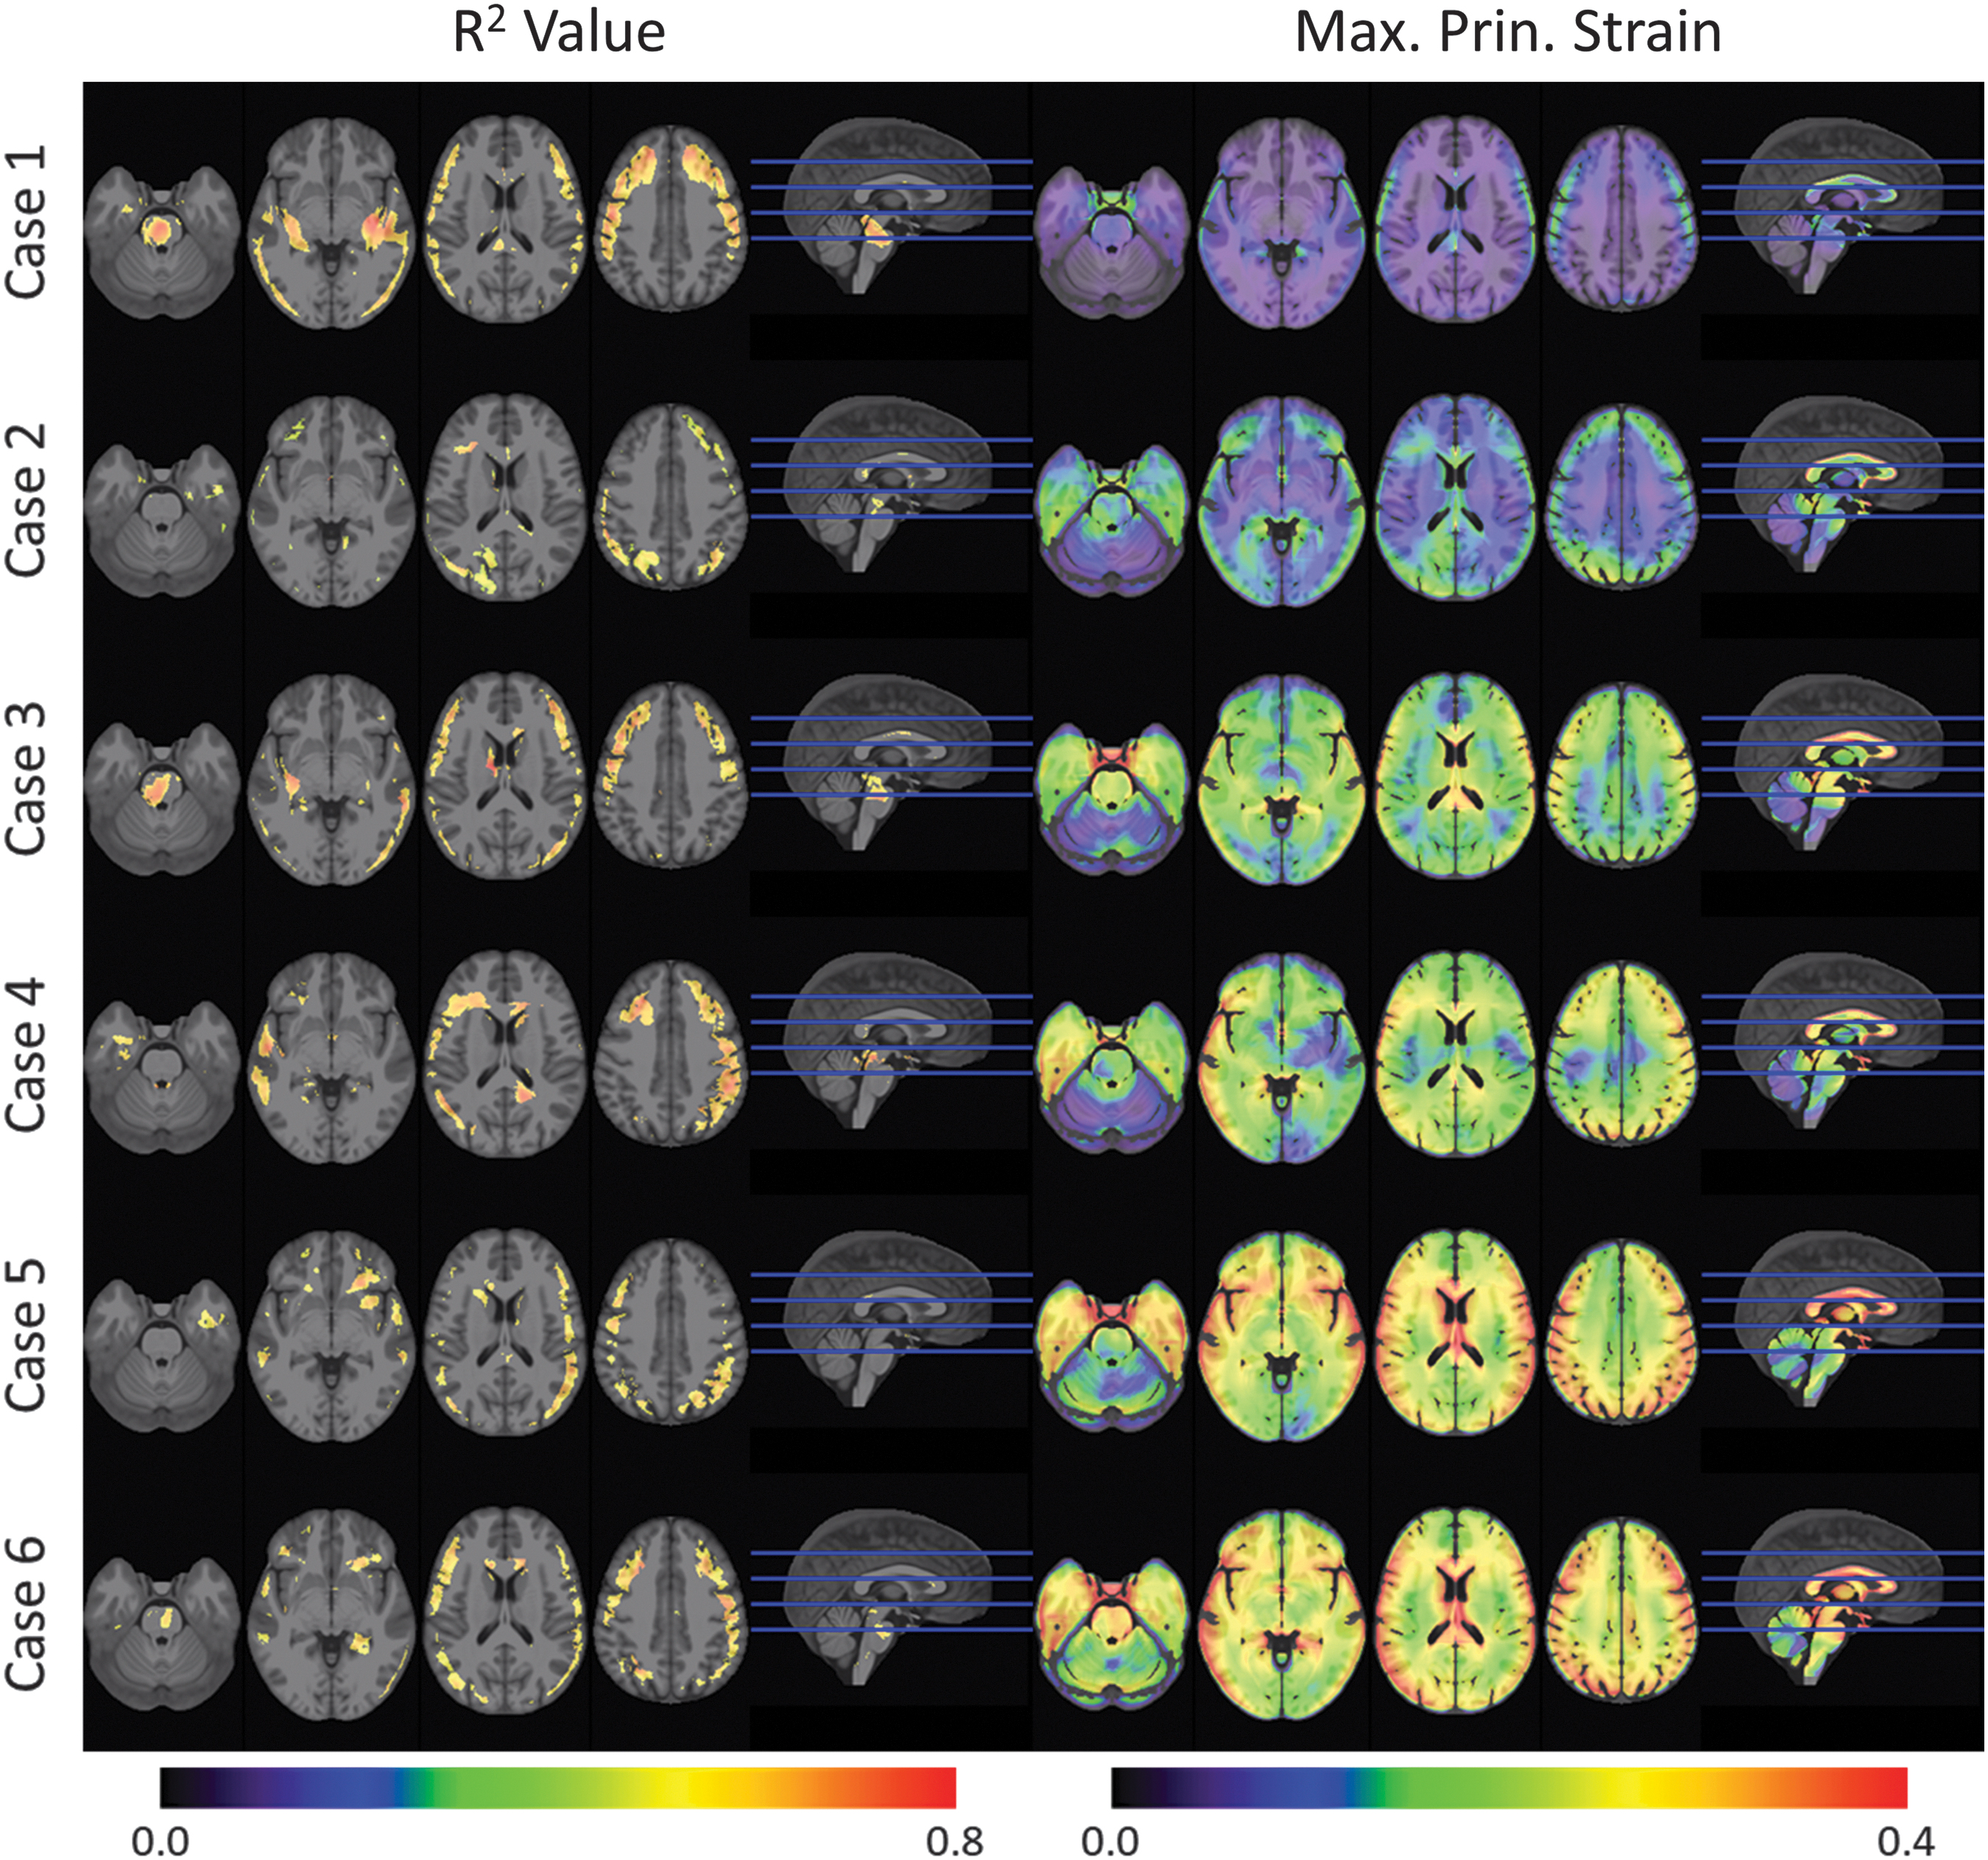
Left: R2 values highlighting regions sensitive to changes in intracranial volume. Highlighted voxels are those that exceed the 75th percentile R2 values and MPS. Right: MPS maps from simulations run with the CAB-20MSym template model (right). Results are shown in template space. MPS, maximum principal strain.
In this study, PLSR was used to examine the relationship between the size and shape of the brain and MPS-95, considering the results from all impact cases collectively. Using the independent test data, the PLSR model was capable of accurately predicting MPS-95 for the six impact cases as a function of two linear combinations of the 15 affine transformation parameters for each of the subjects. Although this PLSR model was limited to the six impact conditions investigated in this study, this technique could serve as a rapid assessment of subject-specific deformation levels, relative to a baseline anatomy (e.g., a template model), over a wide range of impact conditions. This is facilitated by the computational efficiency of image registration algorithms. Computing the affine transformation between two neuroimages and exercising the PLSR model for new test subjects can be performed in the order of 101 sec, whereas running a subject-specific model can take upwards of 104 sec.
Despite the strong relationship between ICV and MPS-95, the results from the PLSR model provide evidence for more intricate relationships between skull shape and brain anatomy and MPS-95. Although the first LV (i.e., ICV) accounted for 70% of the variance in MPS-95, the remaining 30% was related to other anatomical features. These other features could be considered by constructing similar PLSR models using other types of input variables that represent more localized measures of the neuroanatomy. For example, if an assessment of the effects of local brain anatomy, controlling for the size and shape of the skull, was desirable, a PLSR model could be constructed using deformation field displacements from the non-linear transformation step of image registration. However, fitting such a PLSR model would require substantial computational resources as the input variable matrix would require approximately 7 million datapoints for each subject.
There were several limitations to this study. First, this study only considered sox impact cases and the results should not be extrapolated beyond the range of deformation and impact severity represented by the selected boundary conditions. However, the cases investigated in this study were broad, representing a wide range of impact severity (including known injurious and non-injurious cases), impact modes, surrogates, and environments. Additionally, all kinematic boundary conditions were applied equally to all subject-specific models. Likewise, all subject-specific models were simulated using identical material properties. Although this was done to isolate the effects of the neuroanatomy, all three of these factors contribute to the brain's deformation response and additional work is required to understand their respective effect sizes. Further, this study primarily considered global assessments of brain anatomy and deformation.
Future work should expand on the techniques utilized in this study to consider the effects of more localized anatomical traits. Although global MPS-95 is correlated to diffuse TBI (e.g., concussion) risk, 16,19 other deformation metrics, such as axonal strains, may be more predictive of injury. 29,85,86 Future work should also focus on identifying clinically relevant neuroanatomical regions and extend these analyses to consider regional deformation responses. Further, this study utilized linear regression models. Given that the brain is both complex and highly non-linear, it is possible that more sophisticated machine learning and regression techniques may be able to detect non-linear features and interactions present in both neuroimaging and the deformation response. 66,87 Finally, this study considered healthy, human brains. Without further assessment, the results and conclusions of this study cannot be applied to other populations (e.g., pediatrics) or species (e.g., non-human primates). Although scaling relationships based on the natural frequency of the brain, which is related to the volume of the brain, have been developed to relate human and non-human deformation responses, 38 it cannot be assumed that the regression models developed in this study apply to these species.
In computational studies of TBI, assessments of impact severity are typically quantified using models that represent the anatomy of a target demographic, commonly the 50th percentile male. 57 As a result, injury risk assessment, including the development of injury risk functions, is often performed without considering any variation in the brain's anatomy within the larger population. Although this approach may be suitable for assessing the efficacy of safety countermeasures, such as helmets and restraint systems, the results presented in this study suggest that the inherent variability in the brain's morphology across the population is a contributing factor in its deformation response. As a result, these anatomical features should not be neglected when evaluating an individual subject, especially when the impact conditions result in large deformations. This is also important when evaluating subjects whose brain volume cannot be approximated by an available demographics-based model such as the 50th percentile male.
Footnotes
Transparency,Rigor,and Reproducibility Summary
The study and analysis plan were not formally registered. A sample size of 125 subjects and 6 load cases was used based on computational processing capacity. All computational models were developed, simulated, and post-processed at the same time. Morphological regression models were trained using 100 subjects, and 25 subjects were used to test the regression models. All finite element simulations were run using the LS-Dyna explicit solver (mpp971R9.1.0 with double precision; LSTC, Livermore, CA, USA) using 40 CPUs. All images used to conduct the study were obtained from the NKI-RS database. The biomechanical head kinematics used in this study are publicly available from the sources listed in the manuscript. The analytic code and computational models used to conduct the analyses presented in this study are not available in a public archive but the algorithms are described in detail in this manuscript and in other methodology papers cited. The authors agree to provide the full content of the manuscript on request by contacting the corresponding author.
Acknowledgments
The authors are thankful to the Achievement Rewards for Collegiate Scientists (ARCS) Foundation and the University of Virginia (UVA) Brain Institute for supporting this research.
Authors' Contributions
All authors contributed to the conception, design, and interpretation of the results presented in this study and are accountable for all aspects of this work.
Funding Information
Funding for this study was provided in part by the Achievement Rewards for Collegiate Scientists (ARCS) Foundation, and the UVA Brain Institute's Presidential Fellowship in Collaborative Neuroscience award.
Author Disclosure Statement
No competing financial interests exist.
Supplementary Material
Supplementary Figure S1
Supplementary Figure S2
Supplementary Figure S3
Supplementary Figure S4
Supplementary Figure S5
Supplementary Figure S6
Supplementary References
Supplementary Video S1
Supplementary Video S2
References
Supplementary Material
Please find the following supplemental material available below.
For Open Access articles published under a Creative Commons License, all supplemental material carries the same license as the article it is associated with.
For non-Open Access articles published, all supplemental material carries a non-exclusive license, and permission requests for re-use of supplemental material or any part of supplemental material shall be sent directly to the copyright owner as specified in the copyright notice associated with the article.
