




Abstract
Traumatic brain injury (TBI) causes cognitive impairment but it remains contested regarding which cognitive domains are most affected. Further, moderate-severe TBI is known to be deleterious, but studies of mild TBI (mTBI) show a greater mix of negative and positive findings. This study examines the longer-term cognitive effects of TBI severity and number of mTBIs in later life. We examined a subset (n = 15,764) of the PROTECT study, a cohort assessing risk factors for cognitive decline (ages between 50 and 90 years). Participants completed cognitive assessments annually for 4 years. Cognitive tests were grouped using a principal components analysis (PCA) into working memory, episodic memory, attention, processing speed, and executive function. Lifetime TBI severity and number were retrospectively recalled by participants using the Brain Injury Screening Questionnaire (BISQ). Linear mixed models (LMMs) examined the effect of severity of head injury (non-TBI head strike, mTBI, and moderate-severe TBI) and number of mTBI at baseline and over time. mTBI was considered as a continuous and categorical variable (groups: 0 mTBI, 1 mTBI, 2 mTBIs, 3 mTBIs, and 4+ mTBIs). Of the participants 5725 (36.3%) reported at least one mTBI and 510 (3.2%) at least one moderate-severe TBI, whereas 3711 (23.5%) had suffered at worst a non-TBI head strike and 5818 (32.9%) reported no head injuries. The participants had suffered their last reported head injury an average (standard deviation, SD) of 29.6 (20.0) years prior to the study. Regarding outcomes, there was no worsening in longitudinal cognitive trajectories over the study duration but at baseline there were significant cognitive deficits associated with TBI. At baseline, compared with those without head injury, individuals reporting at least one moderate-severe TBI had significantly poorer attention (B = −0.163, p
Introduction
In the United Kingdom 2% of the population (∼1.4 million people) attend emergency departments each year with a head injury. 1 It is the leading cause of death in people under age 40 years. Traumatic brain injury (TBI) increases risk of dementia by 1.5–3 times and estimates suggest that TBI contributes between 3.4% and 15% of dementia burden. 2,3 Although it is clear that TBI causes cognitive deficits, the time course of these deficits, the cognitive domains most affected, and the impact of repeat TBI remain subjects of debate.
The Centers for Disease Control and Prevention state that TBI is “caused by a bump, blow, or jolt to the head, or penetrating head injury.” 4 Importantly, not all head injuries cause TBI. A TBI, by definition, must disrupt the normal function of the brain. 4 TBIs vary in severity from mild (a transient alteration in mental status or loss of consciousness [LOC] of less than 30 min) to severe (extended period of amnesia or unconsciousness greater than 30 min), as defined by the Mayo TBI Severity Classification System. 5 Definitions of TBI continue to develop and some include intracranial lesions on imaging, focal neurological deficits, or cognitive/emotional symptoms. 6
TBI and cognitive deficit time course: Fixed steps or accelerating decline?
TBI results in acute, direct neuronal damage and some studies suggest that subsequent to the acute period there is a chronic accumulation of pathological tau, amyloid beta, and TDP-43 with concomitant microglial activation, which persists for years post-injury. 7 Pre-clinical research suggests that the initial acute injury should result in a precipitous cognitive impairment, whereas the chronic phase of accumulating proteinopathies should result in a progressive dementia-like process and thus more rapid cognitive decline over subsequent decades 8 (see Fig. 1). However, these pre-clinical findings remain contested given the small study samples, uncontrolled confounders, and predominant male populations in the studies. 9,10 Indeed, the more rapid cognitive decline has not yet been borne out in the literature. Although TBI has been shown to cause a sudden cognitive deficit that improves then stabilizes in the months after the injury, 11,12 studies have not consistently demonstrated a subsequent and more rapid cognitive decline. 13 –16
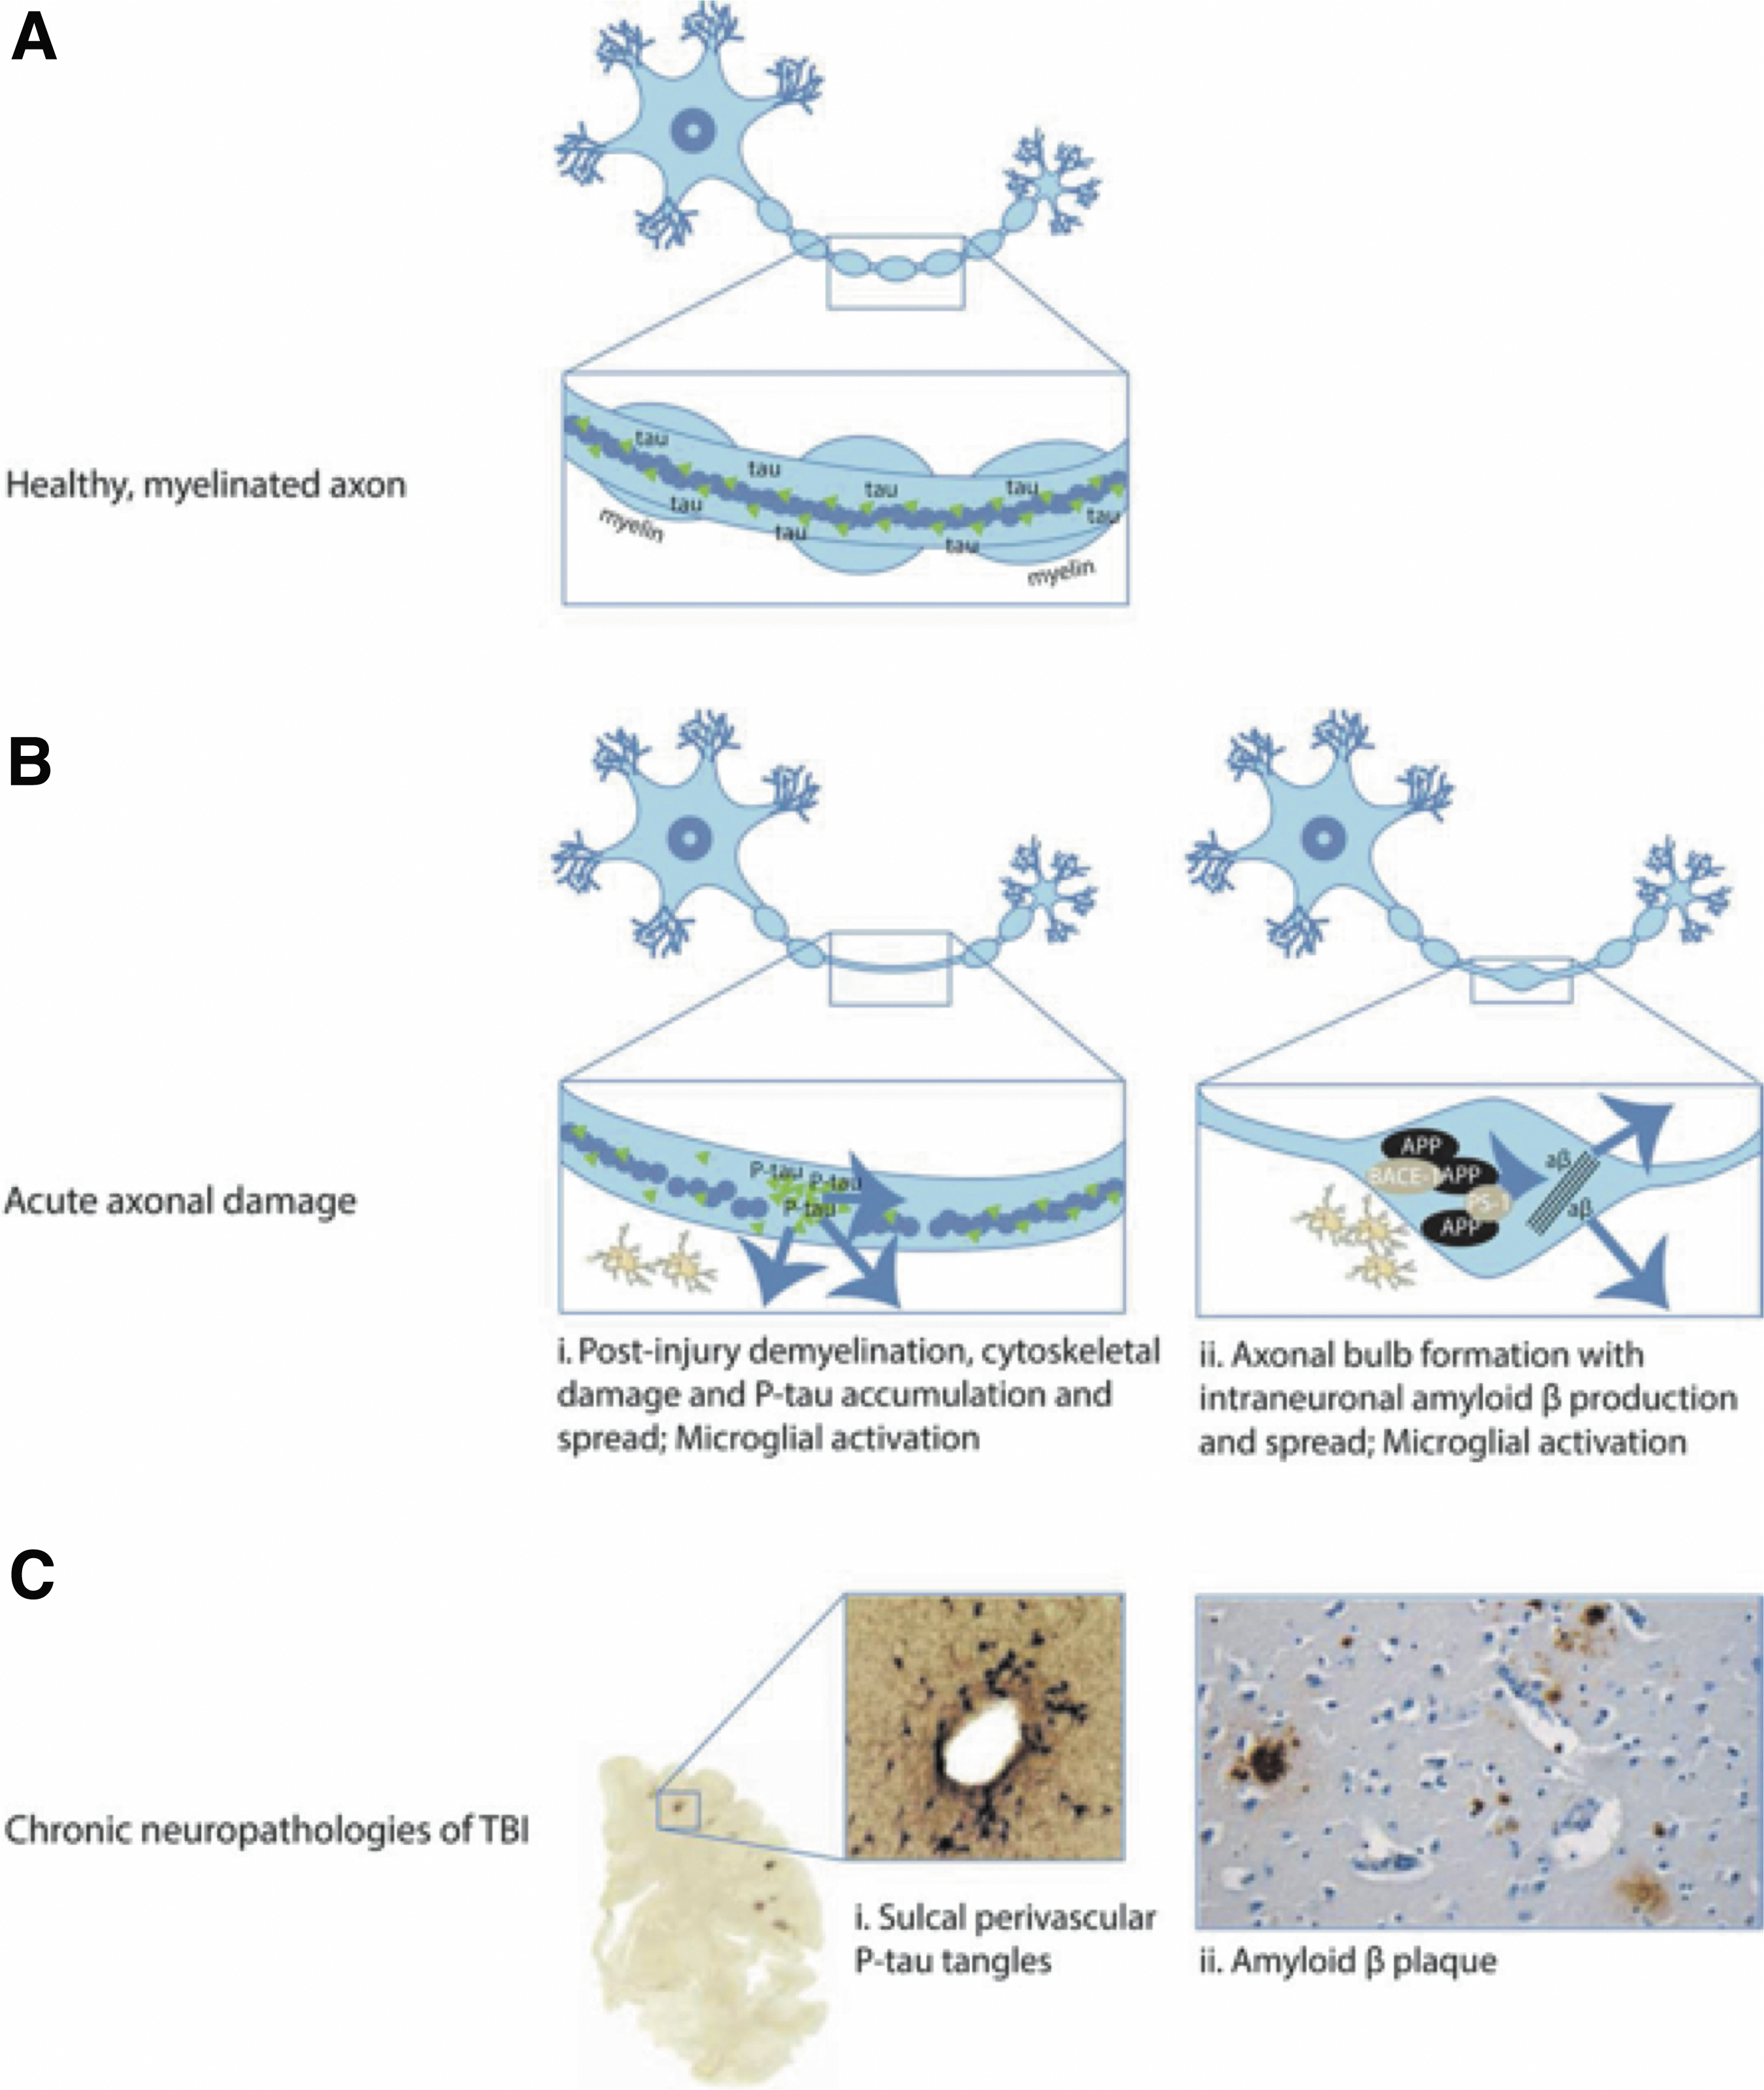
Post traumatic brain injury (TBI) acute neuropathologies and chronic neurodegeneration.
Cognitive domains affected by moderate-severe TBI
Moderate-severe TBI has been associated with deficits in a number of cognitive domains, including episodic memory, processing speed, attention, working memory, and executive function. 17 –19 Episodic memory deficits (67.5%) and attention deficits (56.7%) are the most frequent subjective complaints reported 4 years following moderate-severe TBI. 20 Interestingly, a 2007 meta-analysis 21 found that in the years following moderate-severe TBI, deficits in processing speed (Cohen's d = 1.10) were greater than attention span (cohen's d = 1.01). By contrast, working memory deficits, although important, are substantially smaller according to a recent meta-analysis that included studies of participants between 4 and 39 years post-injury (verbal working memory Cohen's d = 0.37 and visuospatial working memory Cohen's d = 0.69). 12 Although there has not been a large quantitative synthesis of the effect of moderate-severe TBI on executive function there is a large body of evidence supporting its clinical importance in TBI sufferers. 22 The developing literature on specific cognitive domain effects of TBI continue to inform evidence-based guidelines 23 for cognitive rehabilitation post-TBI.
Mild TBI: How many is too many?
It has been understood for some time that moderate-severe TBI causes neurological damage and global cognitive impairment, but recent human studies have demonstrated that a single mTBI can cause similar pathophysiological changes, including diffuse axonal injury, altered neurotransmitter activity, and modified levels of brain excitability. 24,25 Epidemiological studies have had mixed results however, with a preponderance of studies indicating a single mTBI has no discernible cognitive effects. 26 Studies have also examined whether multiple mTBIs can cause cognitive deficits comparable to a single moderate-severe TBI and how many can be incurred before these deficits become apparent. A number of studies of young athletes have found that individuals who had suffered either 2+ or 3+ mTBIs had significantly worsened cognitive outcomes 27 –29 several years following the injury, although several others have found no association. 30,31 Most of these studies examining the cognitive effect of multiple mTBI examined only athletes, focussed on those in their 20s, were cross-sectional in design, and did not follow participants for more than 7 years.
There is a paucity of studies examining the effect of TBI on cognitive domains in a long-term, longitudinal cohort. This study uses the Brain Injury Screening Questionnaire (BISQ), 32 a validated retrospective screening tool for head injuries, to assess the impact of lifetime TBI. It is the largest study to date to explore the cognitive effects of TBI and examines both baseline cognitive scores and cognitive change over time. Specifically, it considers changes in old age, whereas most studies have considered populations in younger adulthood. It focuses on two key questions: (1) Which cognitive domains are most susceptible to mTBI and moderate-severe TBI in the long term? and (2) Do increasing numbers of mTBI worsen cognitive baseline scores and/or cognitive trajectories?
Methods
Participant population
The PROTECT study, launched in November 2015, is an ongoing online investigation of a large cohort of 50- to 90-year-old individuals examining genetic and epidemiological risk factors for cognitive decline. 33 Individuals were required to have access to a computer and were excluded from the study if they had a diagnosis of dementia at baseline. Ethics approval was gained from the UK London Bridge National Research Ethics Committee (Ref. 13/LO/1578). Participants had a baseline assessment (Wave 1) and up to 4 years of annual assessments (Waves 2–5). The entire PROTECT cohort comprises approximately 28,000 participants but this study included only the subset for whom TBI data were available (n = 15,764). Comprehensive descriptions of the study have been published previously. 33
Classification of TBI
Information on TBI was gathered using the BISQ, 32 which was an optional but encouraged self-administered survey within the PROTECT study. The BISQ screens for lifetime history of head injuries and captures the etiology of the injury (sports related, motor vehicle crashes, etc.), age at first/last TBI, the number of injuries, and the severity of each episode (length of time unconscious/dazed or confused).
Each reported head injury was classified, based on available data, into three categories according to the Mayo TBI Severity Classification System: Non-TBI Head Strike: a head injury without any subsequent loss of consciousness or dazed or confused episode. mTBI: a head injury followed by LOC of less than 30 min or a dazed or confused episode. Moderate-Severe TBI: a head injury followed by LOC of 30 min or longer.
In the first analysis, individuals were grouped based on the worst injury they had suffered (i.e., No Head Injury (comparison group), Non-TBI Head Strike, mTBI, or Moderate-Severe TBI). This was then followed by an analysis of the effect of the number of mTBIs. Ideally, we would have explored the effects of increasing numbers of both mTBI and moderate-severe TBI, but there was not a sufficient sample of those with multiple moderate-severe TBI to explore this. Using the BISQ data, each instance of mTBI reported was summed into a total and those who had not had a TBI were used as the comparison group. To assess whether any association between numbers of mTBI and cognitive outcomes existed, mTBI number was first examined as a continuous variable. Then, to establish a threshold at which the number of mTBIs may cause a significant deterioration, mTBI was examined as a categorical variable examining the following groups: 0 mTBI (comparison group), 1 mTBI, 2 mTBIs, 3 mTBIs, and 4+ mTBIs. To reduce confounding in this part of the analysis, all those who had suffered a moderate-severe TBI were excluded from this second part of the analysis.
Calculation of cognitive domain scores
The PROTECT study included three batteries of cognitive tests. The PROTECT Cognitive Test Battery (PCTB) comprised the Digit Span Test, Paired Associates Learning Test, Baddeley Grammatical Reasoning Test (Verbal Reasoning), and the Spatial Working Memory (Self-Ordered Search) Test. There has been 4 years of follow-up for this battery. The second cognitive battery, COGTRACK, involved a number of tests assessing reaction time, processing speed, attention, and episodic memory (see section A in Supplementary Appendix SA1 for battery descriptions). This testing battery was ceased after 3 years of follow-up. The third cognitive battery was added after 3 years of the study running and included the Stroop switching task and the Trail Making Test B (TMTB). The uptake of the third testing battery has been considerably smaller (n = 5184 vs. 15,764) and there has only been a small portion of those individuals (n = 714) with 1-year follow-up for these tests. As such, only baseline analysis, not longitudinal analysis, was performed for executive function scores.
The participants were asked to perform three repeats of each cognitive test at least 12 h apart within the space of a week. The mean of the repeats was taken to be the test score for that wave. Naturally, not all participants completed three repeats. In those who did there were significant learning effects (i.e., scores improved with test repetition), thus the number of test repeats within each wave was included as a covariate in all our analyses.
To develop cognitive domain scores an orthogonal rotated principal components analysis was performed on the baseline values of 11 outcome measures. Four were taken from the PCTB (Digit Span, Paired Associates Learning, Verbal Reasoning, Self-Ordered Search) and seven measures were taken from the COGTRACK assessment (Picture recognition original stimuli accuracy, Picture recognition new stimuli accuracy, Attentional Intensity Index, Sustained Attention Index, Attentional Fluctuation Index, Cognitive Reaction Time, Memory Retrieval Speed; see section A in Supplementary Appendix SA1 for battery descriptions).
For the main PCA the Kaiser-Meyer-Olkin (KMO) Test result was 0.717 and the Bartlett's Test of Sphericity p-value was <0.001 indicating an acceptable fit. 34 The tests grouped into four dimensions (see section B in Supplementary Appendix SA1 for details).
To ensure that the constructs remained valid throughout the waves the PCA analysis was repeated for each wave and it was confirmed that the tests reliably aggregated into the same four groupings. Additional PCAs for each wave were performed on the subset that contained TMTB and Stroop Tests. The KMO Test result was 0.69; the TMTB and Stroop Tests reliably aggregated into their own component and the results were otherwise unchanged.
Each test score for all waves was standardized based on baseline mean and standard deviations (SDs). Tests in which higher scores indicated poorer performance (e.g., reaction time tests) were inverted, such that higher Z scores always indicated better performance. All Z scores were winsorized to between 5 and Picture recognition 5 SDs from the mean.
Domain scores were calculated from the mean of the Z scores of the tests grouped by the PCA. The following domain scores were computed:
Working Memory: Digit Span, Paired Associates Learning, and Self-Ordered Search. The Verbal Reasoning task was excluded from this domain score as it did not fit conceptually within Working Memory, despite being linked by the PCA.
Episodic Memory: Picture recognition original stimuli accuracy and Picture recognition new stimuli accuracy
Processing Speed/Reaction Time: Attentional Intensity Index, Cognitive Reaction Time, and Memory Retrieval Speed
Attention: Sustained Attention Index and Attentional Fluctuation Index
Executive: TMTB and Stroop Switching Test
The domain scores were assessed for normal distribution by examining visually and testing for skewness. If the skewness was greater than 1 or less than −1 the score was transformed into a normal distribution. The attention domain score was negatively skewed and thus was inverted, log transformed, and re-standardized to achieve a normal distribution.
Classification of covariates
Sex was coded in binary; 0 = men, 1 = women. Education was coded as a six-level ordinal variable; 1 = secondary education, 2 = post-secondary education, 3 = vocational qualification, 4 = undergraduate degree, 5 = post-graduate degree, 6 = doctorate. Smoking was coded as a three-level variable; 0 = never smoked, 1 = previous smoker and 2 = current smoker. All fully adjusted analyses included a previously validated vascular risk scoring system, 35 as vascular risk factors are known contributors to cognitive decline and may confound the effect of TBI. Vascular risk was calculated as a score out of 5, the sum of the following dummy variable comorbidities: hypertension, stroke, coronary heart disease, diabetes, and high cholesterol. Individual history of any previous psychiatric diagnosis was coded as a dummy variable; 0 = no previous diagnoses, 1 = any previous diagnoses.
Statistical analysis
For all analyses partially and fully adjusted models were run. Model construction was decided using the fitting parameters Akaike Information Criteria and Bayesian Information Criteria. It is known that rates of cognitive decline change with age and thus rather than using a simple time in study variable as the “time” variable, this study used a grand mean-centered “age at each wave” as the “time” variable. Further, to account for non-linear decline of cognitive scores an age 2 was also included. Partially adjusted models controlled for age, age 2 , sex, education status and number of repeats in the wave and included an interaction for either TBI severity or mTBI number and age at each wave. Models also including a TBI severity*age 2 were considered but ultimately excluded as they worsened model fit. Fully adjusted models additionally controlled for smoking, the composite vascular risk score, and any history of psychiatric diagnoses. Fully adjusted models are reported and discussed in this article, partially adjusted model results are included in the supplementary data (see Supplementary Table S2 in Supplementary Appendix SA1) and are discussed if there are discrepancies between fully and partially adjusted models.
Intergroup differences for continuous variables were assessed using analysis of variance (ANOVA) and for categorical variables using chi-squared analysis (see Table 1). Linear mixed models (LMMs) were used to examine the effect of TBI cognitive domain scores at study baseline (irrespective of age) and on score trajectories (dependent on age). The first analysis used subjects who had not had a head injury as the comparator group, and assessed cognitive outcomes of those with non-TBI head strikes, mTBI, and moderate-severe TBI. As a supplement to this an analysis was also run also using the mTBI group as the comparator (see Supplementary Tables S5 and S6 in Supplementary Appendix SA1). The second analysis compared those with 1, 2, 3 or 4+ mTBI with those who had suffered no mTBI, and the third examined mTBI number as a continuous variable. The models specified a random intercept and slope (time varying age variable), whereas the other terms were treated as fixed effects. Statistical analyses were performed using R (version 4.0.3).
Summary of Study Population Characteristics in Comparing Those With No TBI, Non-TBI Head Strikes, Mild TBI, and Moderate to Severe TBI
Educational status coded as follows: 1 = secondary education (GSCE/O levels), 2 = post-secondary education (college, A levels, NVQ3 or below), 3 = vocational qualification (diploma, certificate, BTEC, NVQ4, and above or similar), 4 = undergraduate degree (BA, BSc .etc.), 5 = post-graduate degree (MA, MSc, etc.), 6 = doctorate (PhD).
Smoking status coded as follows: 1 = never smoked, 2: previous smoker, 3: current smoker.
p < 0.05; ** p < 0.01; bold p-values indicate significance.
BTEC, Business and Technology Education Council; GSCE, General Certificate of Secondary Education; NVQ, National Vocational Qualification; SD, standard deviation; TBI, traumatic brain injury.
Results
Participant characteristics
The cohort consisted of 15,764 participants of whom 6227 (39.5%) reported at least one TBI and 510 (3.2%) at least one moderate-severe TBI (Table 1). Compared with those with no TBI history, those who had suffered mTBI or moderate-severe TBI had higher rates of previous and current smoking, hypertension, stroke, coronary disease, diabetes, high cholesterol, and psychiatric disease as well as marginally higher rates of attrition throughout the study. The participants had suffered their last reported head injury an average (SD) of 29.6 (20.0) years prior to the study and their first head injury an average of 38.7 (18.5) years prior.
Effect of TBI severity on cognitive outcome
At baseline, in the fully adjusted model, compared with those without head injury, individuals reporting at least one moderate-severe TBI had significantly poorer attention (B = −0.163, 95% confidence interval [CI] [–0.237, −0.088], p
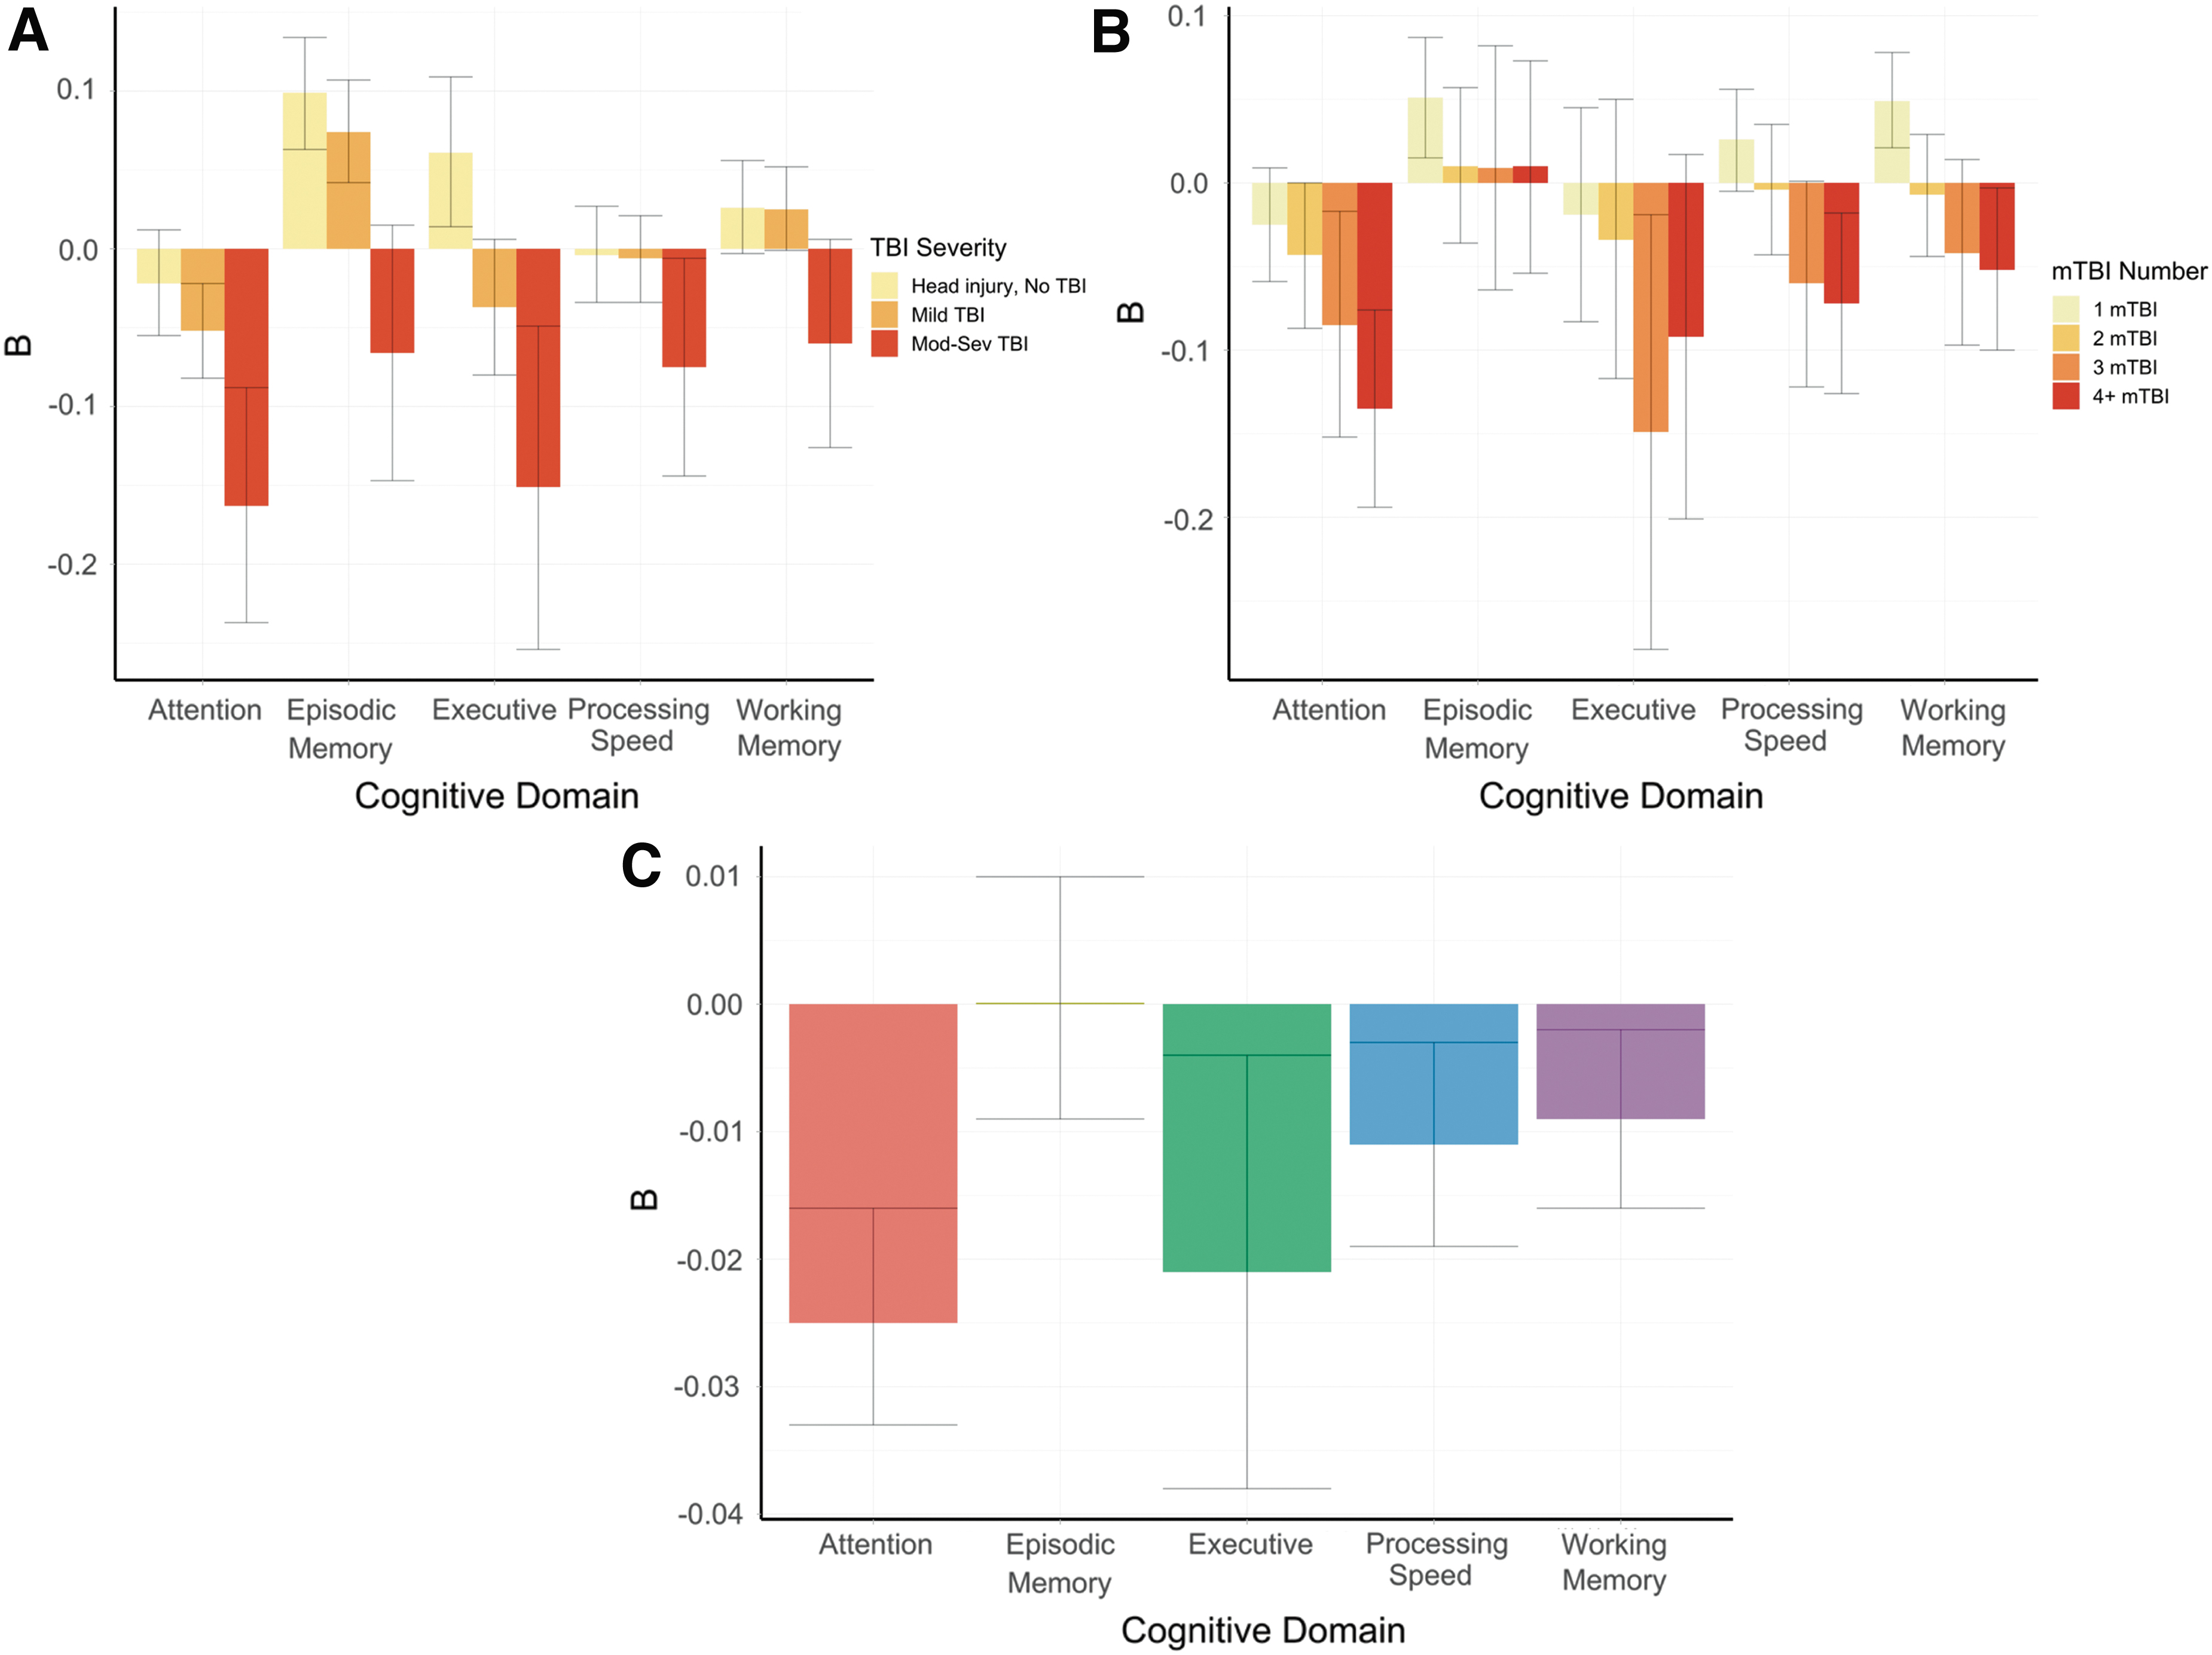
Box plots with 95% confidence intervals to show the effect sizes of various traumatic brain injury (TBI) effects at baseline.
Summary of Linear Mixed Model Results Examining Effect of Head Injury Category (Most Severe Injury Sustained) on Cognition Domain Scores
The unit of age is 5-year increments, i.e., B indicates the number of standard deviation changes in cognitive score with each additional 5 years of age.
p < 0.05; ** p < 0.01; bold p-values indicate significance.
This model compares all head injury groups with individuals in the cohort who have had no head injuries, i.e., a B of -0.211 at baseline means that the group had a mean score -0.211 standard deviations lower than those with no head injuries.
The executive function model was examined only at baseline because at the time of this study there was only a small cohort of individuals with longitudinal data and the follow-up was for a maximum of 1 year.
Model Adjusted for Sex, Age, Education, Smoking Status, Combined Vascular Risk Score, and History of Psychiatric Diagnoses.
CI, confidence interval; TBI, traumatic brain injury.
mTBI number and cognitive outcomes
At baseline, in the fully adjusted model, increasing numbers of mTBI (measured as a continuous variable) was significantly associated with deficits in attention (B = −0.025, 95% CI −0.033, −0.016], p < 0.001), executive function (B = −0.021, 95% CI [–0.038, −0.004], p = 0.015), processing speed (B = −0.011, 95% CI [–0.019, −0.003], p = 0.005), and working memory (B = −0.009, 95% CI [–0.016, −0.002], p = 0.011) (Fig. 2C and Table 3). Conversely, there was a trend in those who had suffered mTBI to have a better trajectory of episodic memory decline over time (B = 0.007, 95% CI [0.002, 0.013], p = 0.014), although there was no effect for episodic memory at baseline. Considering mTBI number as a categorical variable, in the fully adjusted model, those in the three mTBI group, manifested poorer executive function (B = −0.149, 95% CI [–0.279, −0.019], p = 0.025) and attention scores (B = −0.085, 95% CI [–0.152, −0.017], p = 0.015) (Fig. 2B and Table 4).
Summary of Linear Mixed Model Results Examining Effect of Number of Lifetime mTBI as a Continuous Variable on Cognitive Domain Scores
p < 0.05; ** p < 0.01; bold p-values indicate significance.
This model compares all mTBI groups with individuals in the cohort who have had no TBI. It is adjusted for age, sex, education, cognitive test repeats in wave, vascular risk scores, smoking status, and a history of psychiatric diagnoses. This analysis excluded those who had a previous moderate-severe TBI. Age is grand-mean centered and measured in units of 5 years, i.e., an effect size of age of -0.196, means that with each increase of 5 years of age the domain score will on average decrease by 0.196 standard deviations.
The executive function model was examined only at baseline because at the time of this study there was only a small cohort of individuals with longitudinal data and the follow-up was for a maximum of 1 year.
CI, confidence interval; mTBI, mild traumatic brain injury.
Summary of Linear Mixed Model Results Examining Effect of Numbers of Lifetime mTBIs (1, 2, 3, or 4+) on Cognitive Domain Scores
p < 0.05; ** p < 0.01; bold p-values indicate significance.
This model compares all mTBI groups with individuals in the cohort who have had no TBI. The model is adjusted for age, sex, education, cognitive test repeats in wave, vascular risk scores, smoking status, and a history of psychiatric diagnoses. This analysis excluded those who had a previous moderate-severe TBI. Age is grand-mean centered and measured in units of 5 years, i.e., an effect size of age of -0.196, means that with each increase of 5 years of age the domain score will on average decrease by 0.196 standard deviations.
The executive function model was examined only at baseline because at the time of this study there was only a small cohort of individuals with longitudinal data and the follow-up was for a maximum of 1 year.
CI, confidence interval; mTBI, mild traumatic brain injury.
Those who had suffered four or more mTBIs demonstrated poorer attention (B = −0.135, 95% CI [–0.194, −0.076], p < 0.001), processing speed (B = −0.072, 95% CI [–0.126, −0.018], p = 0.009), and working memory (B = −0.052, 95% CI [–0.1, −0.003], p = 0.036) at baseline compared with those with no mTBI. Interestingly, at baseline those who had one mTBI had significantly better working memory (B = 0.049, 95% CI [0.021, 0.078], p = 0.001) and episodic memory (B = 0.051, 95% CI [0.015, 0.087], p = 0.006) compared with those who reported no mTBI. There were no significant differences between the mTBI groups (0 mTBI vs. 1, 2, 3, or 4+ mTBIs) in cognitive trajectories with increasing age.
Discussion
TBI is associated with chronic, fixed deficits rather than accelerating cognitive decline
Grouping participants either by TBI severity or by mTBI numbers showed consistently that there were no worsened trajectories of cognitive decline over time for those who had suffered a TBI. Rather, there were significant deficits at baseline that remained fixed for the duration of the study. Specific effects on domains are discussed in subsequent sections. On average, participants had their last TBI 29.6 years prior to the study and only 1.3% of TBI sufferers had their last TBI in the preceding 3 months. Thus, the effects largely reflect the chronic phase of TBI. The findings are consistent with the meta-analysis by Ruttan and colleagues 13 that demonstrated that cognitive deficits post moderate-severe TBI remained stable over time from the 1 year to the 4.5+ years epochs. 13,36
By contrast, pre-clinical models of TBI suggest that chronic changes should cause long-term neurodegeneration and thus an accelerative cognitive decline rather than just an additive, fixed injury. For example, microglia remain active at the site of injury for years after the injury and are thought to contribute to the chronic effects of diffuse axonal injury and the accumulation of pathological proteins. 6 –8 Further, the tau proteinopathy caused by the injury and inflammation performs progressive self-seeding, in which it spreads in a prion-like fashion. In mouse models of TBI P-tau is initially only present at the injury site; after 6 months it is detected in the contralateral hemisphere. 8,37,38 The apparent conflict between the pre-clinical and clinical results may on one hand merely indicate a lack of mouse model fit for human cognitive studies, but on the other hand it may suggest that the chronic inflammatory changes in the brain provide some level of protection from or prevention of chronic neurodegeneration, as some studies indicate. 39 In either case, the results from this study and other epidemiological studies suggest that in the chronic phase of a TBI an individual will experience fixed cognitive deficits rather than a persistent, accelerative neurodegenerative process.
Cognitive domain deficits associated with TBI
This study found that a history of moderate-severe TBI was associated with significantly poorer attention, executive, and global cognitive scores at baseline but did not affect the trajectories of the cognitive scores of these subjects as they aged. Of the cognitive domain scores, attention was the most sensitive to moderate-severe TBI, followed by executive function and processing speed. The secondary analysis examining the effect of numbers of mTBI corroborated this hierarchy, finding again that attention was most sensitive to the effects of mTBI, followed by executive function, processing speed, and working memory, with no significant effect reported for episodic memory. These findings are supported by evidence that cortical frontal regions are the most common direct foci of primary TBI injury (e.g., from forces of a punch or motor vehicle) and secondary injury, from the coup/contra-coup bruising effect of rapid cranial acceleration and deceleration. 40 Further, previous imaging studies have identified the poles of the frontal lobe as one of the most common sites of gray matter atrophy and axonal rarefaction post-TBI. 41,42
But these findings are at odds with the findings of the CENTER-TBI study (n = 1554), 43 which found that 6 months after TBI one of the most affected domains was learning and memory, whereas tests of attention and executive function tended to be less impacted. These differences are not as striking, when considering that CENTER-TBI used verbal memory tests to assess memory, whereas this study used visual memory and that some of the tests they classified as processing speed measures (e.g., TMTB) this study classified as executive function (e.g., TMTB). Even with this considered, the findings of no association with episodic memory is perplexing as much of the self-reported data on TBI have shown that episodic and working memory are the most frequently reported complaints several years post-TBI. 20 Explaining this, Vakil 44 argued that the profile of memory deficits is consistent with predominant patterns of frontal injury rather than medio-temporal injury or pure amnesia. Deficits are more pronounced in recall rather than recognition tasks, indicating that memory problems occur secondary to executive dysfunction. 44 Understanding the most vulnerable cognitive domains is critical as it allows for evidence-based prioritization in post-TBI cognitive rehabilitation. 23
Three or more mTBI associated with significant cognitive deficits
This study found that those who reported 3 mTBIs had significantly worse executive function and attention scores, and those who reported 4+ mTBIs had worsened attention, processing speed, and working memory. Whereas most studies for repeated mTBI have focussed on young athletes in the acute or subacute phase (<3 months post-TBI) this study examined the mid to late life general population largely in the chronic phase of TBI (>3 months post-TBI). This is a critically important result. It gives a clear threshold at which mid to late life cognitive deficits can be realistically expected. Legal regulations and medical guidelines around when to stop higher-risk activities, such as contact sports, are hotly debated. 45 Most experts agree that recommendations to cease the higher-risk activity should be case by case depending upon the severity of the injury, the extent of the ongoing deficits, and the force of subsequent TBI-inducing force (vis-a-vis “fighter's chin” syndrome 46 ).
However, such assessments can be insensitive to small effects, often lack a pre-TBI baseline, and assess current rather than future function. When making recommendations for those who have suffered recurrent TBI, clinicians should be cognizant that some long-term cognitive deficits can be expected after 3 or more mTBIs. Although the effect sizes for the cognitive deficits at 3 or 4+ mTBIs were small (i.e., all B < 0.2), the effects were dose-dependent. That is, the deficit increased step-wise with increased numbers of reported mTBIs (see Tables 3 and 4) and thus recommendations should indicate that each additional mTBI increases risk of substantial cognitive decline. As previously mentioned, there was no greater decline in cognitive scores with time in this study for those with higher numbers of mTBIs, suggesting that in the chronic phase mTBI causes a dose-dependent, fixed cognitive deficit.
Ability to recall historical TBI associated with better memory
Interestingly, those in the Non-TBI Head Strike or mTBI group (Table 2) had significantly better episodic memory compared with those who had no head injuries. Similarly, those in the 1 mTBI group had significantly better episodic and working memory compared with those with no mTBI. This likely reflects that accurately recalling events from many years ago requires good episodic memory. It is likely that some individuals reporting no historical TBIs or head injuries may have in fact had prior injuries but lack the memory capacity to recall them. This may have led to an underestimation of the effect of TBI on cognition as it is likely that some of the “healthy” comparison group had in fact suffered TBI. This highlights an inherent weakness in the retrospective design of this study, which is discussed further below.
Strengths and limitations
The key strengths of this study are the large sample size, the longitudinal design, and comprehensiveness of the BISQ screening tool. The sample size of 15,764 makes this study nearly twice as large as any other study examining cognitive test outcomes post-TBI. This allowed for detection of small effect sizes and for reliable and powerful subgroup analysis. The longitudinal design of the study allowed for inspection of trajectories of cognitive scores rather than just cross-sectional associations. The BISQ characterizes each discrete head injury and the context in which it happened, allowing for a quantitative breakdown of injuries by number and timing.
The main limitations of this study include missing data, unmeasured confounders, retrospective recall of injuries, challenges with follow-up, and difficulties with domain interpretation. There are a number of unmeasured covariates such as lower socioeconomic status, physical health, and history of alcohol/drug use that are known to affect cognitive scores and to be associated with higher rates of TBI, potentially confounding the results. The retrospective design of the study, with elderly participants often recalling details of events more than 3 decades in the past, may have caused an underreporting of head injuries and thus an underestimate of the size of their effect. Although the comprehensive, structured nature of the BISQ improves the accuracy of the data collection, results should be interpreted with the understanding of mixed reliability of long-term recall in older individuals.
The longitudinal follow-up at 4 years was 45.3%, although a significant loss to follow-up it is comparable to other longitudinal studies of ageing. This issue of missing follow-up data was mitigated using the LMM design. Although the PCA is a useful tool for reducing dimensionality, the domains produced are imperfect constructs. For the domain of executive function both the TMTB and Stroop switching task are timed and partly reflect processing speed. Thus, results may partially reflect deficits in speed rather than executive function. Further, the episodic memory relied purely on a measure of pictorial recall rather than tests of verbal, numeric, or narrative memory and thus its generalizability to the commonly understood idea of episodic memory is limited.
Conclusions
TBI in the chronic phase is associated with fixed, dose, and severity dependent cognitive deficits rather than more rapid rates of cognitive decline. The most sensitive cognitive domains are attention and executive function, with approximately double the effect compared with processing speed and working memory. Post-TBI cognitive rehabilitation should thus be targeted based on the domain specific effects. Finally, significant long-term cognitive deficits begin to be seen after only three lifetime mTBIs. This should be carefully considered when counseling individuals post-TBI about continuing high-risk activities.
Data Sharing Statement
Deidentified participant data and data dictionary for the PROTECT study are available on request from the PROTECT study team at the University of Exeter (
Footnotes
Acknowledgments
We would like to acknowledge all the staff at the University of Exeter College of Medicine and Health and Kings College London involved in the administration of the PROTECT study as well as the PROTECT participants themselves.
Authors' Contributions
All authors agree with the presented findings, and that the work has not been published before nor is being considered for publication in another journal.
Author contributions are as follows. Matthew Lennon: methodology, formal analysis, visualization, writing the original draft, and review and editing drafts. Helen Brooker: conceptualization, data curation, methodology, project administration, software, supervision, data validation and verification and review and editing drafts. Byron Creese: conceptualization, data curation, methodology, project administration, software, supervision, validation, and review and editing drafts. Tony Thayanandan: supervision and review and editing drafts. Grant Rigney: supervision and review and editing drafts. Dag Aarsland: funding acquisition, conceptualization, data curation, methodology, project administration, resources, and review and editing drafts. Adam Hampshire: conceptualization, data curation, methodology, project administration, and resources. Clive Ballard: funding acquisition, conceptualization, data curation, methodology, project administration, resources, and review and editing drafts. Anne Corbett: funding acquisition, conceptualization, data curation, methodology, project administration, resources, and review and editing drafts. Vanessa Raymont: methodology, project administration, resources, supervision, and review and editing drafts.
Funding Information
This article represents an independent research project partly funded by the National Institute for Health Research (NIHR) Biomedical Research Centre at South London and Maudsley NHS Foundation Trust and King's College London. This research was also supported by the NIHR Collaboration for Leadership in Applied Health Research and Care South West Peninsula.
The study sponsors provided funding but otherwise the design, collection, analysis, and interpretation of data, the writing of the report, and the decision to submit the article for publication, were performed by the funded researchers independent of the funding bodies.
Author Disclosure Statement
Clive Ballard collected consulting fees from the following companies: Acadia, AARP, Addex, Biohaven, Eli Lily and Company, Enterin Inc., Exciva, H. Lundbeck A.S., Janssen Pharmaceuticals, Novo Nordisk, Orion Corp., Otsuka America Pharm Inc., Sunovion Pharm. Inc., Suven, Roche, Axosome, and Biogen. Clive Ballard is on advisory boards for the following companies: Acadia, Roche, Novo Nordisk, AARP, Biogen, and Synexus. Clive Ballard received an honorarium from Harvard University for speaking; Adam Hampshire is owner and director of Future Cognition Ltd., a software development company that consulted on the development of the cognitive assessment software.
Supplementary Material
Supplementary Appendix SA1
Supplementary Table S1
Supplementary Table S2
Supplementary Table S3
Supplementary Table S4
Supplementary Table S5
Supplementary Table S6
Supplementary Table S7
References
Supplementary Material
Please find the following supplemental material available below.
For Open Access articles published under a Creative Commons License, all supplemental material carries the same license as the article it is associated with.
For non-Open Access articles published, all supplemental material carries a non-exclusive license, and permission requests for re-use of supplemental material or any part of supplemental material shall be sent directly to the copyright owner as specified in the copyright notice associated with the article.
