




Abstract
The axon initial segment (AIS) is a critical locus of control of action potential (AP) generation and neuronal information synthesis. Concussive traumatic brain injury gives rise to diffuse axotomy, and the majority of neocortical axonal injury arises at the AIS. Consequently, concussive traumatic brain injury might profoundly disrupt the functional specialization of this region. To investigate this hypothesis, one and two days after mild central fluid percussion injury in Thy1-YFP-H mice, we recorded high-resolution APs from axotomized and adjacent intact layer 5 pyramidal neurons and applied a second derivative (2o) analysis to measure the AIS- and soma-regional contributions to the AP upstroke. All layer 5 pyramidal neurons recorded from sham animals manifested two stark 2o peaks separated by a negative intervening slope. In contrast, within injured mice, we discovered a subset of axotomized layer 5 pyramidal neurons in which the AIS-regional 2o peak was abolished, a functional perturbation associated with diminished excitability, axonal sprouting and distention of the AIS as assessed by staining for ankyrin-G. Our analysis revealed an additional subpopulation of both axotomized and intact layer 5 pyramidal neurons that manifested a melding together of the AIS- and soma-regional 2o peaks, suggesting a more subtle aberration of sodium channel function and/or translocation of the AIS initiation zone closer to the soma. When these experiments were repeated in animals in which cyclophilin-D was knocked out, these effects were ameliorated, suggesting that trauma-induced AIS functional perturbation is associated with mitochondrial calcium dysregulation.
Introduction
During concussive, or mild, traumatic brain injury (mTBI), acceleration of the brain within the cranial vault sets into motion a complex sequence of cellular pathogenesis, comprising dysregulated neuronal ionic gradients, hyperglycolysis and associated metabolic derangement, formation of free radical species, and accumulation of calcium in mitochondria. 1,2
Further, influx of calcium ions into the axoplasm stimulates calpain-mediated proteolysis of neurofilaments and voltage-gated sodium channels. 3 –5 Neurofilament proteolysis in conjunction with stretch-mediated disassembly of microtubules blocks the flow of anterograde protein trafficking and gives rise to areas of organelle accumulation, termed retraction bulbs. 6 These bulbs swell, and ultimately the distal boundary of the bulb disconnects from the axon 6–12h after initial injury. 7 The process of traumatic axotomy is pronounced among layer 5 cortical pyramidal neurons, which constitute the principal source of electrochemical outflow from the neocortex.
Given the functional specialization of the mitochondria in the regulation of cellular calcium dynamics and its role as governor of cellular death in response to insult, attempted therapeutic modulation of mitochondrial function has been of profound interest within models of disease in the cardiovascular and nervous systems. In particular, mitigation of reperfusion-induced death of cardiomyocytes and ischemia- and trauma-induced death of neurons has been achieved via knockout or pharmacological inhibition of cyclophilin D, an enzyme localized to the mitochondrial matrix that regulates a diversity of cellular processes. 8 –10
The proposed therapeutic mechanism of these interventions involves the restriction of the assembly of the mitochondrial permeability transition pore, a protein complex of indefinite identity that spans the inner and outer mitochondrial membranes. In response to severe insults, stimulation of cyclophilin D induces the formation of this complex, a large conductance channel from which calcium and even protein species may flow into the cytosol and set into motion apoptotic and necrotic forms of cell death.
The axon initial segment (AIS) is an unmyelinated subdomain of the neuron just distal to the soma. Owing to low regional capacitance, 11 a high density of voltage-gated sodium channels, 12 and to the presence of the Nav1.6 isoform, 13 which has a relatively hyperpolarized voltage of activation, the distal AIS is a specialized locus in which the action potential (AP) has the lowest threshold to initiation. Because the AIS controls AP generation, the tuning of its conductance properties and morphology represents a potent mechanism toward the maintenance of neuronal homeostasis. 14
Plasticity of the length of the AIS, the position of the AIS relative to the soma, and the intrinsic membrane properties of the AIS have been observed in response to sensory deprivation and enrichment, 15 –17 aging and embryonic development, 18,19 and neurological and psychiatric disease. 20 –22 It has been demonstrated that the AIS is especially vulnerable to axotomy secondary to mild traumatic brain injury (mTBI), with the majority of axotomy arising at the AIS and para-AIS 7 ; further, various models of TBI give rise to contraction of the distal end of the AIS of intact neurons as measured by staining for ankyrin-G. 23,24
This distal contraction is associated with a reduction of AIS-regional voltage acceleration two days after TBI. 24
Given the critical specialization of the AIS toward the control of AP generation and neuronal information synthesis, the phenomenon of diffuse axonal injury might disrupt information outflow from the neocortex and consequently perturb sensory perception and global cognitive function. In addition, traumatic AIS injury may arise across a broad continuum of severity, ranging from subtle alteration of AIS function within normal-appearing axons to total destruction of the AIS.
Following generation at the AIS, the AP conducts in the orthodromic direction in a saltatory manner to the nodes of Ranvier. Simultaneously, the AP back-propagates to the somatodendritic region, where it may modulate dendritic conductances. 25 There exists a period of latency between these events, which manifests as a transient lag between two peaks on analysis of the second derivative (2o) of the voltage with respect to time during the AP upstroke. It has been demonstrated by means of regional blockade of sodium channels in hippocampal pyramidal cells 26 and cerebellar Purkinje cells 27 that the first of these peaks corresponds to the depolarization of the AIS and the second peak corresponds to the depolarization of the somatodendritic region.
In the present study, we replicate this result in layer 5 pyramidal neurons and use this analysis as the basis of an assay of the functional integrity of the AIS and soma. We demonstrate that all layer 5 pyramidal neurons within the sham condition manifest both peaks. On the other hand, after mTBI, the first of these peaks is abolished in a subset of axotomized layer 5 pyramidal neurons one and two days post-injury, a functional perturbation associated with a significantly reduced frequency-current slope, fragmentation of ankyrin-G, and a striking reduction in the size of conglomerations of NaV1.6 channels as revealed by lattice structured illumination superresolution microscopy. Within mice in which cyclophilin D is constitutively knocked out, we did not encounter this subset of axotomized neurons.
In addition, we describe a subset of intact layer 5 pyramidal neurons within the vicinity of axotomy that manifest an AIS-regional peak that melds into the soma-regional peak. This waveform may represent a trauma-induced aberration of sodium channel function that exists even within morphologically normal-appearing neurons.
Methods
Experimental animals
Two mouse lines were used to generate the data of the present study. The first line expresses Thy1-driven yellow fluorescent protein (YFP) within a subset of layer 5 pyramidal neurons 28 and was acquired from Jackson Labs (B6Cg-TgN[Thy1-YFPH] 2Jrs, stock number 003782; Bar Harbor, ME). Ear punches were inspected by fluorescence microscopy to confirm the presence of the YFP transgene.
To generate the second line, these same YFP-H mice were crossed with cyclophilin-D (CypD) knockout mice, which have been shown to be more resistant to the assembly and opening of the mitochondrial permeability transition pore and the consequent derangement of intracellular calcium dynamics and mitochondrial swelling. 29,30 The gene encoding CypD is ppif, and thus these knockout mice are also known as ppif-/-. Here the YFP-H strain is referred to as wildtype (WT), and the CypD knockout mice crossed with the YFP-H are referred to as CypDKO.
For this study, male mice (P56-P90) were used. The mice were group housed in 12h/12h non-reversed light cycle conditions on corncob bedding with access to food and water ad libitum. All animal procedures were approved by the Institutional Animal Care and Use Committee of Virginia Commonwealth University.
Central fluid percussion injury (cFPI)
Mild cFPI was induced as described previously. 31 –34 Mice were anesthetized with 4% isoflurane in 100% O2, with anesthesia maintained with 2% isoflurane during surgery. The body temperature was thermostatically controlled via a heating pad (Harvard Apparatus, Holliston, MA) and maintained at 37°C. A pulse oximetry sensor (STARR Life Sciences, Oakmont, PA) was used to monitor pulse rate, respiratory rate, and blood oxygenation intraoperatively.
A 3.0 μm circular craniectomy was made along the sagittal suture midway between bregma and lambda. Care was taken to avoid any insult to the underlying dura. The cFPI injury at this location consistently produces diffuse axonal injury throughout the primary somatosensory cortex. A sterile Leur-Loc syringe hub cut from a 20-gauge needle was affixed to the craniectomy site using cyanoacrylate and dental cement then filled with sterile saline. This procedure required 45–75 min. The animal was then removed from anesthesia and monitored in a warmed cage until fully ambulatory (60–80 min of recovery). Injury or sham procedure was applied thereafter.
For injury induction, each animal was reanesthetized with 4% isoflurane in 100% O2 for 4 min four, and the hub was filled with sterile saline and attached to a fluid percussion apparatus (Custom Design and Fabrication; Virginia Commonwealth University; Richmond, VA). A mild severity injury (1.7 ± 0.06 atmospheres) was induced by a brief fluid pressure pulse on the intact dura. The peak pressure was measured by the transducer (Tektronix 5111) and displayed on an oscilloscope.
After injury, the animals were monitored visually for loss of spontaneous respiration or the emergence of clonus. Transient derangement of respiratory rhythm that resolved into eupnea was routinely observed. The duration of transient unconsciousness was measured by the time interval between the injury and the return of the spontaneous righting reflex. While sham righting times occur within approximately 1 min, within this cFPI injury paradigm, injury is considered effectively mild when righting occurs within 8 min, a standard that held true for all injured mice included here.
After recovery of the righting reflex, animals were placed in a warmed holding cage and monitored during recovery (typically ∼60 min) before being returned to the vivarium. For sham injury, all the above steps were followed except for the release of the pendulum to induce the injury.
Acute slice preparation and patch-clamp recording
Our previous work has shown that the effect of this mild CFP injury progresses with intact neurons at one day manifesting physiological properties similar to axotomized neurons while intact neurons at two days manifest properties similar to controls. 32,33 Thus we continued the investigation at these two survival times.
One or two days after injury or sham, mice were deeply anesthetized with isoflurane and perfused through the aorta with semi-frozen, sucrose substituted artificial cerebrospinal fluid (aCSF) previously saturated by a mixture of 95% O2/5% CO2 (carbogen) containing (in mM): 2.5 KCl, 10 MgSO4, 0.5 CaCl2, 1.25 NaH2PO4, 234 sucrose, 11 glucose, and 26 NaHCO3. Subsequently the mice were decapitated, and the brain was rapidly extracted and chilled in this same aCSF.
Scrupulous care was undertaken to generate anatomically coronal slices in which vibratome-induced axotomy was minimized. To this end, the brain was carefully docked within an acrylic mouse brain slicer matrix (Zivic Instruments). 300-μm thick coronal slices were cut with a Leica VT 1200 vibratome (Leica Microsystems, Wetzlar, Germany). These slices were incubated for 30 min at 34°C in aCSF containing (in mM): 126 NaCl, 3 KCl, 2 MgCl2, 2 CaCl2, 1.25 NaH2PO4, 10 glucose, and 26 NaHCO3, bubbled continuously with carbogen.
The slices remained at room temperature thereafter until transferred to the recording chamber, which was maintained at 30 ± 0.5o C. The slices were secured by a harp, and a 63X water-immersion objective (Zeiss) was used to visually identify YFP+ layer 5 pyramidal neurons of primary somatosensory cortex ventral to the injury site. Neurons possessing an axon that could be traced along its trajectory into the subcortical white matter were considered intact, while those terminating in an axonal bleb were considered axotomized. Care was taken to select only neurons axotomized deep to the surface of the slice to exclude any neurons axotomized by the vibratome during slicing. Among YFP+ layer 5 pyramidal neurons in the YFP-H condition, differentiating between these two morphologies is readily feasible within the living brain slice. 33
Within the recording chamber, slices were perfused with aCSF bubbled continuously with carbogen. Patch electrodes (final resistance 2–4 MΩ) were pulled from borosilicate glass (World Precision Instruments, Sarasota, FL). The intracellular solution contained (in mM): 130 K-gluconate, 10 Hepes, 11 EGTA, 2.0 MgCl2, 2.0 CaCl2, 4 Na-ATP, 0.2 Na-GTP, 0.4% biocytin (Sigma, cat# B4261). Electrode capacitance was electronically compensated. Recordings were made via a MultiClamp 700B (Molecular Devices, Sunnyvale, CA) and digitized via a Digidata 1440A and pClamp software (Molecular Devices).
During current clamp recordings, the membrane potential was maintained at -60 mV with continuous depolarizing or hyperpolarizing current as needed. Access resistance was continuously monitored. If the access resistance increased by 15% at any time between break in and the culmination of data collection, an attempt was made to clear the pipette tip via gentle positive pressure. If this attempt was not successful, the recording was terminated.
Most neurons had a resting membrane potential (RMP) between -60 mV and -70 mV (Table 1), except for a few severely axotomized neurons that rested between -60 mV and -55 mV. The axotomized neurons for both one- and two-day survival times were significantly more depolarized than those of the two-day sham condition (Table 1). On the measure of input resistance, there was no significant difference in subject groups or experimental conditions (WT or CypDKO) and no significant interaction between these two (Table 1).
Resting Membrane Potential and Input Resistance for All Groups
Subject groups are listed in the first column while experimental condition was wildtype (WT) or CypDKO. #, significant, with a Bonferroni post-hoc for resting membrane potential (RMP) showing that Sham 2D was significantly different from traumatic brain injury (TBI) AX1D (p = 0.025) and TBI AX2D (p = 0.022). In addition, for the RMP measure, TBI IN2D was significantly different from TBI AX1D (p = 0.048) and TBI AX2D (p = 0.039). Subject numbers reported as
To probe for the existence of trauma-induced perturbation of AIS function, we recorded from ex-vivo brain slices prepared from mice subjected to mild cFPI one or two days before experimentation. In the resulting slices, we used a 63X water immersion objective to follow the trajectory of the axons of YFP+, layer 5 pyramidal neurons to entrance into the subcortical white matter (intact neurons), or to the axonal bleb/swelling (axotomized neurons); 33 neurons thus visualized were targeted for whole cell patch clamp recording. From these neurons, high-resolution APs were generated by a brief depolarizing current injection at a level that typically evoked 1–2 APs, which were recorded unfiltered and digitized at 200 kHz (high resolution APs for 2o analysis). This procedure was repeated 5–9 times at 0.2 Hz.
In addition, the membrane voltage response to a series of hyperpolarizing and depolarizing pulses of 400 msec duration to identify the AP firing pattern and other intrinsic cellular properties was recorded. These recordings were digitized at 20 kHz.
We note that all YFP+, layer 5 pyramidal neurons tested possessed some degree of the hyperpolarization-activated cyclic nucleotide-gated current (Ih), which manifests as a depolarizing sag in response to hyperpolarizing current injection. The amplitude of this sag was added to the amplitude of the depolarizing afterpotential in the manner described by Gee and colleagues. 64 It was determined that all neurons recorded in this study could be classified as Type A (Supplementary Fig. 1). In previous studies neuronal firing pattern has also been classified as regular spiking (RS), regular spiking with an initial doublet (RSd), or intrinsically bursting (IB). 31,33 In the current cohort we observed all three of these firing types in each subject group, with no significant differences in the proportions (Supplementary Fig. 2).
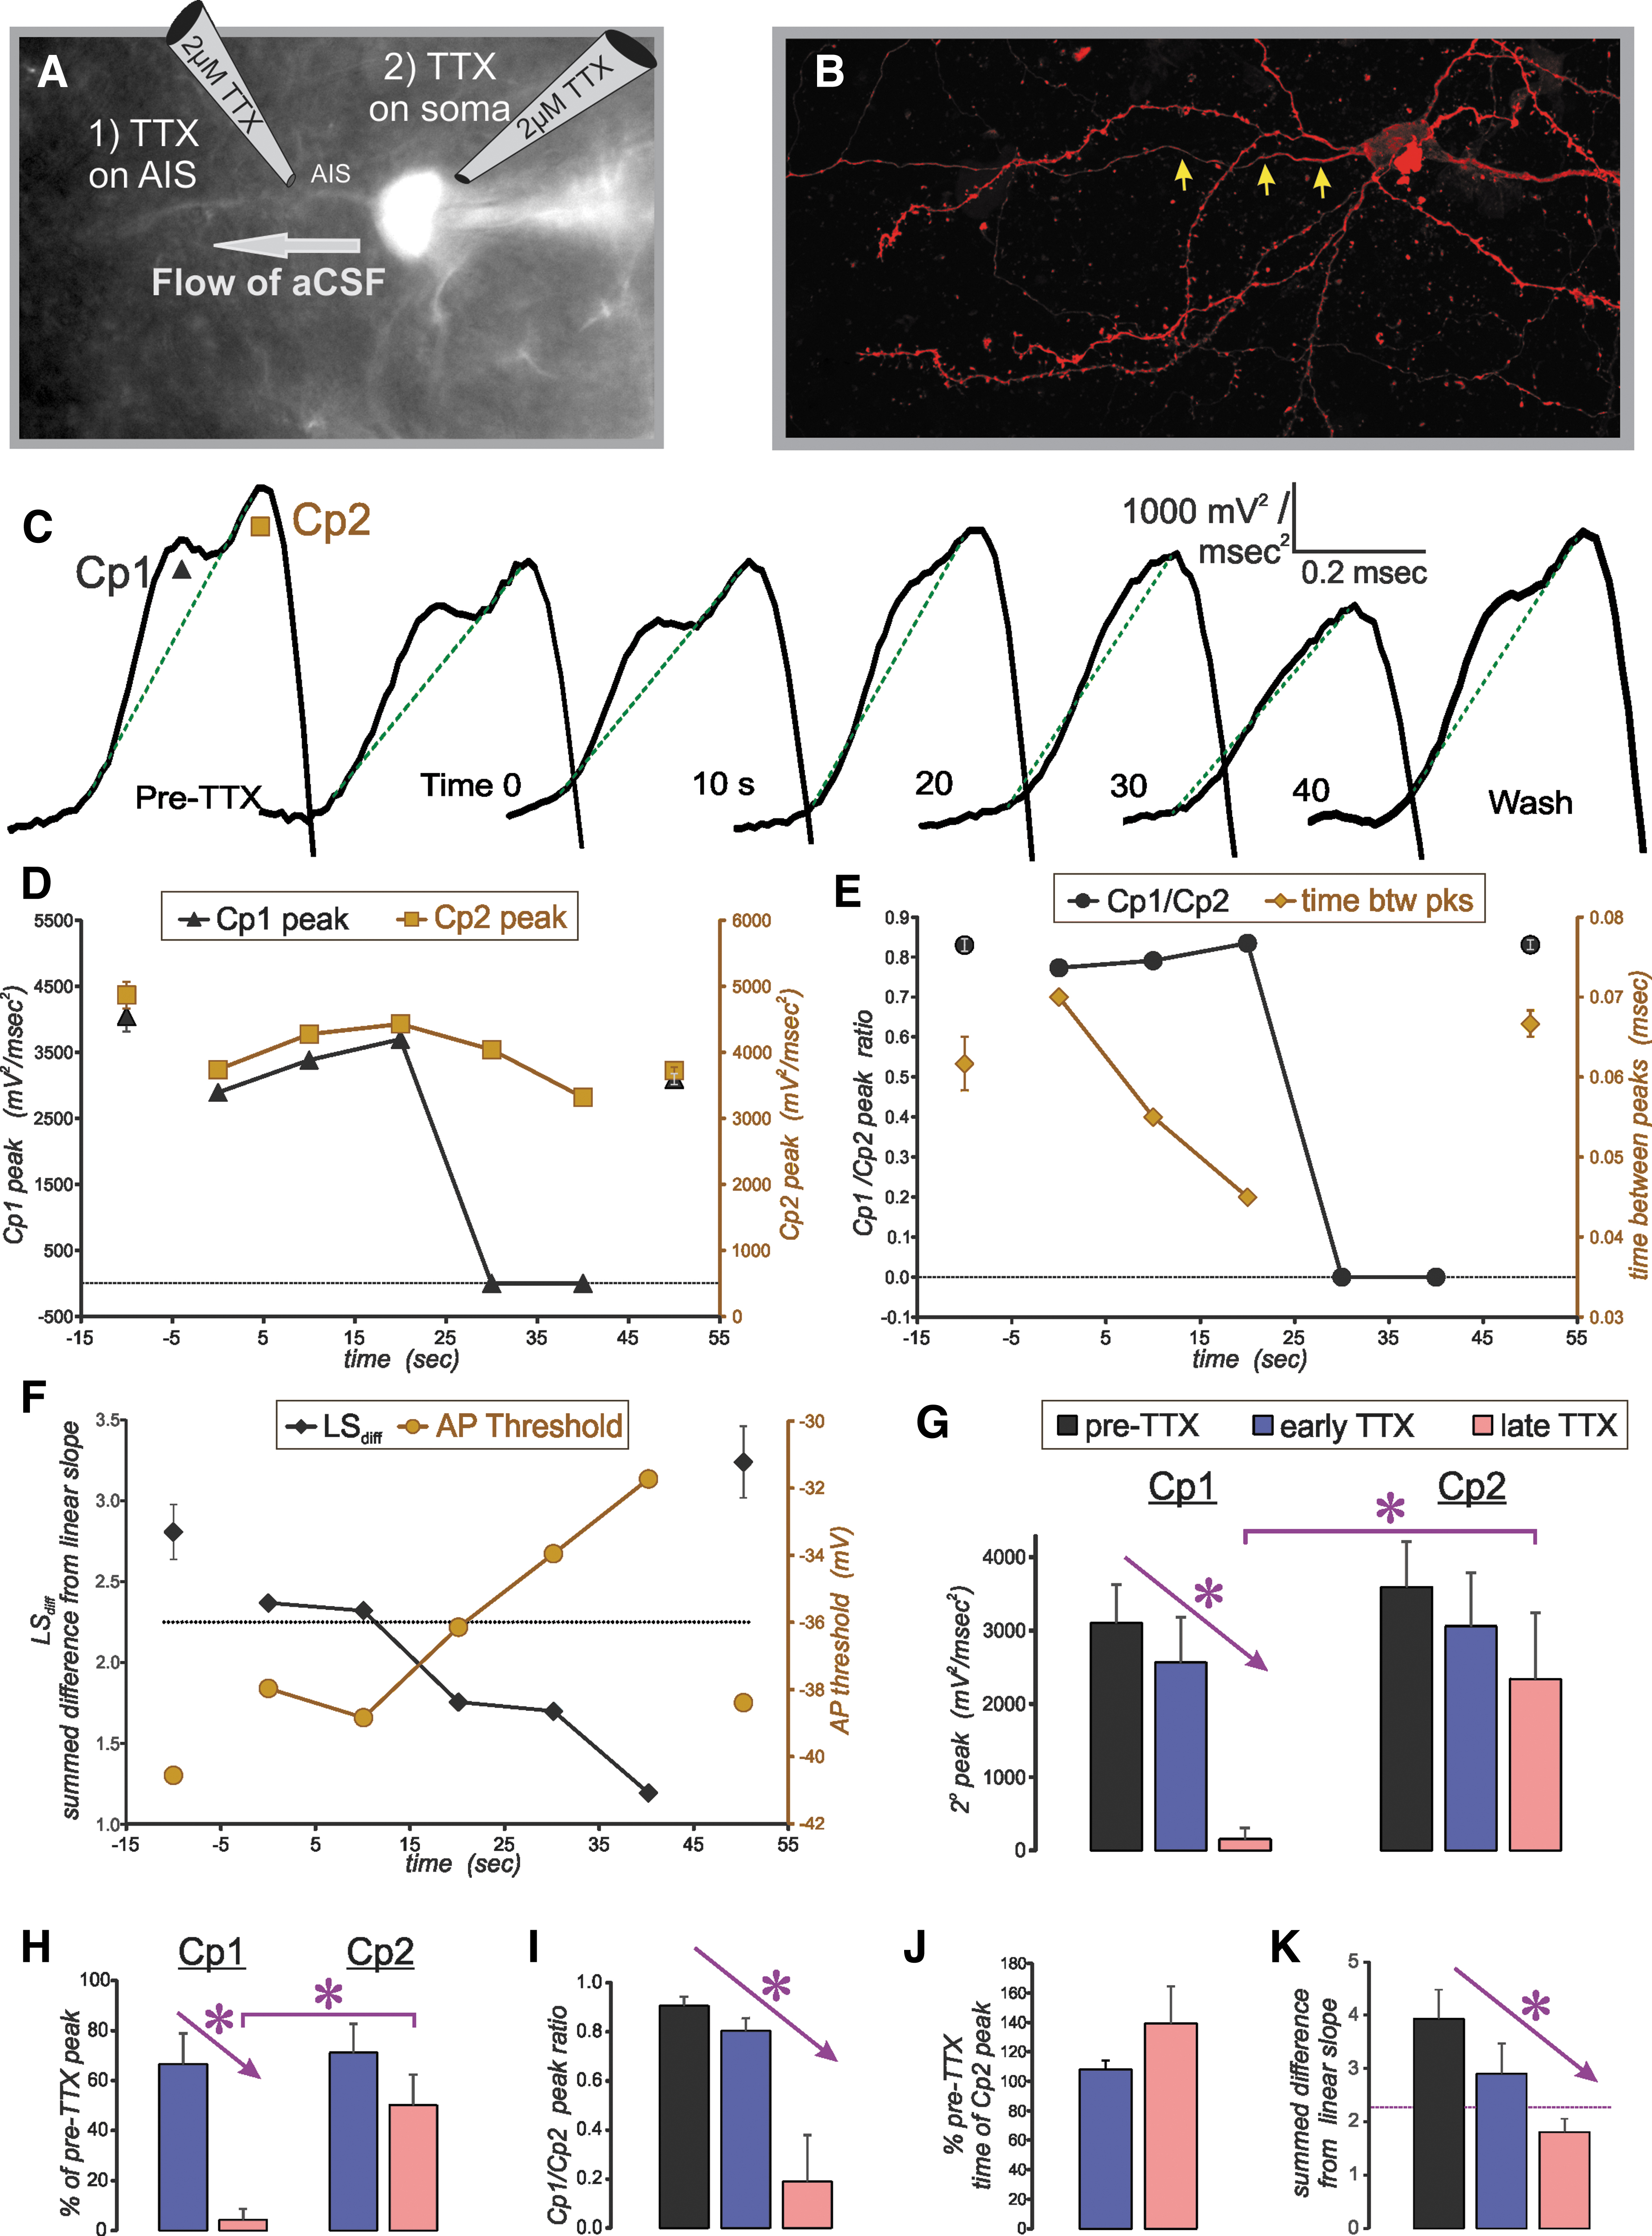
The biphasic components of the action potential (AP) upstroke, visualized with a 2o analysis are caused by sequential depolarization of the axon initial segment (AIS) and the soma. Results shown here are for application of tetrodotoxin (TTX) to the AIS. (
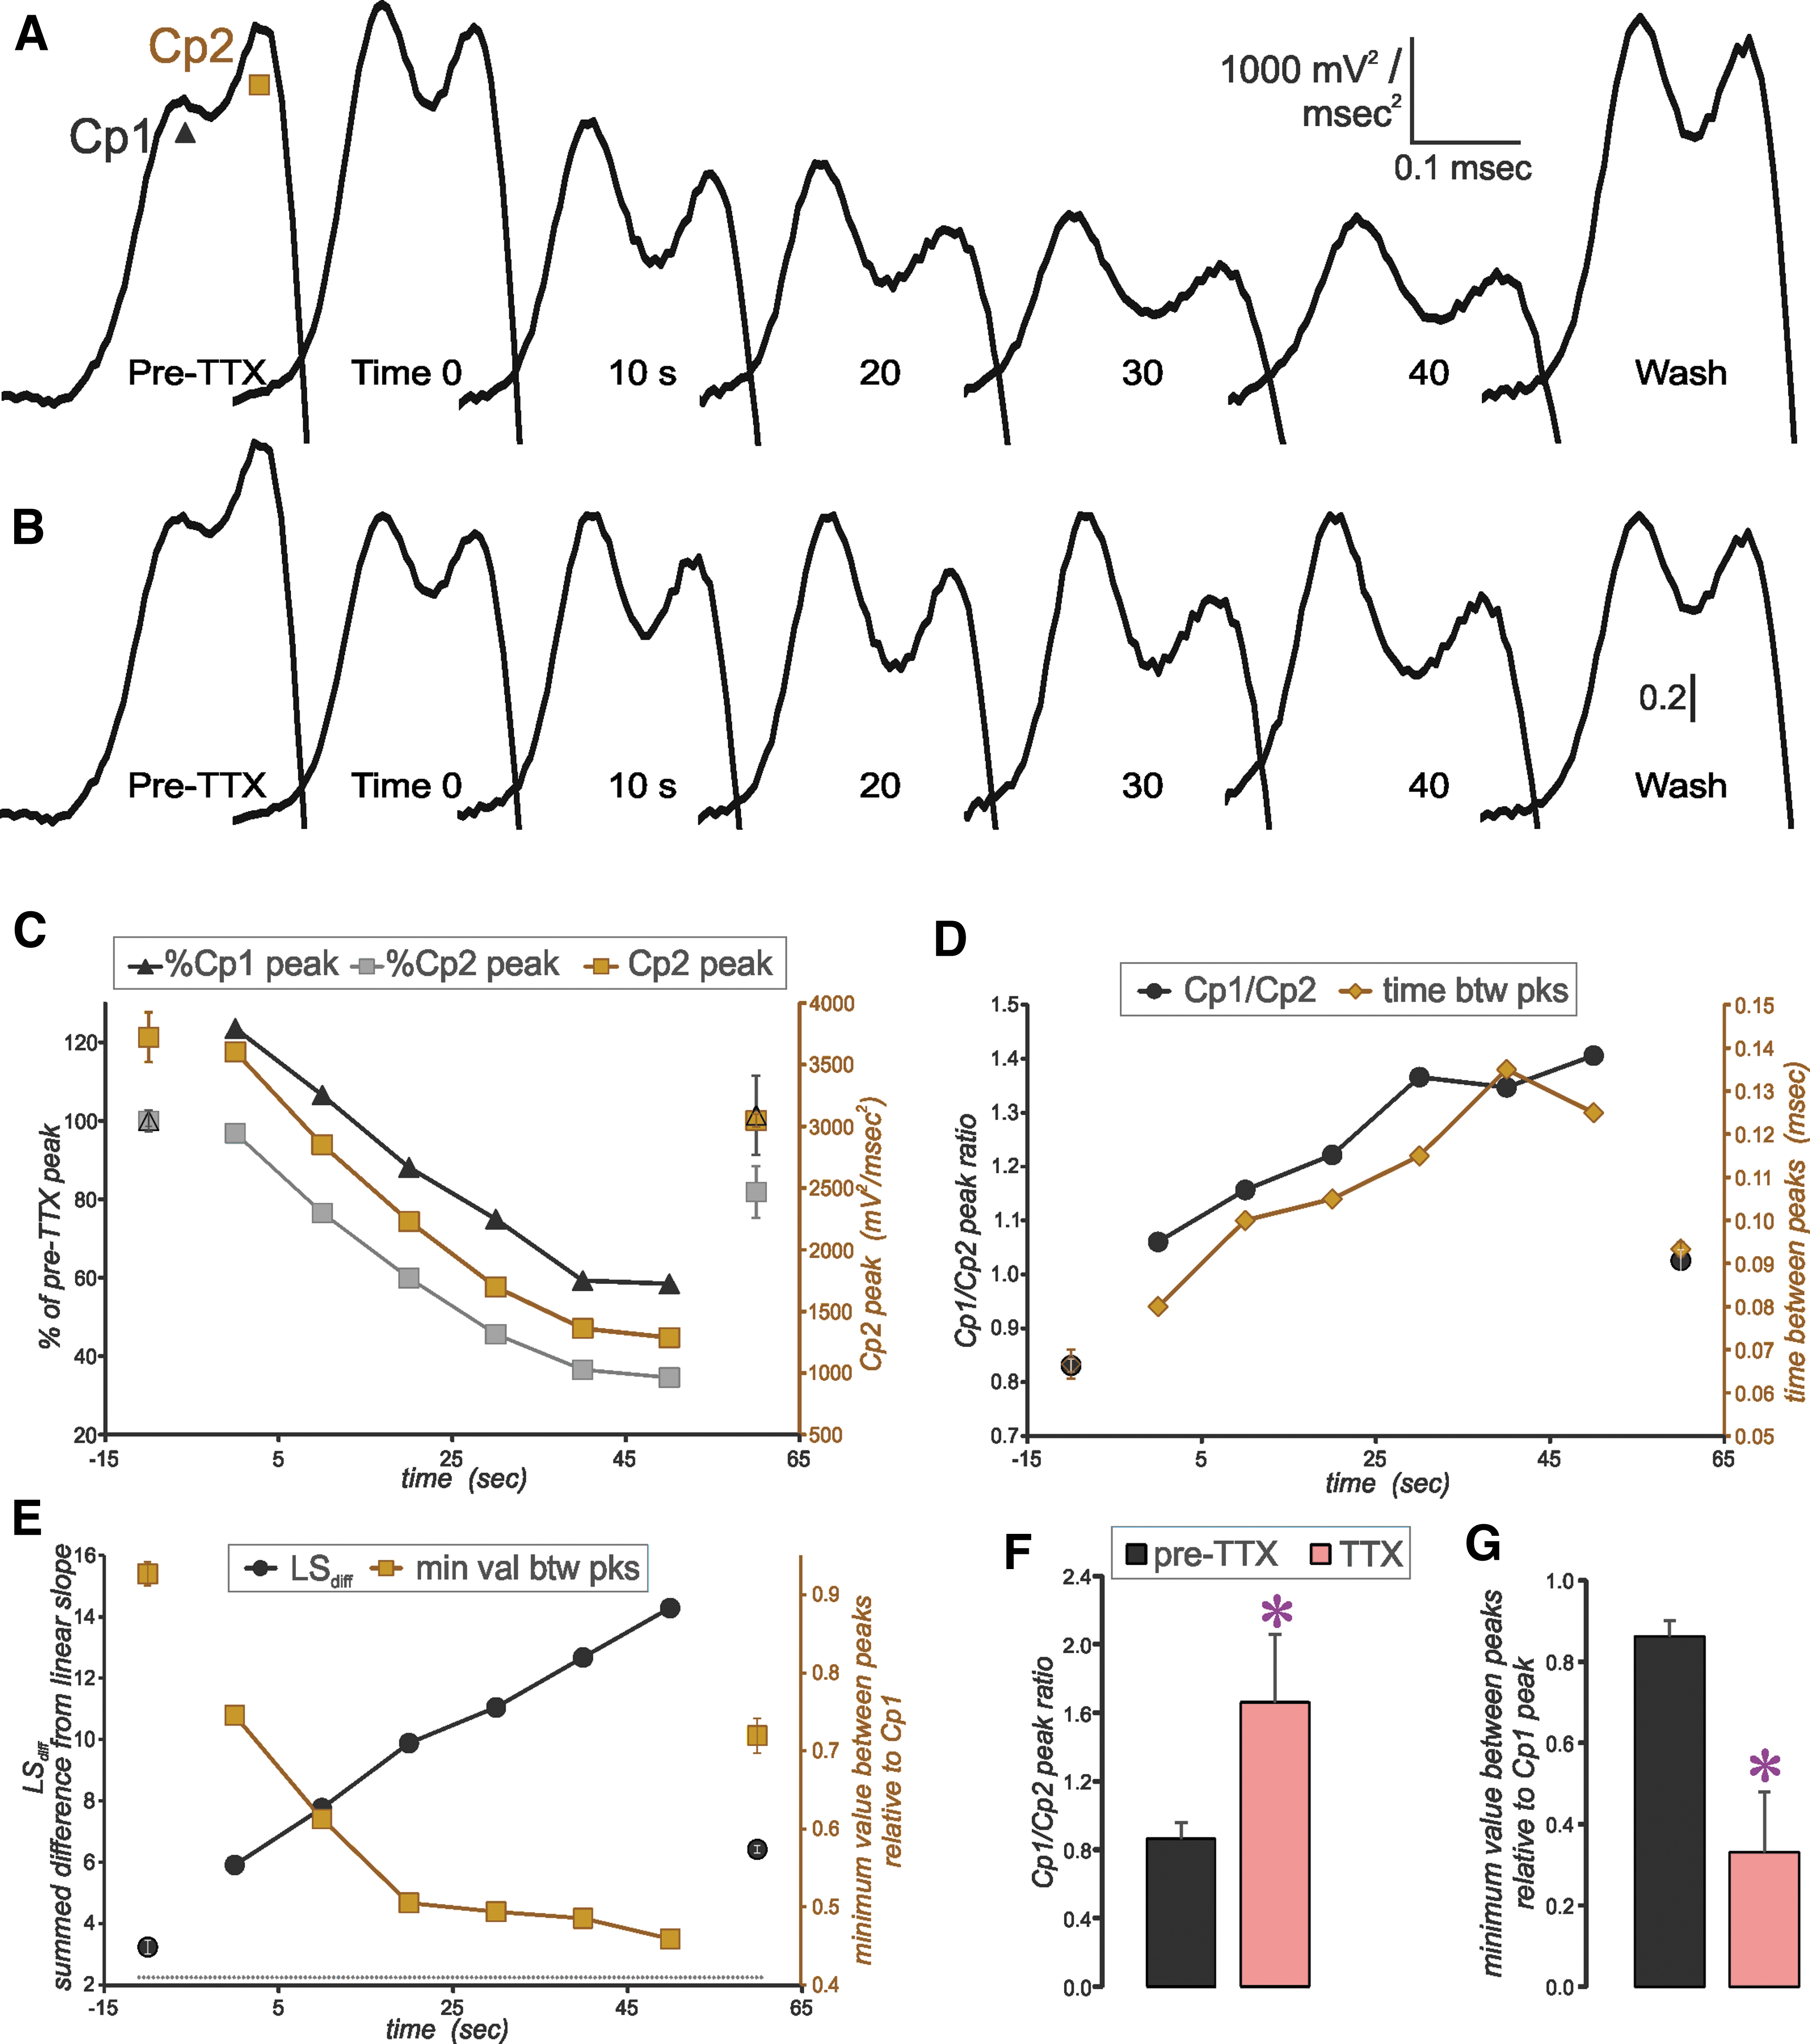
Effect of TTX applied to the soma of a layer 5 pyramidal neuron. (
To correlate the biphasic components of the AP upstroke to the regional depolarization of the AIS and the soma, a patch pipette containing tetrodotoxin (TTX, 2 μM) was positioned approximately 30 μm distal to the soma (to dissociate the AIS component) or over the soma (to dissociate the somatic component) of visualized YFP+ layer 5 pyramidal neurons within the WT sham condition. Subsequently, TTX was applied through the patch pipette via a Picospritzer (Parker Hannifin, Mayfield Heights, Ohio) at 30 psi for a duration of 8 msec and at a rate of 0.1 Hz.
Immediately after each puff of TTX, an AP was evoked via square wave depolarizing current injection and subjected to 2o analysis. The slice was positioned within the chamber with the apical dendrites projecting toward the aCSF inflow and the axon projecting toward the outflow to minimize TTX spillage onto the soma during TTX application to the AIS.
Immunohistochemistry, confocal and super-resolution microscopy
After each recording, neurons were depolarized slowly to – 40 mV, and the patch pipette was gradually withdrawn over the course of approximately 20 sec to reseal the neuronal membrane. Slices were fixed in 4% paraformaldehyde for 70 min, then washed six times in 0.1M phosphate-buffered saline (PBS) and stored in 0.1M PBS at 4°C until processing. To reconstruct the morphology of recorded neurons, slices were washed three times for 5 min with 0.1M PBS, then reacted overnight at 4°C with a solution of 0.1M PBS containing Texas Red-conjugated streptavidin (1:500, ThermoFisher, cat# S32356) in the presence of 0.5% triton-X.
To visualize the structure of the AIS, slices were then treated with heat-based epitope retrieval. Slices were immersed within a solution of 10 mM sodium citrate dihydrate (294.10 g/mol; pH = 8.0) and heated on a block to 80°C for 10 min. The slices were allowed to cool for 10 min, then blocked in a solution of 10% normal horse serum and 0.5% triton-X within 0.1M PBS at room temperature for 1h. Slices were then washed three times with 0.1M PBS for 10 minutes and incubated in a solution containing anti-ankyrin-G primary antibody (1:400; mouse IgG2a, clone N106/36, NeuroMab, cat# 73-146) in 0.1M PBS with 0.5% triton-X and 1% NHS for 24h at 4°C.
The slices then were washed three times with 0.1M PBS and reacted with a solution containing the secondary antibody (Alexa Fluor 405; 1:500, Life Technologies, cat# A31553) in 0.1M PBS with 0.5% triton-X and 1% NHS for 2h at room temperature. Subsequently, slices were washed three times for 10 min in 0.1M PBS and mounted on glass slides with Vectashield non-hardening antifade mounting medium, and the slides sealed with clear nail polish.
Slices thus prepared were imaged at 63X via a Zeiss 880 laser scanning confocal microscope. Serial scanning of each of the three channels (Texas Red, YFP, and Alexa Fluor 405) was employed, and care was taken to image the entire axon of all successfully recovered neurons.
For measurement of the distance to axotomy, the distance from the emergence of the axon to the site of the first retraction bulb was measured using the freehand line tool on the biocytin or YFP channel within ImageJ. For axotomized neurons of club-shaped morphology and lacking classical retraction bulbs, the distance from the emergence of the axon to the end of the axon was measured. For measurement of the AIS regional axonal width, the width of the axon of neurons axotomized more than 30μm from the soma was measured at 30μm using the straight-line tool within ImageJ. For neurons axotomized within 30μm of the soma, the width was measured at its widest point along the axon excluding the retraction bulb itself.
For experiments examining the AIS-regional distribution and superstructure of ankyrin-G and NaV1.6, one day after injury mice were perfused through the aorta with 0.1M PBS until exsanguination followed by 8 min of 4% PFA. Brains were post-fixed in 4% PFA for 150 min, washed six times in 0.1M PBS, and sectioned at 50 μm via a Leica VT1000S vibrating microtome. Slices of the primary somatosensory cortex ventral to the site of injury induction were washed three times in 0.1M PBS and immersed in 10 mM sodium citrate dihydrate (294.10 g/mol; pH = 8.0) heated on a block to 80°C for 12 min.
Slices were allowed to cool for 10 min, washed twice, blocked for 1h at room temperature, then reacted with solutions containing 0.5% triton-X, 1% NHS and primary antibodies to ankyrin-G (1:250; mouse IgG2a, clone N106/36, NeuroMab, cat# 73-146) and NaV1.6 (1:250; rabbit polyclonal, Alomone, cat#ASC-009) for at least 18h. Subsequently, slices were washed three times and reacted with appropriate secondary antibodies (1:500) at room temperature for 2h. After a final wash, slices were mounted on glass slides via Vectashield non-hardening anti-fade mounting medium and sealed with clear nail polish.
Slices thus prepared were imaged via sequential scanning at Nyquist criteria by a Zeiss 880 laser scanning confocal microscope, with the pinhole of the channel corresponding to NaV1.6 set to one Airy unit. Subsequently, cells of interest were imaged via the Zeiss Elyra 7 lattice structured illumination microscope to achieve superior resolution of the AIS-regional membrane distribution of these protein species. Microscopy was performed at the VCU Department of Anatomy and Neurobiology microscopy facility, supported, in part, with funding from the NIH-NCI Cancer Support Center grant P30 CA016059. For pixel intensity analysis, using the freehand tool within Fiji, lines were drawn along the AIS within tiffs corresponding to the channel of interest and quantified via the “Plot Profile” function.
Data analysis
Data analysis was performed with Clampfit software (Molecular Devices, Sunnyvale, CA) and custom programs in Visual Basic for Applications, within Microsoft Excel (Microsoft, Redmond, WA). For the APs generated for 2o analyses, in all cases only the first AP in the sweep was analyzed. The digitized AP was filtered with a 7-point boxcar filter repeated three times before calculation of the first derivative and the 2o. The AP threshold was measured as the membrane potential at 10 mV/msec. For each cell typically 5 APs were analyzed (3-5APs), with measurements made of each individual AP and then those measurements averaged to create the record per cell.
Unless otherwise specified, significance was tested using one or two-way analysis of variance (ANOVA), with Bonferroni post-hoc test (SPSS, IBM). Results are reported as mean ± standard error of the mean (SEM).
Results
Isolation of the AIS and somatic contributions to the AP upstroke
The 2o analysis of the AP upstroke has been demonstrated to contain two components (Cp1, Cp2), which have been shown to represent the sequential depolarization of the AIS and the soma, respectively, in CA3 pyramidal neurons 26 and cerebellar Purkinje cells. 27 To extend this analysis to layer 5 neocortical pyramidal neurons and to confirm that our methods allowed the differentiation of AP generation at the AIS and the soma, APs were recorded before, during, and after the focal application of TTX (2 μM) to either the axon at the expected location of the AIS (30 μm distal to soma) or to the soma (Fig. 1A,B).
In sham controls, the 2o of the AP always contained two components with clearly separate peaks (Fig. 1C). Application of TTX to the AIS reduced the peak amplitude of Cp1 to a greater degree than that of Cp2 (Fig. 1C–E). Continued application of TTX produced APs with a gradually diminishing Cp1, which ultimately was abolished outright, giving rise to a monophasic waveform. Within seconds of cessation of TTX application, 2o analysis again demonstrated two peaks. This process of eliminating the first peak then allowing its recovery could be repeated within the same neuron.
Before elimination of Cp1, TTX application also decreased the time between component peaks and depolarized the AP threshold potential (Fig. 1E,F). Just before elimination of Cp1, the separation of the peaks became less apparent, such that Cp1 and Cp2 began to meld into one another, giving rise to a shoulder and a peak (Fig. 1C, 20 sec). To quantify this transition from double peaks to a single peak, we used a new measure in which the 2o was first normalized to the second (or only) peak. A line was then drawn from 99% to 30% of the second (or only) peak (green lines in Fig. 1C). The difference between the actual data and this theoretical line was then calculated for each point and summed for all points creating the summed difference from linear slope (LSdiff).
In cases of two clear peaks separated by a negative intervening slope, the summed difference from this linear slope was always greater than 2.25. The LSdiff dropped below this threshold in cases of a shoulder+peak and in cases of a single peak. These results were consistent in all neurons tested, whether from sham controls or the IN1D group (Fig. 1G–K).
Movement of the TTX puffer to the location of the soma reduced the amplitude of Cp2, but typically did not eliminate it (Fig. 2). Because the puffer electrode tip size was small relative to the soma, the entire soma could not be covered by TTX application; thus, we did not expect to abolish Cp2 outright. While targeting the soma, some spillage of TTX onto the region of the AIS did occur, as the aCSF flowed toward the AIS. Consequently, Cp1 was also affected; however, the effect was greatest on Cp2 (Fig. 2C, D). This result can be appreciated on normalization of the 2o to the Cp1 peak (Fig. 2B).
The TTX application to the soma gave rise to the converse effects compared with TTX application to the AIS on measures of the Cp1/Cp2 ratio, time between peaks and LSdiff. Further, there evolved a deepening of the valley between the Cp1 and Cp2 peaks, consistent with an increase in the spatial separation between each zone of activation. To quantify this phenomenon, we measured the minimum value between peaks after normalization to the Cp1 peak (Fig. 2E, right axis, brown squares, 2G). The reduction of this minimum was typical for all neurons tested with TTX application to the soma.
From these results, we considered the 2o Cp1 to represent depolarization of the AIS and Cp2 to represent depolarization of the soma. Thus, hereafter Cp1 will be referred to as the AIS-regional peak acceleration of the membrane potential and Cp2 will be referred to as the soma-regional peak acceleration of the membrane potential.
Our remaining results describe the effect of mTBI on the function of the AIS and AP generation. Sham1D and 2D refer to the survival times of one or two days after the sham injury. Experimental groups AX1D and IN1D were taken from the same animals, surviving to one day after injury, but with the endogenous YFP allowing the state of the axon to be identified before recording as axotomized (AX, having a disconnected axon and swelling) or intact (IN) down to the subcortical white matter with no swelling. The same pre-recording identification was performed for AX2D and IN2D but on survival day 2 after the injury.
AIS peak is reduced or lost after mTBI in both intact and axotomized neurons
Injection of square wave depolarizing current gave rise to a qualitatively similar AP in sham controls and in axotomized and intact neurons one and two days after TBI (Fig. 3). Calculation of the first derivative of the AP revealed a change in slope of the AP rise to peak for sham neurons. This change in slope was present in some TBI neurons but not in others (Fig. 3B). This result was more evident when plotted against the membrane potential and when compared to the 2o (Fig. 3C, D). When the 2o was double-peaked, a notch could typically be seen in the plot of the first derivative versus membrane potential, indicating a distinct threshold potential for AIS versus soma activation zones.
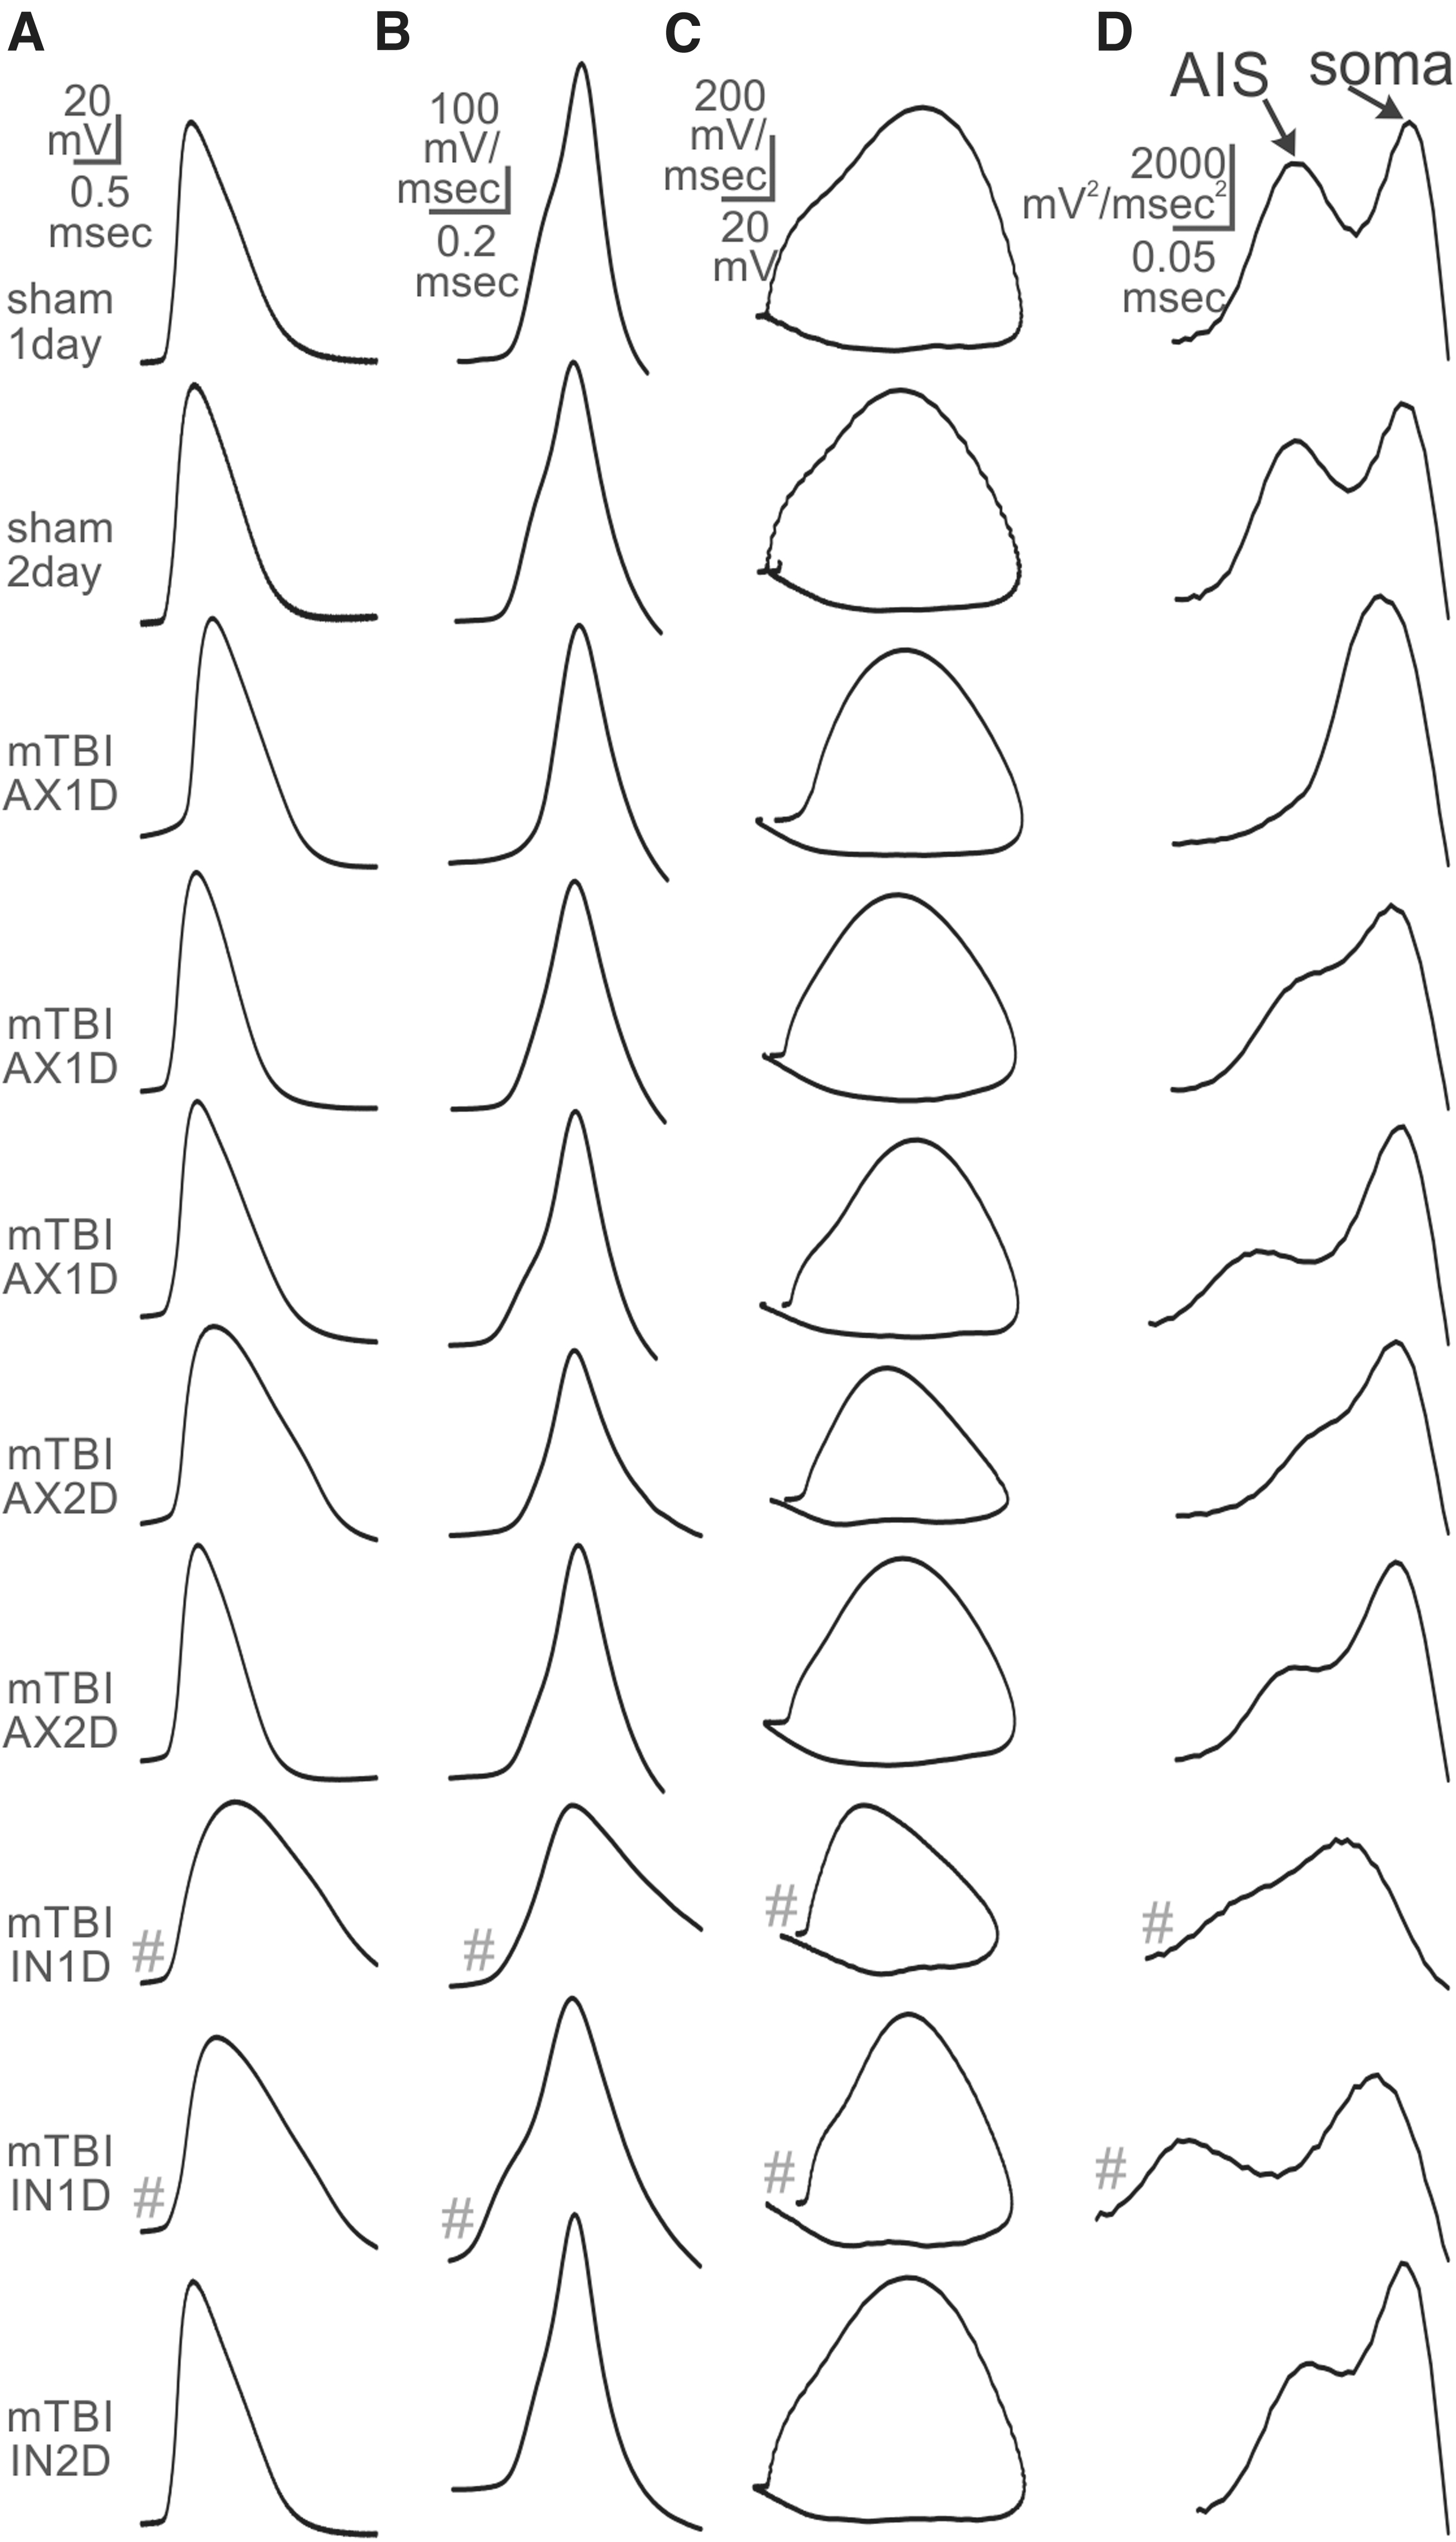
Examples of recordings from each subject group. Waveforms labeled with # indicate that they are shown at 2X vertical scale. (
Because concussive TBI-induced axotomy manifests at the AIS within the majority of axotomized neurons, 7 we expected that the AIS function would be perturbed in axotomized neurons, especially those axotomized at the region of the AIS. We discovered a subset of the AX1D and AX2D neurons in which there was only a single peak, and another group in which the first peak was not clearly separated from the second peak, creating a shoulder melding into a peak (see examples in Figs. 3 and 6).
A new measure (LSdiff) distinguishes the cells with an absent AIS 2o peak
Because of the variability in the shapes of the 2o for TBI neurons, we sought a quantitative means to distinguish single- versus double-peaked 2o waveforms. This led to the development of the LSdiff measure (see description in text above for Fig. 1). The threshold line of 2.25 separating single-peaked 2o below that level and double-peaked 2o above it was determined in our TTX experiments that eliminated the AIS peak (see Fig. 1).
This measure is shown for experimental groups in Fig. 4, where this quantitative measure agreed with qualitative classification: All single-peaked neurons shown as triangles fell below the 2.25 threshold while all double-peaked neurons shown as squares fell above this threshold. For the neurons that had a 2o with a shoulder+peak (Fig 4, circles), many had LSdiff values that fell below the threshold, similar to the single-peaked 2o, while others were just above this threshold.
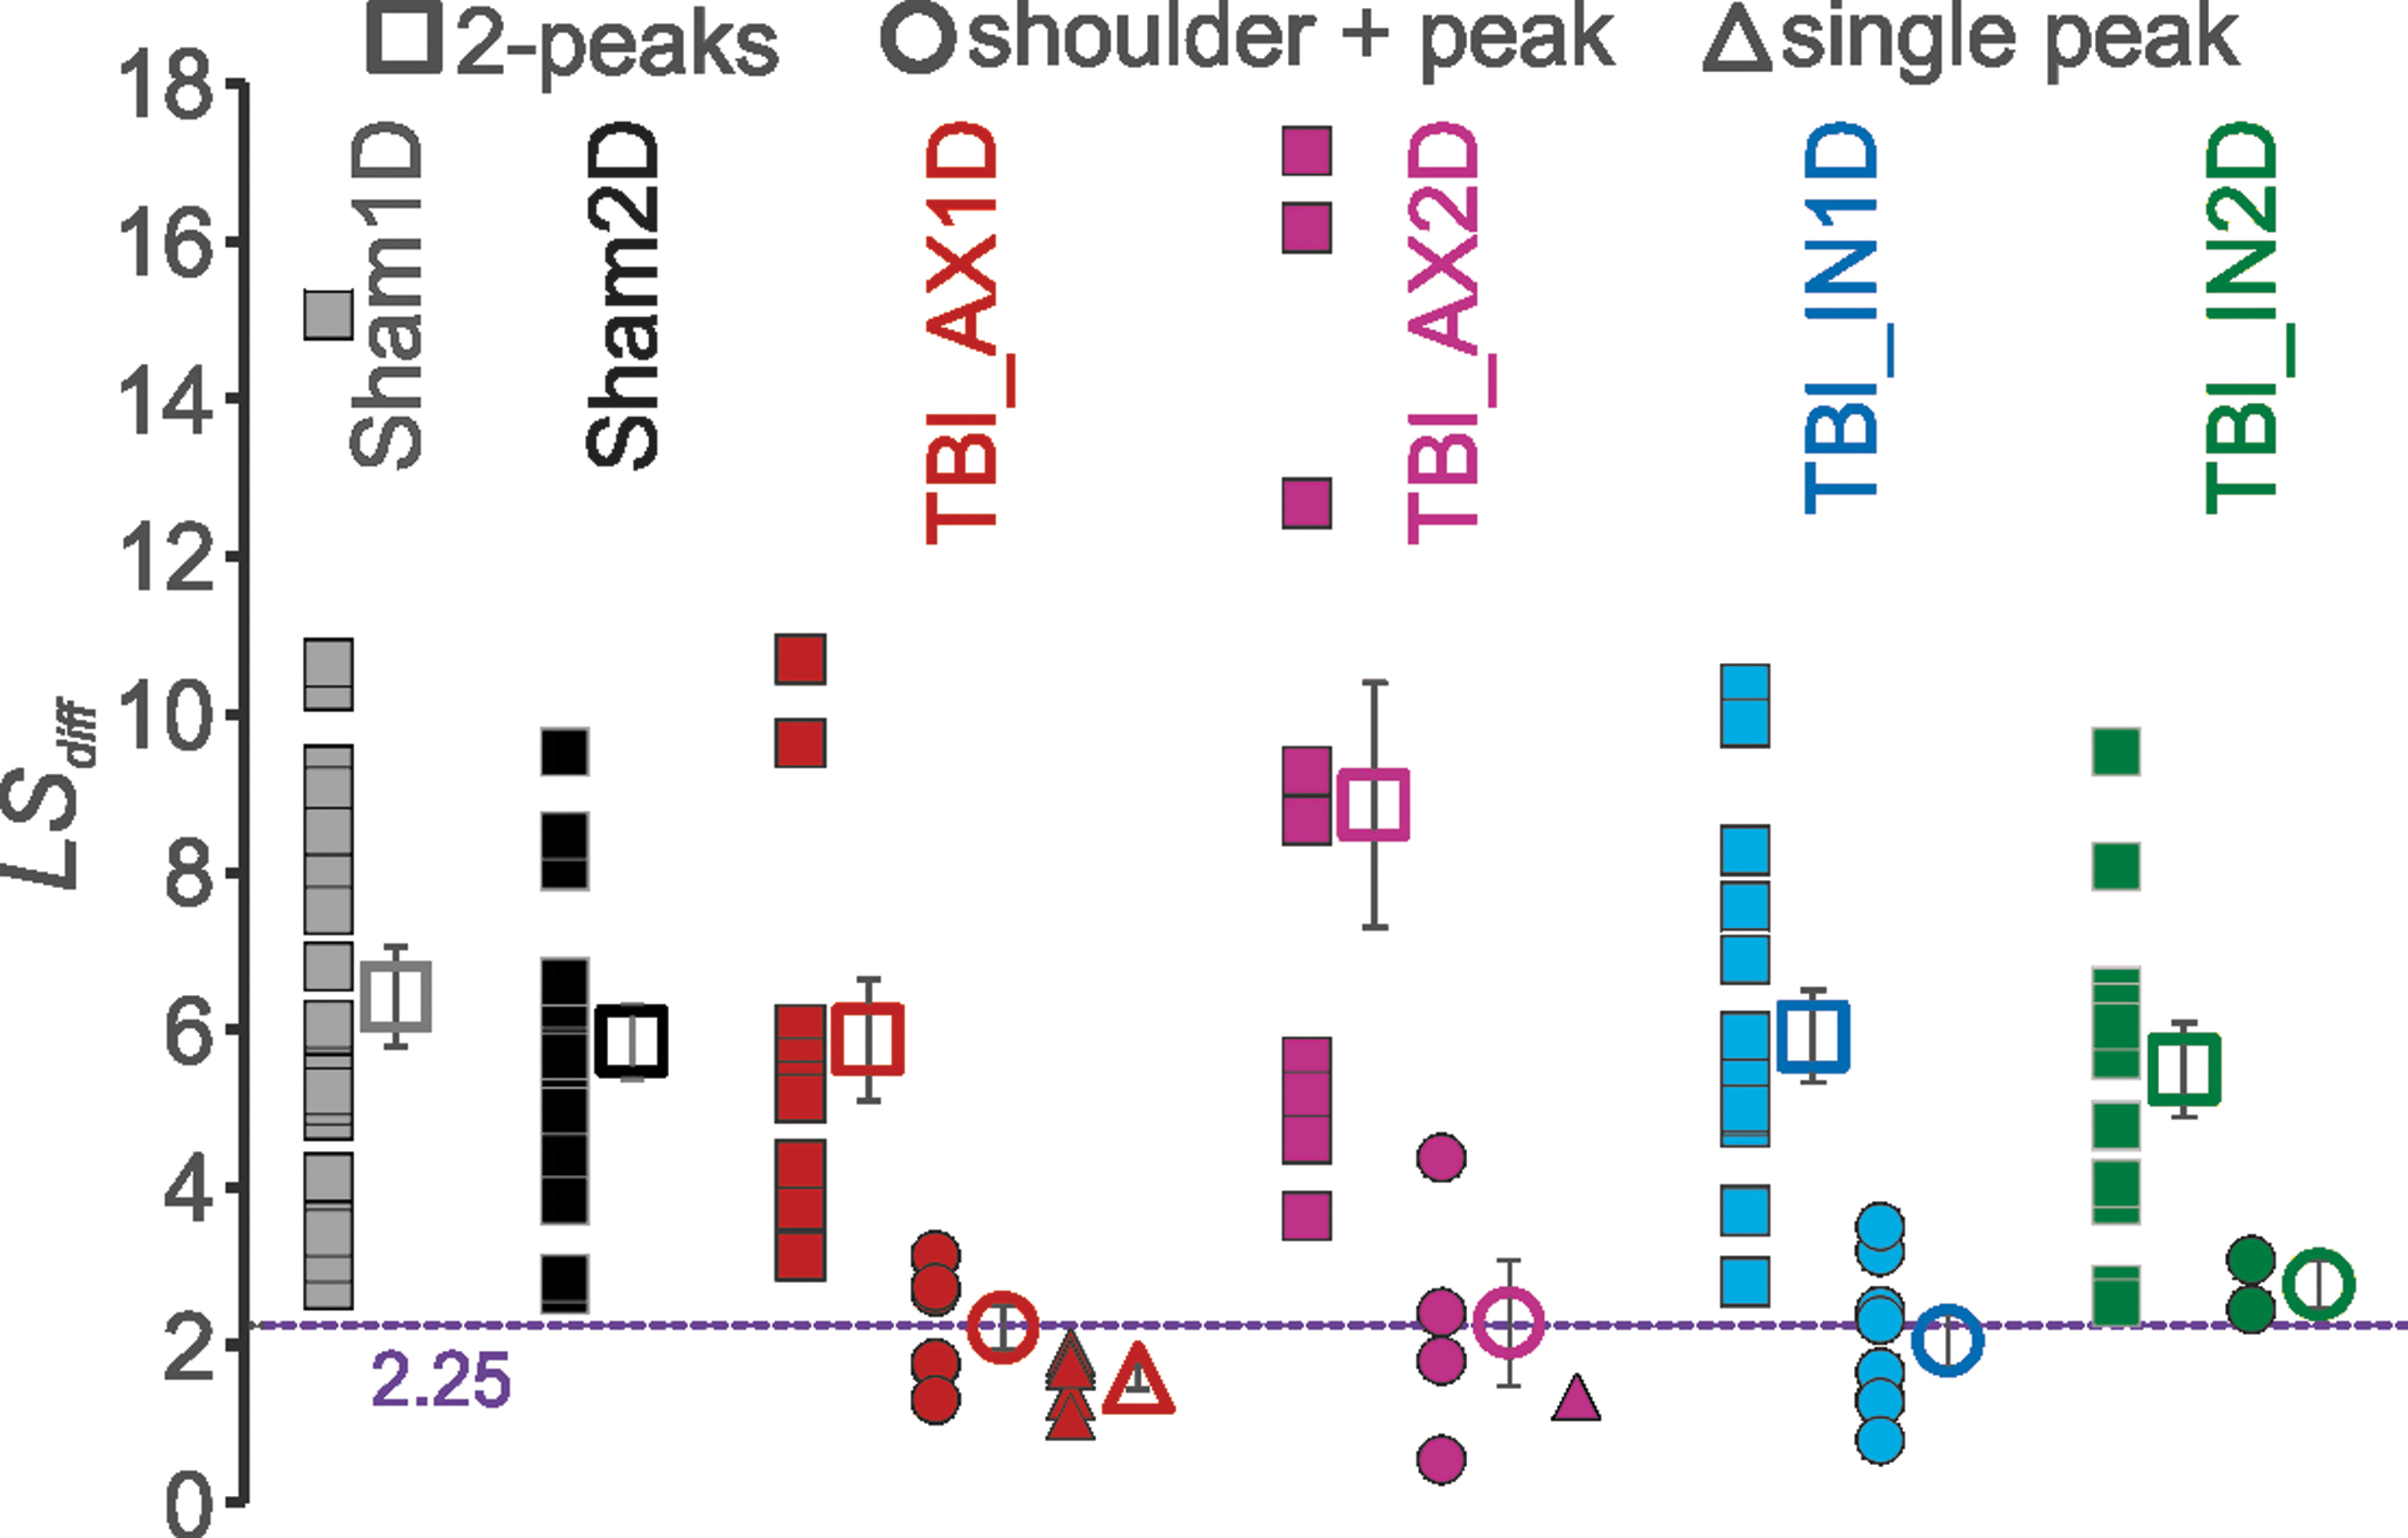
Measurement that differentiates between single and double-peaked 2o. The sum of the difference of actual values from the linear slope calculated from 99% of the second or only peak to 30% of that peak (LSdiff). Individual neurons in solid symbols and mean ± standard error of the mean in open symbols. All double-peaked 2o fall above the 2.25 line (purple dashed line), and all single-peaked 2o fall below this line. Shoulder+peak neurons tend to straddle the line. Subject numbers are reported as
A two-way ANOVA found no significant difference for LSdiff between subject groups, but p < 0.001 for the number of peaks, where shoulder+peak was considered 1.5 peaks. There was also no significant interaction between subject group and peak number. A Bonferroni post-hoc showed that LSdiff for double-peaked 2o was significantly greater than that for both the single-peaked and the shoulder+peak .
Timing of single-peaked 2o corresponds to the somatic peak
We next sought to determine whether the single-peaked 2o corresponded to the AIS or somatic peak or something in between, by assessing the time from AP threshold to the time of the 2o peak(s) (Fig 5). For the sham neurons, the AIS 2o peak always occurred less than 0.144 msec (dashed line in Fig. 5) after AP threshold. This was also true for all but one of the TBI neurons with double-peaked-2o (see filled diamonds in Fig. 5A).
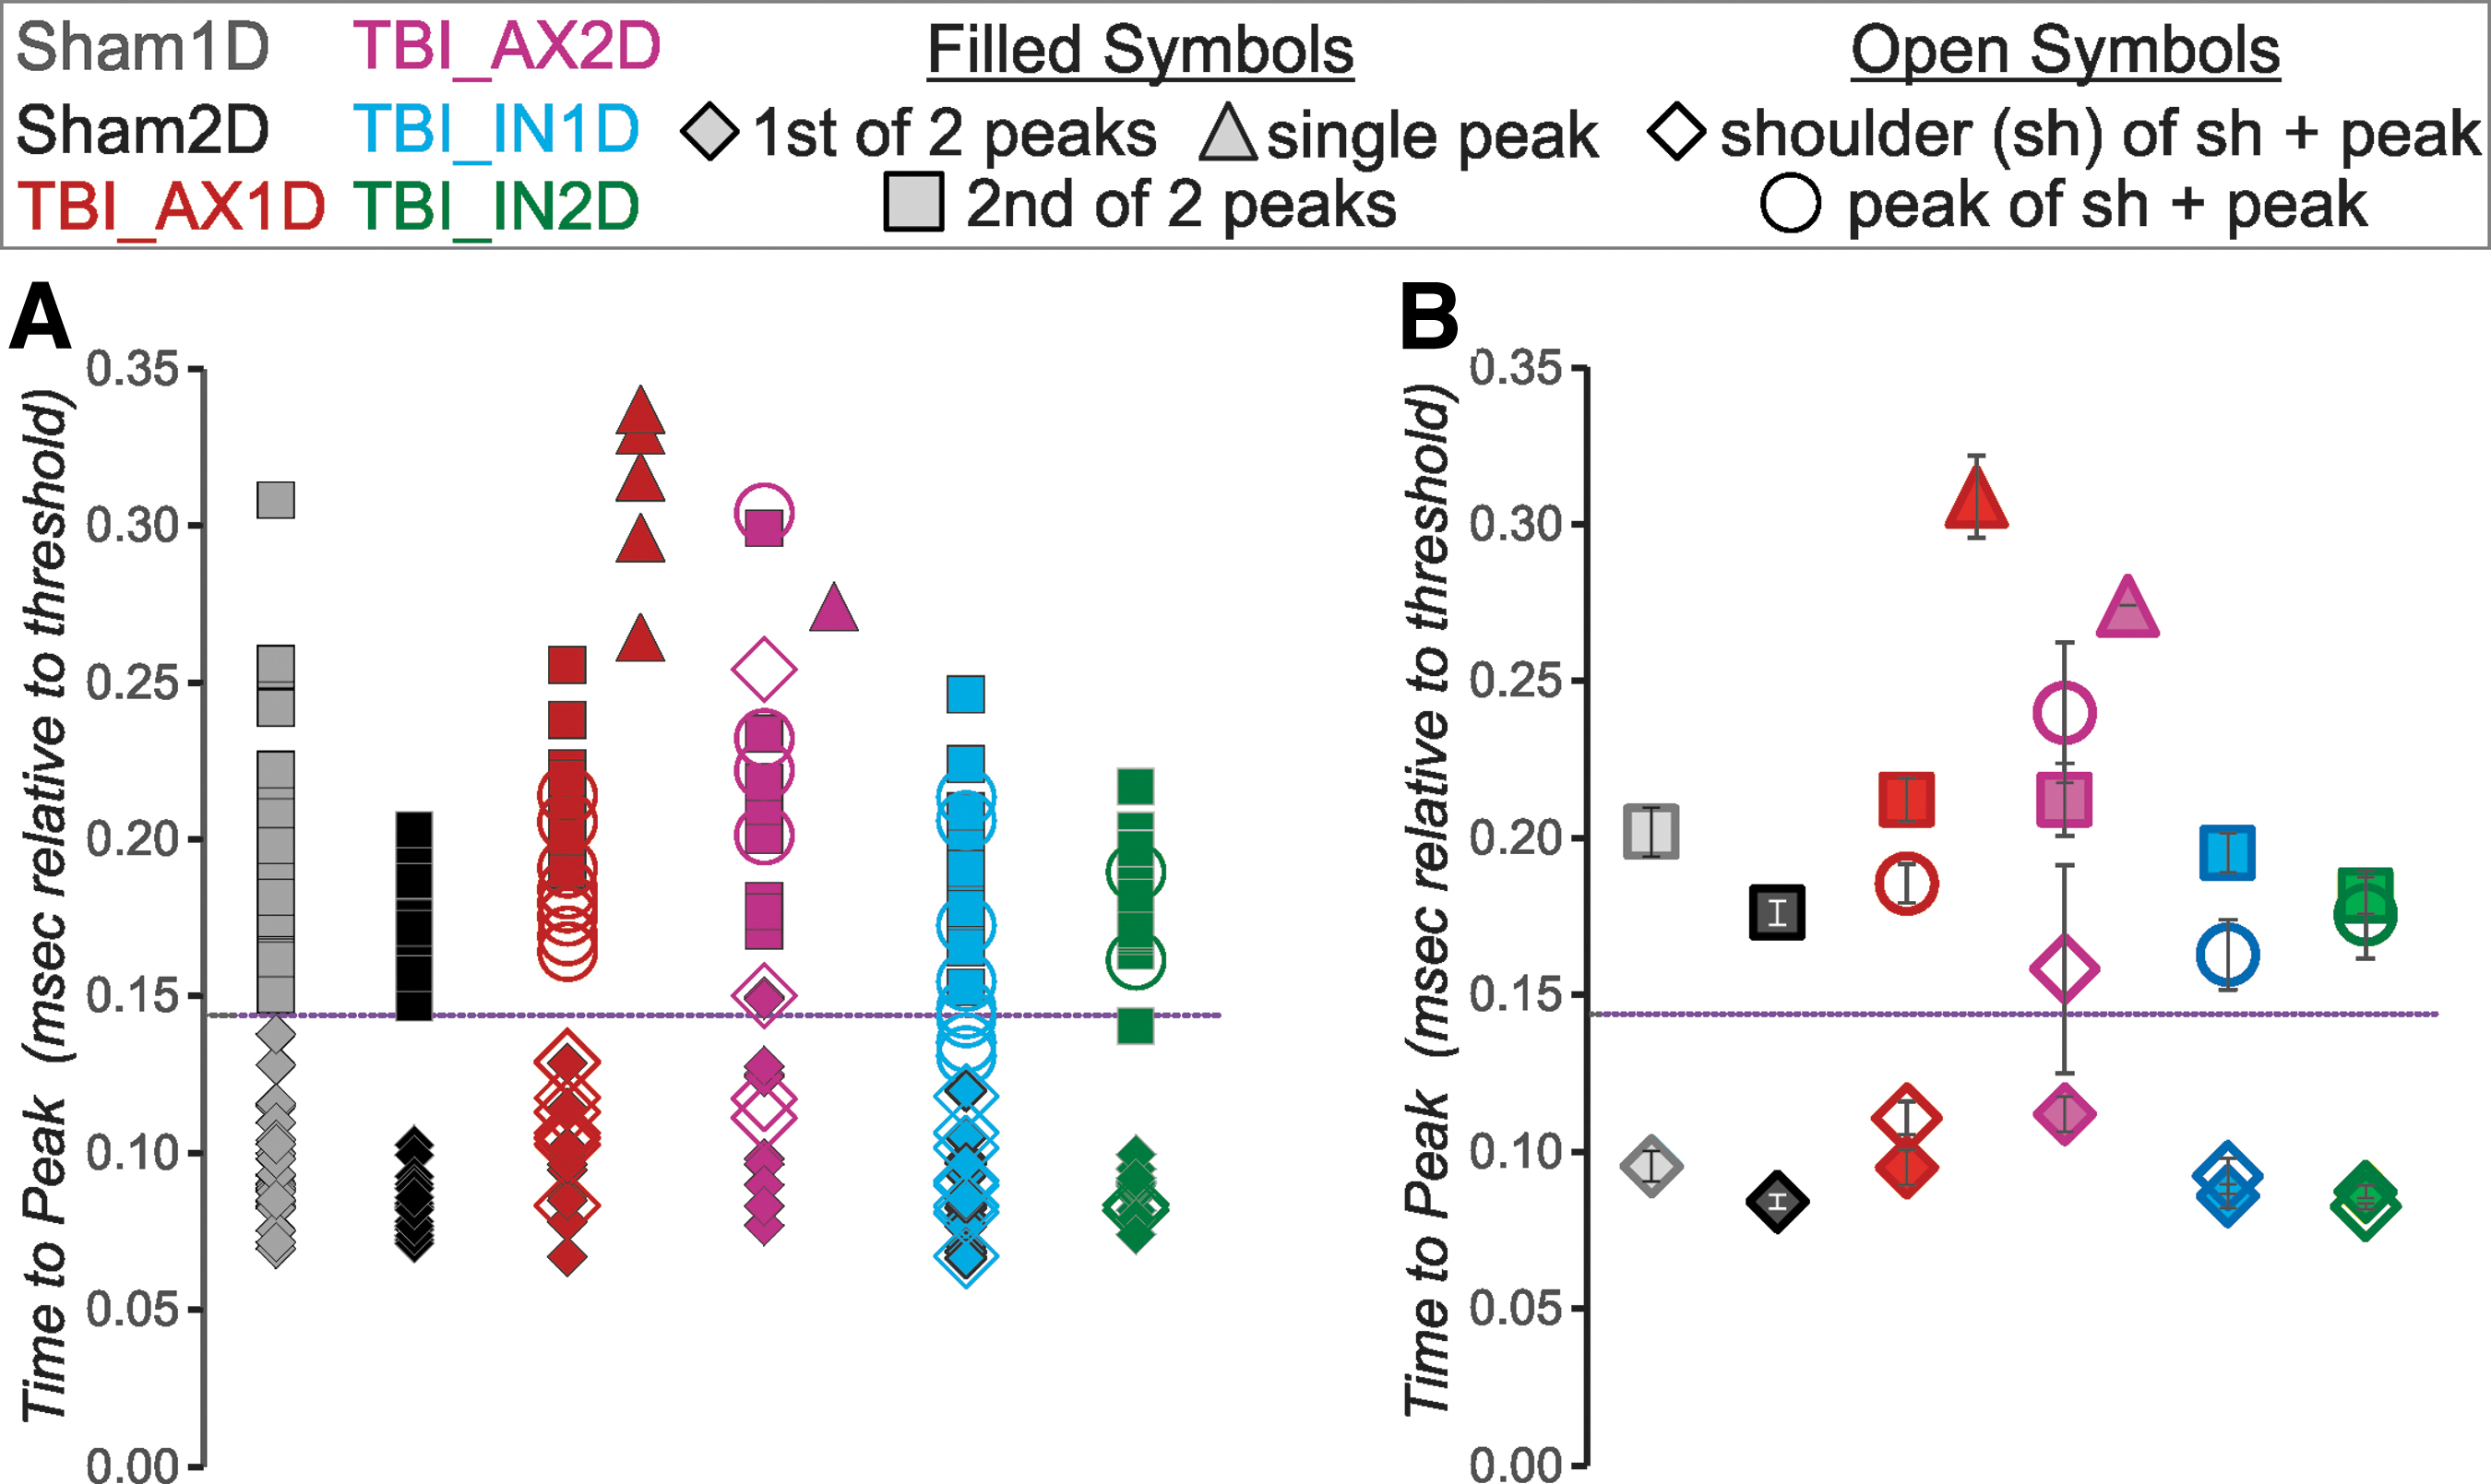
Most axon initial segment (AIS) or first peaks of the 2o occur less than 0.144 msec after threshold (dashed line), while most somatic or 2nd 2o peaks occur later than this. The single-peaked 2o occur as late as or later than the soma time to peak. Time to peak for individual cells shown in (
For shams, the somatic peak always occurred after this time of 0.144 msec. The same was true for the somatic peak for all but one of the TBI neurons with double-peaked-2o (Fig. 5A, filled squares). Thus, there was a clear time separation between AIS and somatic peaks. For the shoulder+peak neurons, the timings were similar to the double-peaked 2o neurons; that is, the shoulder (open diamonds in Fig. 5A) occurred less than 0.144 msec from AP threshold in all but one neuron. The peak for the shoulder+ peak neurons occurred in a time consistent with the somatic peak (open circles in Fig. 5A) for most neurons.
Within the IN1D group, however, several occurred slightly before this time (see open light blue circles in Fig. 5A). Importantly, the timing of single-peaked 2o (filled triangles in Fig. 5) was most consistent with the timing of the somatic (second) peak; in fact, on average, the timing of the single peak times was even later than that of the second peak for double-peaked 2o.
To examine this phenomenon further, the time of the second or only peak was statistically compared across neurons within the AX1D group. A one-way ANOVA showed a significant effect of peak number on relative time to peak, and the Bonferroni post-hoc showed that the time of the peak for single-peaked neurons was significantly greater than that of the second component of the double-peaked and the shoulder+peak neurons, suggesting that in the absence of an AIS-generated AP, more time is required to discharge the soma.
The slope between the 2o peaks distinguishes the shoulder+peak neurons
We next sought a more quantitative means of identifying the shoulder + peak 2o waveforms (see examples in Fig. 6A). Qualitatively, it appeared that the slope between the peaks was positive for the neurons manifesting a shoulder and might specifically distinguish them. Thus, we calculated the slope of the 2o from the AIS peak (or shoulder) to the midpoint between the peaks (Fig. 6B).
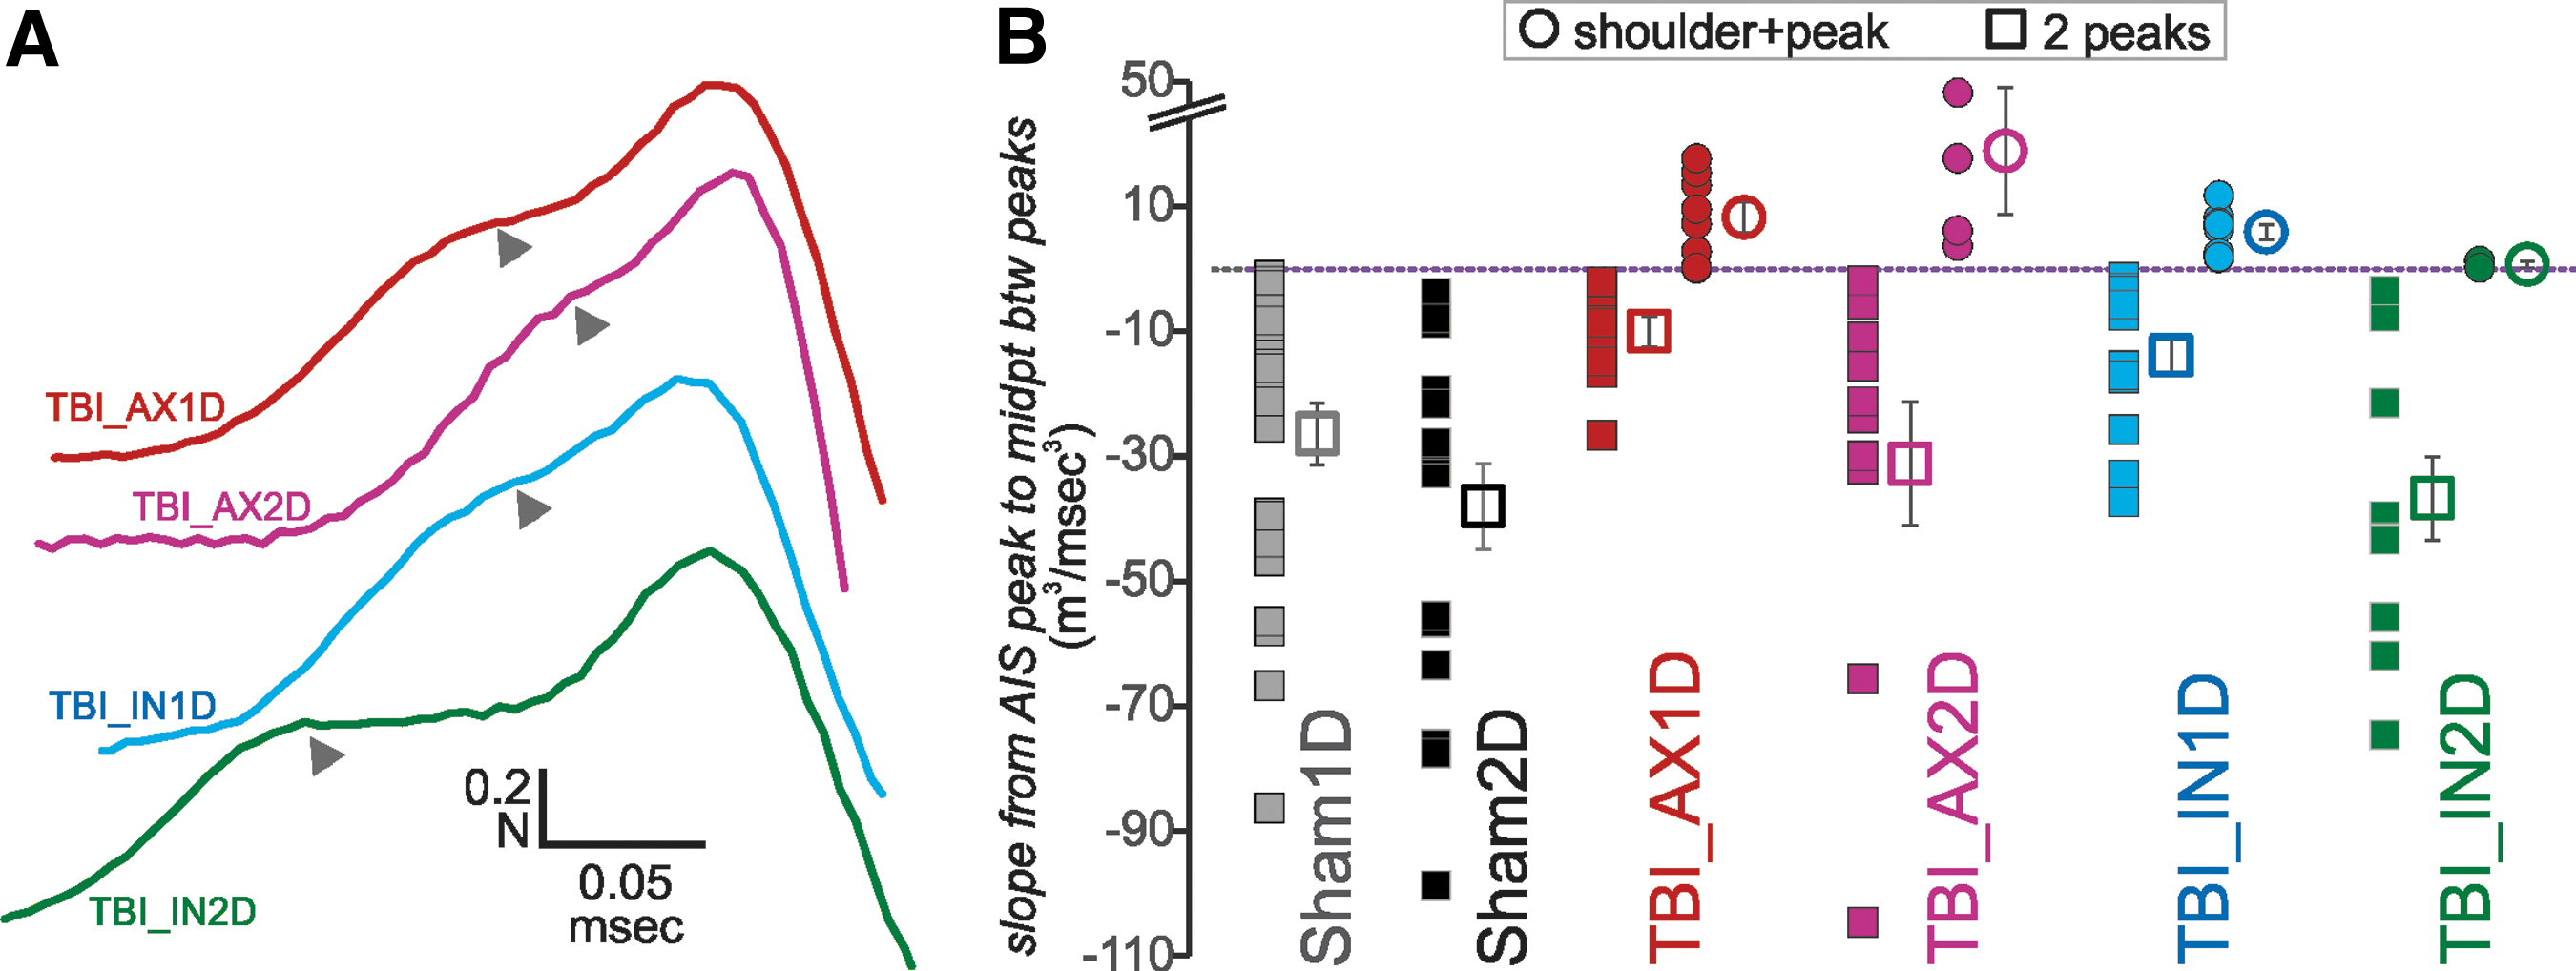
Some 2o waveforms manifest a shoulder before a peak. (
For all sham and most IN2D neurons, this slope was negative, allowing the peaks to be unambiguously distinguished. This measure could only be made on neurons whose 2o manifested either double peaks or a shoulder and a peak; consequently, a subset of neurons from the AX1D and AX2D groups with a single peak did not qualify. Eight of the 23 neurons within the AX1D group had positive slopes (Fig 6) and the shoulder appearance. We note that a majority of neurons in the AX1D group had either a single peak or a shoulder+peak (Fig. 7A). The numbers were smaller for the other TBI groups, but all had some “shoulder” neurons, indicating consistently altered AIS function for all TBI groups.
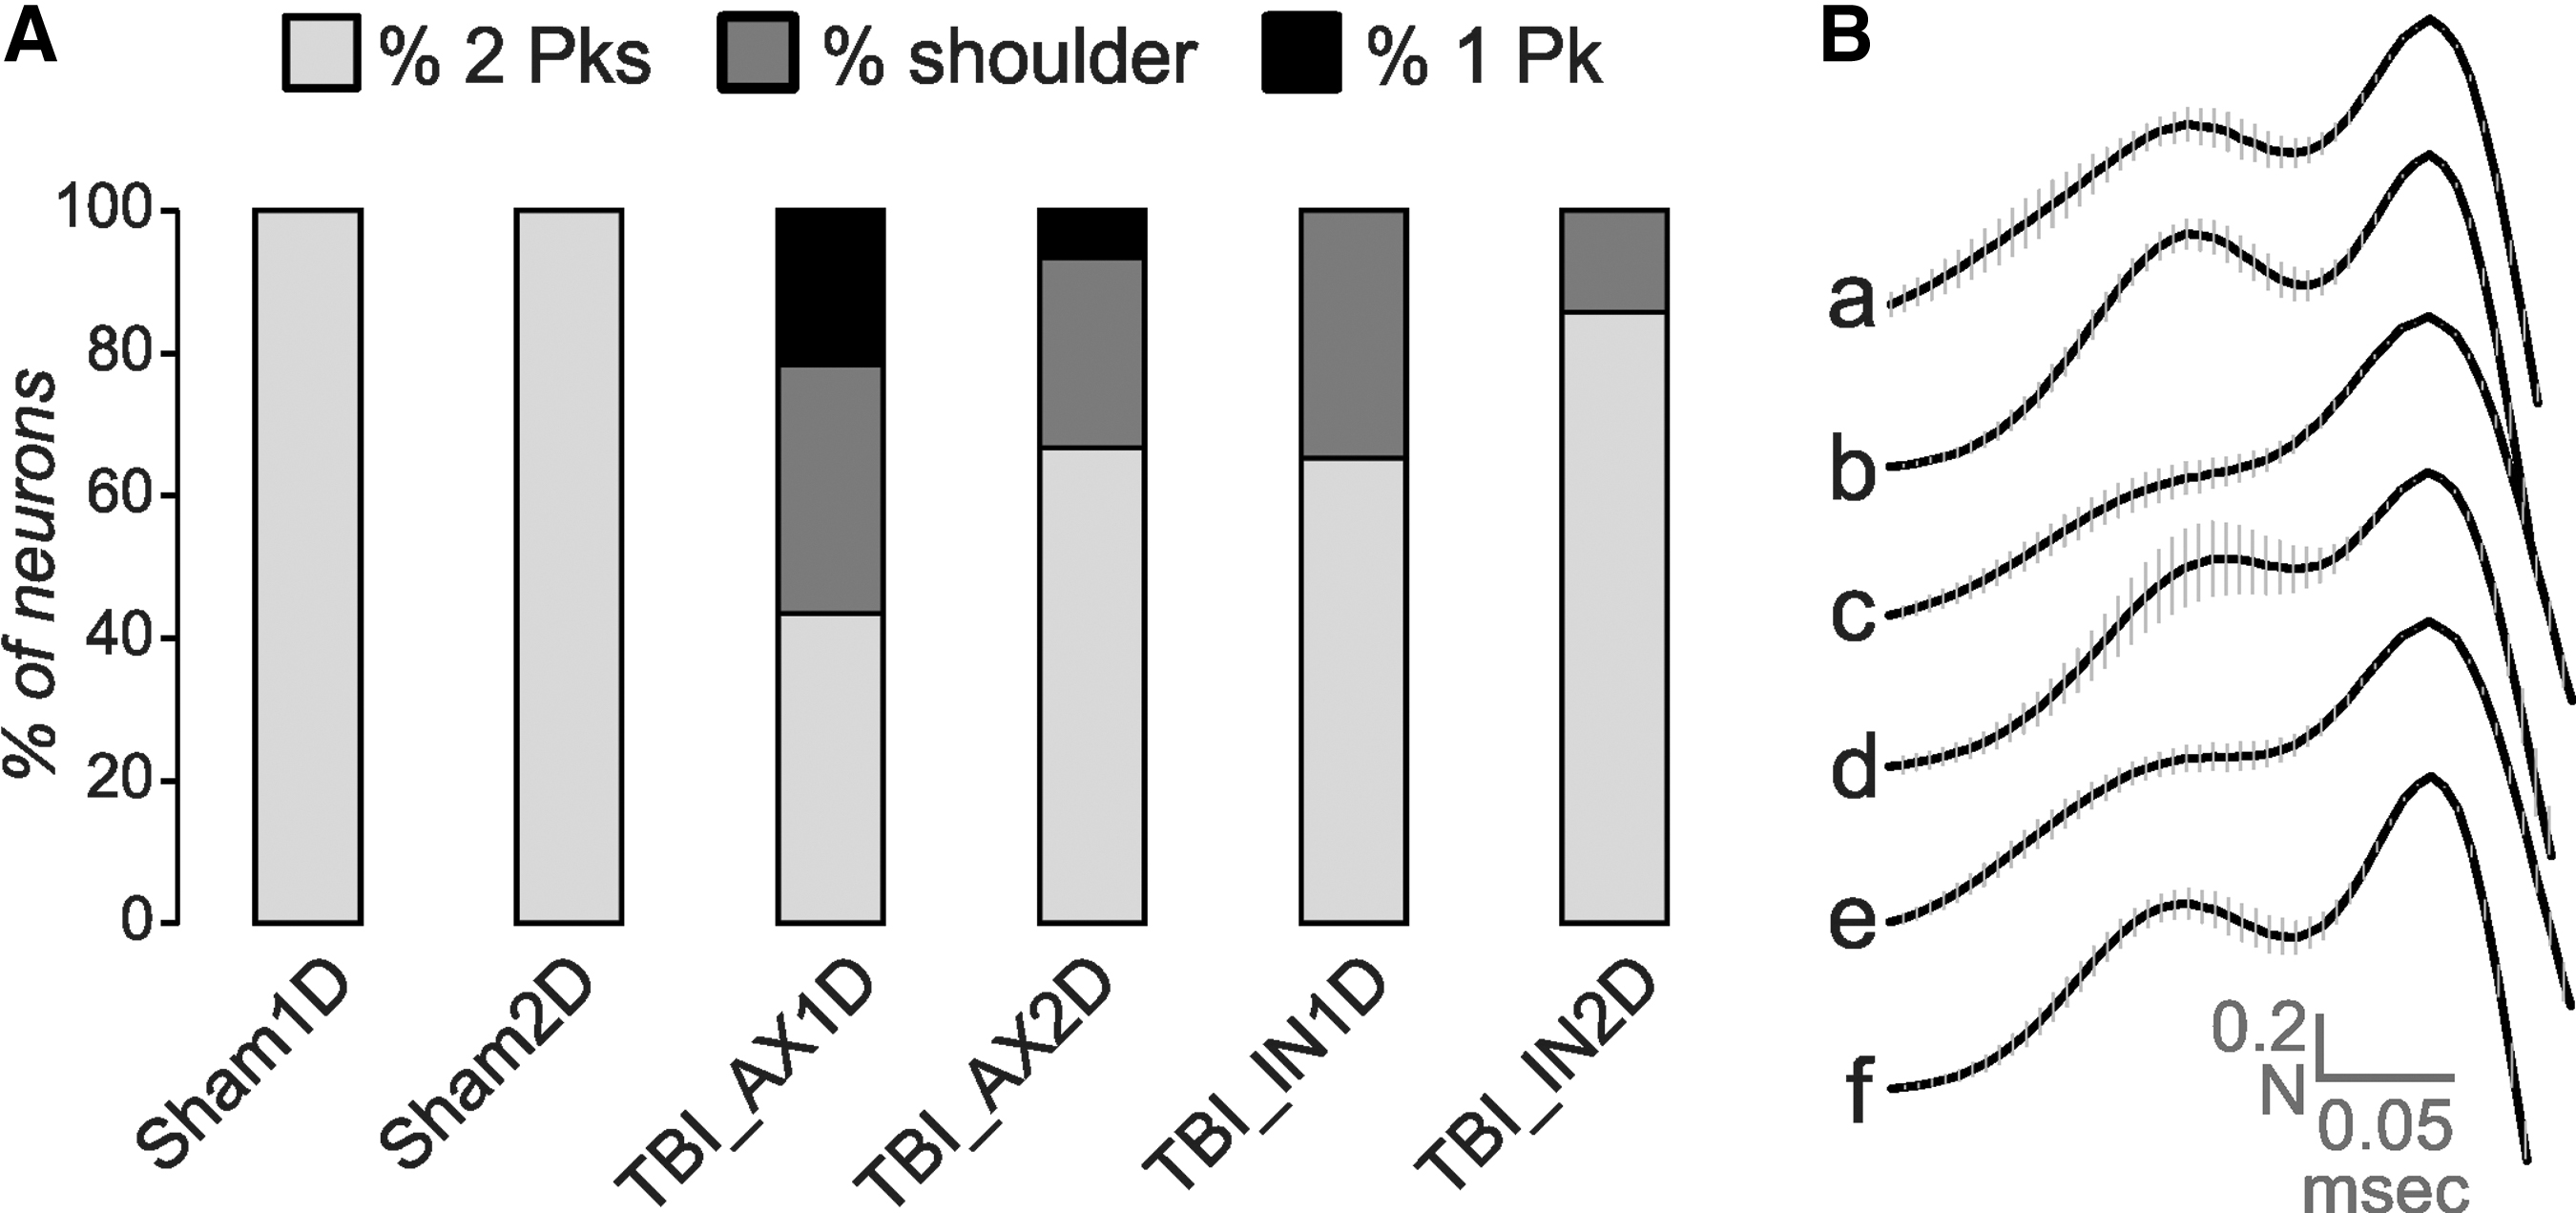
(
The degree of these changes can be seen from the waveforms averaged across all neurons within a subject group (Fig. 7B). Here the waveforms were normalized to the second (or only) peak and aligned to the time of this peak and then averaged across all cells within the group. For groups containing many shoulder neurons (AX1D, IN1D), this produced a relatively flat region of the curve where the expected AIS peak would occur (Fig. 7Bc, e).
By the second day after injury, the axotomized group showed a smaller subset with either a single peak or shoulder+peak (Fig. 7A), resulting in greater variability in the normalized AIS peak amplitude for the averaged waveform of this group (Fig. 7Bd, see error bars). For groups AX1D, AX2D, and IN1D, significantly fewer neurons had double peaks with a negative intervening slope, compared with the corresponding shams (z-tests, p < 0.05).
Decreased amplitude of 2o peaks suggests reduced sodium current density after injury
The analyses up to this point allowed classification of the neurons and proper assignment of the single-peaked 2o neurons (somatic peak) for quantitative measurement of the peak voltage acceleration of the 2o. To examine the overall effects of concussive brain trauma on the relative voltage acceleration during the AP upstroke at the AIS and the soma, the peak amplitudes of the 2o for AIS and somatic locations were examined. The 2o peak amplitude at the AIS was significantly lower than sham for both AX1D and IN1D groups (Fig. 8A, ANOVA, Bonferroni post-hoc, p < 0.05).
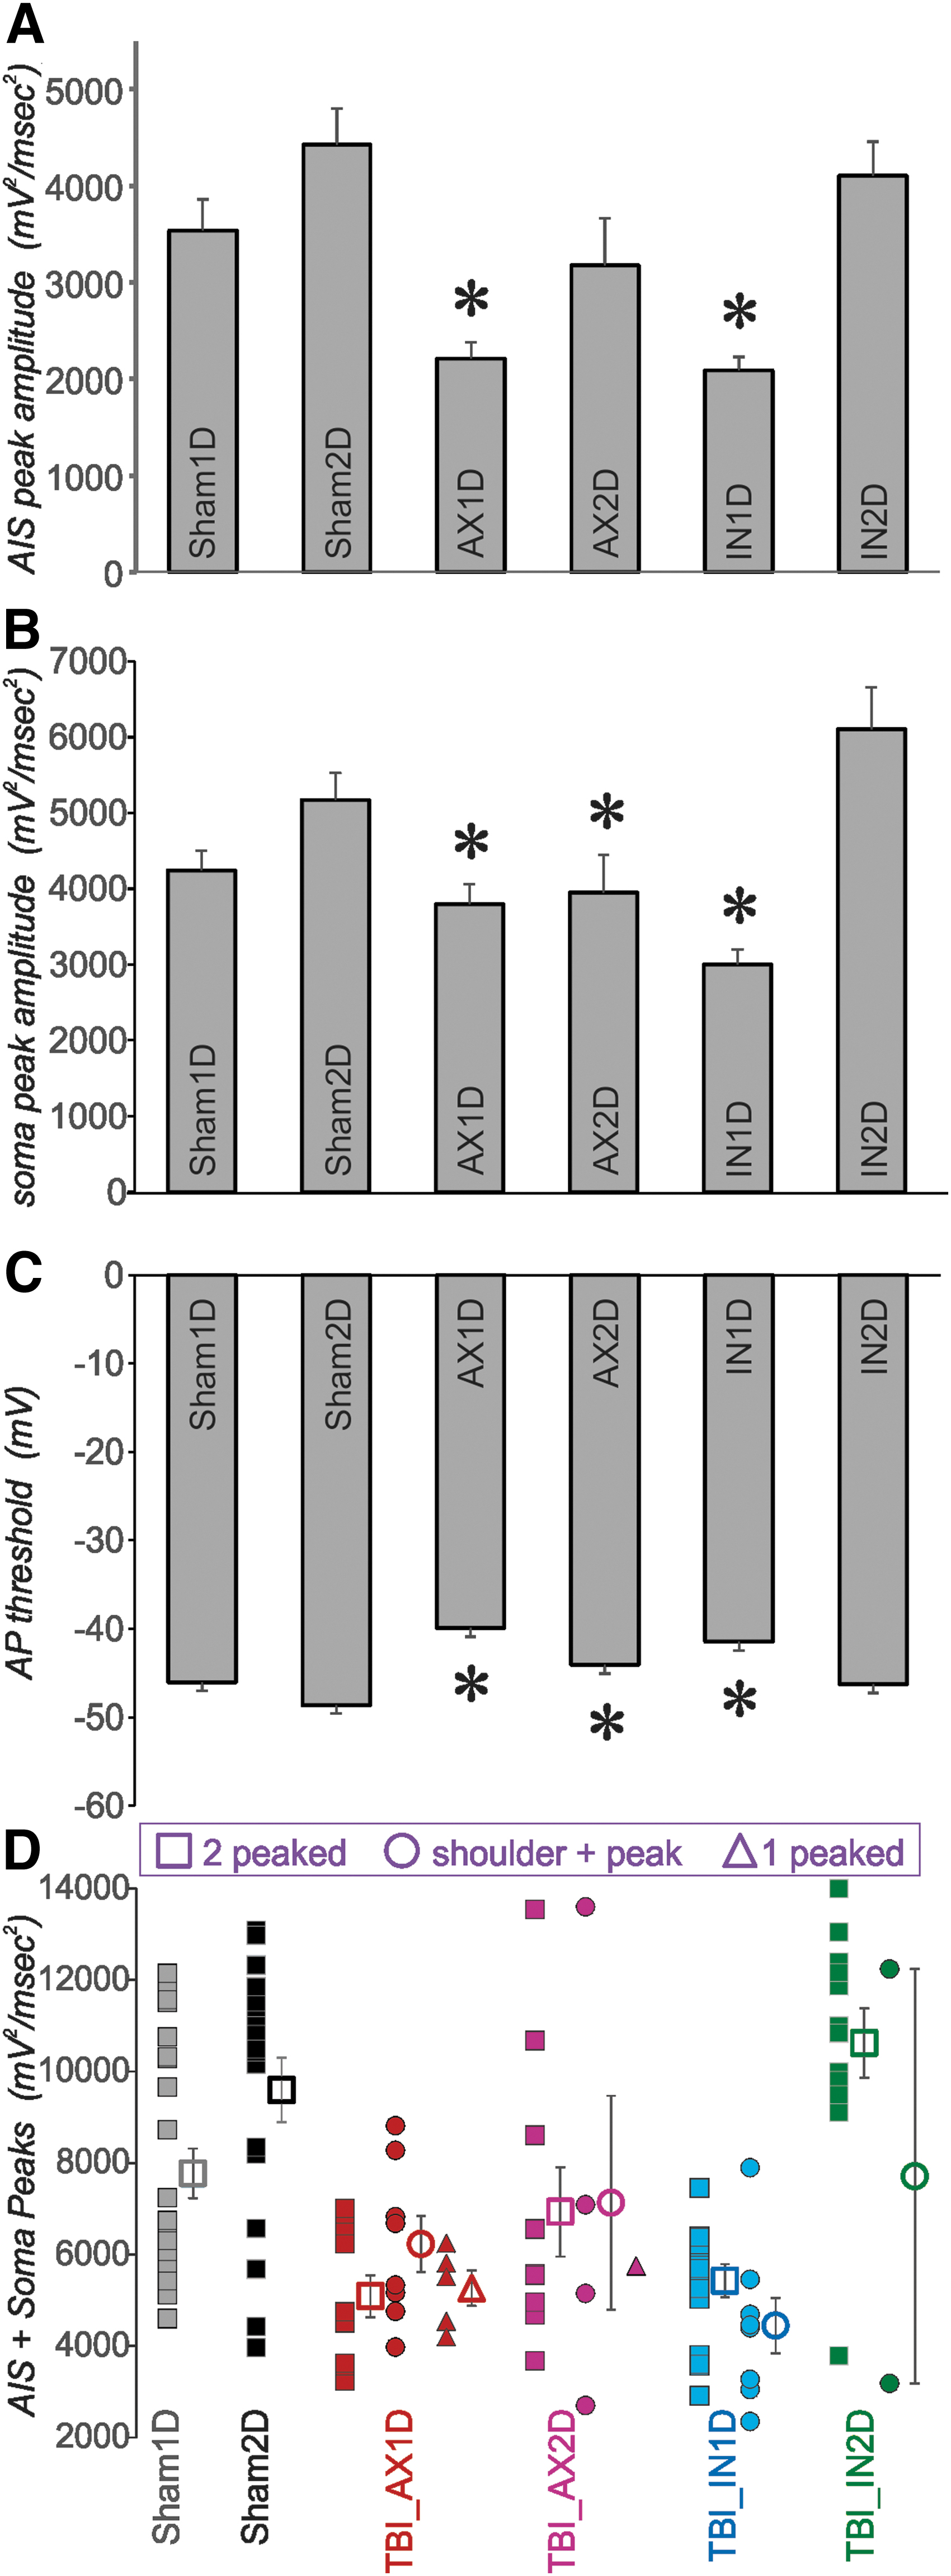
The 2o peak values suggest that action potential (AP) generation at both the axon initial segment (AIS) and the soma are altered for some experimental groups. (
While we previously saw a decrease in the IN2D group compared with sham, 24 this result was not replicated in this larger cohort. The somatic 2o peak amplitude was also significantly lower than sham for both AX1D and IN1D groups, as well as for the AX2D group (Fig. 8B, ANOVA, Bonferroni post-hoc, p < 0.05). This difference returned to sham levels for the IN2D group. The three TBI groups showing reduced soma-regional AP acceleration also had a significantly more depolarized AP threshold that returned to near-sham levels for the IN2D group (Fig. 8C, ANOVA, Bonferroni post-hoc, p < 0.05).
When the sum of the AIS- and soma-regional 2o peak amplitudes was calculated, presumably reflecting the total sodium current density during the AP upstroke, the sums for the AX1D, AX2D, and IN1D groups were significantly less than sham and IN2D groups (Fig. 8D, ANOVA, Bonferroni post-hoc, p < 0.05). We also observed, however, that the amplitude of single-peaked 2o was similar to that of the sum of the two peaks of double-peaked 2o within the AX1D group (Fig. 9A).
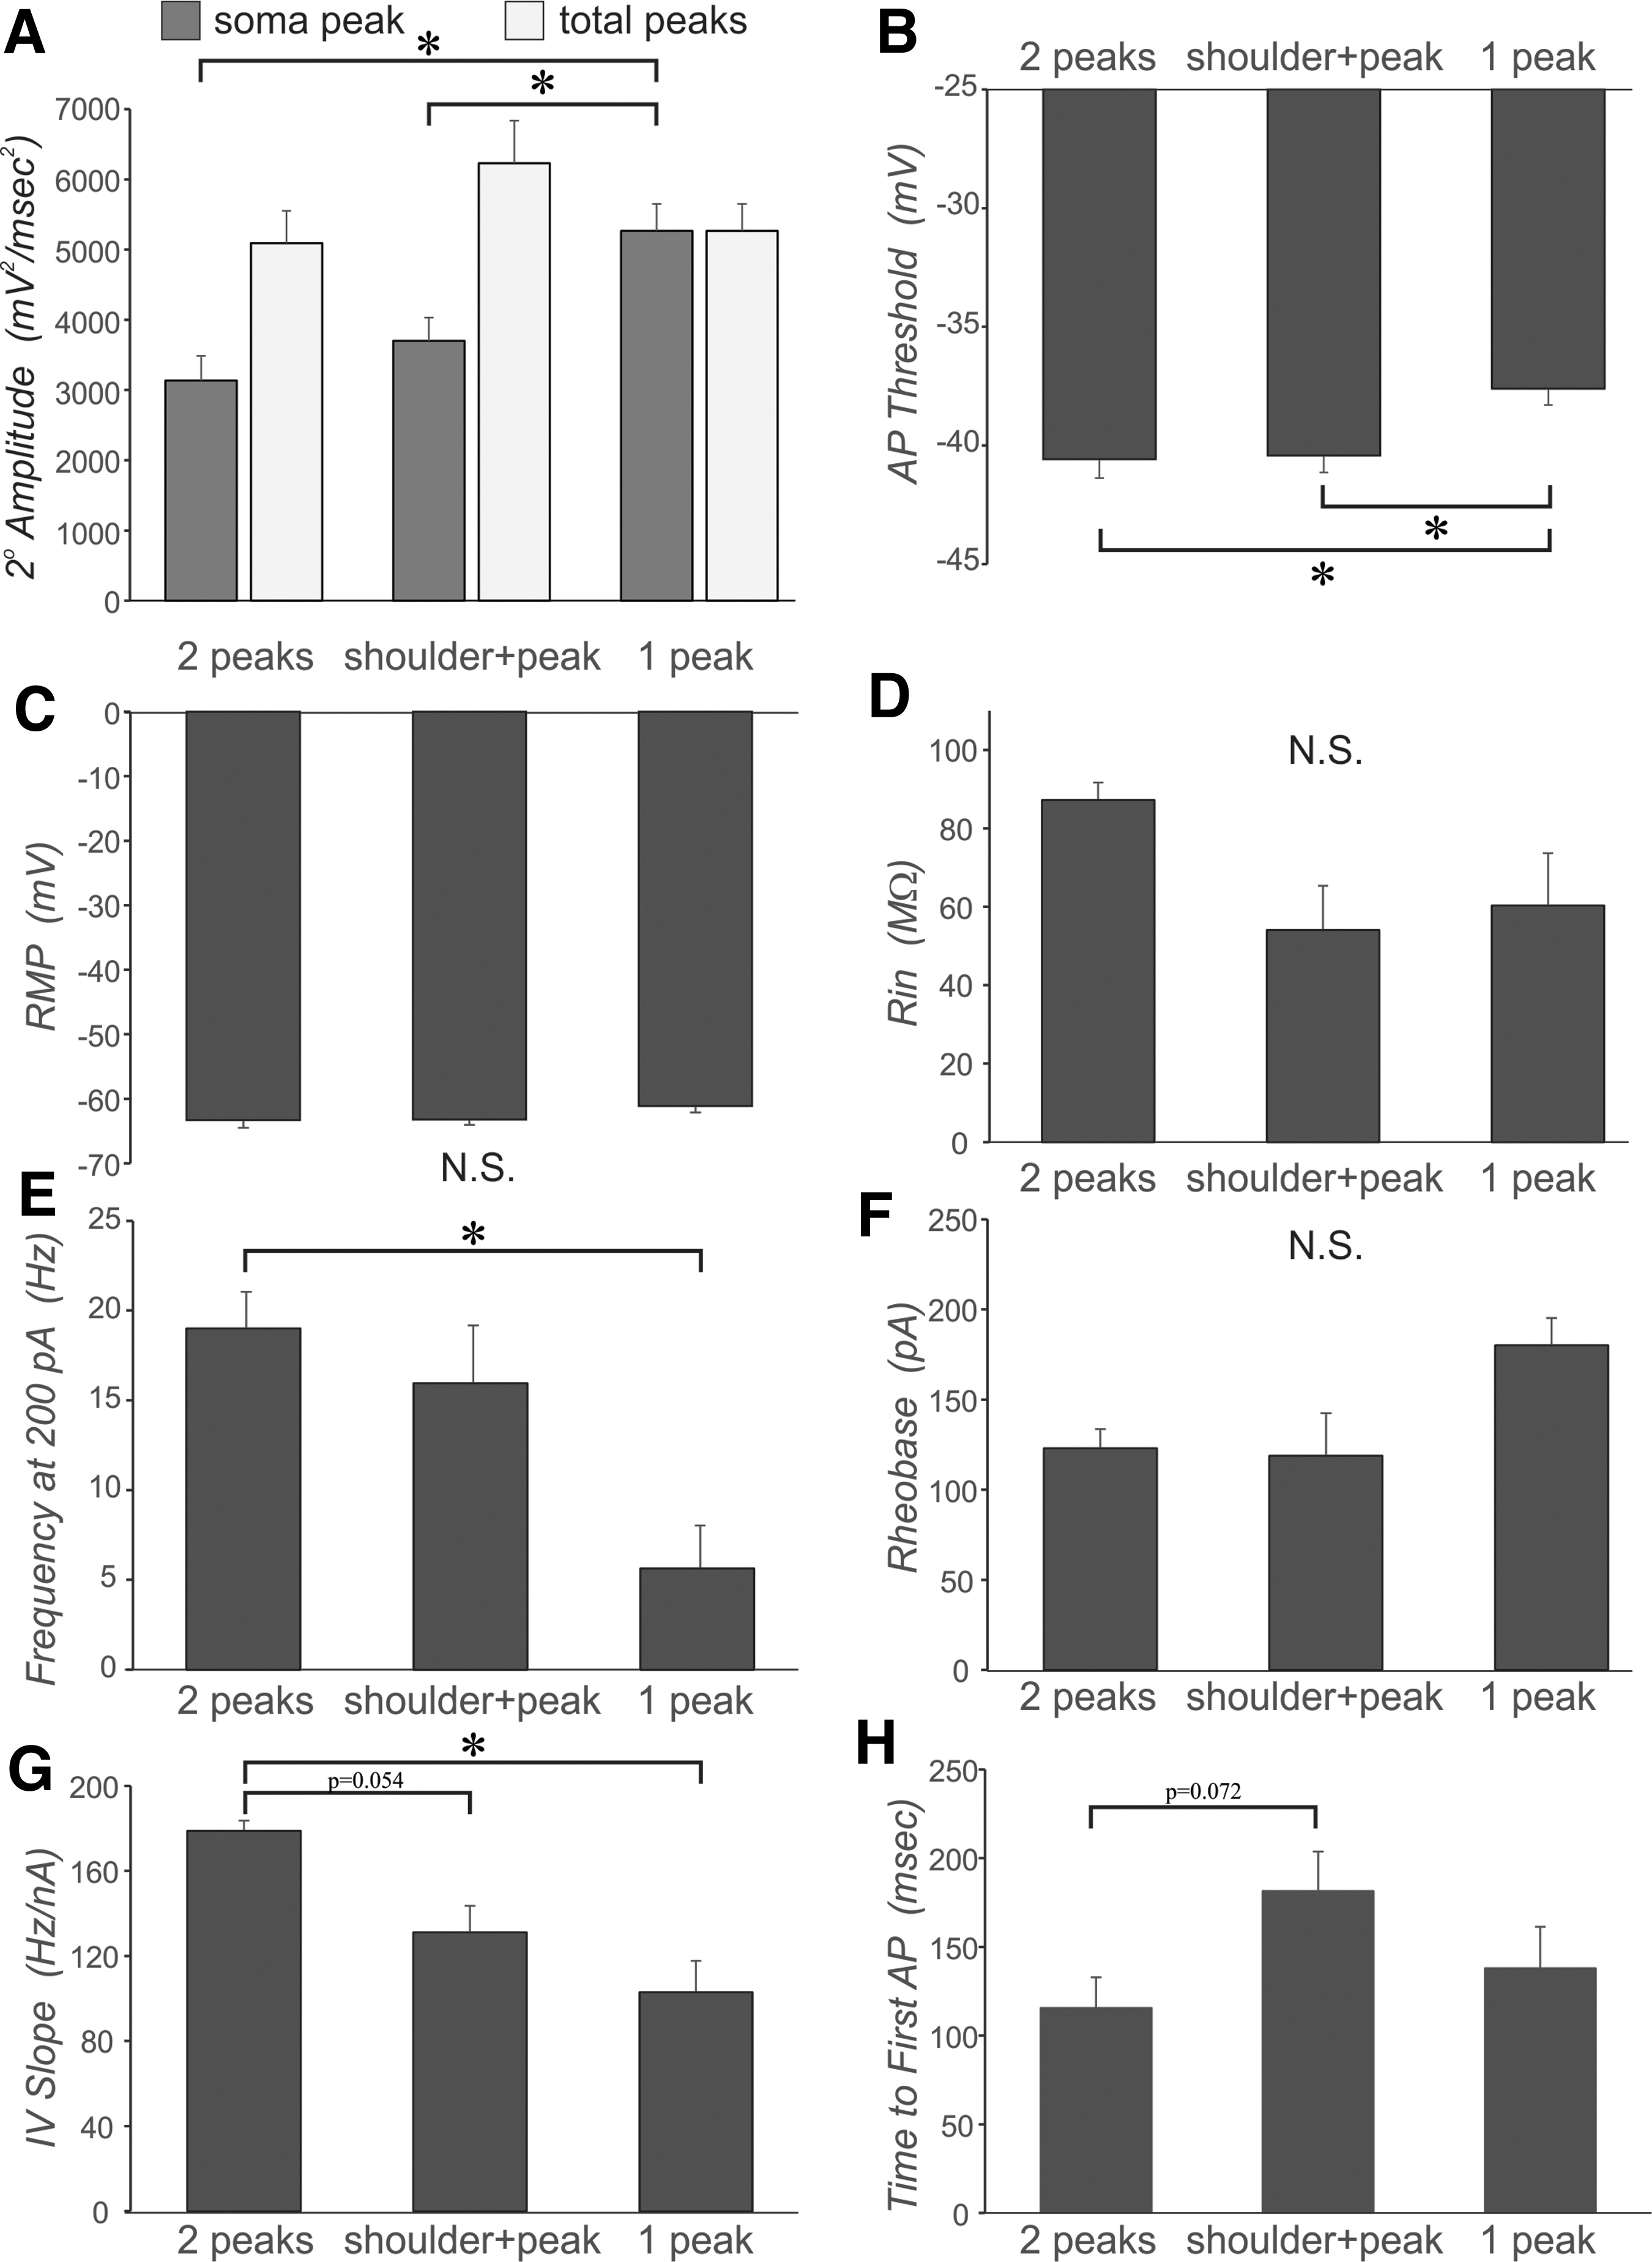
Effect of 2o peak number and shape for neurons from the AX1D group. In all cases a one-way analysis of variance with Bonferroni post-hoc was performed, * = p < 0.05, with subject numbers reported as
This result suggested that the AIS and somatic generation zones may approach each other more closely. If so, it follows that the peak amplitude of the single-peaked 2o of the AX1D group should be larger than that of the somatic peak of the double-peaked and shoulder+peak 2o in the AX1D group. We find this result to be the case (Fig. 9A, ANOVA, Bonferroni post-hoc, p < 0.05).
The impairment of AIS-regional AP generation in the AX1D, AX2D, and IN1D groups did not arise as a function of unhealthy neurons as judged by conventional criteria. The input resistance in these groups was similar to that of the sham and IN2D groups (Table 1), although the resting membrane potential (RMP) was slightly more depolarized in these groups (Table 1). In addition, within the AX1D subject group, the single-peaked or shoulder+peak neurons were not significantly different from the double-peaked AX1D neurons on RMP and input resistance (Fig. 9C, D), suggesting the differences in the shape of the 2o cannot be explained by differences in global metrics of neuronal health.
Abolition of the AIS peak results in reduced overall neuronal excitability
We next sought to correlate the consequences of trauma-induced AIS-regional functional perturbation to the associated AP discharge patterns of affected neurons. We observed differences in the AP discharge patterns of single-peaked and shoulder+peak neurons compared with double-peaked neurons within the AX1D subject group. In particular, the AP threshold for single-peaked AX1D neurons was significantly depolarized compared with either shoulder+peak or double-peaked AX1D neurons (Fig. 9B), yet the rheobase was not significantly different between these three AX1D groups (Fig. 9F).
The single-peaked AX1D neurons discharged APs at a significantly lower frequency in response to 200 pA depolarizing current injection compared with double-peaked AX1D neurons (Fig. 9E, ANOVA, Bonferroni post-hoc, p < 0.05). In addition, the slope of the plot of AP frequency versus current injection was significantly lower in single-peaked compared with the double-peaked neurons, with a similar trend in a lower value for shoulder+peak compared with double-peaked (Fig. 9G, ANOVA, Bonferroni post-hoc, p = 0.054). These results suggest that the single-peaked neurons are less excitable.
The time to the first AP at rheobase was not significantly different between these three peak shapes for AX1D neurons, but there was a trend toward a longer time for the shoulder+peak group compared with double-peaked neurons (Fig. 9H, ANOVA, Bonferroni post-hoc, p = 0.072).
Because the pattern of action potentials varies for different firing types of RS, RSd, and IB and that can affect some of these intrinsic/cellular measures, the proportion of different 2o peak numbers for each firing type was determined. Double-peaked and shoulder+peak 2o forms were found for all three firing types of cells (RS, RSd and IB, Supplementary Fig. S3). Single-peaked 2o were found only in RS and RSd types. We also sought to determine whether the significant effects shown in Figure 9 were attributable to firing type instead of 2o peak number.
To examine this, two-way ANOVAs for firing type and peak number were performed for the AX1D subject group. Note other subject groups did not have a full complement of all peak numbers. The results of these twp-way ANOVAs are shown in Supplementary Table S1, where there were no significant effects of neuronal firing type nor any significant interactions between neuronal firing type and 2o peak number. For this reason, we feel confident that the effects shown in Figure 9 are associated with 2o peak number.
Abolition of the AIS 2o peak is associated with morphological change of the axon
In examining the filled neurons that had shown a single-peaked 2o, we noted a specific morphological aberration in the form of an AIS-regional stump. All of the neurons manifesting a single peak were characterized by a wider, distended AIS and diminished staining intensity of ankyrin-G compared with neighboring neurons (Fig. 10, C1,C2, also see 10G; Fig. 11 D,E).
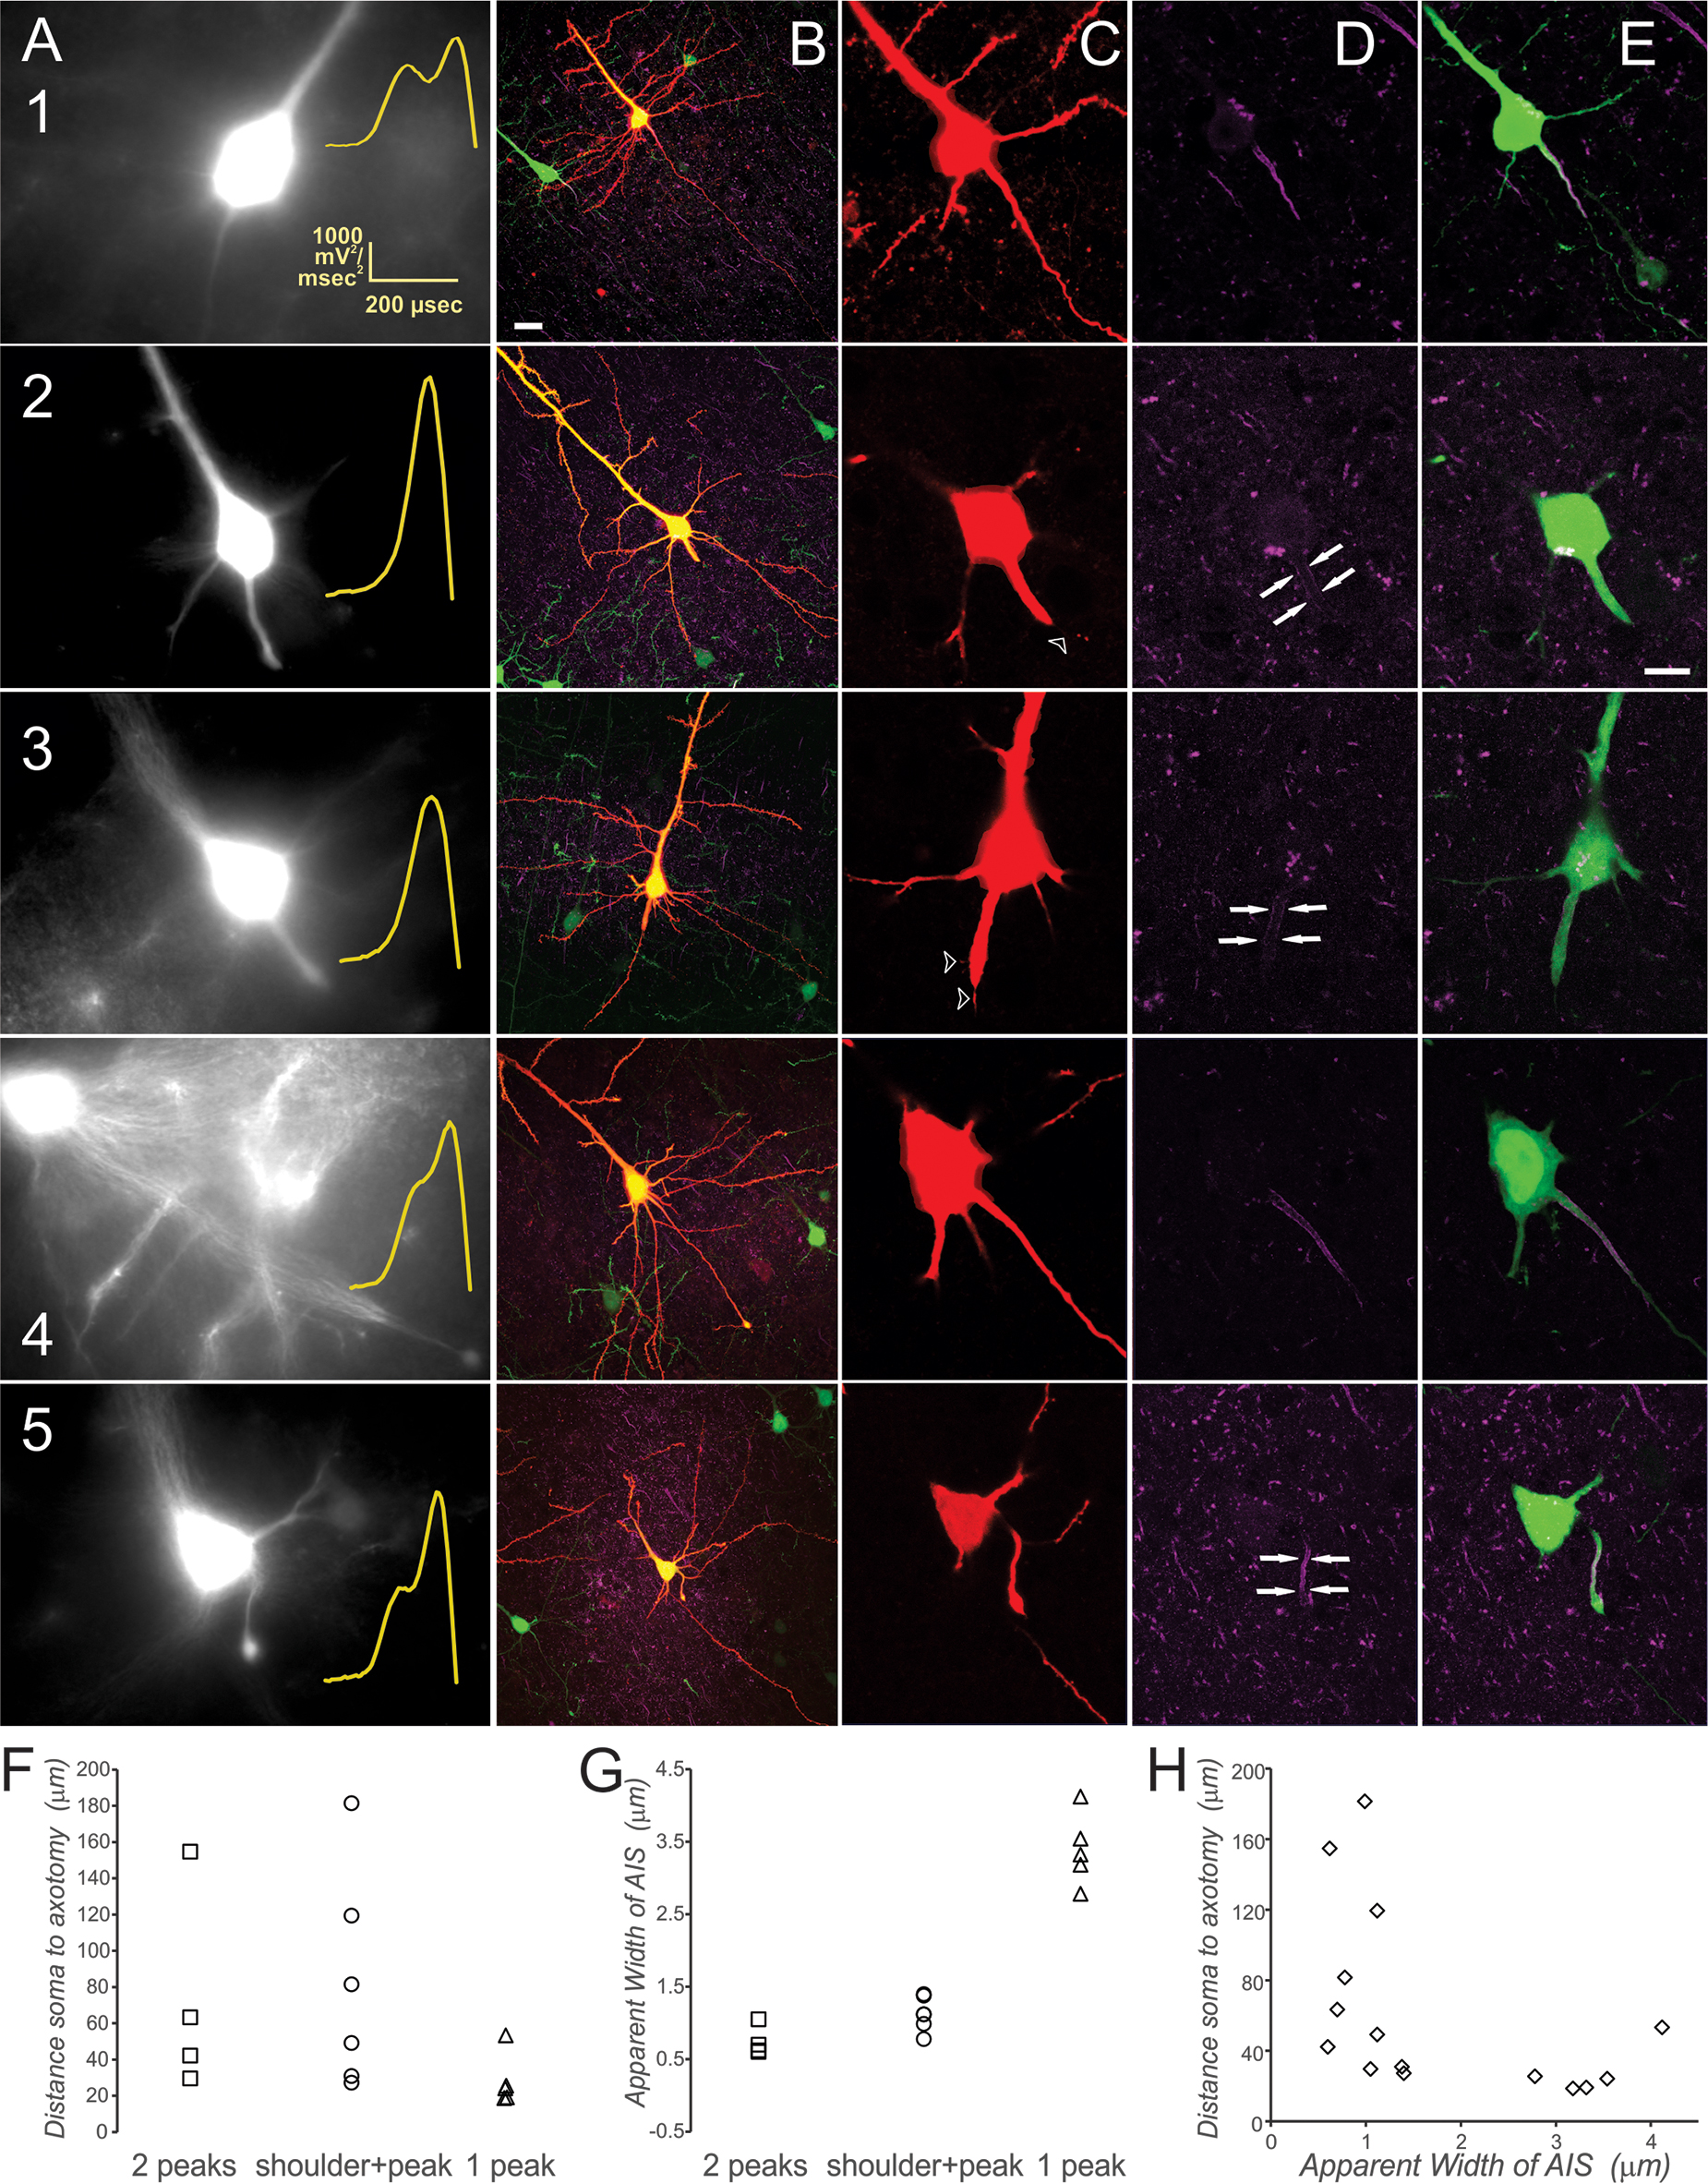
Axon initial segment (AIS) morphology and associated action potential (AP) upstroke kinetics for sham and axotomized mild traumatic brain injury (mTBI) neurons. Examples of one neuron recorded within the sham condition (1) three neurons axotomized near the soma (2, 3, 5), and one far from the soma (4). (
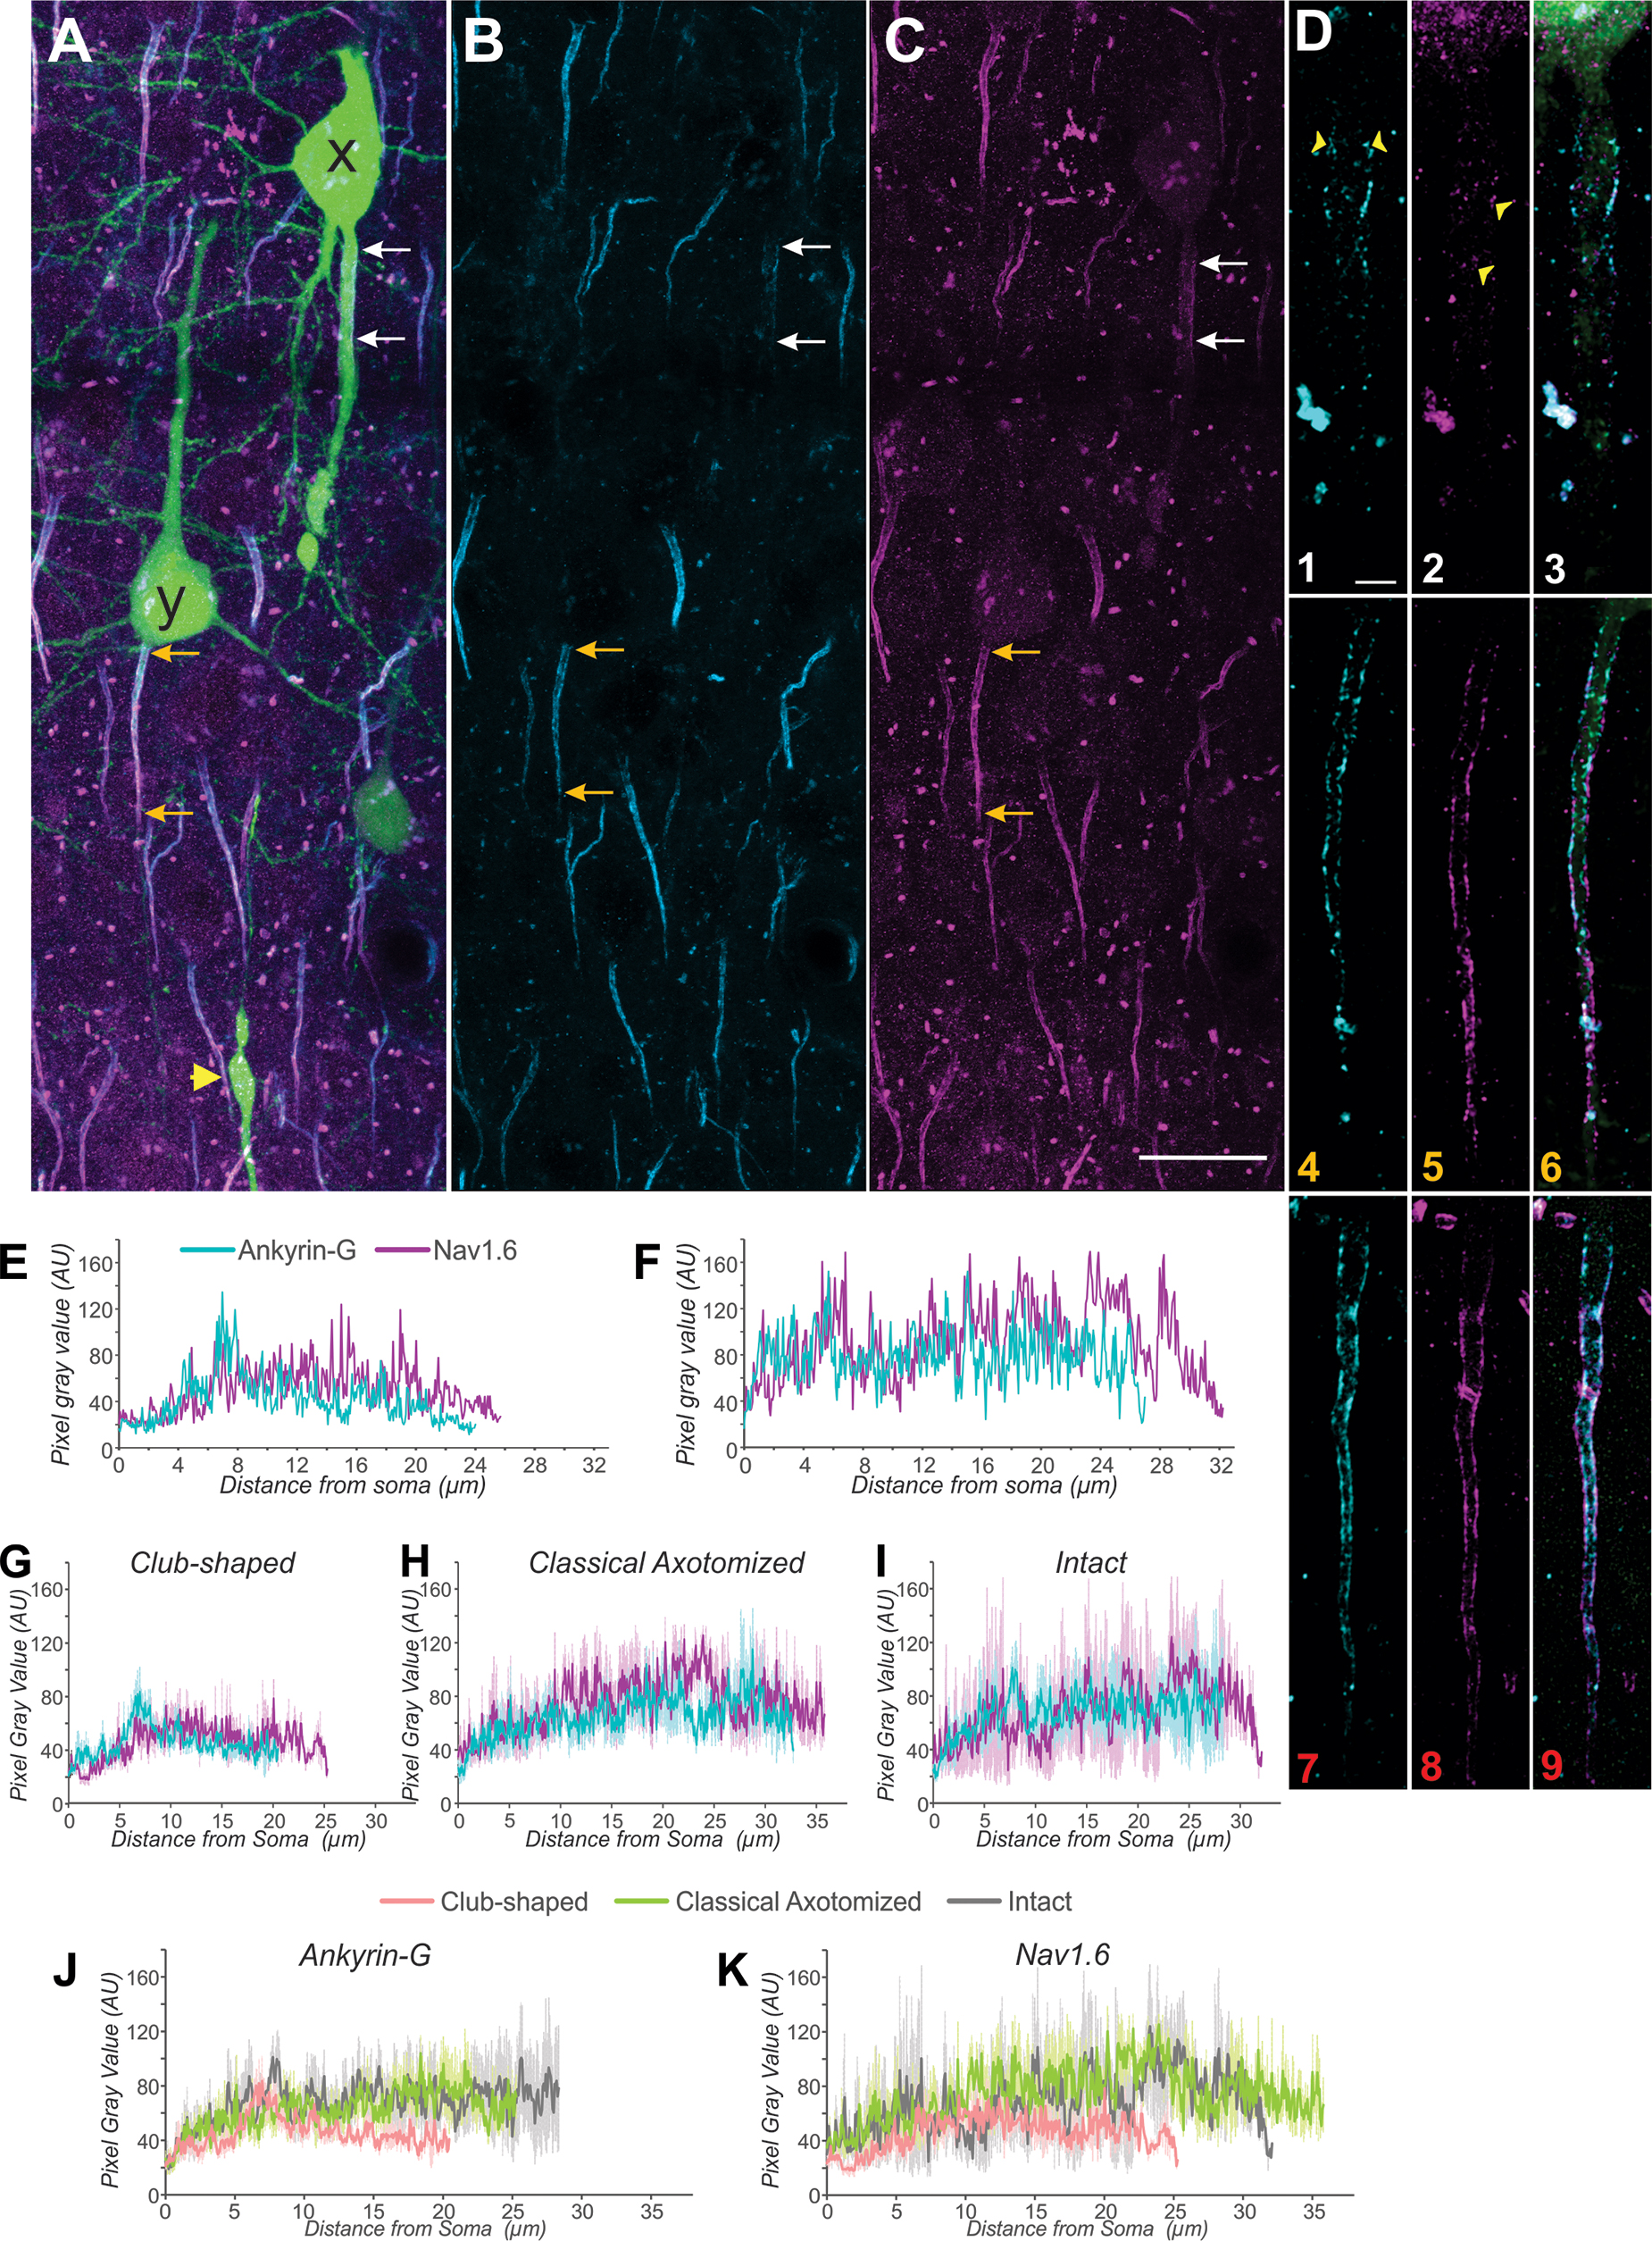
Traumatically axotomized layer 5 pyramidal neurons exhibiting axon initial segment (AIS)-regional distention stained less intensely for ankyrin-G and NaV1.6 compared with intact counterparts within the vicinity. (
To directly compare the potential effects of 2o peak number, we quantified measurements of distance from soma to axotomy and width of the AIS for 15 neurons within the AX1D group (Fig. 10F–H). We hypothesized that axotomy within the AIS might account for the single-peaked 2o, while more distant axotomy might allow for a double-peaked 2o within the AX1D subject group. Indeed, all of the single-peaked AX1D neurons were axotomized in the vicinity of the soma (Fig. 10F). Some of the double-peaked AX1D neurons, however, were axotomized within the AIS and 40 μm or less from the soma (Fig. 10F). This result thus suggests that intracellular signaling cascades rather than mechanical disruption per se affect that ability of the AIS to generate an AP after trauma.
The apparent width of the AIS was measured 30 μm from the soma for neurons axotomized beyond 30 μm, while for those axotomized within 30 μm of the soma, the apparent width was measured at its widest point along the axon excluding the retraction bulb (Fig. 10G). The single-peaked 2o neurons had a significantly wider AIS compared with the double-peaked and shoulder+peak neurons (ANOVA, Bonferroni post-hoc, p < 0.05). The apparent width of the AIS was not significantly correlated with the distance from soma to axotomy (Fig. 10H).
Morphologically altered axons are associated with reduced ankyrin-G and Nav1.6 staining
Within the morphological subclass corresponding to neurons manifesting a single peak, we sought to correlate the diminished staining intensity of ankyrin-G to the AIS-regional structure of NaV1.6 channels. To this end, we imaged ankyrin-G and NaV1.6 simultaneously within animals processed for standard immunohistochemistry one day after injury. We found that both protein species stain less intensely at the AIS in the morphological subclass corresponding to single-peaked neurons compared with intact neurons within the vicinity (Fig. 11).
We next employed lattice structured illumination microscopy to resolve the AIS-regional fine-scale organization of these protein species beyond the diffraction barrier of conventional confocal microscopy. This technique allowed the discernment of apparent fragmentation of the architecture of ankyrin-G within an injured neuron of the morphological subclass corresponding to neurons manifesting a single peak (Fig. 11D1). Simultaneously, the puncta representing conglomerations of NaV1.6 channels were decreased in apparent area and intensity (Fig. 11D2). These findings were consistent across neurons manifesting the distended club-shaped axon indicative of those with one 2o peak (Fig. 11G). Both axotomized without the club shape and intact neurons showed more intense staining for these markers and a greater length of staining (Fig. 11 G-K).
These experiments constitute evidence that neurons of this morphological subclass represent neurons that have sustained an especially profound form of axonal injury.
In the same population of neurons shown in Fig. 11, we analyzed the distance from the soma to the start of ankyrin-G and Nav1.6 staining and the distance to the termination of staining (Supplementary Fig. 4). While there was no significance difference between club-shaped, classical axotomized and intact groups for the distance from soma to ankyrin-G start, there was a significance difference from the soma to the ankyrin-G termination of staining for the club-shaped compared with both the classical axotomized and the intact groups (ANOVA, Bonferroni post-hoc, p < 0.05). There was no significant difference in either distance for the Nav1.6 staining (Supplementary Fig. 4).
Loss or reduction of the AIS 2o peak after mTBI is not observed in CypDKO mice
We previously found that aberrations of intrinsic cellular and membrane properties were prevented or ameliorated when experiments were conducted on brains extracted from CypDKO mice subjected to the equivalent concussive TBI. 31 Here, we examined whether CypDKO might mitigate trauma-induced effects on AIS- and soma-regional voltage acceleration. Within CypDKO mice, we found that even when axotomy occurred just proximal to the soma (not shown), the AP 2o still manifested double peaks, or in a few cases, a shoulder+peak (Fig. 12). Single-peaked 2o were not observed in any neurons from CypDKO mice. In fact, the overall shape of the 2o was fairly similar in axotomized and intact groups compared with the shams (Fig. 12A, also compared with WT shown in Fig. 7).

Measures in CypDKO tissue. (
The measure allowing identification of the shoulder+peak 2o neurons (slope from AIS peak to midpoint between the peaks) reveals only four neurons with positive slopes measured from the AIS peak to the midpoint between the AIS and somatic peaks (Fig. 12C). Among those four shoulder+peak CypDKO neurons, only two fell just below the 2.25 threshold on the LSdiff measure (Fig. 12D). Thus, CypDKO was associated with a striking amelioration of trauma-induced perturbation of AP upstroke kinetics (compare Figs: 7B,A and 12A,B; 4 and 12D; 6 and 12C).
Neuronal excitability and the distance between AIS and somatic activation zones is altered after TBI in CypDKO compared with WT
To compare further between WT and CypDKO on a series of measures (Fig. 13), two-way ANOVAs with Bonferroni post-hoc tests were performed, with the main effects listed in Table 2. For the number of cells in each group, see Table 2. For the post-hoc interactions between subject group and the experimental conditions of WT or CypDKO, significance is shown in Fig. 13, with * denoting p < 0.05.
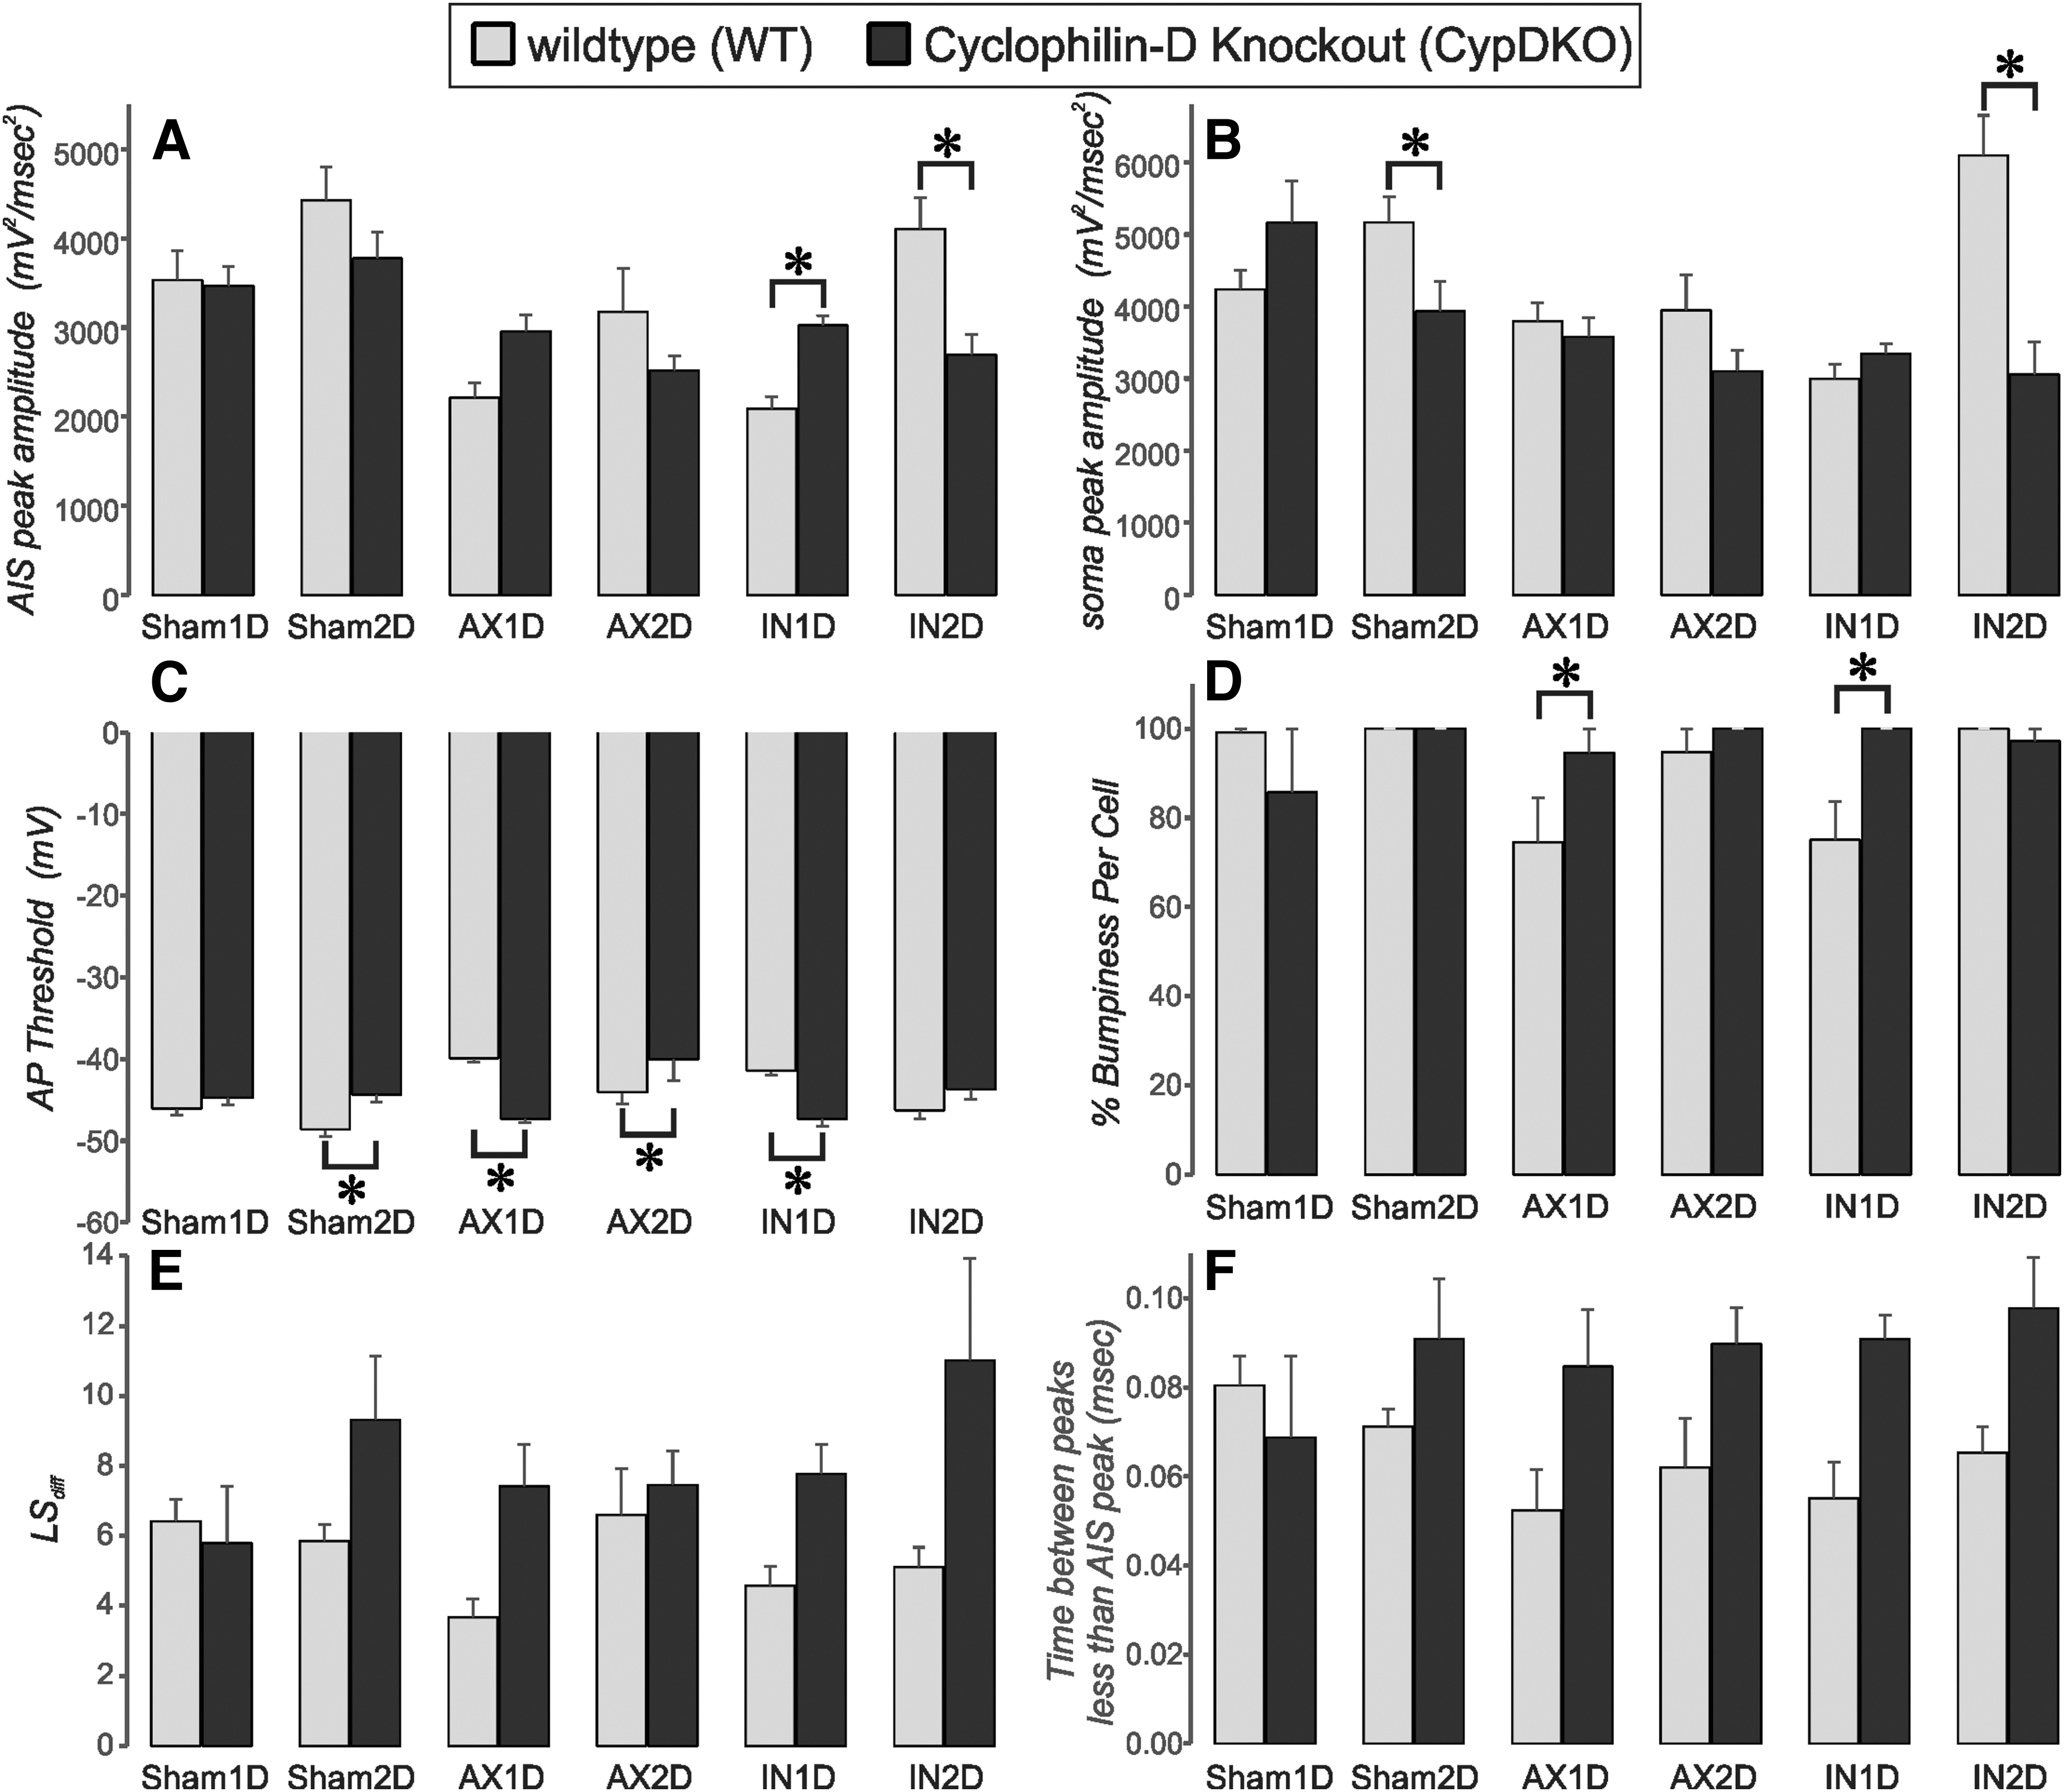
Comparison between WT and CypDKO experimental conditions for all subject groups. WT is in lighter gray and CypDKO is in darker gray. Subject groups are marked at the bottom of the columns. For each measure, a two-way analysis of variance was performed. See Table 2 for subject numbers and p values for subject group, experimental condition, and interactions. When a significant interaction between subject group and experimental condition was present, a Bonferroni post-hoc analysis was performed, with significant effects indicated here by an *.
List of p Values for the Main Effects of a Two-Way Analysis of Variance for All Measures Shown in Figure 13
Letter to the left of measure name is consistent with that shown in Figure 13. Significant effects of a two-way analysis of variance of subject group (sham1D, sham2D, AX1D, AX2D, IN1D, IN2D) and experimental condition (WT vs. CypDKO) shown with * (p < 0.05). Subject numbers are shown as
For the AIS peak amplitude there was a significant effect of subject group, with AX1D and IN1D being significantly lower than Sham1D. The AIS peak for AX2D as well as AX1D and IN1D was significantly lower than Sham2D. For the IN2D group, the AIS peak was significantly different from AX1D and IN1D.
The interaction between subject group and experimental condition was also significant, with the post-hoc test showing the following: The reduced 2o for the AIS peak was recovered in the CypDKO mice only for the IN1D group. Surprisingly, while the AIS peak was increased in CypDKO compared with WT for the IN1D neurons, it was significantly decreased in CypDKO compared with WT for the IN2D neurons. It appears that restricting the assembly of the mitochondrial pore transition complex within CypDKO mice may be associated with non-linear effects on neuronal excitability. 31
For the AP acceleration at the soma (Fig. 13B), there was a significant effect of subject group, experimental condition, and the interaction between these two. The IN1D group had a significantly smaller soma-regional peak 2o compared with the Sham1D and Sham2D groups. The IN2D group was significantly different from AX1D, AX2D, and IN1D groups. For the interaction between subject group and experimental condition, surprisingly there was an effect on the Sham2D neurons, with a reduction in the somatic 2o peak in the CypDKO condition compared with WT. There was also a reduction in this peak under CypDKO condition for the IN2D group.
For the AP threshold (Fig. 13C), there was a significant effect of subject group, no effect of experimental condition, but a significant interaction of subject group and experimental condition. The AX2D group had a significantly more depolarized AP threshold compared with the Sham2D group. For the interaction, the CypDKO condition ameliorated the more depolarized AP threshold for both AX1D and IN1D groups but exacerbated it in the AX2D group and produced a more depolarized AP threshold in the Sham2D group. The overall result of the CypDKO condition was a very similar AP threshold level between subject groups.
In previous examinations of the 2o of the AP upstroke, authors have characterized the shoulder+peak 2o waveform as possessing a range of bumpiness, depending on whether the slope of the 2o passes through zero. 35 The phenomenon of less bumpiness was attributed to a closer relative location of the AIS and somatic AP initiation zones. 35 Here we made this measurement explicitly for the 2o of each AP, then calculated the percent of APs per cell that were bumpy, which we defined as any 2o waveform in which the intervening slope between AIS and somatic peaks passed through zero. This measure was then averaged among neurons of each subject groups (Fig. 13D).
For some groups, every single 2o slope passed through zero, thus putting the average at 100% without error (WT: Sham1D, Sham2D, and IN2D; CypDKO: Sham2D, AX2D, and IN1D). The three experimental groups of the WT condition most affected by TBI (AX1D, AX2D, and IN1D) all contained some non-bumpy 2o neurons. The two-way ANOVA showed no significant effect of subject group or of experimental condition, but did show an interaction between these two, with a significant increase in bumpiness for both AX1D and IN1D groups. Thus, within these groups the CypDKO condition gave rise to enhanced bumpiness, presumably because of a greater spatial separation between AIS and soma.
While the bumpiness quotient can only be measured in double-peaked 2o, the LSdiff measure can determine how close the 2o is to a single peak for all 2o. This metric provided a more inclusive measurement of bumpiness (Fig. 13E). We found a threshold level at 2.25, where lower values were typical for single-peaked 2o, and higher values were typical for double-peaked 2o (Figs. 1F, 4). A one-way ANOVA with Bonferroni post-hoc for the WT condition showed a significantly lower LSdiff for the AX1D group compared with the Sham1D. This result was ameliorated in the CypDKO condition.
The two-way ANOVA considering both experimental conditions showed no significant effect of subject group but a significant effect of experimental condition, with an increase in LSdiff under the condition of CypDKO. There was a trend toward an interaction between subject group and experimental condition.
The examination of the CypDKO 2o suggested that under this condition, there were more double-peaked 2o and that the minimum between the peaks was lower than for the WT condition. We evaluated this by measuring the duration of time between the two peaks (only for double-peaked or shoulder+peak 2o) during which the value was less than that of the AIS peak (Fig. 13F).
Here, there was a significant effect of experimental condition. Relative to the WT condition, CypDKO produced 2o with greater durations of time during which the 2o was less than that of the AIS peak. This result suggests that the current producing the AP at the AIS decays to a greater degree before the generation of the current producing the AP at the soma. Thus, this result supports the bumpiness quotient result in suggesting that the AIS and soma AP initiation zones are further apart in the CypDKO condition compared with WT.
Discussion
The results of the present study represent a refinement in the use of a detailed, quantitative analysis of AP upstroke kinetics as an assay of the functional integrity of the AIS. Although the present study exploited this assay in the context of a well-characterized model of concussive TBI, we propose its broad utility to shed light on the pathobiological mechanisms underpinning neurological disease in general. 36 Utility could evolve in the form of simultaneous high-resolution patch-clamp recordings of APs and the monitoring of sodium currents 37 and, ultimately, potassium currents by means of increasingly sophisticated ionic indicators. In addition, simultaneous monitoring of the temporal jitter of APs at the nodes of Ranvier within intact neurons via voltage-sensitive dyes could reveal trauma-induced distortion of the precision of AP transmission to the distal regions of the axon. 38
While past research had implicated the AIS as a locus of vulnerability to traumatic axotomy, the physiological consequences of this phenomenon remained unclear. By means of analysis of the 2o with respect to time of the membrane voltage during the AP upstroke within a subset of layer 5 pyramidal neurons, we were able to disentangle and rigorously quantify the relative contribution of the AIS and the soma to the AP upstroke.
Via this analysis, we discovered a subset of axotomized layer 5 pyramidal neurons that manifested a single peak corresponding in time to the second peak of neurons with double-peaked 2o, a result consistent with trauma-induced abolition of AIS function in these neurons. Our LSdiff measure distinguished this single-peaked group of neurons from the double-peaked group (Fig. 4). Moreover, we determined that there exists a continuum of trauma-induced, AIS-regional dysfunction, in which outright abolition of the AIS-regional peak represents one extreme, while the manifestation of two clearly appreciable peaks separated by a negative intervening slope represents the other. Bounded by these extremes exists a subset of both morphologically intact and axotomized neurons that manifest a biphasic waveform in which the AIS-regional portion melds into the soma-regional portion, a waveform we have classified as shoulder+peak (Fig. 6).
Post-hoc measurements of biocytin-filled, axotomized YFP+ layer 5 pyramidal neurons stained for the AIS scaffolding protein ankyrin-G revealed a lack of definite correlation between the site of emergence of axonal retraction bulbs and AIS-regional functional perturbation, because some neurons with bulbs at the AIS nevertheless manifested dual-peaked 2o waveforms (Fig. 10D 4).
There existed a subset of axotomized neurons one and two days after injury, however, in which the AIS appeared severely maimed, assuming a club-shaped, distended morphology (Fig. 10G). Neurons of this morphological subclass regularly emanated filipodia-like axonal sprouts that may reflect an attempt at post-traumatic axonal regeneration. This morphology corresponded to all axotomized neurons manifesting abolition of the AIS-regional contribution to the AP upstroke on 2o analysis. In addition, lattice structured illumination super-resolution microscopy revealed apparent fragmentation of ankyrin-G and smaller, dimmer conglomerations of NaV1.6 channels within this morphological subclass compared with intact neurons within the vicinity (Fig. 11F).
These findings are reminiscent of recently described white matter nodes void of NaV1.6 in proximity to axotomized neurons in a swine rotational acceleration model of concussion. 39 While numerous studies have employed stochastic optical reconstruction microscopy (STORM) and stimulated emission depletion (STED) methods of super-resolution microscopy to image the AIS, 40 –43 to our knowledge the present study is the first to image the AIS by means of lattice structured illumination microscopy.
What are the physiological consequences of such profound AIS injury? Among the subset of axotomized neurons, one day after injury, abolition of AIS-regional contribution to the AP upstroke correlated with electrophysiological perturbation across several metrics. Such neurons displayed a significantly depolarized AP threshold, a significantly reduced firing frequency at 200 pA, and a significantly lower F-I slope compared with dual-peaked and shoulder+peak counterparts (Fig. 9). Thus, this type of axotomy renders neurons significantly less excitable.
Because NaV1.6 is considered the cardinal sodium channel isoform governing AIS excitability, the consequences of trauma on the NaV1.2 isoform are worthy of investigation, especially as the NaV1.2 isoform seems capable of substituting for the function of NaV1.6 at the AIS subsequent to knock out of NaV1.6 in adult mice. 44 Because we did not encounter single-peaked neurons with the CypDKO cohort, CypD may protect against such catastrophic traumatic axotomy, and future experiments will probe for the presence of the morphological subclass corresponding to single-peaked neurons within injured CypDKO animals.
Finally, it is notable that CypDKO was associated with divergent physiological effects on neurons of the sham groups as a function of time. We speculate that this anomaly may be attributable to a homeostatic role of CypD in the maintenance of intrinsic neuronal properties within a target range in the face of surgery-induced inflammatory cascades. As CypD has been demonstrated to regulate calcium homeostasis within cardiac myocytes toward the support of cardiac tolerance to exercise, 45 it is conceivable that loss of this protein may disrupt neuronal compensatory mechanisms during the acute post-surgical epoch.
The lack of definite correlation between the site of emergence of axonal retraction bulbs and corresponding AIS functional perturbation may indicate that heterogeneity within the intracellular signaling cascades set into motion by concussive trauma drives the functional consequences at the AIS. Consistent with this notion, previous work has indicated that vibratome-induced axotomy even in the vicinity of the AIS does not give rise to aberration of AIS-regional function. 46 Thus, transection per se does not seem to drive AIS functional pathology, and neurons axotomized in this manner do not manifest any detectable aberration of intrinsic properties. 47
Expanding on this theme, here we show that restriction of the formation of the mitochondrial pore transition complex within CypDKO mice ameliorates many aspects of the trauma-induced AIS-regional functional perturbation in comparison with the Thy-1 YFP-H (WT) condition. In particular, the reduction of the AIS peak of the 2o in AX1D and IN1D (Fig. 8A) is partially ameliorated (Fig 13A). Interestingly, the decrease of the somatic peak for AX1D, AX2D, and IN1D (Fig. 8B) is not improved in the CypDKO mice (Fig. 13B).
These results inform the ongoing theoretical question of the relation between neuronal excitability and the distance relative to the soma of AIS emergence. 48 Seminal work has demonstrated that global enhancement of excitability by administration of high extracellular [K+] reliably induces translocation of the AIS away from the soma and associated homeostatic decrease in excitability within hippocampal neurons in vitro. 49,50 The AIS emerges further from the soma in layer 5 pyramidal neurons with axon-bearing dendrites, however, and these neurons possess a corresponding hyperpolarized AP threshold compared with neurons with axons emerging from the soma. 51
Thus, the relation between AIS start position and excitability seems to be non-linear, arising in dependence on a diversity of variables. One in silico study 52 using simplified models of neurons of a range of sizes and elaborating a varying quantity of primary dendrites with and without spines implicated larger surface area and more dense dendritic spines as crucial variables. In particular, within larger neurons more densely studded by dendritic spines—consistent with the neurons under study in the present communication—distal translocation of the AIS was predicted to enhance excitability, a relation attributed to the influence of dendritic architecture on AIS-regional values of resistance and the membrane time constant. Further, increased electrotonic isolation of the AIS from the soma may support enhanced excitability by reducing the pool of inactivated voltage-gated sodium channels. 11
The depolarized AP threshold encountered in AX1D and IN1D groups (Fig. 8C) was ameliorated within the CypDKO, although not in the AX2D group (Fig. 13C). Our metric of percent bumpiness may reflect the relative separation of the AIS and somatic activation zones. 35 In the CypDKO mice, this measure more closely approached control levels for AX1D and IN1D groups (Fig. 13D). Similarly, the time between peaks during which the 2o is less than the AIS peak value may reflect the distance between the AIS and somatic activation zones, and that time was increased in the CypDKO mice (Fig. 13F). Within these same groups, a more hyperpolarized AP threshold was recorded in the CypDKO mice. Therefore, the increased separation of AIS and somatic activation zones as assessed by a surrogate measure correlates with enhanced excitability under these conditions.
Induction of ischemia via the middle cerebral artery occlusion model of ischemic stroke has been shown to give rise to the calpain-mediated cleavage of ankyrin-G and the degradation of the AIS. 53 Critically, this ischemia-induced disruption of AIS integrity led to the loss of neuronal polarity, the maintenance of which depends on the presence of ankyrin-G. 54 Moreover, calpain-mediated proteolysis of voltage-gated sodium channels, including NaV1.25 and NaV1.63, has been demonstrated in multiple models of traumatic injury to the nervous system.
Thus, in the present study, abolition of the AIS-regional 2o peak within a subset of axotomized YFP+, layer 5 pyramidal neurons may arise secondary to calpain-induced proteolysis of ankyrin-G and consequent dissolution of the AIS and loss of neuronal polarity. It is conceivable that such neurons may attempt to mount a regenerative attempt by transforming a dendrite into an axon during the epoch of acute recovery after trauma. 55 Alternatively, a reparative attempt could be mounted at the site of the dissolved AIS, thus explaining the emergence of sprouts from the stumps of the former location of the AIS (Fig 10C2-3).
Because these pathobiological cascades arise in dependence on calcium, knocking out CypD may support the capacity of AIS-resident mitochondria to buffer the intracellular calcium that permeates neurons haphazardly secondary to trauma and thus support AIS functional integrity. It is also possible that the CypDKO might ameliorate the TBI-induced dysfunction by additional calcium-regulation mechanisms not associated with mitochondria. Because AIS homeostatic plasticity in the form of morphological remodeling itself arises in dependence on calcium, 14 AIS dissolution secondary to neurological insult such as ischemia and concussive trauma may represent the most extreme manifestation of this cell-intrinsic mechanism. 56
Whether the CypDKO might also ameliorate cognitive dysfunction has not yet been demonstrated within the cFPI model. Behavioral and cognitive function under hypoxic conditions is superior in the CypDKO mice compared with WT, 57 but different results have been obtained after head injury. In a more severe TBI, using a controlled cortical impact model in which cortical tissue is lost, there was a greater sparing of tissue with the same injury in the CypDKO mice. 8 The CypDKO mice with injury, however, performed worse than the WT injured mice. 8 In our mTBI cFPI model, there is no loss of brain tissue. Whether cFPI-induced cognitive deficits might be repaired by this restoration of axon function in the CypDKO mice requires future exploration.
Given the critical role of the AIS in tuning neuronal excitability toward the maintenance of a target range of output in the face of fluctuations in network excitatory-inhibitory balance, the effects of trauma-induced AIS dysfunction on neuronal plasticity represents a fascinating topic of future inquiry. Of particular interest are intact neurons, some minority of which we have shown manifest significant AIS-regional functional perturbation (Figs. 3–8). At one day after mTBI, we have demonstrated that based on intrinsic properties, relative synaptic input, and, presently, based on AIS function, intact neurons are functionally similar to their axotomized counterparts. 32,33 Because they are intact, these neurons maintain their contribution to the dynamics of the neocortical network, suggesting that the AIS dysfunction one day after injury may be amplified in the form of altered connections between these intact but functionally injured neurons.
In addition, the emerging recognition of the capability of axons to independently modulate the input-output dynamics of neuronal signal transmission, 58,59 effects on interaxonal ephaptic and electrical coupling, and effects on activity-induced enhancement of axonal caliber and bouton area 60 may represent fine-scale consequences of trauma on global information synthesis. Overall, potentially via multiple mechanisms, the dysfunction of the AIS likely deranges the tight correlation between neuronal input and consequent output—in other words, the precision of AP firing 61 —and such disruption during the post-traumatic epoch may underlie the altered sensory perception that can arise in patients after concussive TBI. 62
Might trauma disrupt the capability of these neurons to modulate excitability toward the maintenance of network homeostasis? If trauma can abrogate such a critical mechanism of plasticity, it is conceivable that previously manageable instances of stress could be rendered pathological within neuronal networks, at least during the first days after concussive insult. In support of the plausibility of this notion, TBI—including the mild/concussive form—is a documented risk factor for the emergence of post-traumatic stress disorder. 63
Finally, it must be considered that the impairment of AIS function especially within intact neurons may represent a neuroprotective mechanism to limit the spread of aberrant excitatory activity in the acute phase after trauma. Even with mild TBI, interictal-like activity can be observed early after injury. 32
Notably, all YFP+ layer 5 pyramidal neurons targeted within the present study belonged to the Type A subclass of layer 5 pyramidal neurons. This scheme of classification seeks to assign layer 5 pyramidal neurons to one of two subclasses (A or B) based on the presence of an Ih-mediated depolarizing voltage sag in response to hyperpolarizing current injection and the presence of a depolarizing afterpotential on cessation of hyperpolarizing current injection (Fig. S1). 64,65
Critically, these physiological metrics have been shown to correlate reliably to anatomical and morphological differences between these cardinal subtypes. In particular, type A neurons tend to elaborate wider and more geometrically complex apical dendritic arbors, to put forth extra-telencephalic axons, and to receive preferential inhibitory tone from both somatostatin- 66 and parvalbumin-expressing 67 inhibitory interneurons within the neocortex.
This result augments past work demonstrating that virtually all YFP+ neurons within the Thy1-YFPH strain elaborate extratelencephalic axons. 68 Thus, a potentially fruitful topic of future inquiry concerns the relative vulnerability to traumatic axotomy between type A and type B layer 5 pyramidal neurons. Might extratelencephalic (type A) layer 5 pyramidal neurons be more susceptible to axotomy than their corticocortical (type B) counterparts? Such a difference, if present, might lead to novel insights concerning the cellular and physiological properties that predispose neurons to axonal injury.
Footnotes
Acknowledgments
We thank John Greer, MD, PhD for comments on the manuscript. We thank Michael Forte, PhD who supplied the cyclophilin-D knockout strain and John Povlishock, PhD for making those mice available to us. We thank Jeff Dupree, PhD for graciously lending us the primary antibody against NaV1.6. We thank Tytus Bernas, PhD for his assistance in the acquisition and processing of lattice structured illumination microscopy images. We thank Kelly Speiran for technical help.
Authors' Contributions
The study was primarily designed by KJ. AH and JS made major contributions to data collection, while KJ also contributed to data collection. Data analysis was performed by AH, KJ and JS. The manuscript was written by AH and edited by KJ and JS.
This work was supported by the National Institutes of Health R01 NS077675.
Author Disclosure Statement
The authors declare that the research was conducted in the absence of any commercial or financial relationships that could be construed as a potential conflict of interest.
Note that this manuscript was previously submitted as a preprint to bioRxiv at
References
Supplementary Material
Please find the following supplemental material available below.
For Open Access articles published under a Creative Commons License, all supplemental material carries the same license as the article it is associated with.
For non-Open Access articles published, all supplemental material carries a non-exclusive license, and permission requests for re-use of supplemental material or any part of supplemental material shall be sent directly to the copyright owner as specified in the copyright notice associated with the article.
