




Abstract
To date, no drug therapy has shown significant efficacy in improving functional outcomes in patients with acute spinal cord injury (SCI). Riluzole is an approved benzothiazole sodium channel blocker to attenuate neurodegeneration in amyotrophic lateral sclerosis (ALS) and is of interest for neuroprotection in SCI. In a Phase I clinical trial (
Introduction
Currently available treatments for spinal cord injury (SCI) care are still limited. Despite the devastating impact of SCI at an individual and societal level, advances in establishing a successful treatment for SCI have been minimal. Current research focuses on developing medications and bioengineered strategies that may preserve the remaining function of nerves after injury and promote cell regeneration. 1 Current acute spinal cord injury treatment focuses on early surgical intervention, hemodynamic management, and rehabilitation. 2,3 These guidelines include restoration of spinal stability, decompression of the spinal cord, and cardiopulmonary and metabolic support of the patient. Immobilization of the spine is a crucial first step of treatment. Surgery is often needed to remove bone fragments, foreign objects, herniated disks, or fractured vertebrae that may compress the spine. 4 Once the initial injury condition is stabilized, care is taken to prevent additional complications, including muscle contractures, pressure ulcers, neurogenic bladder dysfunctions, respiratory infections, and deep vein thrombosis. During the intermediate and chronic phases, SCI patients participate in rehabilitation therapy to maintain and strengthen existing muscle functions, refine motor skills, and learn adaptive techniques for normal daily tasks.
At present, no pharmacological treatment or regenerative therapy has become widely adopted, although multiple pharmacological agents were investigated in trials during 1984-2014 as reviewed by Badhiwala and colleagues in 2018. 4 These tested agents include methylprednisolone sodium succinate (1984-2001), GM1 ganglioside, (1991-2001), thyroid releasing hormone (1995), nimodipine (2000), gacyclidine (2003), and minocycline (2012). In light of this therapeutic gap, effective therapeutics are still being ardently researched by clinicians and researchers in the SCI field.
Riluzole, a benzothiazole anticonvulsant sodium channel blocker, showed neuroprotective potential to preserve nerve cells and facilitate functional recovery after SCI. 5,6 Riluzole was approved as the first treatment for amyotrophic lateral sclerosis (ALS) in 1995 by the U.S. Food and Drug Administration (FDA), exerting its effect by blocking voltage-gated sodium channels, and preventing exaggerated Ca2+ influx. 7,8 Consequently, riluzole inhibits excess glutamate release, preventing excess glutamate receptor activity that damages neurons. 9 However, the clinical benefits in ALS have been modest.
In the acute phase of SCI, there is marked increase in the intracellular influx of sodium through voltage-gated Na+ channels. This allows an excess influx of Ca2+, which eventually culminates in extensive cell death. 9
Based on known mechanisms of action, riluzole was tested in pre-clinical SCI rodent models, demonstrating a reduction in neurological tissue damage and improvements in functional outcomes. 10,11 Therefore, a Phase I clinical trial (NCT00876889) was conducted in acute SCI and completed in 2011. A 2-week regimen of riluzole was shown to be safe and potentially efficacious in SCI patients at the same dose regimen of 50 mg twice daily (BID) approved for ALS. 12
The PK of riluzole have been established in healthy individuals, young and old, as well as in patients with ALS and pediatric patients with spinal muscular atrophy. Riluzole is absorbed rapidly orally, with 96% protein binding in circulation. Riluzole has been shown to readily cross the blood–brain and blood–spinal cord barrier with extensive tissue distribution indicated by large volume of distribution (approximately 3.4 L/kg). Riluzole is metabolized extensively in the liver by CYP1A2, followed by glucuronidation and renal elimination, with an average half-life of 12 h. 13 -15
The acute and progressive nature of traumatic SCI and the complexity of secondary injury processes can alter the pharmacokinetic (PK) of therapeutics. 16 The PK investigation of riluzole was conducted as a component of the Phase I clinical trial to monitor the plasma peak and trough concentrations on Day 3 (D3) and Day 14 (D14) of the 2-week treatment duration, serving as the first PK evaluation of riluzole in the SCI population. The study documents lower peak and trough plasma concentrations achieved on the same dose basis in D14 as compared with those in D3 during the treatment, resulting from the time-varying PK parameters of higher clearance (CL) and larger volume of distribution (V) of D14 post-SCI in reference to those of D3. 16
The impaired hepatic metabolic CL shortly after the early acute phase (≤ 48 h) in D3 due to SCI may account for the lower CL that becomes less pronounced later in subacute phase. 17 Similarly, the time-varying V may be secondary to the temporal changes in the extent of protein binding.
Therefore, for the Phase II/III, multi-center, randomized, placebo-controlled, double-blinded Riluzole in Spinal Cord Injury Study (RISCIS) in 2013-2021 (NCT01597518), a PK Sub-study was designed to study the PK comprehensively to better characterize the time-varying kinetics of the PK parameters and develop a model to capture the unique characteristics for future projection in dosing individual patients. In addition, the pharmacodynamics (PD) of the potential neuroprotective therapy of riluzole was monitored, specifically with the standard clinical outcomes in motor function at injury and 3-month and 6-month follow-up. In addition, the axonal injury biomarker, pNF-H, was measured at injury, during the 2-week treatment and post-treatment follow-ups at 3 months and 6 months. The PK and PD data enabled us to perform the PK modeling and PK/PD correlations to identify potential effective exposure of riluzole for the observed PD outcomes.
The ultimate goals of the Phase-I investigation and RISCIS-PK study, a sub-study of the Phase II/III RISCIS randomized controlled trial, were to establish the rational, model-informed, and PK-guided medication regimen design that will enable the optimal, effective treatment with time-varying adjustments for individual SCI patients in the clinical setting.
Methods
Clinical PK of riluzole in patients with acute SCI
Treatment with riluzole (Rilutek®, Sanofi, USA) or placebo tablet (Bayview Pharmacy, Saunderstown, RI)
In Phase I, patients received 50-mg tablets by oral administration or crushed and suspended for nasogastric (NG) administration, BID for the 2-week course of treatment. The dose was selected based on the FDA-approved strength and established efficacy and safety for ALS treatment. 18 In the Phase II/III trial, participants received a 100-mg loading dose BID on D1, followed by 50 mg BID for the remaining 13 days. Riluzole or placebo tablet was taken at least an hour before, or 2 h after, a meal to avoid any potential food-related decrease in bioavailability.
Clinical trial PK study design
Both trials were in compliance with Good Clinical Practices, with ethical Institutional Review Board approvals from the individual participating institutions and informed consents acquired from all patients. 19,20 The sites funded by the Department of Defense received Human Research Protection Office approval.
The Phase I clinical trial (NCT00876889) was a multi-site, single-arm active treatment pilot trial completed in 2011, investigating the safety and PK of riluzole in 36 SCI patients meeting the enrollment goal. The Phase II/III RISCIS trial, (NCT01597518) was a multi-center, randomized, placebo-controlled, double-blinded trial to evaluate the efficacy and safety of riluzole with a target enrollment of 351 patients, which was prematurely concluded in 2021 due to the COVID-19 pandemic, with only 193 patients enrolled and completed. The PK Sub-study also suffered from the premature conclusion, with 32 patients completed out of the target of 50 patients.
The exclusion criteria for both studies included: hypersensitivity to riluzole; penetrating injury; concomitant head injury defined as Glasgow Coma Scale score <14; pre-existing neurologic or mental disorder; history of chemical substance dependency; liver or kidney diseases; pregnancy; prisoner; and participation in another clinical trial. The medication log for each patient was obtained to screen for potential concomitant drug–drug interactions.
PK plasma sampling schedule
In the Phase I study, plasma samples were collected 1 h pre-dose and within 1 to 2 h post-dose on the D3 and D14. To supplement the observation of varying PK from the Phase I study, additional samples on the 7th and 10th days (D7 and D10, respectively) were collected. Specifically, plasma sampling was performed immediately before dose, and approximately 3 h post-dose on the D3, D7, D10, and D14. Recognizing different sampling times between the two studies, actual dosing and sampling times for each study were recorded and applied in our data file for PK analysis and model development.
SCI patients often experience injury-related complications that require administration of several concomitant medications. Only non-contraindicated concomitant medications were administered and recorded.
Bioanalysis of riluzole concentrations
Riluzole concentrations were quantified using the previously developed and validated liquid chromatography–tandem mass spectrometry (LC-MS/MS) assay method. 21 Riluzole and its stable isotope labeled internal standard (IS) [ 13 C, 15 N2]-riluzole were isolated from plasma by liquid–liquid extraction using ethyl acetate. Riluzole and IS elution at 1.9 min was achieved using 0.4 mL/min isocratic flow through a Waters AQUITY UPLC BEH C18 column (2.1 × 50 mm, 1.7-μm particle size), with the mobile phase composed of 20% acetonitrile (ACN) and 80% methanol (MeOH): Water mixture (70:30, v/v) containing 0.1% formic acid (FA). Riluzole (m/z 235 → 166) and IS (m/z 238 → 169) were monitored by electrospray ionization using multiple reaction monitoring in a positive mode on QTRAP 3200 System (AB SCIEX, Framingham, MA, USA). The assay had linearity established at 0.5 (lower limit of quantification)-800 ng/ mL, and intra-day and inter-day accuracy and precision of riluzole assay within 10%, meeting the requirements of FDA guidance. 22 The matrix effect of human plasma was 97.5-100.6% for low (1 ng/ mL), medium (100 ng/ mL), and high (800 ng/ mL) quality control (QC) samples of riluzole.
PD and toxicodynamic observations
The motor and sensory assessments were conducted at individual clinical sites at admission and at 3-month and 6-month follow-ups to evaluate clinical outcomes (CO) of potential treatment efficacy. The assessment of potential liver toxicity using toxicodynamic (TD) measurements, such as aspartate aminotransferase (AST), and alanine aminotransferase (ALT), was also executed during the 2-week regimen period. These data sets were collected for PK/PD and TK/TD correlations.
PK analysis with individual and pop PK modeling, PK parameters derivation
PK analysis was executed in Phoenix® NLMETM, version 8.2 (Certara L.P. Pharsight, St. Louis, MO, USA). To obtain cumulative AUCs for the treatment duration, patient profiles were simulated using individual parameters. The output of the simulation gave cumulative AUC for every time-point. Then, the time was filtered to obtain AUCs from D0 to D3, D7, D10, or D14.
The population analysis of Phase I data provided reasonable initial estimates and structural modeling for the final model that included both Phase I and Phase II/III data. 23 Although the PK parameters were estimated using only two concentration-time data on each sampling day, potentially limiting the structural model to having only one compartment, the model generated can still serve our purpose of describing the dynamic PK changes that took place throughout the 14-day treatment period. 16 A naïve-pooled method was used to confirm the initial estimates and structural model using Akaike information criterion (AIC), an extension of the minus twice the log likelihood, as the selection criterion. AIC differences of ≥4 were regarded as significant in optimizing model selection. Nonlinear mixed-effects modeling was performed using a first-order conditional estimation–extended least squares approach to generate the model. The inter-patient variability of estimated parameters was assumed to follow a normal distribution, with mean = 0 and variance = ω 2 . Residual variability, referring to unexplained intra-patient variability, experimental error, and model misspecification, was estimated using additive, multiplicative, and combined residual models, respectively.
Model selection was informed by evaluating goodness-of-fit criteria, including AIC, precision and scientific plausibility of parameter estimates, and visual inspection of graphical goodness-of-fit plots. Internal validation was performed by nonparametric bootstrapping without stratification (n = 1000).
One-compartment models incorporating empirical equations for time-varying CL and V were established to describe the change in PK of riluzole over the 2-week time period of the treatment. The final riluzole model was built using a simplified version of Wilkins' approach
24
to describe the time-dependent increase in parameters observed in our data, using Michaelis Menten kinetics as illustrated in equation 2-1:
where, PAR i,t is the parameter value of individual i at time t, tvPAR is the typical value of PK parameters for the population, Imax i is the maximal fold-change of that parameter relative to baseline, Time i is the time after the first dose in individual i, t 50i indicates the time at which 50% of Imax is reached, and ηPAR i is inter-patient variability in the parameter estimate for individual i.
Visual predictive checks were performed at each individual development steps leading to the final model. Concentration-time profiles were simulated 1000 times using the corresponding dosing regimen for Phase I and II/III patients. The prediction intervals at 5%, 50%, and 95% quantiles obtained from the simulation were compared and plotted against the observation intervals. The model's predictive performance was evaluated based on the capability of prediction intervals to encompass original observations.
Phosphorylated neurofilament heavy chain (pNF-H) as a biomarker of severity of SCI and treatment outcome
Biomarker selection rationale
While the American Spinal Cord Injury Association (ASIA) scoring system is widely accepted as a standardized assessment tool to monitor the SCI condition, outcome assessments are challenged by patient heterogeneity. While the ASIA scale has utility as a clinical outcome tool, it is recognized that there may be a role for biomarkers to assess objectively neurological status and recovery after traumatic SCI. 25,26 Several biomarkers have been investigated for their capability to accurately and effectively monitor neuronal injury. However, due to issues with inadequate stability and abundance, the detection is largely limited to cerebrospinal fluid, thus reducing the clinical practicality. 27 .
Neurofilaments (NF) are the major structural proteins of the neurons that maintain the shape and diameter of neurons, which implies NF can potentially serve as a neuron-specific biomarker. Following neuronal damage, NF are present in the bloodstream and can be quantified utilizing commercially available enzyme-linked immunosorbent assay (ELISA) kits. The NF-H is the “heavy” or “high” subunit of the neurofilaments, belonging to a family of axonal proteins that form the neuronal cytoskeleton. The protein NF-H, together with neurofilament medium chain (NF-M) and neurofilament light chain (NF-L), make up the neurofilament triplet that was discovered in the 1970s by Hoffman and Lasek. 27 Unlike NF-L and NF-M, the phosphorylated form of NF-H (pNF-H) is resistant to proteolytic enzymes, making it the ideal candidate out of the subunits for detection in human plasma. 28 This protein is detected in large quantities, greater than 100 ng/mL, following induced spinal cord and brain trauma in rats. 28 In another recent study, elevated plasma pNF-H is demonstrated, corresponding to the severity of SCI, with higher concentrations reflecting a larger extent of axonal damage. 29 pNF-H also has been extensively investigated across neurological disorders, including subarachnoid hemorrhage and ALS, suggesting that it is a reliable predictor of acute and chronic neuronal injury. 30
Experimental design
Previously published studies only monitored pNF-H levels up to 96 h after injury and may not be adequate to fully capture the extent of the pNF-H released and circulated throughout the systemic circulation. An advantage to our study is that pNF-H could be monitored over the 2-week treatment period simultaneously with the treatment course, providing the potential to differentiate treatment effects from placebo effects. We evaluated the capability of plasma pNF-H to: 1) serve as a covariate of injury severity stratification to reduce inter-patient variability in the time-varying PK model; and 2) predict longitudinal treatment outcomes, such as motor function improvement with the pNF-H profiles in the PK/PD (pNF-H) models.
pNF-H ELISA assay
A commercially available Millipore pNF-H ELISA kit was used to detect the concentrations of pNF-H present in human plasma samples. Each kit has a 96-well plate pre-coated with chicken polyclonal antibodies designed to capture pNF-H from human plasma. A pNF-H specific rabbit polyclonal antibody and a goat anti-rabbit alkaline phosphatase conjugate were used in subsequent steps to detect the captured proteins. In the final step of p-nitrophenyl phosphatase alkaline phosphatase substrate, the pNF-H concoction changed to a yellow color. Fifty μL of plasma sample were required for analysis, each performed in triplicates. A standard curve with a detection range of 0.0585 ng/ mL-15 ng/mL demonstrated a direct relationship between optical density (OD) measured at 405 nm and pNF-H concentration. The concentrations of pNF-H were then determined using the equation derived from plotting OD against spiked pNF-H concentrations.
PK/PD model development
Establishing the relation between the time course of PD outcomes and drug concentrations/exposure is crucial to understand, characterize and predict the pharmacologic behavior of therapeutics. The selection of an appropriate model should account for the drug's mechanism of action for the treatment. Additionally, a mechanistic model can be beneficial for estimating unmeasurable pharmacological processes and parameters. The PD effect can be categorized into direct and indirect responses. 31
A direct relationship is often observed in drugs that act directly on the measurable outcome variables. Mathematical models such as a linear, an Emax, or a sigmoid Emax model can be used to quantitatively describe the PD time course in relation to the PK parameters. However, the PD observations from the riluzole treatment of clinical motor function at 3 months and 6 months, and biomarkers response are not mechanistically direct effects. Therefore, the indirect response will be more relevant to employ for capturing the characteristics of the PD profiles.
Indirect response (IDR)
The IDR models are best used to describe drugs that elicit an indirect impact on the measured outcome variable (R), which is secondary to a preceding process that has a different rate of change with respect to the PK model. At equilibrium, when there is no drug present, the rate of change of R with respect to time
31
is defined as:
where k in represents the rate constant of response production, kout represents the rate constant of response diminution, and R is assumed to be constant with an initial value equal to k in /kout . IDR models assume that the rate constants k in and kout fully account for the response production and dissipation.
Based on the proposed mechanism of action of riluzole, we postulated that the pNF-H time course can be characterized by an IDR model in relation to the cumulative exposure of riluzole. The modeling development procedure, including the algorithm, model evaluation, and validation steps, was the same as the PK models described previously. 16 The development rationales, development, and resulting model are presented in the Result Section.
Results
Time-varying PK of riluzole in patients with acute SCI
In the PK sub-study of the RISCIS trial, the PK and PD evaluations, correlation, simulation, and projection were performed in 32 patients with acute SCI, with 14 in the treatment arm and 18 in the placebo group. One patient in the treatment arm had a baseline total motor score of 0 but was not excluded from the total patient number of 14.
This analysis demonstrated that a one-compartment PK model with time-varying CL/F, clearance normalized by the F, and Vd/F, volume of distribution normalized by the F, adequately describes the concentration-time course of riluzole in patients with acute SCI. An E function was adapted to reflect a maximal change in CL/F and Vd/F over the 14-day study period. This approach sufficiently captured the time-varying degree of increases in CL/F and Vd/F as SCI progresses post-injury. The resulting validated population pharmacokinetic model can be used to guide rational dosing to maintain the therapeutic exposure of riluzole treatment throughout the course of 2 weeks, despite the heterogeneous nature of injury in the population and the complex co-treatments for the secondary complications of the SCI.
The work of time-varying PK of riluzole has been published with the developed and validated population PK model and characterization of the derived PK parameters. 32 The key findings of the unique features in the time course of 14 days post-initiation of riluzole treatment within 12 h of the injury are highlighted and succinctly described below.
Specifically, the demographics of SCI patients recruited in the Phase I and Phase II/III trials were tabulated (Table 1). The inclusion criteria of Phase II/III were similar to those of Phase I, except for the SCI injury level between C4-C8.
Demographics of SCI Patients in Phase I and Phase II/III Trials
Missing BMI data of two patients in riluzole arm of Phase II/III and one patient in Phase I
SCI, spinal cord injury; AIS, American Spinal Injury Association Impairment Scale.
The riluzole peak and trough concentrations decreased with respect to the days post–SCI injury on the same dose basis, consistent between Phase I and II/III observations, confirming the time-varying characteristics of riluzole PK during the 2-week treatment period (Fig. 1). In the Phase II/III trial, the time-varying PK was confirmed with the two additional blood sampling time-points of D7, D10, and the time-varying PK model was developed to characterize the PK changes due to the time-varying characteristics in CL/F and V/F. 32
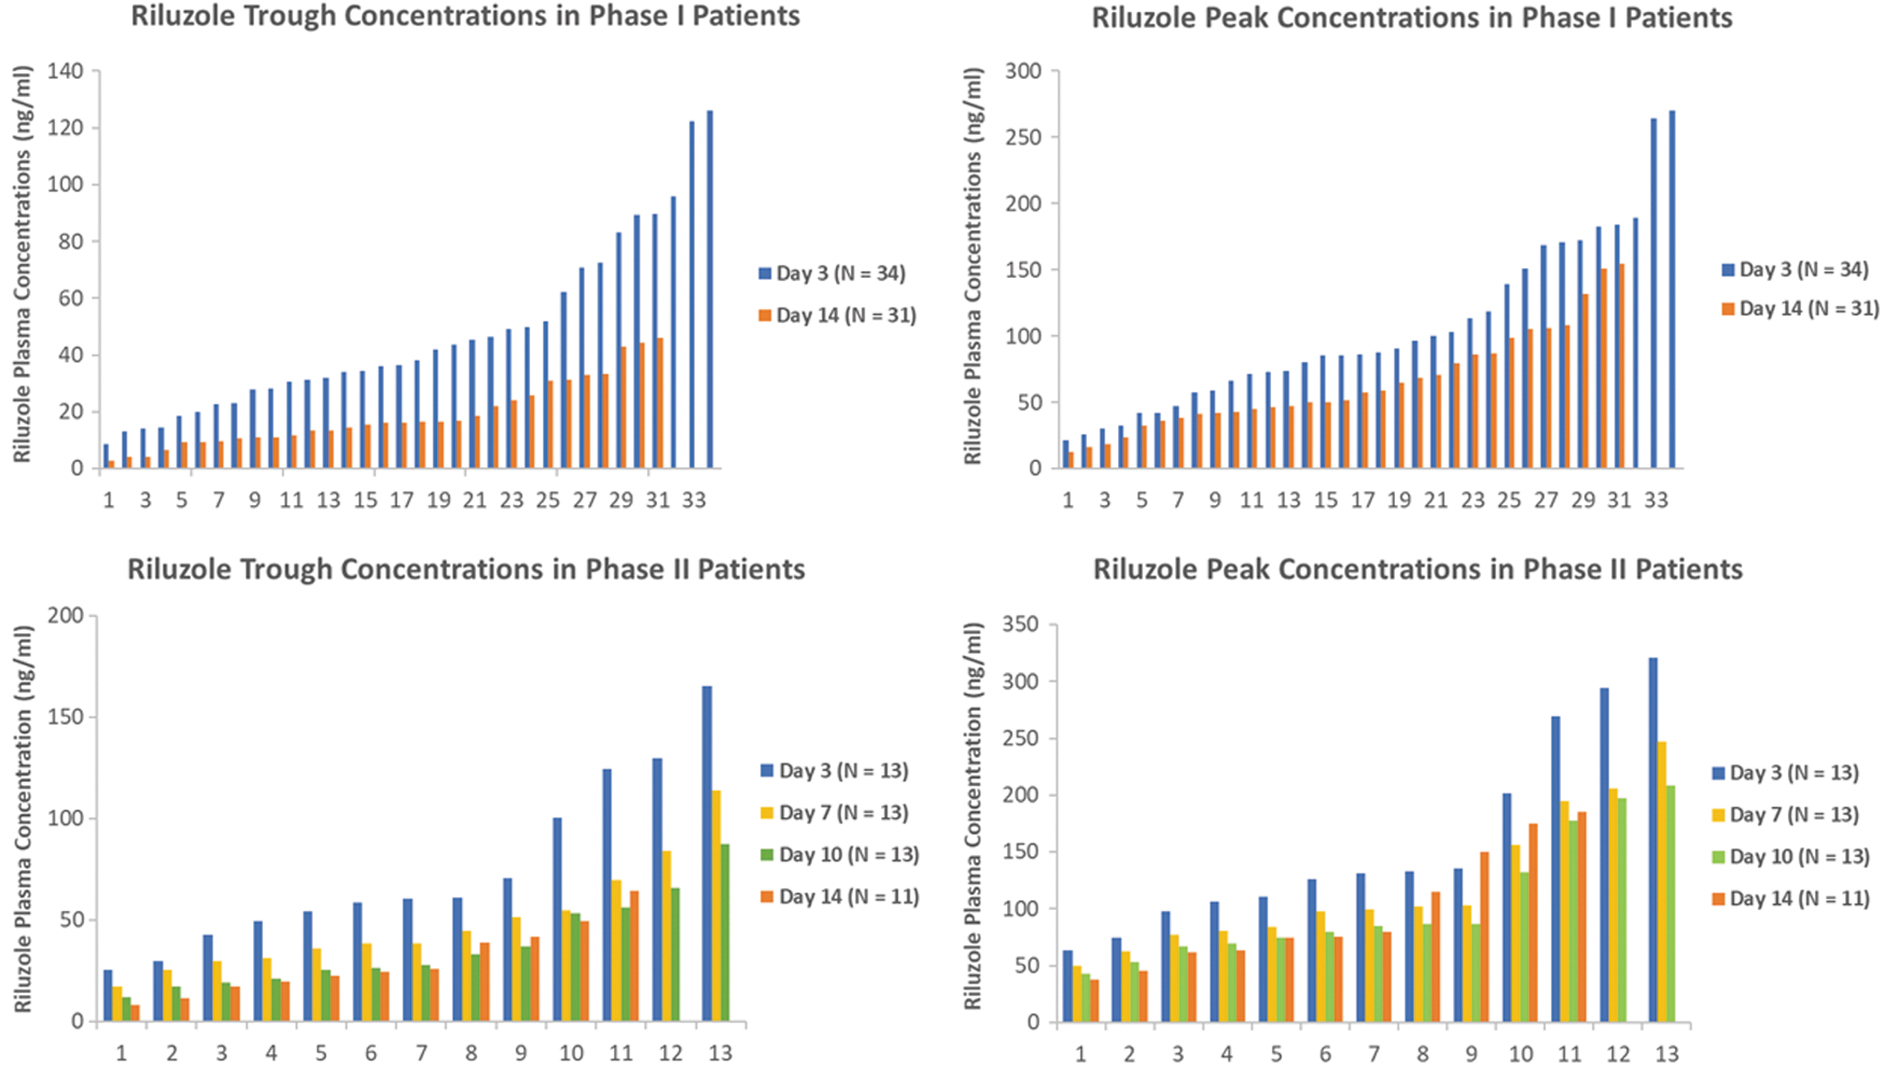
Riluzole trough and peak concentrations from Phase I and Phase II/III trials presented in waterfall plots 27 (with permission from the publisher).
The trough concentration was significantly higher in D3 than those among D7-D14 which were at similar levels. The potential causes of the varying CL and V were related to the temporal change of the impact of SCI. The impaired hepatic metabolic clearance shortly after the early acute phase (≤ 48 h) on D3 due to the decreased hepatic microvascular blood flow and hepatocyte gene expression 16 were stabilized, leading to the subacute phase at D7-D14 post-injury. The developed and validated final time-varying PK model is capable of deriving PK AUCD0-D14 and other exposure for various durations that enabled us to perform PK/PD correlation analyses.
Since the treatment was only for 2 weeks, data were collected to describe the changes in PK during the 2-week period. The focus was on formulating a function that not only describes the data well but is also consistent with the temporal course of neurodegenerative processes. The individual plots for selected subjects from Phase II/III with 4 days of sampling are presented (Fig. 2), and the PK parameters are derived to quantitatively describe the unique characteristics of the time-varying population PK model. The increase in CL and V are both described by Michaelis Menten kinetics featuring the increase over time that reaches a maximal value.
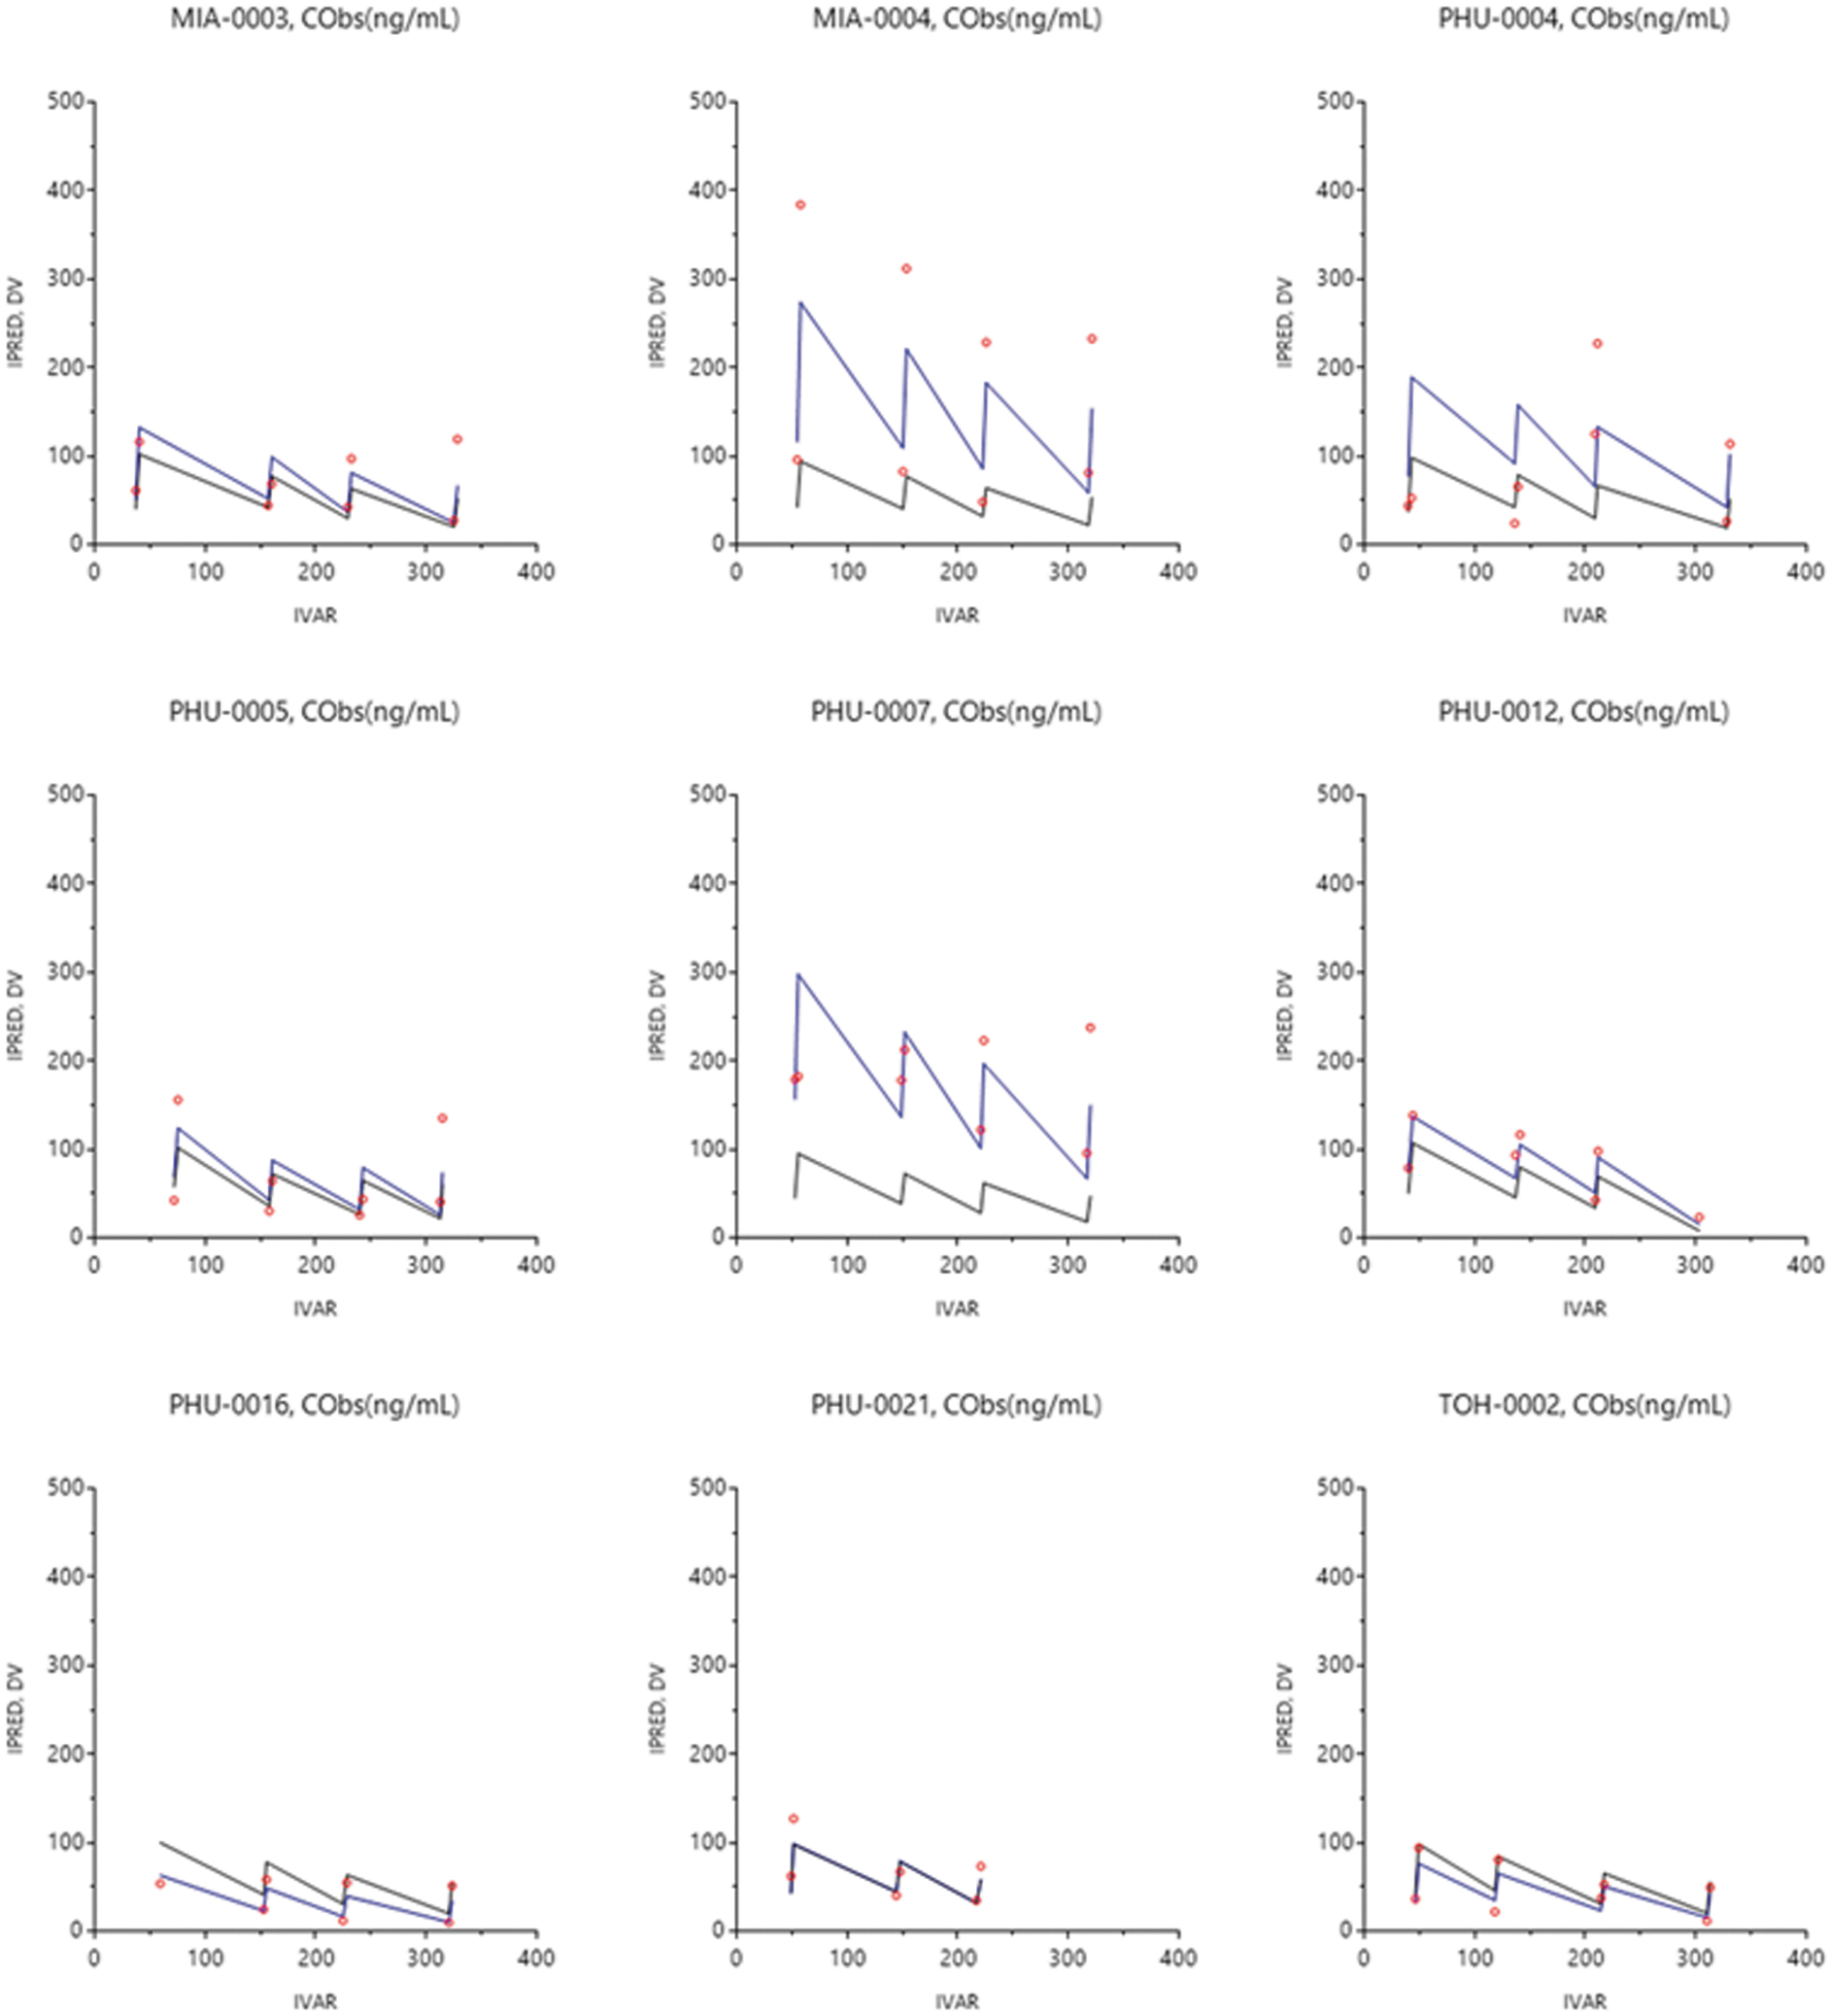
Individual plots of riluzole concentrations fitted against time from the final model for select Phase II/III subjects. Observed data denoted in red circles, population predicted concentration in black lines and individual predicted concentration in blue lines.
A visual predictive check was performed by simulating new data sets using the final model parameters. Prediction intervals (at 95%) constructed from simulated concentration time profiles adequately captured the observed data in the 50th and 95th intervals (Fig. 3).

Visual predictive check of riluzole population pharmacokinetics (PK) model. Individual observations are presented by the blue dots. The 5th, 50th and 95th percentiles of observed data are presented by the red lines. The 5th, 50th and 95th percentiles of predicted data are presented by the black lines. 32 (with permission from the publisher).
This study performed population PK modeling to describe, for the first time, the longitudinal impacts of SCI-induced physiologic and molecular alterations on PK changes in riluzole. This model serves as a foundation to build a more elaborate PK/PD model capable of personalized dosing as a function of time post-injury to accurately predict patients' time-varying riluzole profiles. As a result, the regimen can be modified accordingly to maintain the optimal therapeutic levels with minimal toxicity by taking into the consideration of the patient's characteristics, clinical course, and the concurrent treatment for comorbidities. Going forward, additional PK studies in the SCI population may be warranted to enable the expansion of the developed PK model to address the longitudinal impacts of SCI on other utilized drugs and capture potential drug-drug interactions.
Three-dimensional PK/PD correlation of total motor score gains (ΔTMS) with baseline score and AUCD0-D14
The exploratory analysis
The exploratory analysis of riluzole PK/PD correlation was performed for Phase II/III PK-sub study of 32 subjects with acute SCI. The profiles of the TMS at baseline and 2-week, 3-month, and 6-month follow-up were constructed for the placebo group (n = 18) and riluzole treatment group (n = 14). The TMS and improvement in motor score (ΔTMS), that was calculated as TMSt – TMSbaseline, where t = D3, D7, D10 or D14 in placebo and treated subjects were highly variable within each group (Table 2). The time-varying PK model of oral riluzole was used to derive the parameters of cumulative systemic exposures, AUCD0-Dt, which is defined as the area of under the riluzole plasma concentration versus time curve from the initial D0 first drug administration until the time immediately before the Dt+1 dose administration. The AUCD0-D3, AUCD0-D7, AUCD0-D10, and AUCD0-D14, enabled the comparison between cumulative exposures of the 2-week regimen with the long-term efficacy 6 months after the SCI. The resulting AUCD0-D14, had 5.3-fold variation from 13.33 mg*h/ mL to 58.62 mg*h/ mL, which were significantly higher than those of 54% the coefficient of variation (CV) in ALS patients 14 and 70% CV in spinal muscular atrophy patients. 15 The TMS and ΔTMS also demonstrated wide inter-subject variability, 0 to 42 and -4 to 68, respectively. The natural recovery in the placebo arm was also observed, but to a less extent in contrast to that in the treatment group.
Total Motor Score Outcomes at 3 Months and 6 Months Post-Injury in Placebo and Riluzole-Treated SCI Patients
TMS: Total Motor Score
ΔTMS : Change (gain) of TMS, TMSt -TMSbaseline at time t, 3 months, or 6 months
The minimum clinically important difference in total motor score
Rate of ΔTMS: Rate of TMS change, [(TMSt -TMSbaseline)/TMSbaseline] × 100%
The p values were derived from unpaired Student's t-test with the significant level set at p < 0.05.
SCI, spinal cord injury; SD, standard deviation.
The linear regression of the correlation of the total score changes (gains; ΔTMS) with Cpeak or Ctrough did not result in an appreciable relationship. An initial correlation attempt of ΔTMS with AUCD0-D14 was performed with p = 0.028, and the confidence interval of 95 percentile and prediction interval were presented (Fig. 4). However, the correlation was inadequate to capture all subjects with high or low baseline (BL) TMS (Fig. 4). The diagram revealed that very high AUCD0-D14 (rightmost three datum points) did not result in improving the ΔTMS at 6 months. Therefore, it justified the PK parameter choices of individual AUCD0-D14, not peak or trough concentrations at given time-points, and the PD parameter of ΔTMS at 6 months to alleviate the intra- and inter-subject variability.

Correlation between changes in total motor score (ΔTMS) at 6 months and overall riluzole exposures, area under the curve (AUC)D0-D14, in Phase II/III subjects. Open circles represent subjects with a baseline score ≤10. Filled circles represent subjects with a baseline score >10.
The total score changes (gains; ΔTMS) in individual riluzole-treated SCI patients at 6 months post-treatment was subsequently correlated with the AUCD0-D14 and the baseline (BL) TMS, using a three-dimensional response surface methodology (Design Expert, Version 9). The constructed performance surface revealed that the efficacy of the treatment was affected by both the riluzole exposure and the severity of the injury at baseline (Fig. 5A). The dome shape surface curve suggested the optimal outcomes from exposure in the 16-48 mg*h/mL range at baseline scores of 1-36 (Fig. 5B). The surface can be described by the following quadratic equation:

Three-dimensional pharmacokinetics (PK)/pharmacodynamics (PD) correlation model for Phase II/III patients
Similar correlations of ΔTMS with AUCD0-D3, AUCD0-D7, and AUCD0-D10, and BL also were performed (data not shown). The similar dome shape performance surfaces confirmed that a higher exposure did not contribute to a further improvement in total motor functions assessment. In addition, the efficacy of the treatment (ΔTMS) was affected by both the riluzole exposure (cumulative AUC) and the severity of the injury at baseline (BL), with corresponding optimal AUCs depending on the treatment duration and assessment.
Discussion
Our PK, PD, and CO investigations led to two major findings of significant clinical relevancy and interest: 1) the relationship between riluzole levels and neurological recovery was established with three-dimensional (3D) PK/PD correlation; and 2) the relationship between riluzole administration and reduction in axonal degradation were established by area between effect curves (ABEC) model between placebo control and riluzole-treated patients.
The correlations of upper-limb motor score (ΔUMS) and lower-limb motor score (Δ LMS) at 3 months and 6 months did not result in apparent patterns. No sensory scores were tested for this 3D correlation, as the outcome assessments were subjective and varied among evaluators at different sites. The PK/PD analysis showed promising signals for treatment efficacy (increase in total motor scores at 6-month follow-up) after 2 weeks of 50 mg BID dose with the first-day loading dose of 100 mg BID of riluzole, which was correlated with both AUCD0-D14 and baseline TMS. The PK/PD analysis for individual subjects offers merit over gross population comparisons between placebo and treatment groups, where large inter-subject variability in riluzole exposures and total motor scores existed. A meaningful correlation was established in the current 3D PK/PD analysis to define the optimal exposure of 16 - 48 mg*h/ mL in AUCD0-D14 for TMS improvement. With the derived equation, the ΔTMS can be projected using a minimal plasma sampling (possibly with only two samples on an early date of the treatment) to derive AUCD0-D14 from the established time-varying PK model.
Our goal is to establish robust PK/PD modeling to forecast future responses to riluzole and provide an optimal dose for this SCI population. For the next phase of our research, we plan to develop a dashboard system utilizing the Bayesian approach: Our existing data would be the prior distribution; new patients' two samples, for example, can serve as evidence; then, these two will yield the posterior probability. Once this Bayesian modeling is fully developed, this interface would provide model-based predictions in clinical settings. The 3D PK/PD model may also be extended for positive efficacy signal of riluzole treatment with CO of other therapeutic neurological recovery.
Significance
The 3D PK/PD correlation of ΔTMS with AUCD0-D14 and baseline TMS was established, enabling us for the first time to project the optimal exposure range of AUCD0-D14 for riluzole treatment to achieve the intended clinical outcome (CO) in ΔTMS. In addition, the desired AUCD0-D14 can be estimated with the known baseline TMS of an acute SCI patient and the desired, achievable CO goal in ΔTMS, using the Equation 3-1; the desired AUCD0-D14 then can be translated to the corresponding regimen with specified dose and dosing interval, employing our developed time-varying PK model, for a rational recommendation.
Limitations
The RISCIS and PK Sub-study were terminated prematurely in 2021 due to low enrollment during the COVID-19 pandemic, resulting in reduced study power. Therefore, a potential model validation may be performed in the future if more PD (CO of ΔTMS) data from non-PK Sub-study subjects in the RISCIS trial are made available, and the riluzole concentrations at any time-points are quantified to derive the AUCD0-D14 for external validation.
Toxicity assessments in riluzole-treated and placebo groups
Toxicity assessments in riluzole-treated and placebo groups were performed. The ratios of ALT and AST levels over the upper limit of normal (30 U/L, and 40 U/L, respectively) in both groups were plotted for baseline, D3, D7, and D14 and revealed no appreciable hepatic toxicity with the current regimen in dose, dosing interval and duration of the therapy. Therefore, no TK/TD correlation was attempted.
pNF-H pharmacodynamic model development
Natural progression component
To account for the natural progression of pNF-H in describing the time-course of drug effect on the reduction of pNF-H released, a time-varying component was incorporated to describe the SCI-induced production rate, Kin, of pNF-H, to reflect the progressive “baseline” level. This natural progression was estimated independently from the main PKPD model using the profiles of placebo subjects, and can be described by the following equation pNF-H levels as a function of time:
where k in and k out define the rate constants of production and loss of response, respectively.
Mechanistically, the increase in pNF-H over time in SCI patients can be regarded as the result of an increase in axonal damage that causes more release of pNF-H into plasma. Based on the previously tested structural PD models for the natural progression of pNF-H, an inhibitory Sigmoidal Emax model was used to describe the time-dependency of Kin as follows:
where tvK in represents the time-varying production rate constant, Imax, gamma, and half-maximal inhibitory concentration (IC50) represent maximum inhibition, steepness of increase, and the time at which half of the maximum inhibition in Kin is achieved, respectively. The obtained parameter estimates from this PD model were incorporated into the PKPD (pNF-H) model as fixed values.
Exposure–response component
The PKPD model of the pNF-H progression in relation to riluzole exposure was modeled in Phoenix NLME. The contribution of drug effect to the inhibition of the formation rate was modeled with the Emax function:
where Imax is the maximum inhibition effect, IC50 is the plasma exposure of riluzole concentration needed to elicit half of the maximum effect, and AUC is the riluzole exposure over the 14-day treatment. The IDR model describing the inhibition of pNF-H production by riluzole exposure is as follows:
where k
in
and k
out
define the rate constants of production and loss of pNF-H, respectively. Imax represents maximum fractional inhibition by riluzole, and IC50 indicates the AUC at which half Imax is reached. Traditionally, in an indirect inhibition model, the baseline is assumed to be constant, and the drug exerts its effect by inhibiting a fraction of that baseline concentration. In our case, since SCI is progressing over the acute and subacute phases as evidenced by the progression model of pNF-H performed, the “baseline” increased over time. The fixed parameters describing the natural progression of increasing pNF-H were incorporated into this PK/PD model to depict the progressive increase in baseline level. The drug effect can be quantified as the Area Between the Baseline and Effect Curves (ABEC)
23
:
where pNF-Hnat is the progressive baseline level, and AUEC is the area under the treated pNF-H progression versus time curve within the time interval of 0 to t r.
The PD models of pNF-H revealed the efficacy of riluzole, as the treated subjects exhibited a diminished increase in the natural progression of pNF-H, indicative of reduced axonal breakdown. The developed mechanistic PK/PD model using Sigmoidal Emax function with a multiplicative residual error model best fitted the data. The population parameters from the final PD model of pNF-H levels in treated subjects were developed.
Overall, treated subjects exhibited a lower Emax (3.38 vs. 23.3), indicating a lower extent of increase in pNF-H. Treated subjects also had a smaller half maximal effective concentration (EC50; 225 h vs. 486 h) and slightly larger gamma (3.6 vs. 2.94) compared with placebo subjects, indicating a slower rate of increase but reaching 50% Emax earlier due to the substantially lower level (Table 3).
Population Pharmacodynamic Parameters of pNF-H Natural Progression in Placebo and Riluzole-Treated SCI Patients
95% CI is the 95th percentile confidence interval taken from a nonparametric bootstrap.
PNF-H, phosphorylated neurofilament heavy chain; SCI, spinal cord injury; RSE, relative standard error; CI, confidence interval.
The time course of pNF-H in relation to the exposure of riluzole was used for simulation purposes. The population progression PD model was established to characterize the independent variable of ABEC of the natural progress profile of axonal injury biomarker, p-NF-H, in the placebo group and the corresponding time-varying profile in the riluzole-treated group. With the established PD model for pNF-H, visual predictive checks of the progression model of pNF-H were demonstrated in 1) placebo and 2) riluzole-treated patients, and 3) the time courses of pNF-H concentrations during the 2-week treatment duration, with ABEC between placebo and treatment patients in Phase II/III trial (Fig. 6). The riluzole treatment was demonstrated with a significant correlation between ΔTMS at 6 months and ABEC by the multiple linear regression model (Table 5).

Visual predictive checks of the progression model of phosphorylated neurofilament heavy chain (pNF-H) in
Natural disease progression for PK/PD/CO model development
Disease progression implies the time course of the changes in disease status without pharmacotherapies. The components of disease status are the baseline, the natural history over time, and the response to a drug and placebo treatments. 26 However, disease progress modeling can be complicated if the patients return to recovery, which is the case with SCIs. SCI spontaneous recovery may follow a complex trajectory progressing over many years after the incident. Most affected individuals may experience improvement of motor functions below the injury site, although at varying degrees. Patients with ASIA Impairment Scale (AIS) A and B diagnoses have limited recovery at a predictable rate, while patients with AIS C and D diagnoses recover more substantially but vary highly between cases. Recovery is rapid within the first 3-6 months, then plateaus out after 2 years. Most clinical trials monitor treatment outcomes throughout the first 6 months. Therefore, in assessing clinical outcomes in SCI, it is crucial to account for natural recovery or natural progression to accurately quantify the drug effect. In our Phase I study, mean total motor scores in riluzole-treated patients were compared with registry patients stratified by AIS grades. 12 The registry individuals, especially in severely injured AIS A and B groups, showed more rapid recovery during the first 42 days followed by a slower neurological recovery afterward. This observation will guide us in PK/PD/CO model development.
Disease progression over time can be described as a linear function when the change in the clinical outcome is small compared with the duration of observation.
33,34
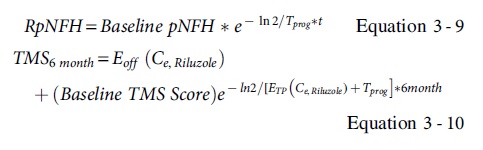
However, our time course of mean TMS plots in Phase I/II/III trials shows TMS improvements in a non-linear fashion during the prolonged 6-month time scale, which renders the linear model unsuitable. Based on this rationale, the spontaneous natural recovery in SCI can be described with zero asymptote function:
where S(t) refers to the status of motor function at any time t from the admission; S0 is the baseline status of motor function; Tprog describes the half-life of SCI progression. 35
However, it is essential to evaluate if the drug exerts additional symptomatic, disease-modifying effects, or both, along with the natural recovery. A symptomatic response can be defined as a temporary offset of the natural progression without lasting disease modification; once the drug is washed out, the drug response curve will eventually meet the natural history curve. 35 On the other hand, if the drug modifies the disease, the slope of the drug response curve will be altered by slowing down the rate of disease progression. 36
The patterns of riluzole response in Phase I/II/III were demonstrated to be related to both the symptomatic effect offsetting of symptoms, and a disease-modifying effect that altered the rate of progression. Therefore, the riluzole response can be defined by using the equation with combined zero-asymptote, offsetting, and modifying slope pattern:

where Eoff (Ce,Riluzole) refers to an offsetting pattern describing symptomatic relief of riluzole; ETP (Ce,Riluzole) represents the time course of the effect of riluzole concentrations at the effect site with the half-life of natural SCI progression (Tprog). 35
Similarly, plasma pNF-H also exhibits a natural progression in SCI patients that needs to be accounted for during the assessment of treatment impact. The natural progression model for pNF-H levels was derived using the longitudinal profiles of Phase II/III from placebo patients and compared against those of treated patients, to test whether pNF-H is a specific response biomarker of riluzole therapy. A PK/PD relationship was then established to correlate PK properties of riluzole with the pNF-H levels compared with natural progression to obtain an understanding of treatment effects. The clinical motor outcomes were subsequently incorporated into a final model to correlate the clinical outcomes (CO) of motor score improvements (ΔTMS) at 6 months with pNF-H reduction for individual patients during the treatment period, based on the model from Mould. 35
The proposed model scheme of population PK, PD (pNF-H), and clinical outcome (ΔTMS) of riluzole therapy in the acute SCI population is depicted (Fig. 7).
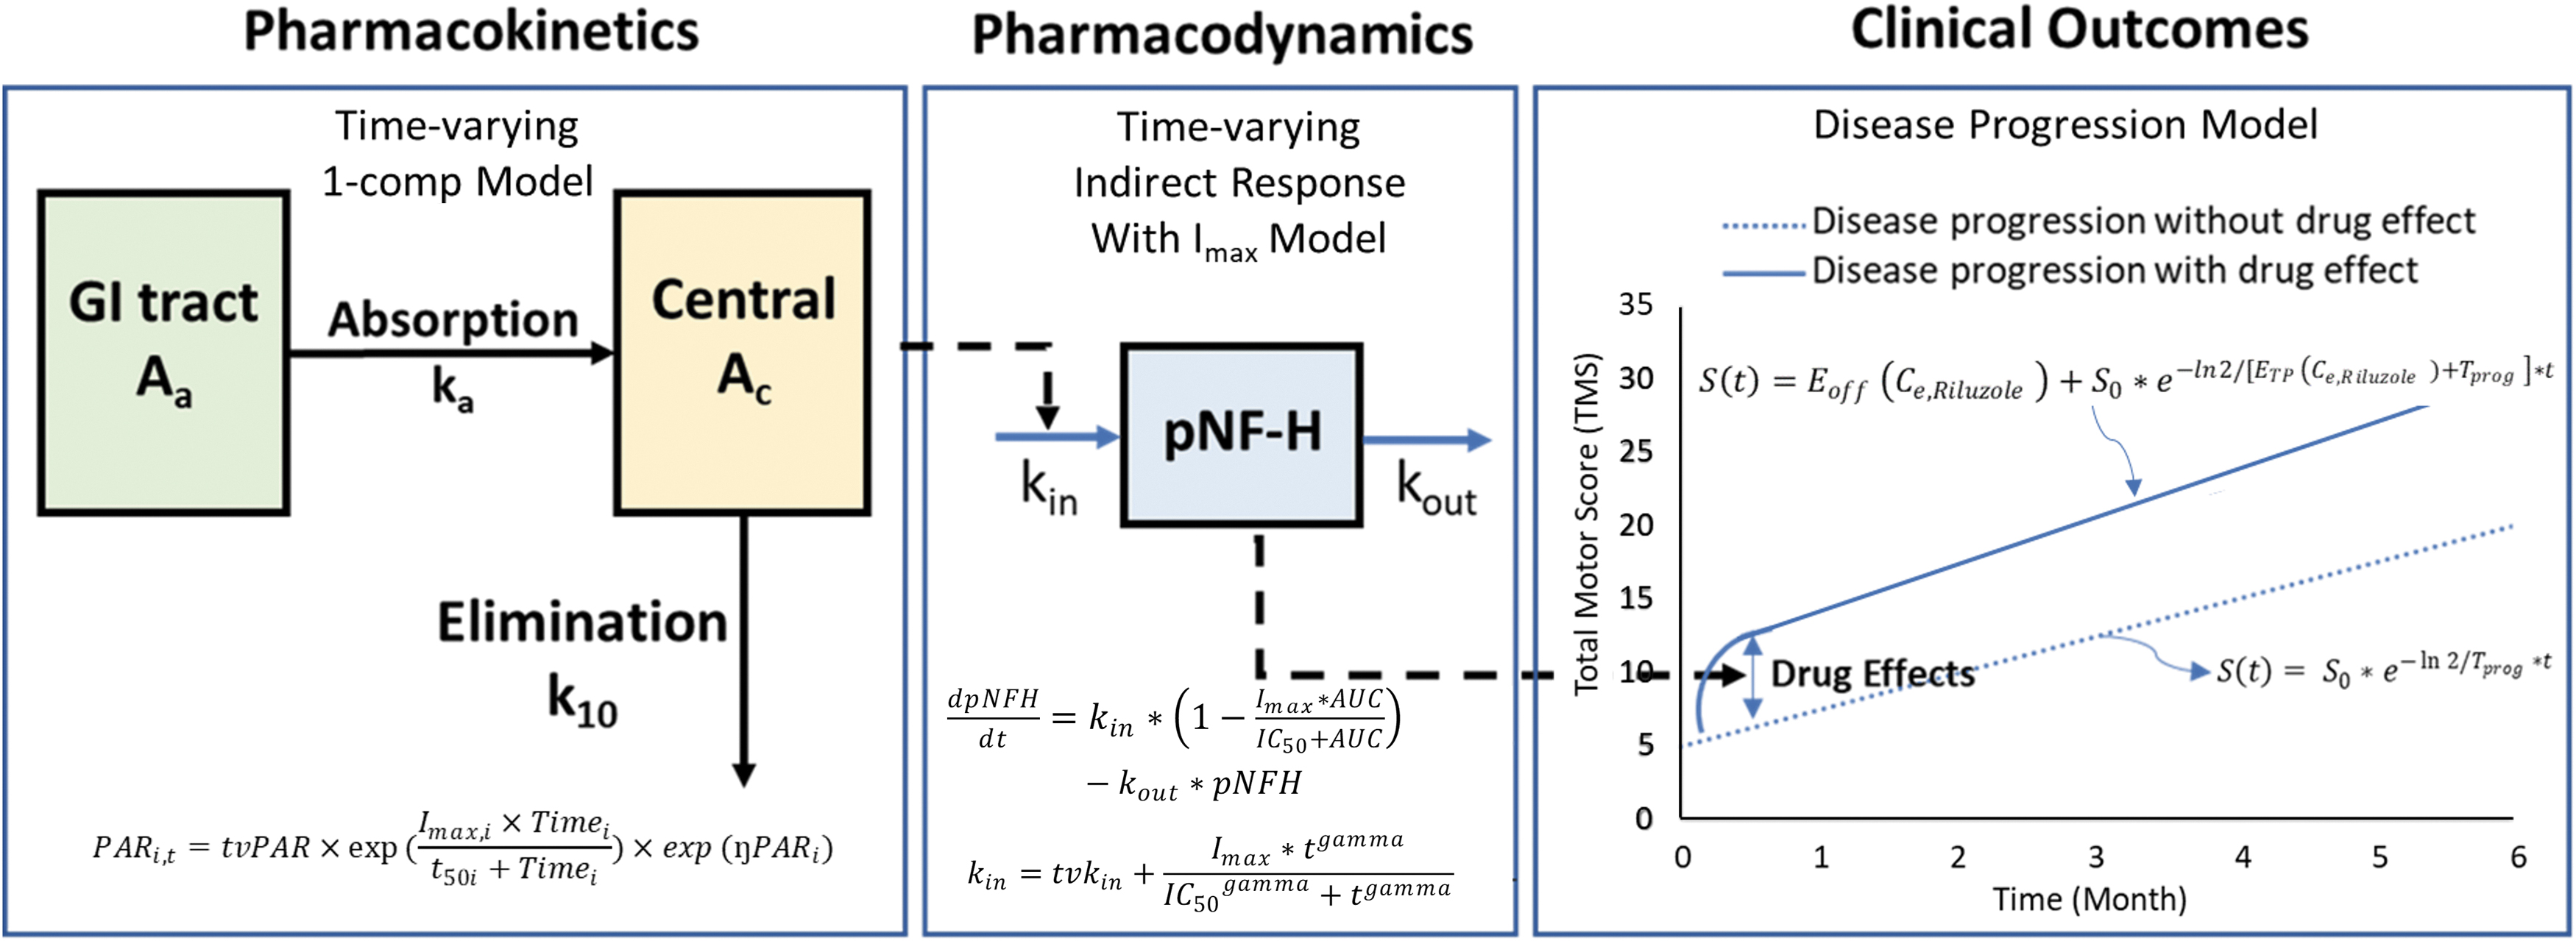
Proposed model scheme of population pharmacokinetics (PK), pharmacodynamics (PD; phosphorylated neurofilament heavy chain [pNF-H]), and clinical outcome (ΔTMS) of riluzole therapy in acute spinal cord injury population.
Data analysis
With the established and validated time-varying population PK model, characterized natural progressive nature of pNF-H model at the 2-week treatment duration with the parameters (Table 3), and observed CO of ΔTMS at 6 months after the admission, the model was established, using the tabulated parameters from individual components (Table 4), and to be validated with additional data set from non-PK study subjects.
Summary of Parameter Estimates for the PKPD Model of pNF-H Time Course in Relation to Riluzole Exposure
95% CI is the 95th percentile confidence interval taken from a nonparametric bootstrap.
Selected fixed values.
PK, pharmacokinetics; PD, pharmacodynamics; PNF-H, phosphorylated neurofilament heavy chain; RSE, relative standard error; CI, confidence interval; half-maximal inhibitory concentration, IC50; AUC, area under the curve; CL, clearance; V, volume of distribution.
p-NF-H, a promising biomarker for predicting and projecting clinical outcomes in (ΔTMS) for riluzole treatment
The p-NF-H is demonstrated as a promising biomarker in predicting and projecting the clinical outcomes in total motor score improvement (ΔTMS) for riluzole treatment (Fig. 8; Table 5). The proof-of-concept study confirmed that PD/CO model is feasible to correlate ΔTMS at 6 months with time-varying pNF-H. In addition, evaluating the time-progressive nature of the SCI course and treatment response between placebo and treatment groups by monitoring the profiles of pNF-H, the ABEC is derived for monitoring the potential efficacy of the treatment, taking into consideration of natural recovery in the placebo group. Nevertheless, the potential PK/PD/CO is not yet successfully validated with only the proof-of-concept demonstration due to insufficient subject data, which is the limitation of the current trial due to the premature termination resulting from the COVID-19 pandemic.
Summary of Multiple Linear Regression Model for Changes in Total Motor Score (ΔTMS) with ABEC and Baseline Score as Predictors
Dependent variable, Total Motor Score change (ΔTMS).
β, slope.
ABEC, area between effective curves; BL, baseline.
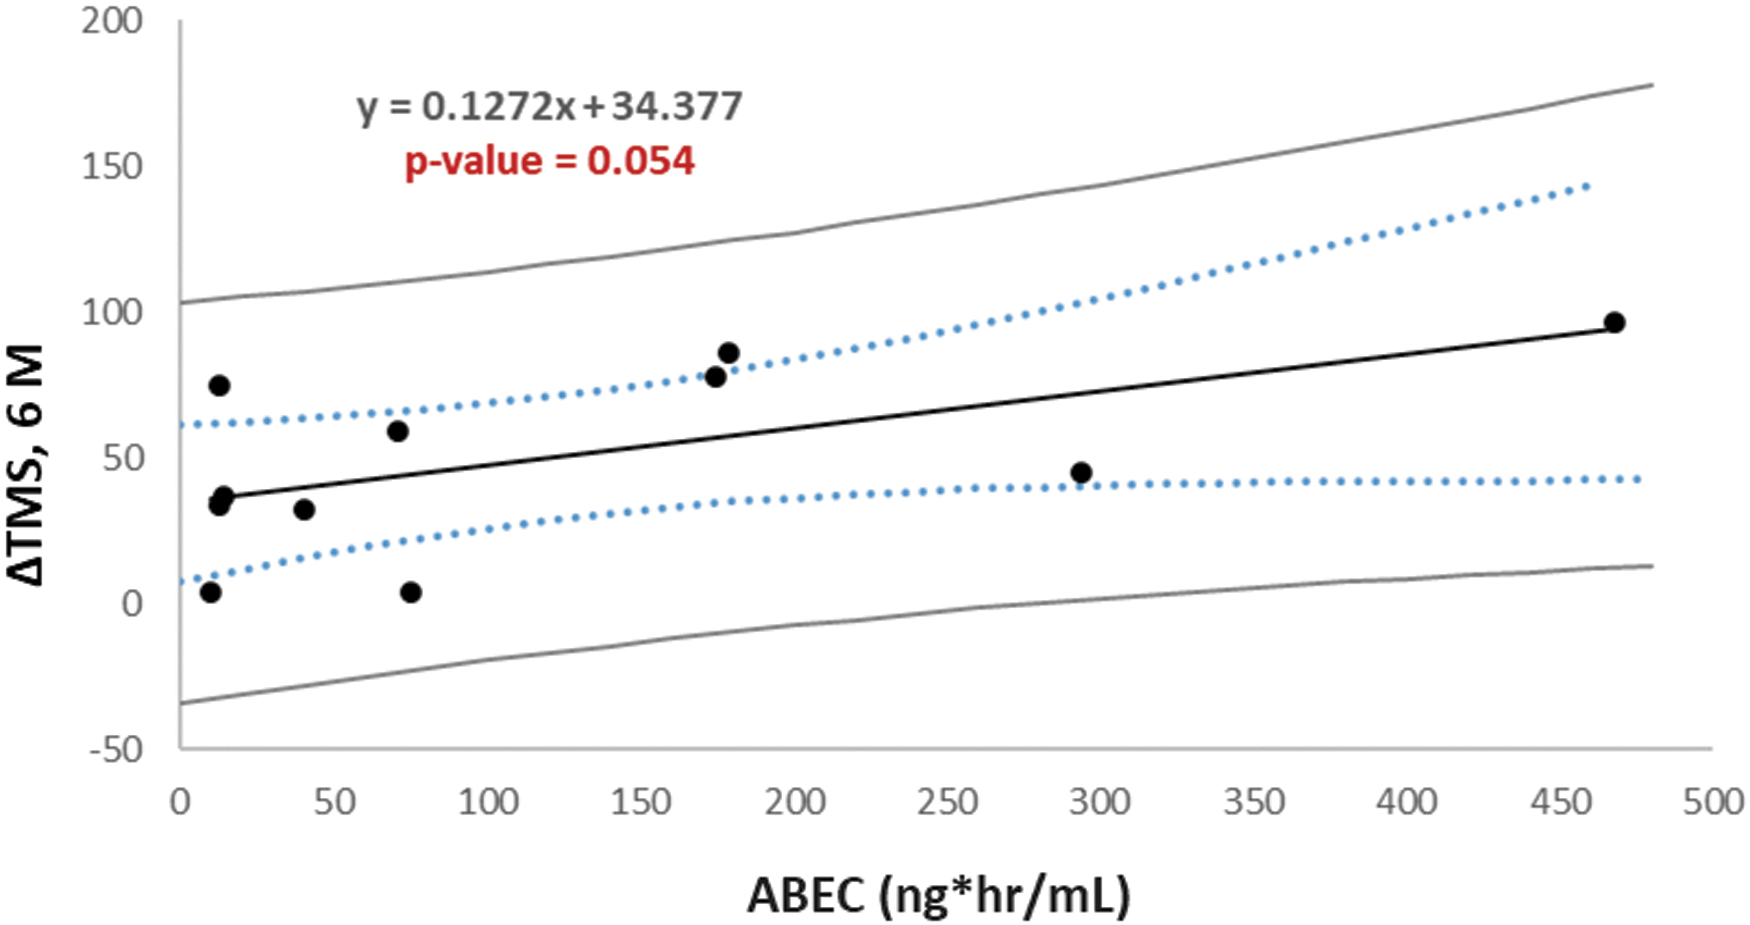
Linear regression of changes in the total motor score (ΔTMS) at 6 months versus area between effective curves (ABEC) of phosphorylated neurofilament heavy chain (pNF-H) inhibition between riluzole treatment and placebo groups, with confidence and prediction intervals.
Due to the current limitation, future studies will be warranted with the blood samples from non-PK group of the RISCIS trial, at whatever available time-points in days, either peak or trough concentrations for additional PK, biomarker monitoring, and ΔTMS, to further validate the PD (pNF-H)/CO model, and enhance the power of analysis for the PK/PD/CO model that will be suitable for future clinical trial design and outcome projection with different regimens and/or durations of riluzole treatment.
Significance
The development of PK/PD/CO model is feasible to overcome the large inter-subject or even intra-subject variability through the course of treatment and care for SCI patients. It offers a more conclusive outcome in the evaluation of treatment efficacy because the PK/PD (pNF-H) model offers solutions to evaluate an individual's performance. In addition, it also offered the potential application for model-informed, PK-guided recommendations for the medication regimen, and time-varying modifications.
Conclusions
Riluzole, a benzothiazole sodium channel blocker that received FDA approval to attenuate neurodegeneration in amyotrophic lateral sclerosis (ALS), was demonstrated to be safe and potentially efficacious in a spinal cord injury (SCI) population in a Phase I clinical trial (NCT00876889). The acute and progressive nature of traumatic SCI and the complexity of secondary injury processes alter the pharmacokinetics of therapeutics. In the pharmacokinetics sub-study of Phase II/III, a multi-center, randomized, placebo-controlled, double-blinded trial (NCT01597518), we studied the pharmacokinetics (PK) and pharmacodynamics (PD) of riluzole. Specifically, we monitored the clinical outcomes in axonal injury biomarker of pNF-H for 14 days and motor functions at injury and 3-month and 6-month follow-ups, as well as performed PK modeling, PK/PD correlations to identify potential effective exposure of riluzole for observed PD outcomes.
Summary of key findings
The longitudinal impacts of SCI on the PK of riluzole are characterized
A one-compartment with first-order elimination population PK model for riluzole, incorporating time-varying clearance and volume of distribution, is developed from the combined data of Phase I and the Phase II/III trials. With the established model, a rational dosing scheme is feasible with a time-dependent modification that preserves the optimal therapeutic exposure of riluzole. Our time-varying PK model demonstrates that the AUCD0-D14 of individual patients is the optimal parameter for PK/PD correlations, alleviating the difficulty in correlating the overall clinical outcomes with a substantial inter-subject variability. The target AUCD0-D14 can be translated to a clinically practical regimen in dose, dosing interval, and treatment duration, using the published time-varying PK model.
A meaningful 3D PK/PD correlation was established
For individual patients, total motor functional improvement (ΔTMS) at 6 months was correlated with overall riluzole exposure and baseline total motor score. Patients with baseline TMS of 1-36 benefited from the optimal exposure AUCD0-D14 range of 16-48 mg*h/ mL. The model enables the future design and modification for an individualized regimen with the targeted optimal exposure derived from the 3D PK/PD model, based on the desired total motor functional improvement, and the patient's baseline TMS at injury.
The PD of riluzole was monitored using the axonal damage biomarker, pNF-H
The relationship between clinical motor function improvement and the biomarker from the treatment was established. The PD models of pNF-H revealed the riluzole efficacy, as the treated subjects exhibited a diminished increase in the natural progression of pNF-H, indicative of reduced axonal breakdown. The time course of pNF-H in relation to the exposure of riluzole can be used for simulation purposes. The population progression PD model was established to characterize the independent variable of ABEC (area between the effect curves) of the natural progress profile of axonal injury biomarker, p-NF-H, in the placebo group and the corresponding time-varying profile in the riluzole-treated group. The riluzole treatment was demonstrated with a significant correlation between ΔTMS at 6 months and ABEC by the multiple linear regression model.
The PK/PD/CO model using pNF-H as the PD variable may offer the merits of using more objective measurement and enabling an earlier projection of the CO for the treatment. The measurement of pNF-H is objective in contrast to the motor score measurement that is relatively subjective and varied among the individual clinical evaluators. In addition, the projection of CO based on the correlation of PK/pNF-H/CO may be achieved earlier, because the pNF-H suppression responsive to the riluzole treatment is observed within days, much sooner than the improvement of motor functions that takes months to years.
No apparent toxicity was apparent related to the current riluzole treatment regimen
Assessment of liver toxicity using toxicodynamic measurements, such as aspartate aminotransferase, and alanine aminotransferase, was executed. The current 2-week regimen of riluzole is well tolerated.
To date, no pharmacologic therapy has been proven to significantly improve neurological outcomes in SCI patients. The development of effective treatment for SCI is challenging due to the substantial initial mechanical damage and subsequent biochemical destructive cascade. However, with the understanding of 1) the time-varying PK and PD of riluzole in acute SCI population, and 2) how the disease progression affects the PK and PD, from the reported clinical phase I and II/III trials, the future drug development can be more rationally executed with the optimal dosing regimen design. Our study provides new evidence that plasma pNF-H may be useful as a response biomarker of injury severity and clinical therapeutic outcome in acute SCI, especially when assessment tools in the clinical setting are limited and subjective. The PK/PD/CO proof of concept can serve as a rational guide for future PKPD model refinement in SCI setting for other studies which involve biomarker and clinical outcomes.
Footnotes
Acknowledgments
The authors thank the patients, their families, the study coordinators, and technicians for providing the clinical samples and patient data from the clinical trials. We also thank Susan Howley from the funding agency for her support to the authors, clinical investigators, and for this paper preparation.
Authors' Contributions
R.G.G., D.S.C., and M.G.F designed the research. J.S.H., J.D.G., K.M.S, B.A., M.B., and M.G.F. recruited patients and conducted the clinical research. E.G.T. provided operational oversight and regulatory compliance. A.N. and J.P. developed the manuscript with comprehensive pharmacokinetic, pharmacodynamic analyses and modeling. L.W. provided modeling support. A.N. and J.P. analyzed the Phase II/III data.
Funding Information
This material is based upon work supported by the U.S. Army Medical Research Acquisition Activity under Contract No. W81XWH-16-C-0031, the Christopher & Dana Reeve Foundation, and Supplemental Funding by Institute for Drug Education and Research (IDER), College of Pharmacy, University of Houston, for studies on biomarker pharmacodynamic evaluations and modeling.
Author Disclosure Statement
No competing financial interests exist.