




Abstract
Research in severe traumatic brain injury (TBI) has historically been limited by studies with relatively small sample sizes that result in low power to detect small, yet clinically meaningful outcomes. Data sharing and integration from existing sources hold promise to yield larger more robust sample sizes that improve the potential signal and generalizability of important research questions. However, curation and harmonization of data of different types and of disparate provenance is challenging. We report our approach and experience integrating multiple TBI data sets containing collected physiological data, including both expected and unexpected challenges encountered in the integration process. Our harmonized data set included data on 1536 patients from the Citicoline Brain Injury Treatment Trial (COBRIT), Effect of erythropoietin and transfusion threshold on neurological recovery after traumatic brain injury: a randomized clinical trial (EPO Severe TBI), BEST-TRIP, Progesterone for the Treatment of Traumatic Brain Injury III Clinical Trial (ProTECT III), Transforming Research and Clinical Knowledge in Traumatic brain Injury (TRACK-TBI), Brain Oxygen Optimization in Severe Traumatic Brain Injury Phase-II (BOOST-2), and Ben Taub General Hospital (BTGH) Research Database studies. We conclude with process recommendations for data acquisition for future prospective studies to aid integration of these data with existing studies. These recommendations include using common data elements whenever possible, a standardized recording system for labeling and timing of high-frequency physiological data, and secondary use of studies in systems such as Federal Interagency Traumatic Brain Injury Research Informatics System (FITBIR), to engage investigators who collected the original data.
Introduction
Traumatic brain injury (TBI) is a leading cause of death and disability in the United States. There were >223,000 TBI-related hospitalizations in 2018. Approximately 190 people in the United States died from TBI-related injury each day in 2021, and 15% of all United States high-school students reported one or more sports or recreation-related concussions within the preceding 12 months. 1
Additionally, many TBI survivors live with significant disabilities, resulting in substantially reduced quality of life and increased socioeconomic burden, 2 with an estimated $13.1 billion in direct costs and $51.2 billion in indirect costs every year. 3 Complications from severe TBI remain substantial, with mortality rates ranging from 16 to 40% 4 –7 despite improvements in critical care over the last decades.
Many studies of severe TBI result in small sample sizes ranging from 119 to 3244–7 and therefore have low power to detect small or medium effect sizes. This may partially explain why many Phase 3 trials have resulted in negative findings. Combining data from multiple TBI data sets holds the potential to increase sample sizes sufficiently to answer remaining questions, such as how and when to treat TBI patients and by which methods. This is particularly challenging when combining complex data from disparate sources such as longitudinal physiological data that are routinely collected in severe TBI patients.
The National Institutes of Health (NIH) and the Department of Defense (DoD) collaborated on a centralized database for TBI research, launching the Federal Interagency Traumatic Brain Injury Research Informatics System (FITBIR) in 2012. 8 The aim has been to serve as a central repository for studies to share data sets and facilitate collaboration among investigators by building on the use of the NIH TBI common data elements (CDEs). 8
Here, we report our approach to and experience of harmonizing variables from five well-known and well-published multi-center TBI trials with data deposited in FITBIR, as well as two additional studies external to FITBIR. A novel contribution is the harmonization of longitudinal physiological data that is often collected with varying protocols across studies and sites. Our initial research goal was to leverage these data for data visualization, to harmonize variable collection across trials, and later, to develop prognostic models for long-term severe TBI outcomes using this unprecedented quantity and quality of data. Harmonizing these data will enable well-powered development and validation of prediction models for long-term outcomes. We conclude with recommendations for future investigators planning to prospectively collect multi-focal data in this population that will aid integration of these data with existing studies in FITBIR and elsewhere.
Methods
We describe the data processing procedures that we implemented to ensure that routinely collected data are “research ready/analyzable.” In the following sections, we (1) detail the data sources, (2) outline the procedure for linking data from these sources, and (3) describe further data processing (including data harmonization), to promote end-stage statistical analyses of these rich data.
Data sources
We incorporated the following databases
Trials and databases deposited in FITBIR: (1) Citicoline Brain Injury Treatment Trial. (COBRIT), 9 (2) Effect of erythropoietin and transfusion threshold on neurological recovery after traumatic brain injury: a randomized clinical trial (EPO Severe TBI/EPO), 4 (3) A trial of intracranial-pressure monitoring in traumatic brain injury (BEST-TRIP), 5 (4) Progesterone for the Treatment of Traumatic Brain Injury III Clinical Trial (ProTECT III), 6 and (5) Transforming Research and Clinical Knowledge in Traumatic brain injury (TRACK-TBI, downloaded 5/25/2021). 10
Trials and databases not deposited in FITBIR: (1) Brain Oxygen Optimization in Severe Traumatic Brain Injury Phase-II: A Phase II Randomized Trial (BOOST-2), 7 and (2) Ben Taub General Hospital Research Database, Baylor College of Medicine, Houston, TX (BTGH-Database).
We downloaded baseline, outcome, and physiological variables from each study, and derived a common set of variables with the same possible range of values. During the process, there were extensive collaborations with lead investigators of the component studies, leveraging their expertise to confirm how their study data were collected and managed.
Table 1 presents the sample sizes, years of recruitment, data types, and follow-up for the included studies. We included patients with motor Glasgow Coma Scale (GCS) ≤5 and age ≥18 (n = 1943). Patients whose baseline data were missing, for whom intracranial pressure (ICP) was not monitored or recorded or Glasgow Outcome Scale (GOS) outcome data were missing, and who did not survive for at least 5 days after injury were excluded from the study, leaving 1536 available for analysis. Figure 1 displays proportions of participants with demographic variables and baseline clinical measurements by study.

Summary of availability of baseline variables.
Available Data Types and Follow-Up in Each Study
Study sample size of adult severe TBI patients (motor GCS
Data uploaded to FITBIR but had not been shared publicly at the time of the analysis.
No hourly data, but can create summary features.
TBI, traumatic brain injury; FITBIR, Federal Interagency Traumatic Brain Injury Research Informatics System; GOS, Glasgow Outcome Scale; GOS-E, Glasgow Outcome Scale – Extended; COBRIT, Citicoline Brain Injury Treatment Trial; EPO Severe TBI, Effect of erythropoietin and transfusion threshold on neurological recovery after traumatic brain injury: a randomized clinical trial; TRACK-TBI, Transforming Research and Clinical Knowledge in Traumatic Brain Injury; ProTECT Trial, Progesterone for the Treatment of Traumatic Brain Injury III Clinical Trial; BOOST-2 Trial, Brain Oxygen Optimization in Severe Traumatic Brain Injury Phase-II; BTGH, Ben Taub General Hospital.
Data imputation
Figure 2 depicts proportions of participants with at least one measurement of hourly physiological data or values that were considered non-normal (transgressions) (Fig. 2a) and at least one measurement of high frequency physiological data (Fig. 2b), by study.

Among the physiological data, we observed many outliers and missing values in all studies because of loss of monitoring and technical glitches. We examined the distributions of each physiological variable. We set the observation as a missing value if it was beyond the possible range of the variable. Incomplete time series data often contained gaps. These gaps can occur because monitoring has not started or the patient was in transportation. Childs and coworkers found that the most common category of missing ICP data was data missing completely at random because of a jump in the export file data time stamp. 11 Filling in the missing values in the time series, when possible, allowed us to analyze the physiological data trends from participants with different clinical outcomes and to understand the temporal correlation among different variables. There are several studies that have investigated methods for handling missing data TBI clinical research. Feng and coworkers introduced a re-usage strategy for incomplete brain monitoring data. 12 They suggested that the data imputation should be implemented if the estimated imputation error falls within the expert-defined threshold. Otherwise, the available data without imputation should be used. Additionally, specifying reasons for missing data could assist in correcting for confounding variables. 13
We explored several imputation methods including interpolation, Kalman smoothing, using the last or next observation, single value inputation, and expectation–maximization (EM) algorithm. We simulated missing values by randomly removing data points from complete cases. Root-mean-square eror (RMSE) amd mean absolute deviation (MAD) were used to assess the performance of imputation approaches. We found that imputation using linear weighted moving average (LWMA) was robust to different levels of missingness and outpeformed other benchmarking methods. Therefore, we decided to adopt LWMA to impute missing values, in which weights decrease in arithmetic progression. The observations adjacent to a central value have weight one half, the observations one further away (
Data harmonization
Our team (consisting of clinicians and statisticians) conducted a preliminary assessment of the data dictionaries of the studies and descriptive statistics of the data sets to determine which variables were the same or similar and could be harmonized. Studies' protocols and data collection practices were reviewed to identify differences in interpretation of similar variables.
Using data from the above-mentioned studies, we integrated non-dynamic predictors (in-hospital admission, demographic, and clinical data), dynamic predictors (physiological data, summarized as in our previous manuscript 14 ), and outcomes (GOS or GOS extended [GOS-E] at 6 months and Disability Rating Scale).
Table 2 displays the demographic, physiological, and outcome variables that either (1) used a common definition (green), (2) could be mapped to a common definition (yellow), or (3) were not available or not able to be harmonized to a common variable (red). Most demographic and baseline injury severity variables could be harmonized among studies (with a few exceptions). All studies collected the GCS and components, pupil reactivity, age, presence of subarachnoid hemorrhage (SAH), subdural hematoma (SDH), epidural hematoma (EDH), glucose, sodium, and hemoglobin. Some variables were not included in FITBIR but were available directly from investigators (via secure File Transfer Protocol [sFTP]). Race and ethnicity were recorded separately for some studies and combined in other studies; however, we harmonized these into a common NIH-supported combined race/ethnicity variable (Hispanic, non-Hispanic black, non-Hispanic white). The GCS data elements contained an indicator of whether the patient was intubated on admission. Models have been estimated to impute verbal or eye component scores for individuals who had either verbal or eye component missing and the other two present (n = 81, 5.3%). 15 When applied to our data, we found that the correlation between imputed and actual verbal scores was −0.05 with p = 0.08, not sufficiently high to justify the imputation. We therefore chose not to impute missing GCS components. The timing of the collection of baseline GCS differed by study. ProTECT, EPO, BEST-TRIP, and COBRIT were at study enrollment; BTGH was in the emergency room; TRACK-TBI was at emergency department arrival, and BOOST-2 was at admission.
Data Harmonization Among Various Studies
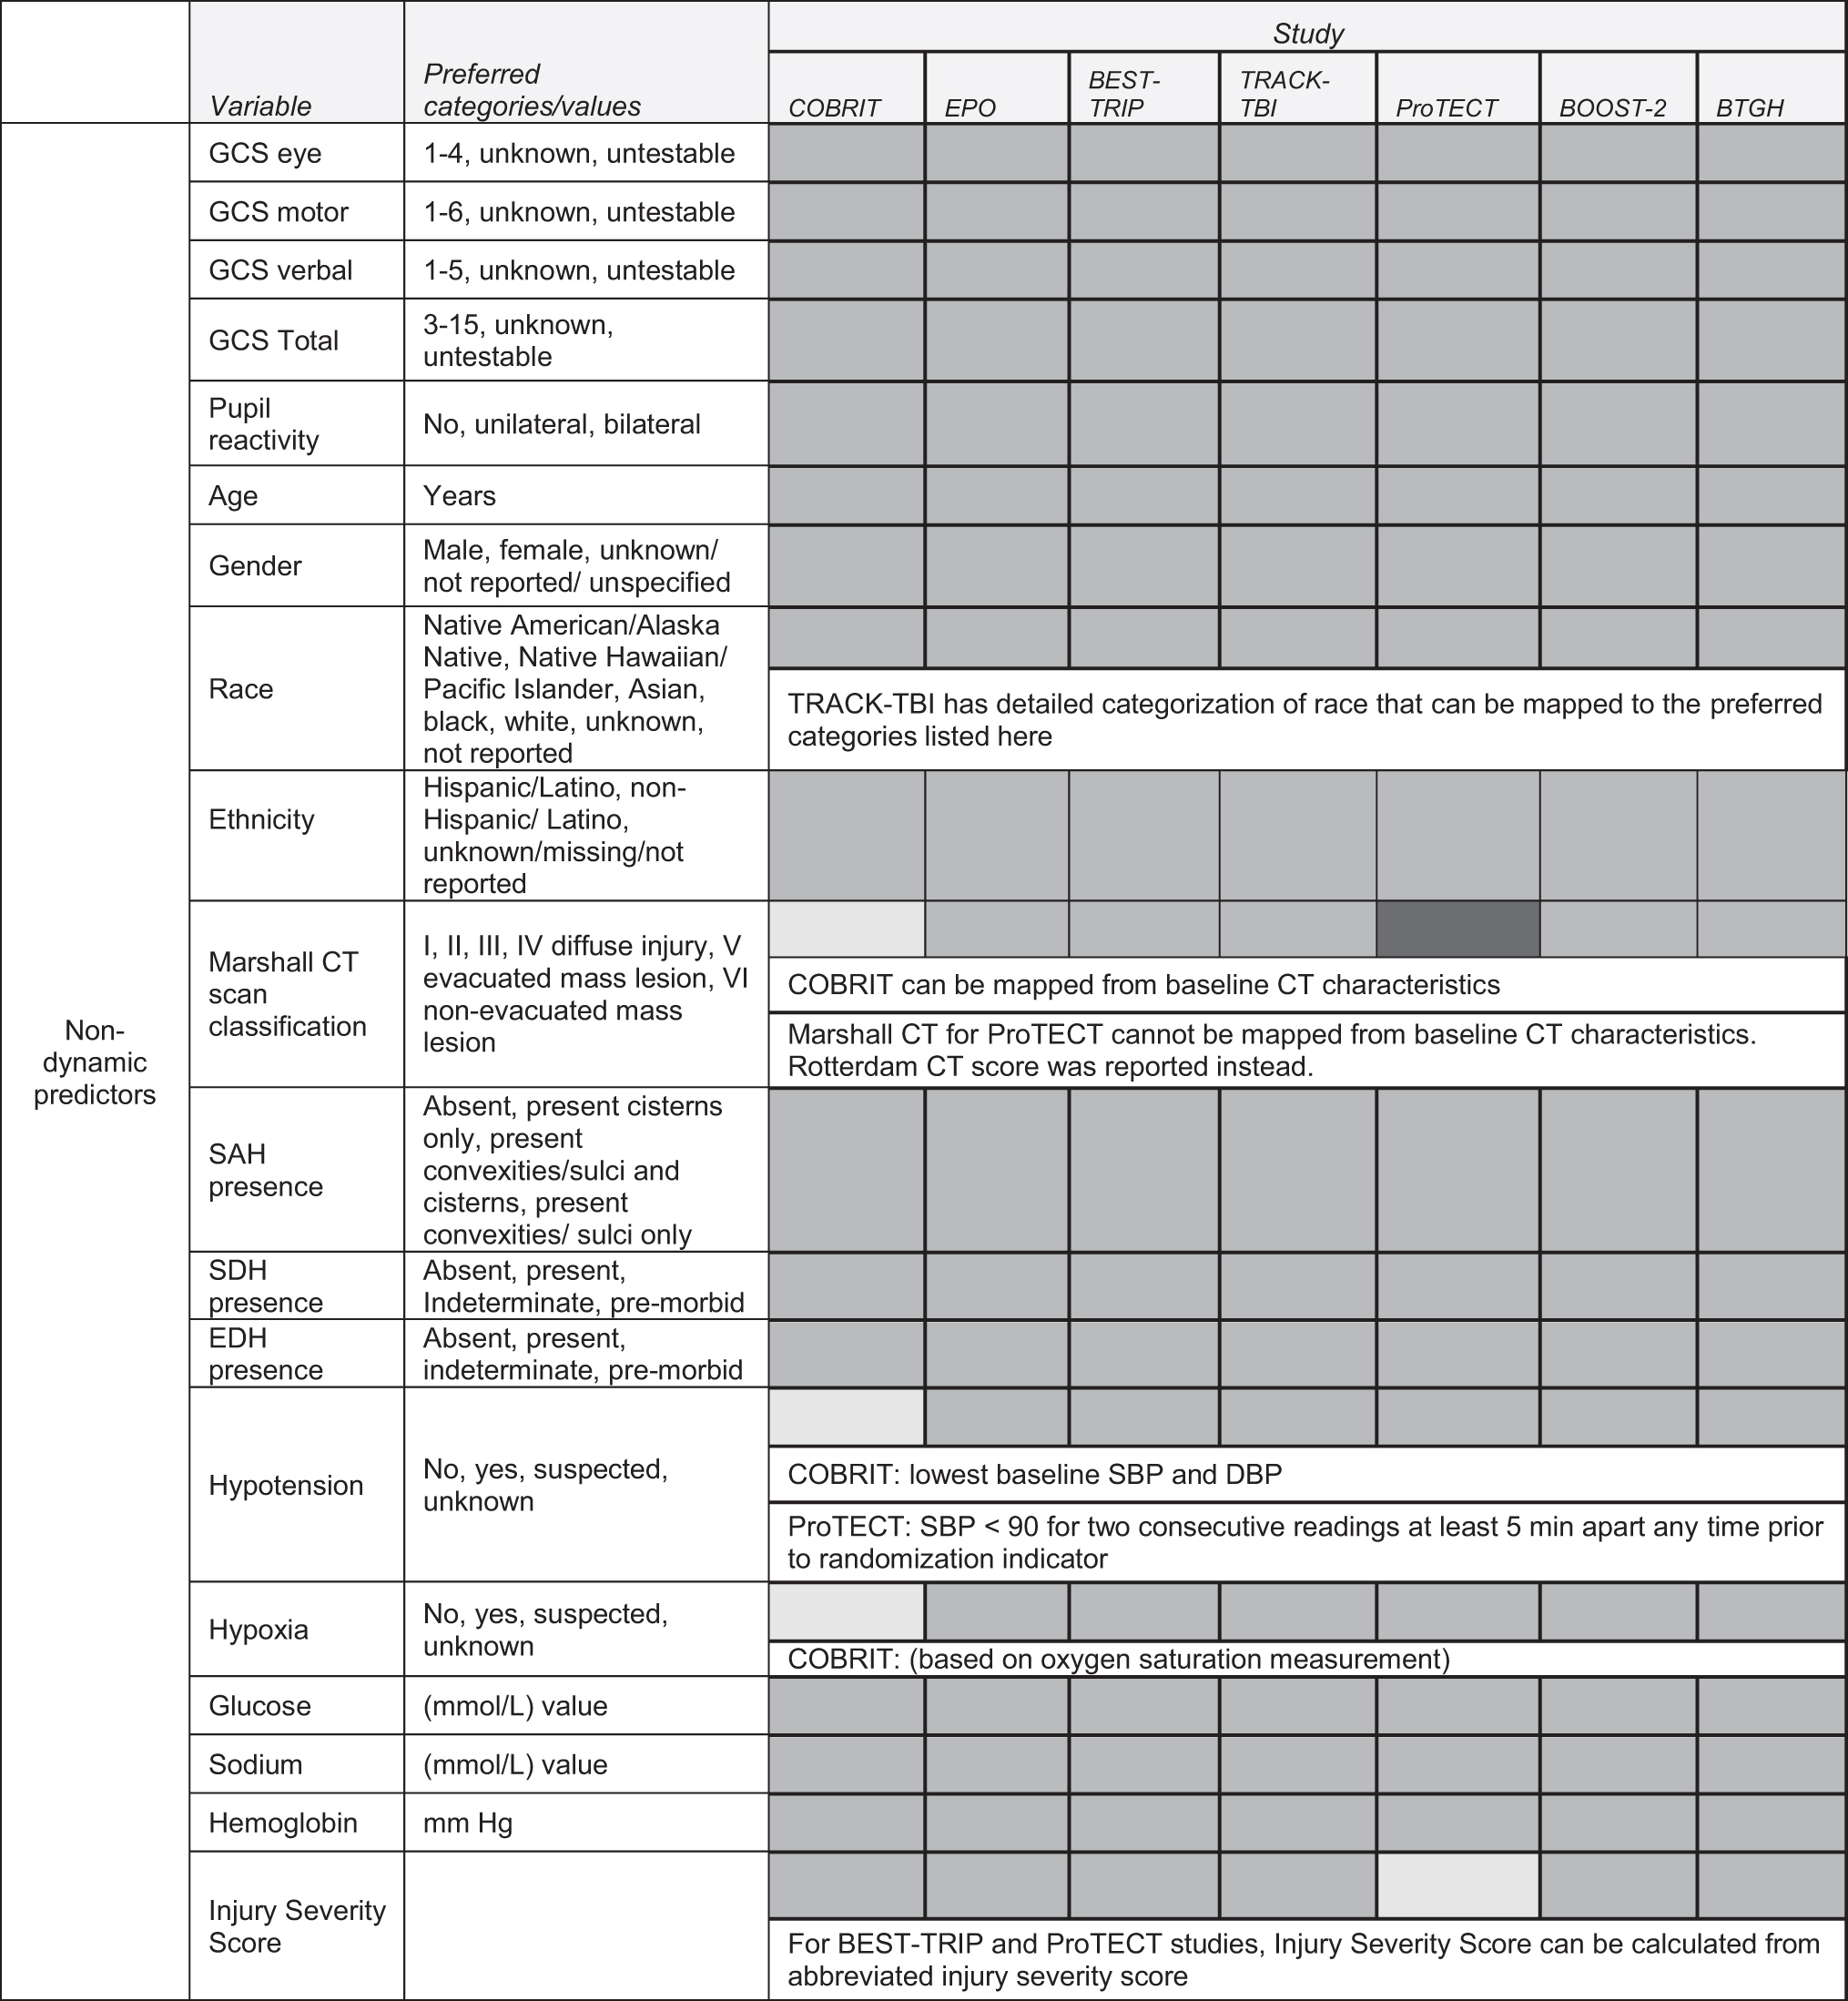
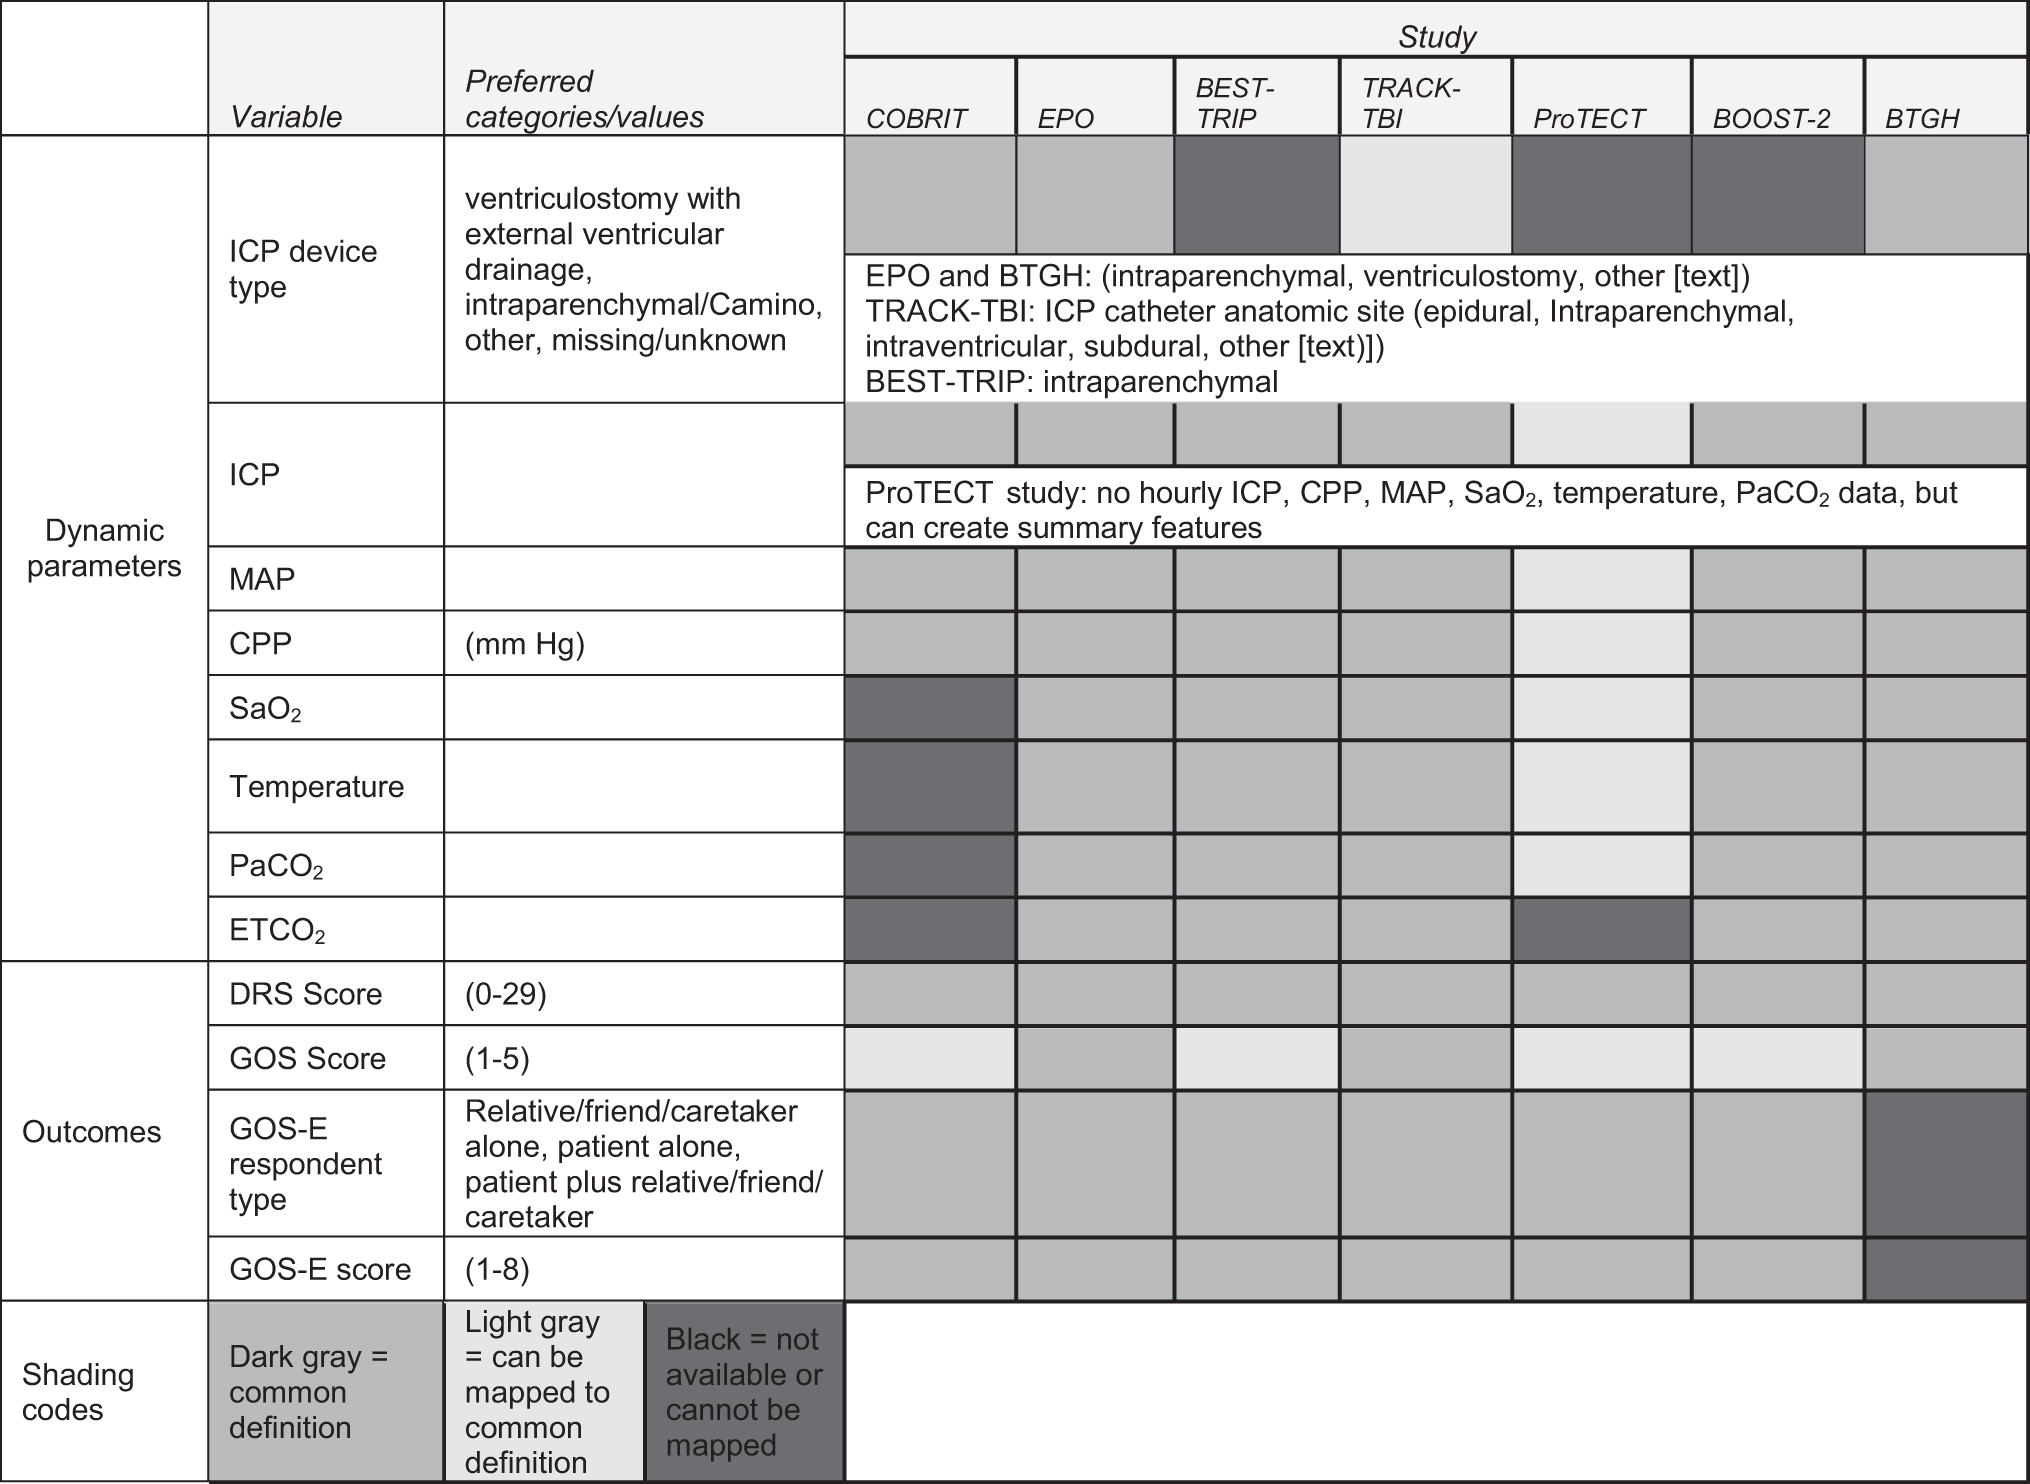
COBRIT, Citicoline Brain Injury Treatment Trial; EPO, Effect of erythropoietin and transfusion threshold on neurological recovery after traumatic brain injury: a randomized clinical trial; TRACK-TBI, Transforming Research and Clinical Knowledge in Traumatic Brain Injury; ProTECT Trial, Progesterone for the Treatment of Traumatic Brain Injury III Clinical Trial; BOOST-2 Trial, Brain Oxygen Optimization in Severe Traumatic Brain Injury Phase-II; BTGH, Ben Taub General Hospital; GCS, Glasgow Coma Scale; CT, computed tomography; SAH, subarachnoid hemorrhage; SDH, subdural hematoma; EDH, epidural hematoma; SBP, systolic blood pressure; DBP, diastolic blood pressure; ICP, intracranial pressure; CPP, cerebral perfusion pressure; MAP, mean arterial pressure; DRS, Disability Rating Scale, GOS, Glasgow Outcome Scale; GOS-E, Glasgow Outcome Scale – Extended.
The Marshall computed tomography (CT) scan classification was not available for all studies. We mapped the baseline CT characteristics for COBRIT. However, the ProTECT study used the Rotterdam CT score instead of the Marshall CT so we were not able to harmonize this variable among all studies. Some studies reported whether the patient had hypotension at baseline. For COBRIT, we inferred this using the baseline blood pressure (BP) measurements and defined hypotensive as <90 mm Hg. For ProTECT, investigators defined hypotension as having systolic blood pressure (SBP) <90 mm Hg for two consecutive readings at least 5 min apart any time prior to randomization. For BTGH and EPO severe TBI, hypotension was based on the pre-hospital SBP when available, otherwise the emergency department first hour SBP <90 mm Hg was used. Hypoxia at baseline was available as a variable for six of the databases and we inferred this for the seventh database based on oxygen saturation measurements. The injury severity score (ISS) was calculated from the abbreviated ISS for the BEST-TRIP and ProTECT studies, and was otherwise available for other studies.
The longitudinal physiological data presented the most harmonization challenges. EPO, BTGH, TRACK-TBI, and BOOST-II studies recorded high-frequency physiological data (not all using the same frequency interval); BEST-TRIP, BTGH, COBRIT, EPO, and TRACK-TBI had hourly data; and one study (ProTECT) had these summarized as transgressions. We therefore harmonized at three levels of granularity, depending on availability: (1) at the transgression level (using all studies), (2) using hourly measurements, and (3) using high-frequency measurements mapped to a common grid.
Transgression harmonization
The ProTECT trial recorded transgressions for several measures including ICP
Hourly harmonization
BEST-TRIP, BTGH, COBRIT, and EPO severe TBI studies had one physiological measurement recorded per hour. The TRACK-TBI trial recorded ICP, CPP, and MAP values as often as every 15 min for each patient, but mostly once an hour. In order to harmonize with the hourly measurements from other studies, we extracted the records to put the TRACK-TBI study 15-min data on an hourly grid. The de-identification of the timing (not having the exact time, but rather the relative time after injury) posed a challenge in choosing a single hourly value. We examined the amount of missing ICP and temperature data for each of the four 1-h increments (starting at each 15-min interval) and chose the grid with the least amount of missing data. We then extracted the values of ICP, CPP, and MAP on the determined hourly grid to create hourly physiological data that was harmonized across studies. Because the injury time could occur at any time, and the hourly measurements are dictated by the emergency department schedule (e.g., vital signs are typically measured at the top of the hour), the 1-h increments (relative to the time after injury) do not necessarily lie on the same grid between studies. Because of the de-identified relative times to injury, we did not have the time of day for each measurement, and therefore had to infer the data based on data availability.
High-frequency harmonization
The physiological data frequency ranged from once per second to once per minute across studies. For example, the ICP, CPP, MAP, SaO2 and PbtO2 were recorded multiple times per minute by the medical devices in the BOOST-II trial. However, patients were measured twice per minute in the EPO severe TBI and BTGH trials based on different data collection protocols. Therefore, in order to merge data onto a common grid, it was necessary to convert all studies to match that study with the least frequently collected data (once per minute). The high-frequency physiological data also have much larger variations and outliers, which can be introduced by the technical noises from medical devices. To harmonize the studies, we used repeated median filters, and removed subsequent outliers. The repeated median filter
16
–18
extracts the signal from time series by means of repeated median regression in a 1-h moving time window. The median of these observations of a moving time window
Treatment tiers
To support a future analysis to prognostically predict 6-month GOS/GOS-E using treatment tiers, we harmonized available data from two of the included studies. TRACK-TBI recorded treatment intensity level daily, and harmonization with the other studies was not possible and therefore was excluded. In BOOST-II, tiers and treatments are structured as events. In BEST-TRIP, treatments are recorded on an hourly basis in which all treatments provided in the previous hour are reported. To harmonize these inter-study approaches, we converted the hourly treatment data in BEST-TRIP to match the event-based style of BOOST-II. If a treatment was recorded for several consecutive hours, we considered the first hour of that treatment to be an event. If an individual was recorded as receiving a treatment more than once, these were treated as separate treatments if there was at least 1 h without the treatment recorded in between those repeated treatments.
Reference for measurement time points
The timing of events and longitudinal data were measured using time after differing reference events (i.e., time after injury, emergency department arrival, randomization, or study enrollment). To harmonize the timing of the variables, we converted the times to have the common reference of time after injury.
Outcomes
The GOS was published in 1975 as a five-point assessment of global outcome after severe brain injury. 19 To increase the sensitivity of the GOS, categories of outcome were divided into upper and lower bands to create an expanded eight-point scale and a structured version of the GOS-E interview was published to help standardize the assessment. 20 All studies used the extended version of the GOS outcome (GOS-E) except for BTGH, which used the original GOS. Both outcomes were dichotomized as favorable (good recovery or moderate disability, GOS = 4–5, GOS-E = 5–8) versus unfavorable (severe disability, in a vegetative state, or dead, GOS = 1–3, GOS-E = 1–4) in order to map to a straightforward common outcome.
There may be other factors in the outcome assessments that could have differed among the studies used. 21 The GOS and GOS-E can be administered to assess the consequences of all injuries, including polytrauma (EPO, BTGH, COBRIT, BEST-TRIP, and TRACK-TBI), or they can be used to focus on the specific effects of TBI (ProTECT and TRACK-TBI). 21 TRACK-TBI collected GOS-E using both modalities. The assessment for BOOST-II was not documented. In addition, assessment of GOS and GOS-E can be done in person, by phone interview, or by sending the subject a form to complete and mail back. Outcome data can be curated locally or by a central process (TRACK-TBI and ProTECT). The approach used in each of the clinical studies to collect and curate the outcome data differed by study. The Disability Rating Scale was available for all studies.
Analytic data sets
We created several data sets for analysis ranging from (1) using all of the data sets adopting the lowest common denominator form of variables (e.g., studies with high frequency were summarized into transgressions to be able to harmonize with ProTECT), to (2) using the subset of data sets where we were able to keep the “ideal” form of the variables that did not lose information by re-categorization or summarizing (e.g., using the subset of studies that recorded the high-frequency physiological data). Using this dynamic approach will allow the exploration of novel ways to use longitudinal high-frequency data and leverage larger sample sizes using simpler models.
File types and computational burden
Extracting and processing the high-frequency physiological data was the most computationally challenging aspect of the process. A high performance computing HPE server with 36 cores-72 threads, 768 GB memory, and 2 NVIDIA V100 graphics processing unit (GPU)/16GB was used to conduct data manipulation, imputation for missing values, and smoothing to remove outliers.
Other variable considerations
Some studies provided the final calculation for Marshall CT, Abbreviated Injury Scales (AIS), and ISS, but did not include the components used in the calculations. Further, other studies did not provide the final score and were missing some of the components needed for these calculations. Missing components and total scores made it difficult to standardize across studies. Additionally, a few variables, such as mechanism of injury, did not have standard categories across the studies. Studies with more detailed descriptions of mechanism of injury were matched to studies with larger groups. All of these steps required the expertise of TBI clinicians. Lastly, the data needed was not always available in one data source, requiring us to pull data from FITBIR as well as raw data from the researchers.
Data system development
We developed a data system to securely manage, maintain, and curate data and resources for the various multi-center TBI studies. The data system, referred to as the i-multiTBI platform, hosts the database system for the data sets from various TBI studies along with the integrated dataset(s). Figure 3 shows the design of the i-multiTBI platform (main features and core components). This design provides flexibility and scalability to incorporate future studies. The platform, deployed behind the schools' firewall, provides a secure environment that allows data from multiple sources to be ingested and integrated into a common data model. The ingested data are then re-coded and standardized, and data quality is controlled through multiple components within the platform. The platform includes layered security controls to protect all of its components and fine-grained access control is enforced when the data request is processed.
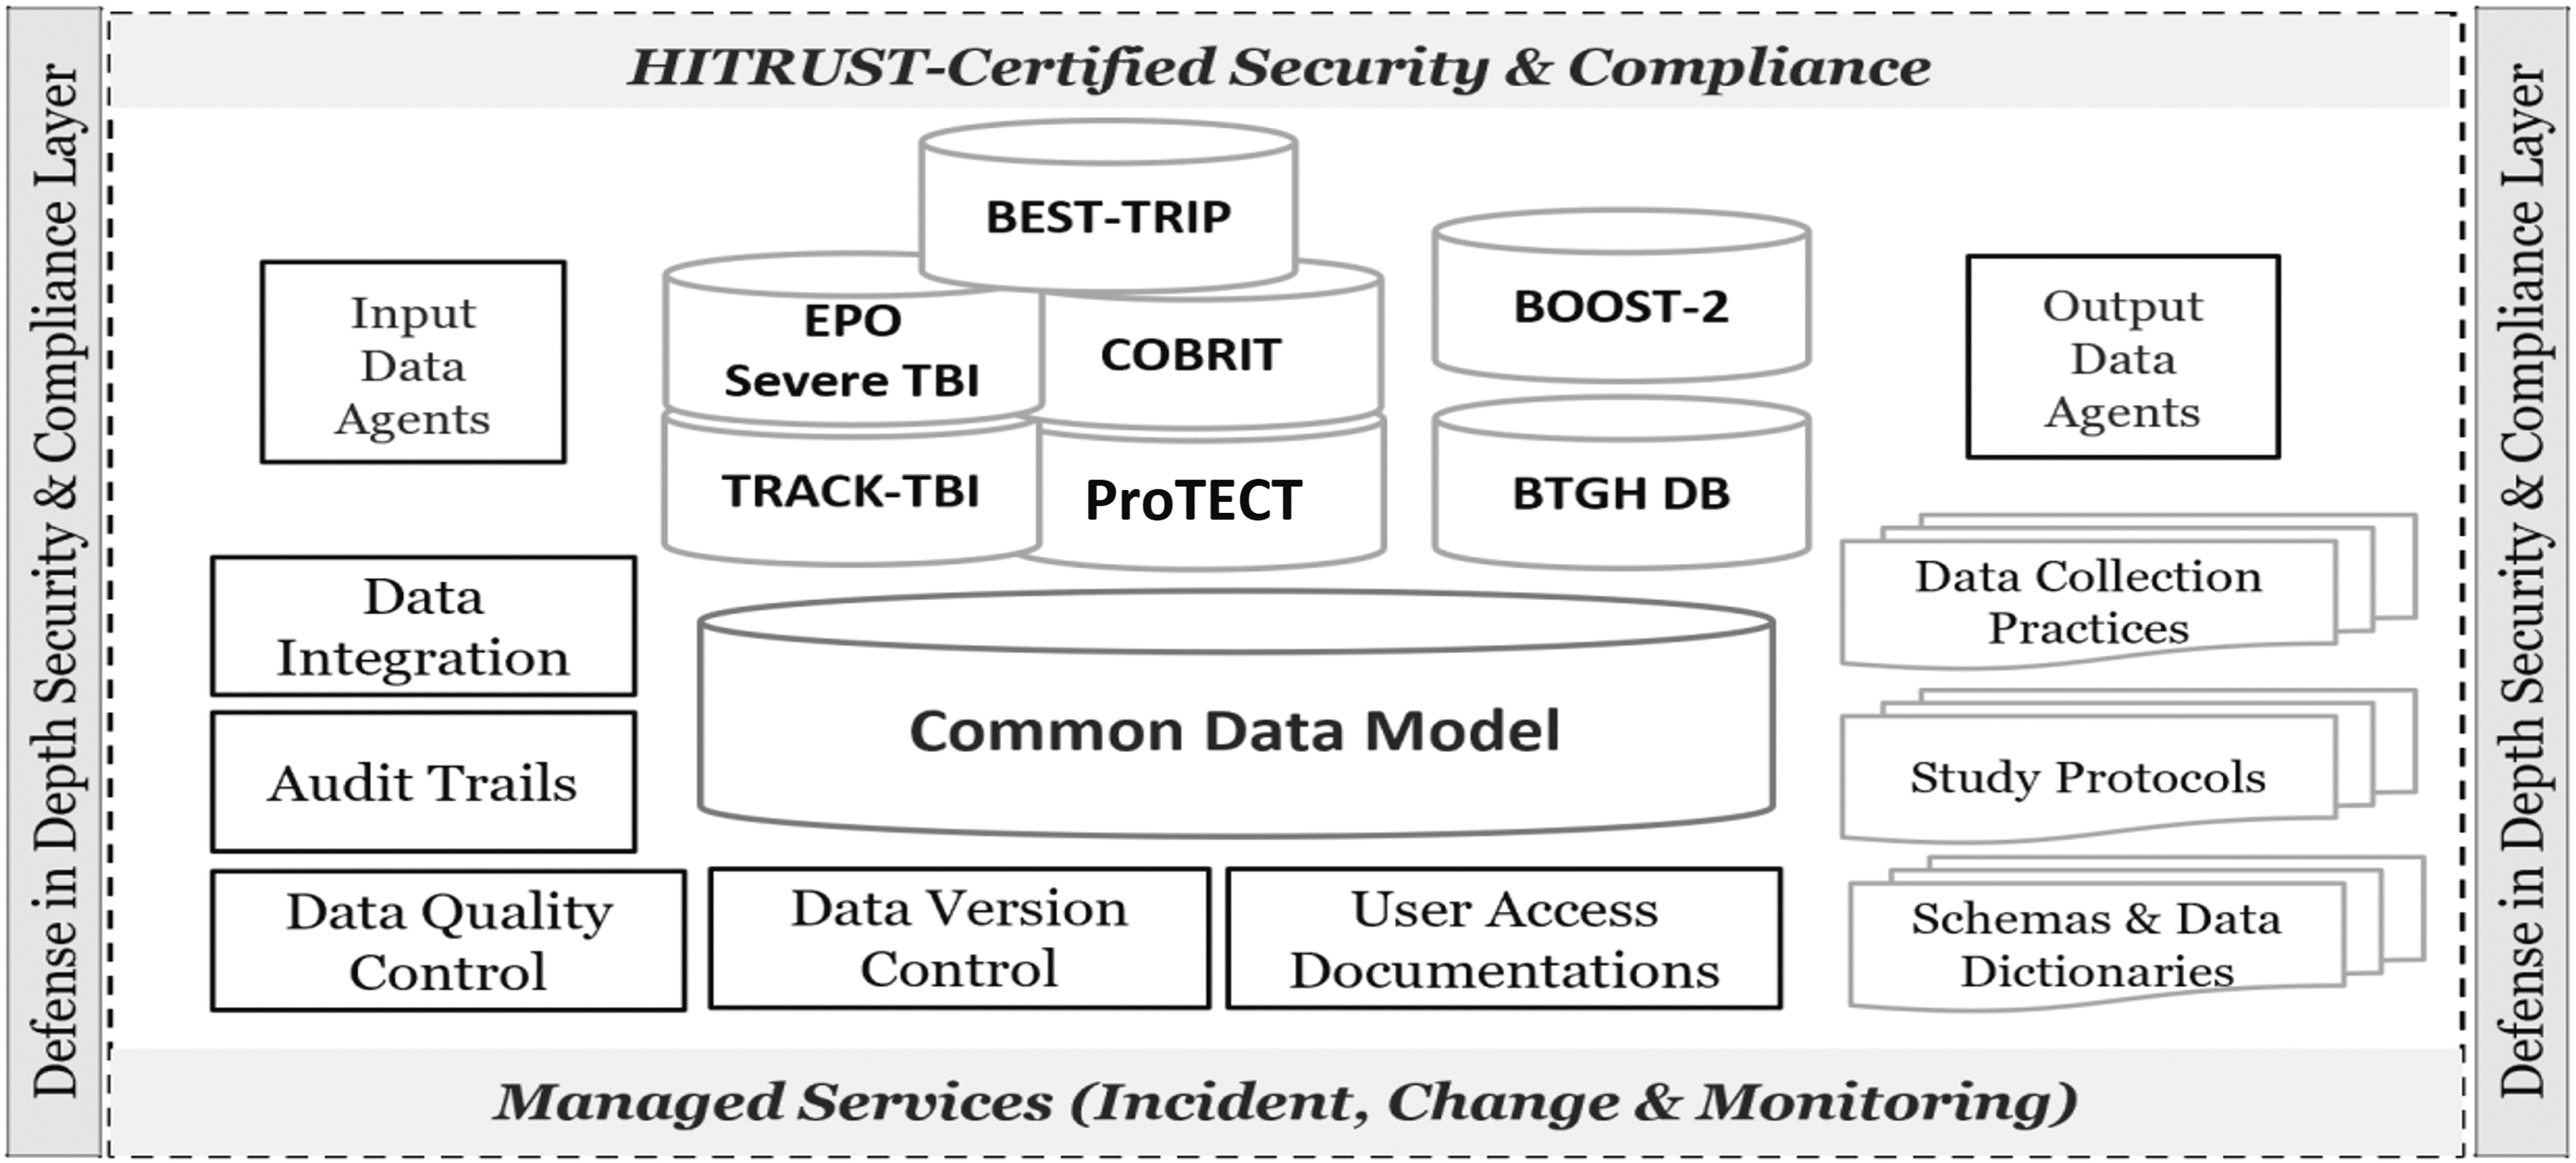
i-multiTBI platform for data harmonization and curation: system architecture and components.
The i-multiTBI platform represents a comprehensive data system with the following critical features and components. Input/output data agents: agent scripts that can connect to data sources to securely extract data, and securely transfer data to services and interfaces Data integration: combines data sets from multiple studies according to a pre-determined mapping schema Data quality control: pre-configured rules that monitor data quality and alert for any issues Data version control: management of changes to data across time by users Audit trails and user access documentation: keeps a record of data access and data manipulation by users Metadata management: maintains and manages all materials related to the various studies in the platform, including: Schemas and data dictionaries Study protocols Data collection practices Multiple approaches to data access management: accesses management tools that establish fine-grained access rules specified by data owners: Microsoft SQL Server Management Studio: data are accessed through SQL execution REST API: Programming script can access data through REST API call Project Web Application Portal: Through pre-defined query interface, user can specify query criteria and download result data in comma-separated values (CSV) format (Fig. 4). The project portal can be made accessible to approved external researchers (upon institutional review board [IRB] and FITBIR approvals and in collaboration with A.Y. and J.M.Y.).
Data integration and database maintenance
i-multiTBI platform includes a database system developed to host, integrate, and manage the data from all FITBIR and non-FITBIR studies. Figure 5 presents our data management plan. In general, a database system development process can be broken into four stages: data collection, database design, implementation, and database maintenance.
22
For non-FITBIR data, we established a secure channel of communication with the data managers from the various studies to collect their data. We used sFTP, which is an extension of the Secure Shell (SSH) protocol used specifically to securely transfer files over the Internet.
23
Data deposited in FITBIR informatics system were requested and then accessed through the FITBIR Web site at

Project Web application portal.
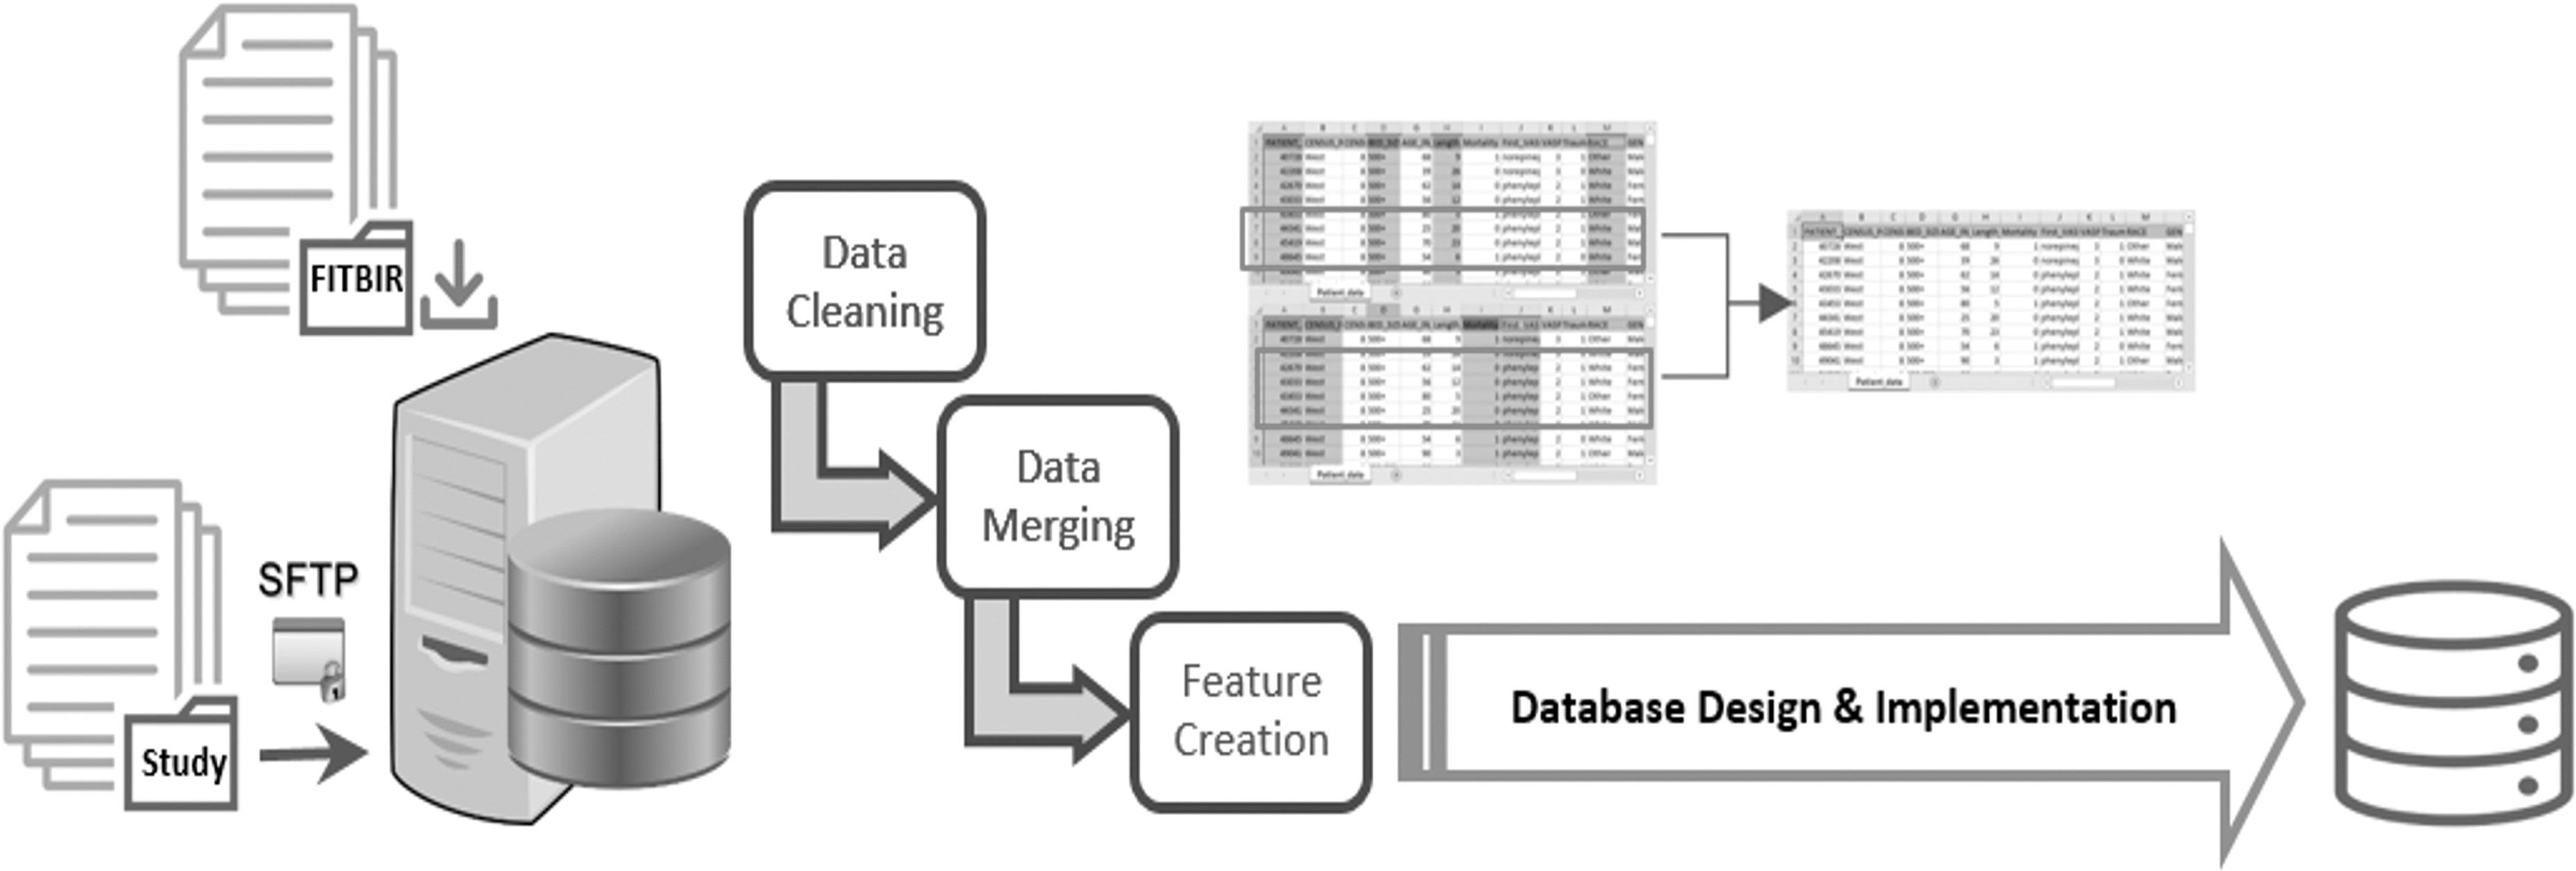
Data management plan.
All technical development of the proposed database system followed the standard Software Development Life Cycle (SDLC) process of Analysis, Design, Development, Testing, and Deployment. 24,25 This included creating inbound data agents to extract data from the different data sources, mapping the different data models into a common model to represent the integrated/harmonized data elements, and creating outbound data agents for data extraction. Database design started with a conceptual data model and produced a specification of a logical schema. The output of this stage was a detailed relational specification of all the tables and constraints needed to satisfy the description of the data in the conceptual data model. Implementation includes the construction of the database using an appropriate storage schema and security enforcement. 22 We used Microsoft SQL Server for database implementation. The database tables are populated with the pre-processed data from all related studies.
In addition to the development of a database system, central to database management is a seamless coordination with team members to ensure data sharing among key personnel through the development and implementation of clear policies and procedures for accessing the data, so that their use can be tracked efficiently. Database maintenance includes operational maintenance to ensure that performance of the database system is maintained at an acceptable level.
Data curation
Data curation improves overall data quality through careful review of processes and procedures related to data collection, documentation, and data exploration. For that reason, our platform maintains and manages all related documents/resources detailing the design and implementation of the various studies, including data collection practices, study protocols, schemas, and data dictionaries (all considered metadata) in addition to the data generated from these studies. Users of the system can examine and review various studies' metadata before combining and then analyzing their data. Careful review of studies' metadata can identify potential differences in administration, collection, procedural differences, measurement, and/or missing data.
Data integration and harmonization are essential functionalities of the platform. A core component of the platform is the common data model, which is a relational data model implemented in a Microsoft SQL database.
Finally, security and privacy capabilities were built into the platform's architecture. The Microsoft SQL server's authentication and authorization were used at the direct database accessing level. An authentication token is required to call REST API, and a Web application portal uses Windows account authentication and implements custom authorization implementation.
Discussion
In this study, we describe our experience harmonizing variables from seven TBI studies, with a focus on creating integrated data sets that incorporate longitudinal physiological data. Combining data from distinctly designed studies requires enormous effort, expertise in multiple domains, and assessment in order to determine whether data sets are compatible for additional analyses. This collaborative work included effort from two MDs with clinical expertise, two biostatistics faculty members, a computer science faculty member, two MS-level biostatisticians, a programmer, and graduate research assistants. Data harmonization and integration are complex processes, but have clear benefits, including larger sample sizes with increased power to answer research questions among heterogeneous and diverse populations, with increased generalizability of research results. The FITBIR has provided a platform for data sharing and standardizing the way that data are collected, promising the acceleration of TBI research by integration of data from several studies. However, a limited number of studies have been published using FITBIR data, mostly using data from a single study, 26 –30 with only one that used two studies. 31 The current study provides proof of concept that analyses can be conducted following integration of five FITBIR data sets.
TBI clinical trials have generally led to negative results. Many reasons probably exist for these trial failures, but one recurring theme is that TBI is a heterogeneous disorder and that various endophenotypes may respond differently to the treatments that are being evaluated in the trials. Additionally, complex relationships between the physiological data and outcomes may require larger sample sizes to model. Large clinical data sets that include detailed physiological data may enlighten the design of future clinical trials by characterizing clinical features that identify endophenotypes stratified by their risk for secondary injury or responses to treatment of secondary injury mechanisms. This study remains the largest sample size used to date to develop prognostic models using physiological data in severe TBI participants. A long-term goal is to use physiological data to monitor a patient's status and to respond precisely and quickly to prevent serious secondary injuries to the brain.
We encountered both expected and unexpected challenges when harmonizing these disparate data sets. Combining data from various distinctly designed studies requires enormous effort and expertise in multiple domains in order to determine whether data sets are compatible for analyses. The scientific community's development of CDEs for TBI, standardized forms for submission of data to FITBIR, and standards for data collection and transparency 32 will help provide consistency in variable definitions in future studies, but several of the studies used in this project were conducted before development of the CDEs. Some of the variables that are important for assessment of injury severity, such as CT scan characteristics, were not reported in the same way and could not be reconciled into a single common scoring system, such as the Marshall CT score. Physiological monitoring to detect secondary brain injuries has increased in its use across studies, but its use and implementation varies. Therefore, there are some practical challenges with integrating these data across studies. Different recording systems used different protocols for labeling and timing of data collection, and different vital signs were available within each data set. Reducing the frequency of the data collection to the lowest common collection rate will maximize the number of data sets available for analysis but will also reduce the time resolution of the higher frequency data sets.
Another major challenge is that management of TBI has evolved over time and affects how data were captured and/or should be analyzed. Clinical trials generally develop standard management protocols that can be very detailed or general. One of the most confounding management differences for the ICP variable is the use of decompressive craniectomy in the treatment of intracranial hypertension. In some of the earlier data sets, decompressive craniectomy was rarely performed. Over time, decompressive craniectomy has become more common and has a significant effect on ICP values. Analyses will need to consider these differences.
Although data sharing has promise for scientific progress, there are several ethical and data sharing issues that need to be considered for future studies. The General Data Protection Regulation of the European Union has set stringent protections for data, and this may present many challenges for data harmonization across studies, particularly in countries where data transfer is not expressly permitted (e.g., currently the United States). Approaches for analyses with European collaborators include sending the data to the European collaborators for analysis or to analyze the data separately using shared code and conduct meta-analyses of the results, although there are limitations with these approaches. All studies included in this analysis were from non-European sites. In the two non-FITBIR studies, the participants were enrolled in studies prior to the establishment of FITBIR (BOOST-2 spanned from 2009 to 2014 and BTGH spanned from 1989 to 2000, and FITBIR was first established in 2012). Participants were not consented prospectively for data sharing beyond their original study. However, the IRB reviewed this study's proposal and approved the research to use the de-identified data sets, because of minimal risk to the participants.
Conclusions
Investigators should consider the following when designing and conducting their future studies. (1) CDEs should be used whenever possible and a well-defined protocol for data acquisition should be included in data submissions to data repositories such as FITBIR. If more granularity is needed than the defined CDEs, the investigators could design categories that cleanly collapse to one of the CDEs to ease harmonization. (2) For high-frequency physiological data, a more standardized recording system for labeling and timing of measurement acquisition would assist with future harmonization efforts. (3) Future harmonization of studies should engage investigators who collected the original data, because questions will arise about how the data were collected, which cannot always be anticipated.
By leveraging data from multiple publicly available TBI trials, we have unprecedented power to build and test prognostic models for the treatment of severe TBI in forthcoming studies. The combined approach benefits greatly from a larger and more diverse patient population, which would not only have higher power to detect differences in GOS outcomes but would also be more generalizable than the analysis of any single data set. This required close collaboration with the principal investigators from the various studies who had intimate knowledge of data issues, extensive data harmonization and integration procedures, and domain knowledge guidance, and the creation of a platform to manage the data. Database maintenance will depend on how much interaction will be needed and if additional FITBIR studies are added. However, we anticipate as more contemporary trials are added that adhere to common data elements, the effort will be much less than for the initial investment. In this article, we described the process for data harmonization and creation of the data platform. This data platform may serve as a resource for the TBI research community upon approvals.
Transparency, Rigor, and Reproducibility Summary
Data sources for this work include Trials and databases deposited and publicly available in FITBIR: (1) COBRIT, 9 (2) EPO Severe TBI/EPO, 4 (3) BEST-TRIP, 5 (4) ProTECT, 6 and (5) TRACK-TBI. 10 Trials and databases not deposited in FITBIR: (1) BOOST-2, 7 and (2) BTGH-Database.
Data deposited in FITBIR were requested and then accessed through the FITBIR Web site at
The individual studies were registered at
Code used to conduct data processing and merging will be made available in FITBIR. The authors agree to provide the full content of the manuscript on request by contacting Jose-Miguel.Yamal@uth.tmc.edu.
Footnotes
Acknowledgments
We acknowledge the many investigators from the various studies including from BOOST II (Carol Moore, MA, CCRC, Lori Shutter, MD, Christopher Madden, MD, Norberto Andaluz, MD, David Okonkwo, MD, PhD, Ross Bullock, MD, John McGregor, MD, Gerald Grant, MD, Mark Shapiro, MD, Michael Weaver, MD, Peter LeRoux, MD, and Jack Jallo, MD, PhD) and from BEST-TRIP (Nancy Carney, PhD, Sureyya Dikmen, PhD, Carlos Rondina, MD, Walter Videtta, MD, Gustavo Petroni, MD, Silvia Lujan, MD, Jim Pridgeon, MHA., Joan Machamer, MA, Kelley Chaddock, BA, Juanita M. Celix, MD, Marianna Cherner, PhD, and Terence Hendrix, BA).
Authors' Contributions
Ashraf Yaseen was responsible for conceptualization, analysis, data curation, writing – original draft, and funding acquisition. Claudia Robertson was responsible for conceptualization, writing – original draft, project administration, and funding acquisition. Jovany Cruz Navarro was responsible for conceptualization, writing – original draft, project administration, and funding acquisition. Jingxiao Chen was responsible for analysis, data curation, and writing – original draft. Brian Heckler was responsible for analysis and writing – original draft. Stacia DeSantis was responsible for conceptualization, writing – original draft, and funding acquisition. Nancy Temkin, Jason Barber, Brandon Foreman, Ramon Diaz-Arrastia, Randall Chesnut, Gerald Manley, David Wright, Mary Vassar, Adam Ferguson, and Amy Markowitz were responsible for writing – review and editing. Jose-Miguel Yamal was responsible for conceptualization, analysis, data curation, writing – original draft, project administration, and funding acquisition.
Funding Information
This study was supported by Department of Defense United States Army Medical Research Acquisition Activity (grant # W81XWH2010770).
Author Disclosure Statement
No competing financial interests exist.