




Abstract
Eye tracking assessments are clinician dependent and can contribute to misclassification of coma. We investigated responsiveness to videos with and without audio in traumatic brain injury (TBI) subjects using video eye-tracking (VET). We recruited 20 healthy volunteers and 10 unresponsive TBI subjects. Clinicians were surveyed whether the subject was tracking on their bedside assessment. The Coma Recovery Scale-Revised (CRS-R) was also performed. Eye movements in response to three different 30-second videos with and without sound were recorded using VET. The videos consisted of moving characters (a dancer, a person skateboarding, and Spiderman). Tracking on VET was defined as visual fixation on the character and gaze movement in the same direction of the character on two separate occasions. Subjects were classified as “covert tracking” (tracking using VET only), “overt tracking” (VET and clinical exam by clinicians), and “no tracking”. A k-nearest-neighbors model was also used to identify tracking computationally. Thalamocortical connectivity and structural integrity were evaluated with EEG and MRI. The ability to obey commands was evaluated at 6- and 12-month follow-up. The average age was 29 (± 17) years old. Three subjects demonstrated “covert tracking” (CRS-R of 6, 8, 7), two “overt tracking” (CRS-R 22, 11), and five subjects “no tracking” (CRS-R 8, 6, 5, 6, 7). Among the 84 tested trials in all subjects, 11 trials (13%) met the criteria for “covert tracking”. Using the k-nearest approach, 14 trials (17%) were classified as “covert tracking”. Subjects with “tracking” had higher thalamocortical connectivity, and had fewer structures injured in the eye-tracking network than those without tracking. At follow-up, 2 out of 3 “covert” and all “overt” subjects recovered consciousness versus only 2 subjects in the “no tracking” group. Immersive stimuli may serve as important objective tools to differentiate subtle tracking using VET.
Introduction
Deaths after brain injury including traumatic (TBI) are largely driven by the decision to withdraw life-sustaining therapies (WLST). 1 –4 This decision is heavily influenced by the assessment of responsiveness in comatose patients. 3,4 Fixation and ocular following of visual stimuli, components of eye tracking, are powerful diagnostic tools for disorders of consciousness and they would benefit from standardization. 5
We previously described the state of “covert tracking” in the intensive care unit (ICU) as the presence of eye tracking discernible on video eye tracking (VET), yet undetectable by bedside assessment in TBI subjects with disorders of consciousness. 6 We have also established a high sensitivity and specificity of VET compared with bedside clinical eye tracking assessments. The ability to identify “covert tracking” has important value in identifying subjects who were misclassified as “no tracking” suggesting a higher state of consciousness; such as minimally conscious state minus (MCS-). 7 MCS- patients are more likely to exhibit fixation and visual pursuit over any other coma recovery scale-revised (CRS-R) items. 7 In a study of four subjects with chronic disorders of consciousness, eye tracking data demonstrated a positive response not detectable on clinical assessment in 81% of discordant trials. 8 Identifying subjects with eye-tracking is important as it may predict higher chances of recovery after injury. 6
The type of stimuli presented for visual tracking will impact a subject response. For example, a mirror may produce an eye tracking response in a patient not tracking on other types of stimuli. 9 Studies have also presented that salient stimuli elicit more on target fixations than a neutral circle. 10
In this study, we use immersive visual and audio stimuli within the same cohort of subjects we studied previously to identify the state of “covert tracking.” 6 Using immersive videos allows us to standardize eye tracking assessments, to minimize examiner dependence, and to provide quantitative assessment through VET. We hypothesized that a subset of subjects who do not demonstrate tracking on bedside assessment or the original “covert tracking” paradigms will track and fixate to videos as they are more salient and are longer in duration. We also aimed to evaluate structural and functional connectivity using electroencephalography (EEG), evoked-potential studies, and magnetic resonance imaging (MRI) to further classify this state.
Methods
Standard protocol approvals, protocols, and subject consents
This single center study was performed between 2020 and 2022 in the Neuroscience ICU at Jackson Memorial Hospital, a level 1 trauma center. This study was approved by the University of Miami Institutional Review Board (IRB #20191143) and the Jackson Memorial Research Office. Data were collected in REDcap (a secure web application for managing databases, approved by the University IRB). 11,12 Written and informed consent was obtained from guardians of all subjects in the study (Consent-Subjects). Written and informed consent was obtained from all healthy volunteers (Consent-Healthy Volunteers). For data collection, we used the National Institute of Neurological Disorders and Stroke Common Data Elements for TBI (STROBE Checklist). 13
Subjects
We recruited a total of 20 healthy subjects and 10 TBI subjects over the study period. This is the same cohort of subjects as described in our prior publication. 6 Our inclusion criteria for TBI subjects were: 1) Age 18 years and older; 2) TBI subjects who were admitted to the Neuroscience ICU; 3) unresponsive to commands (no reproducible movement to commands as per the CRS-R) in the absence of continuous sedation (including fentanyl, propofol, midazolam, dexmedetomidine); 4) no response on the visual scale as per the CRS-R (no visual fixation or pursuit—score 0 or 1); 5) able to perform all usual duties and activities without significant disability prior to injury (Barthel scale of 100 indicating total independence); and 6) the availability of a health care proxy to consent to the study. Our exclusion criteria were: 1) Severe cardiorespiratory compromise and acutely life-threatening conditions at time of enrollment; 2) significant visual impairment prior to injury (defined as blind or legally blind); 3) health care proxy decisions to withdraw life-sustaining therapies; and 4) significant facial fracture or trauma preventing application of the hardware on the subject. Inclusion criteria for healthy subjects included no prior neurological comorbidities, or significant visual impairment (blind or legally blind).
Clinical data collection
Subject demographics (age, sex, race, ethnicity) and clinical details (ICU length of stay, mechanism and type of injury, Marshall CT classification) were collected. 14 Types of injury included subdural hematoma (SDH), epidural hematoma (EDH), subarachnoid hemorrhage (SAH), contusion, and diffuse axonal injury (DAI). Outcome was evaluated at 6- and 12-month follow-up in person if the subject was still hospitalized or via telephone interviews with the subject or their proxy. Outcome evaluation included the Glasgow Outcome Scale-Extended (GOS-E) and the ability to obey simple commands (tongue protrusion, showing two fingers, etc.) at 6- and 12-month follow-up. 15
Clinical and behavioral assessments of eye-tracking
The Coma Recovery Scale-Revised (CRS-R) assessments
CRS-R is a six-dimension, 23-point scale of hierarchically arranged items, and is the current gold-standard for the detection of conscious awareness. 16 CRS-R was performed on the day of the experiment by trained examiners who did not have access to either the VET data or clinician survey.
Surveying clinicians
Both the treating physician and the nurse taking care of the subject were surveyed on the day of the experiment. They were asked if the subject was: 1) tracking; 2) not tracking; or 3) not sure. Clinicians were blinded to both the CRS-R and the VET glasses results.
Eye tracking evaluation using eye-tracking glasses (VET)
We recorded eye movements using methods previously described with the Tobii Pro Glasses 2, which is a commercially available VET system. 6 The light weight of the glasses (45 g) makes them a more practical choice for recording eye movements than traditional head mount systems, allowing for more varied real-life stimuli than screen-based eye trackers. The glasses contain two cameras per eye, a high-definition wide-angle scene camera, gyroscope, and an accelerometer and record at a sampling rate of 50 Hz.
The experiment was performed one or two times depending on the length of the ICU stay for subjects and one time in healthy subjects. Calibration of the eye tracking glasses was attempted as previously described, but successful calibration was not expected nor required for accurate identification of tracking. 8 Subjects viewed videos on a 27-inch monitor presented within an arm's length in front of them. The researcher's confirmed the screen was centered within the subject's field of view through the Tobii Pro Glasses Controller application live viewer.
Possible risks associated with use of VET include agitation, increased intracranial pressure, and increased blood pressure. Therefore, an attending neuro-intensivist was present during all trials and the protocol included stopping the experiment immediately should any significant vital sign changes occur.
Visual stimuli presented in the experiment
Prior to stimuli presentation, verbal arousal was performed by calling the subjects' name. For all subjects we tested the following paradigms to evaluate tracking and fixation to visual stimuli: 1) dancer—a 30-sec video of a male dancer on the beach performing a dance that involves a sequence of horizontal and vertical movements traversing the screen; 2) skateboarder—a 30-sec video of a close-up skateboard crossing the screen with a jump performed in the middle; 3) Spiderman—a 30-sec clip of Spiderman swinging between buildings including circling a construction crane and landing on a flagpole before jumping out towards the viewer (Fig. 1) Each video was presented without sound then again with the corresponding audio (corresponds to the scene). Similar to standard of care practice when assessing eye-tracking, subjects' eyes were gently opened by the examiner while the stimuli were being presented. The examiner was able to verify continued pupil detection while holding eyes open by watching the live-viewer screen throughout stimuli presentation.

Example of video eye tracking in a “covert tracking” subject. Sequential screenshots of video eye tracking of a “covert tracking” subject to
Defining “covert tracking” using VET glasses
Using visual evaluation of the generated videos by the VET
A subject was considered to have “covert tracking” if the reported survey response was “not tracking” or “not sure,” but the eye tracking data satisfied the definition of “tracking.” This definition required both of the following criteria to be met during presentation of the eye tracking video: 1) fixation on the subject (dancer, skateboard, or Spiderman) on two or more occasions at different points in the video; and 2) gaze movement in the same direction as the subject (dancer, skateboard, or Spiderman) on two or more occasions at different points in the video. These criteria were chosen based on the CRS-R criteria for presence of visual pursuit and fixation and modified to be applicable to immersive, video-based stimuli. Two examiners blinded to subjects' data, survey results, CRS-R, and the other examiner's classification utilized this definition to classify each subject's VET. If the two examiners did not agree on a trial, a third blinded examiner was asked to classify utilizing the same definition. It is important to note that the results of the eye-tracking assessments were not shared with the treating clinicians or patient's surrogates. Thus, the results of our assessments have not influenced any goals of care discussion including withdrawal of life-sustaining therapy.
Using machine learning analysis (k-nearest-neighbors algorithm)
We used k-nearest-neighbors (KNN) with stratified 5-fold cross-validation to predict the occurrence of eye tracking in each of the six paradigms. 17 K-nearest is known for its ability to handle a small sample size. For each model, the optimal value of k was selected from the set k = (1, 3, 5, 7, 9) as that which yielded the highest average area under the receiver-operator curve (AUC) across all folds. To rectify class imbalance, minority samples were synthetically generated using Synthetic Minority Over-sampling Technique (SMOTE). Binary classification was implemented based on the labels attributed by the clinician evaluations, such that subjects classified with no tracking reported on the survey were assigned a class label of 0, while subjects classified with tracking on the survey and healthy volunteer subjects were assigned a label of 1. The features we used are listed in the “Statistical analysis” section. All models were evaluated using precision, recall, and AUC. “Covert tracking” was attributed to all false positives. A permutation test was conducted with 1000 iterations to test model validity. All analysis was conducted in custom Python scripts using the scikit-learn library.
Thalamocortical connectivity evaluation using the electroencephalogram (EEG) and evoked potentials
EEGs were obtained as a standard of care at our institution to exclude seizures in unresponsive subjects. EEGs were obtained using a 10-20 system of electrode placement, using 19 EEG channels with adjustments for drains/wounds. EEGs were recorded using digital video EEG bedside monitoring (Xltek; Natus Medical, Oakville, ON, Canada; low-pass filter 70 Hz, high-pass filter 0.1 Hz, sampling rate up to 512 Hz; impedances <10 kΩ). We analyzed quantitative EEG measures using a hierarchical scale previously used (the “ABCD” scale) to evaluate the thalamocortical connectivity. 18 -20 We generated power spectrogram plots from EEG recorded at Cz as previously described to minimize artifact contamination that is most prominent in frontal and temporal channels. 20 We have previously shown that the “ABCD” scale can be used to track recovery over time in subjects with brain injury. 20 The “A”-type represents a complete loss of corticothalamic integrity (< 4 Hz frequencies only). The “B”-type represents a low level of afferent input to neocortical neurons resulting in oscillations of Layer V pyramidal cells in the frequency range of theta (5-7 Hz frequencies). The “C”-type represents a deafferented thalamus firing in burst mode and the afferent volley of synaptic activity with intact neocortical regions “thalamo-cortical dysrhythmia” (theta and beta frequencies). The “D”-type spectrum represents normal corticothalamic integrity with a normal firing of the thalamus and normal resting cortical oscillations (alpha and beta frequencies).
We performed auditory brainstem responses (ABR) and somatosensory evoked potentials (SSEPs) by an intraoperative monitoring technician using Natus/XLTEK Protektor 16 Ch, stimulating bilateral ulnar nerves at the wrist level. Stimuli were applied in an interleaved manner via surface electrodes. Square-wave, monophasic pulses of 0.5 msec duration and at least 2 times motor threshold were used. Stimulus-evoked averages of the EEG were recorded via sub-dermal needle electrodes at CPc-Cpi for differential recording. A ground electrode was placed on the shoulder. Electrode impedances were kept below 5 kΩ. Typically, 750 responses were averaged for each measurement. A high frequency filter was applied at 1 KHz, and low frequency at 30 Hz. SSEPs were classified as present or absent based on the N20 responses. For ABRs, we used bilateral stimulation of the ear with insert-type earphones. Stimuli were 90 dB, 100 msec alternating clicks, applied at a rate of approximately 11.1 Hz. Responses were recorded via electrode pairs at A2-Cz and A1-Cz. A ground electrode was placed on the forehead. Electrode impedances were kept below 5 kΩ. Typically, 1500 responses were averaged for each measurement. A bandpass filter was applied (150 Hz-1.5 kHz). ABRs were classified as present or absent based on the IV and V wave responses. A board-certified clinical neurophysiologist classified the “ABCD,” SSEPs, and ABRs responses.
Structural integrity assessment using neuroradiologic studies
Imaging studies included magnetic resonance imaging (MRI) in seven subjects and computed tomography (CT) in three subjects. We classified the type of injury based on the imaging findings: SDH, SAH, EDH, contusion, intracerebral hemorrhage, DAI, and skull fractures. Additionally, we documented the side of the injury, and the anatomical structures involved in the eye movement network regions (primary visual cortex, middle temporal complex, precuneus, parietal eye field, supplementary eye field, superior frontal eye fields, inferior frontal eye fields, cingulate eye field, dorsolateral prefrontal cortex, thalamus, putamen, caudate, lobules VI and VII of cerebellar vermis, superior colliculus, abducens nucleus, and oculomotor nucleus).21 A board-certified neurosurgeon and neurointensivist classified the area involved by reviewing the susceptibility weighted imaging, diffusion-weighted imaging (DWI), or the CT scan findings.
Thalamocortical microstructural integrity evaluation using diffusion MRI data
Diffusion images were acquired using a 1.5 T MRI scanner following the protocols described in Supplementary Table S1. Images were then corrected for motion and eddy current distortion using motion correction and FSL eddy through the integrated interface in DSI Studio (“Chen” release). The accuracy of b-table orientation was examined during an automatic quality assurance check, which compares fiber orientations with those of a population-averaged template. 22,23 This quality control procedure is conducted to detect incorrect fiber orientations that may be present in the diffusion images. The diffusion data were then reconstructed in the MNI space using q-space diffeomorphic reconstruction to obtain the spin distribution function. 24,25 A mean diffusion distance of 1.25 was used. The restricted diffusion was quantified using restricted diffusion imaging. 26 Finally, to evaluate thalamocortical integrity, diffusion metrics were calculated for the left and right thalamocortical tracts using DWI with b-value lower than 1750 sec/mm2. Diffusion metrics included fractional anisotropy (FA), mean diffusivity (MD), axial diffusivity (AD), and radial diffusivity (RD) are indicators of brain tissue microstructural integrity and changes in these metrics have been associated with pathological conditions including axonal injury. 27 -29
Eye-tracking network structural connectivity evaluation using diffusion MRI data
Fiber tracking was performed in DSI Studio using a deterministic fiber tracking algorithm. 30 An angular cutoff of 55°, step size of 1.0 mm, minimum length of 30 mm, maximum length of 300 mm, 107 seed points, and 0.096 normalized quantitative anisotropy threshold were used to generate the whole brain white matter tracts. Then, the built-in AAL-2 atlas was used for the brain parcellation, and the connectivity matrix was calculated from the number (count) of connecting tracts between respective brain regions. Graph theoretical analyses were applied to obtain weighted global connectivity metrics (efficiency, average clustering coefficient and small-worldness) of the eye-tracking structural network. 31 Efficiency represents the inverse of the average path length connecting all regions of the network. 31,32 Lower efficiency has been associated with cognitive impairment and altered structural brain integrity due to axonal injury or neurological diseases. 33 -35 A clustering coefficient represents the number of nearest neighbors (brain regions) connected to one another, and an average clustering coefficient measures the network's tendency to form dense local clusters and can be lower in disconnected networks. 36 Additionally, a small-worldness network is characterized by a dense local clustering of connections between neighboring brain regions, while having short path connections between any distant pair of regions (long-range connections). 37 All connectivity metrics were evaluated for the eye movement network regions). 21
Statistical analysis
Descriptive data
data were generated to describe the study subjects. Median and 1st and 3rd quartiles were calculated for all the descriptive data.
VET data
We used the summary features of eye-tracking data collected to different visual stimuli (including number of saccades, gaze velocity, average amplitude, direction of saccade, time of interest, area of interest, glances, fixation on target, duration of fixations, and mean and standard deviation of gaze points in three dimensions).
VET videos
We calculated sensitivity, specificity, negative predictive value, false positive rate, false discovery rate, and accuracy of VET-identified eye tracking compared with clinical bedside assessment. We calculated Cohen's kappa to evaluate agreement between the two examiners using the defined criteria for tracking on VET. Cohen's kappa is interpreted as 0.00 to 0.20 is slight agreement, 0.21 to 0.40 is fair agreement, 0.41 to 0.60 is moderate agreement, 0.61 to 0.80 is substantial agreement, and 0.81 to 1.00 is almost perfect agreement. 38 We also calculated Cohen's kappa, sensitivity, specificity, negative predictive value, false positive rate, false discovery rate, and accuracy between the algorithm predictions of eye tracking presence and the examiners utilizing VET.
EEG data
All EEG spectral analyses were carried out in Matlab (Mathworks, Natick, MA) using the Fieldtrip and the Chronux toolbox, as well as custom scripts as described previously. 20
MRI data
Group differences in diffusion metrics (FA, MD, AD, and RD) were evaluated using multiple two-way analyses of variance (ANOVAs). Similarly, group differences in the eye-tracking network structural connectivity metrics (global efficiency, clustering coefficient and small-worldness) were assessed using multiple one-way ANOVAs. Significance was set at p < 0.05 and adjusted for multiple comparisons using Tukey's honestly significant difference post hoc test. All analyses of diffusion MRI structural data were conducted in GraphPad Prism v8.0.0.
Data availability
The data and the codes supporting the findings of our work are available upon reasonable request.
Results
Subjects
We studied a total of 10 TBI subjects and 20 healthy subjects.
Healthy subjects
Average age was 34 years old (Q1 25.25, Q3 44), 40% were male, 15% were Black, and 55% were Hispanic. All healthy subjects completed the VET experiment.
TBI subjects
Average age was 29 years old (Q1 20, Q3 44), 80% were male, 50% were Black, and 40% were Hispanic. The mechanism of injury was motor vehicle accidents in all subjects except for subject 8 (gunshot wound), and subject 9 (fall). Most common injury types were SAH (90%), SDH (80%), contusion (70%), TAI (30%), and EDH (10%). The median for Marshall CT score was 4 (Q1 2.75, Q3 5). The median ICU length of stay was 39 days (Q1 24, Q3 121). All TBI subjects had resting state EEG (first 2 weeks of admission), seven had structural MRIs, nine had SSEPs and ABRs, and all had the VET experiment. (Table 1)
Patients' Demographics, Type of Injury, Behavioral Scales, Survey, Eye-Tracking, and Outcomes
Patient suffered medical complications (sepsis) that resulted in regression of consciousness after initial improvements.
Patient was lost to follow-up before 12-month follow-up after initial improvements.
Patient died from cardiac arrest before 12-month follow-up.
M, male; F, female; W, White; A, Asian; B, Black; H, Hispanic; NH, non-Hispanic; SAH, subarachnoid hemorrhage; CON, contusion, IVH, intraventricular hemorrhage; DAI, diffuse axonal injury; IVH, intraventricular hemorrhage; EDH, epidural hematoma; SDH, subdural hematoma; PID, post-injury day for the experiment; CRS-R, JFK Coma Recovery Scale-Revised; GOS-E, Glasgow Outcome Scale-Extended; w, week; m, month; w/, with sound; w/o, without sound; all, tracking to dancer, skateboard, and Spiderman with and without sound.
Clinical and behavioral assessments of eye-tracking
The subject's nurse and attending physician caring for the subject on the day of the study were surveyed and agreed on the state of tracking in all subjects.
Tracking assessments using VET
Healthy subjects. Gaze plots were generated by Tobii software to visualize the gaze movements for each healthy volunteer and each stimuli video (Fig. 2).
TBI subjects. There were no adverse events associated with the experiment. Gaze plots were generated by Tobii software to visualize the gaze movements for each subject and each stimuli video (Fig. 2).
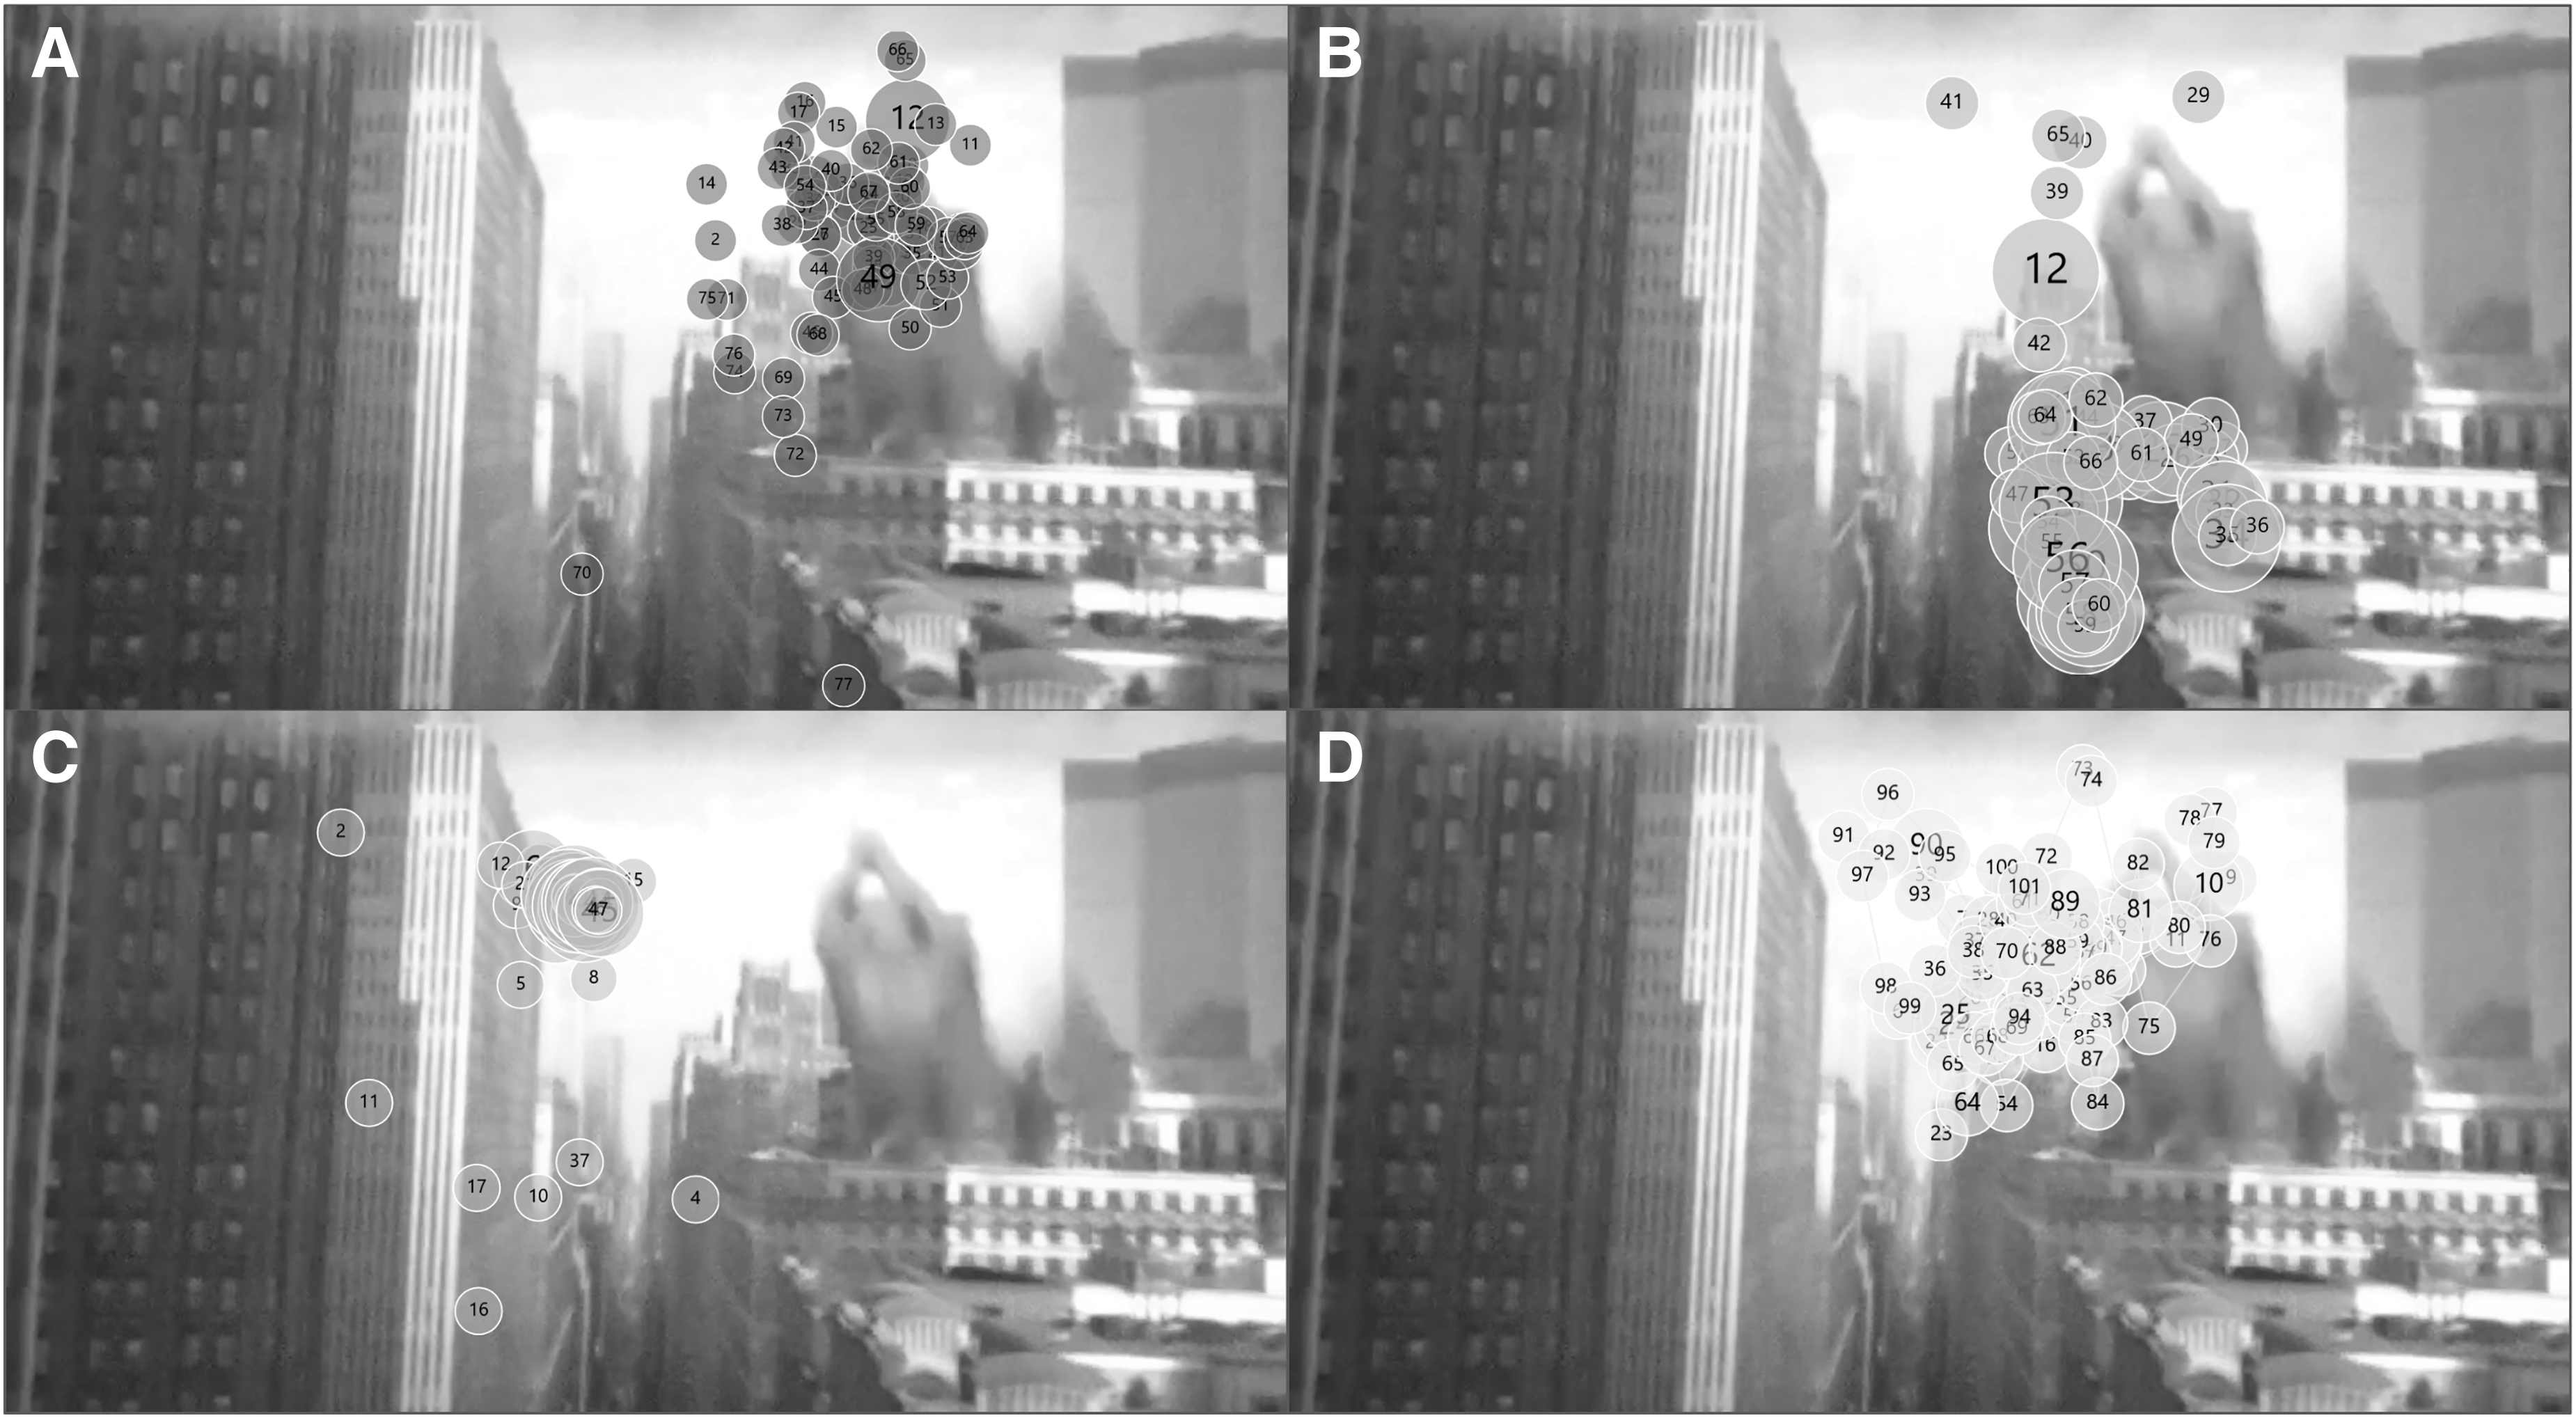
Gaze plots generated by Tobii software showing location and number of fixations recorded throughout the entire Spiderman with sound video.
The original two examiners, adjudicating the VET videos, achieved a Cohen's k of 0.8 (confidence interval [CI] 0.7 to 0.96) equating to almost perfect agreement. Three subjects had “covert tracking” (CRS-R of 6, 8, 7), two subjects had “overt tracking” (CRS-R 22, 11) and five subjects had no tracking on clinical examination or using the glasses (CRS-R 8, 6, 5, 6, 7). Overall, there was no meaningful difference in the presence of tracking between trials with or without corresponding audio. For the dancer video, the video with sound had one fewer trial with tracking present. For the skateboard and Spiderman videos, the same number of tracking trials were present equally with and without sound. None of the covert tracking subjects had better than “startle” response on CRS-R (Table 1). We found the performance of VET compared with the current standard of care (clinical exam) to identify tracking to have a sensitivity of 100%, specificity of 85%, negative predictive value of 100%, false positive rate of 13% (covert tracking), false discovery rate of 48%, and accuracy of 87%. Among the 84 tested trials (six videos per subject and four subjects with two trials), 11 trials (13%) between three subjects met criteria for tracking despite no tracking identified by clinicians by clinical examination (current gold standard). False positive rate is defined as subjects identified as tracking by VET and missed by gold-standard clinical exam, therefore these subjects were considered to have “covert tracking” (Table 2). Video examples are provided in the supplementary materials of each tracking state (Supplementary Videos S1, S2, and S3).
Confusion Matrix for VET and Clinicians' Assessment of Tracking Trials
VET, video eye-tracking.
The performance of the k-nearest algorithm predictions had a sensitivity of 61%, specificity of 86%, negative predictive value of 82%, false positive rate of 9.7%, false discovery rate of 33%, and accuracy of 78% (Supplementary Table S2). The Cohen's k between the machine learning predictions of eye tracking presence and the examiners' identification is 0.5 (CI 0.3 to 0.7) representing moderate agreement. One subject and one trial of another subject did not generate sufficient data to generate predictions resulting in 72 tested trials (six videos per subject with three subjects with two trials), out of which seven trials were labeled as tracking that were not seen to contain tracking by VET (Supplementary Table S3). Of the six paradigms, four produced eye tracking data, which enabled a KNN model to predict whether tracking occurred above chance level. The mean recall of 0.89 suggests that these four models were able to identify overt tracking subjects and healthy volunteers. “Covert tracking” was attributed when the model predicted tracking for a negative instance, which was expected to occur more frequently for subjects assigned the “covert” label than for those with “no tracking” (35% for “no tracking” and 45% for “covert tracking” subjects; Supplementary Table S4). Confusion matrices are presented in Supplementary Figure S1 and the VET schematic is presented in Supplementary Figure S2. No adverse events occurred as a result of VET use.
The thalamocortical integrity evaluation using the “ABCD” model
On average, TBI subjects had a median of 11 clips of 25-min-long EEGs (total of 105) in the first 2 weeks after injury. We classified 92 clips (88%) using the “ABCD: scale, 13 clips (12%) had artifacts preventing proper interpretation. Lower thalamocortical integrity patterns were observed more in the “no tracking group” (C, B, B, C, D) while higher thalamocortical integrity patterns were observed more in the “overt” (D, D) and “covert” (C, D, D) tracking groups (Table 3; Fig. 3).

The “ABCD” scale to evaluate thalamocortical integrity using resting state electroencephalography (EEG). Examples of each type of the “ABCD” scale to evaluate the thalamocortical integrity using resting state EEG. Types “A” and “B” represent low levels of thalamocortical integrity; types “C” and “D” represent high levels of thalamocortical integrity.
Electrophysiologic and Structural Findings
SSEP, somatosensory evoked potential; ABR, auditory brainstem response; BL, bilateral; UL, unilateral; MRI, magnetic resonance imaging; SWI, susceptibility weighted imaging; DWI, diffusion weighted imaging; CT, computed tomography; PVC, primary visual cortex; MTC, middle temporal complex; PCUN, precuneus; SEF, supplementary eye field; SFE, superior frontal eye field; DPC, Dorsal Prefrontal Cortex; THA, thalamus; PUT, putamen; OcN, oculomotor; IFE, inferior frontal eye field; CEF, cingulate eye field; CAU, caudate; PEF, parietal eye field.
Structural integrity using neuroimaging and evoked potentials
Structural integrity evaluation based on evoked potentials: SSEPs were present (N20 responses) bilaterally in eight of the nine tested subjects. Subject #5, who had a “no tracking” state, had N20 response unilaterally. ABRs responses were present bilaterally in six of the nine tested subjects, and unilaterally in the remaining three of the nine tested subjects (Table 3).
Based on imaging, subjects with “overt” and “covert” tracking had fewer structures injured in the eye tracking network when compared with the “no tracking” group (Table 3).
Thalamocortical microstructural integrity using diffusion MRI data
Results from multiple two-way ANOVAs showed a main effect of group in FA [F(2,6) = 12.71; p = 0.007], MD [F(2,6) = 11.48; p = 0.009], AD [F(2,6) = 6.07; p = 0.036], and RD [F(2,6) = 13.18; p = 0.006]. Subsequent post hoc analysis showed that FA was significantly lower in the “no tracking” subjects compared with healthy volunteers in both the left and right thalamocortical tracts (Fig. 4A). Similarly, FA was significantly lower in the “covert” subjects than in the healthy volunteers in the right thalamocortical tract (p = 0.028). In addition, MD was significantly higher in the “no tracking” subjects compared with the healthy volunteers in both the left and right thalamocortical tracts and compared with the “covert” subjects in the right thalamocortical tract (Fig. 4B). RD also was significantly higher in the “no tracking” subjects compared with the “covert” subjects and healthy volunteers in the right thalamocortical tracts (Fig. 4C). Finally, RD was significantly higher in the “no tracking” subjects compared with the healthy volunteers in the right thalamocortical tract (Fig. 4D).
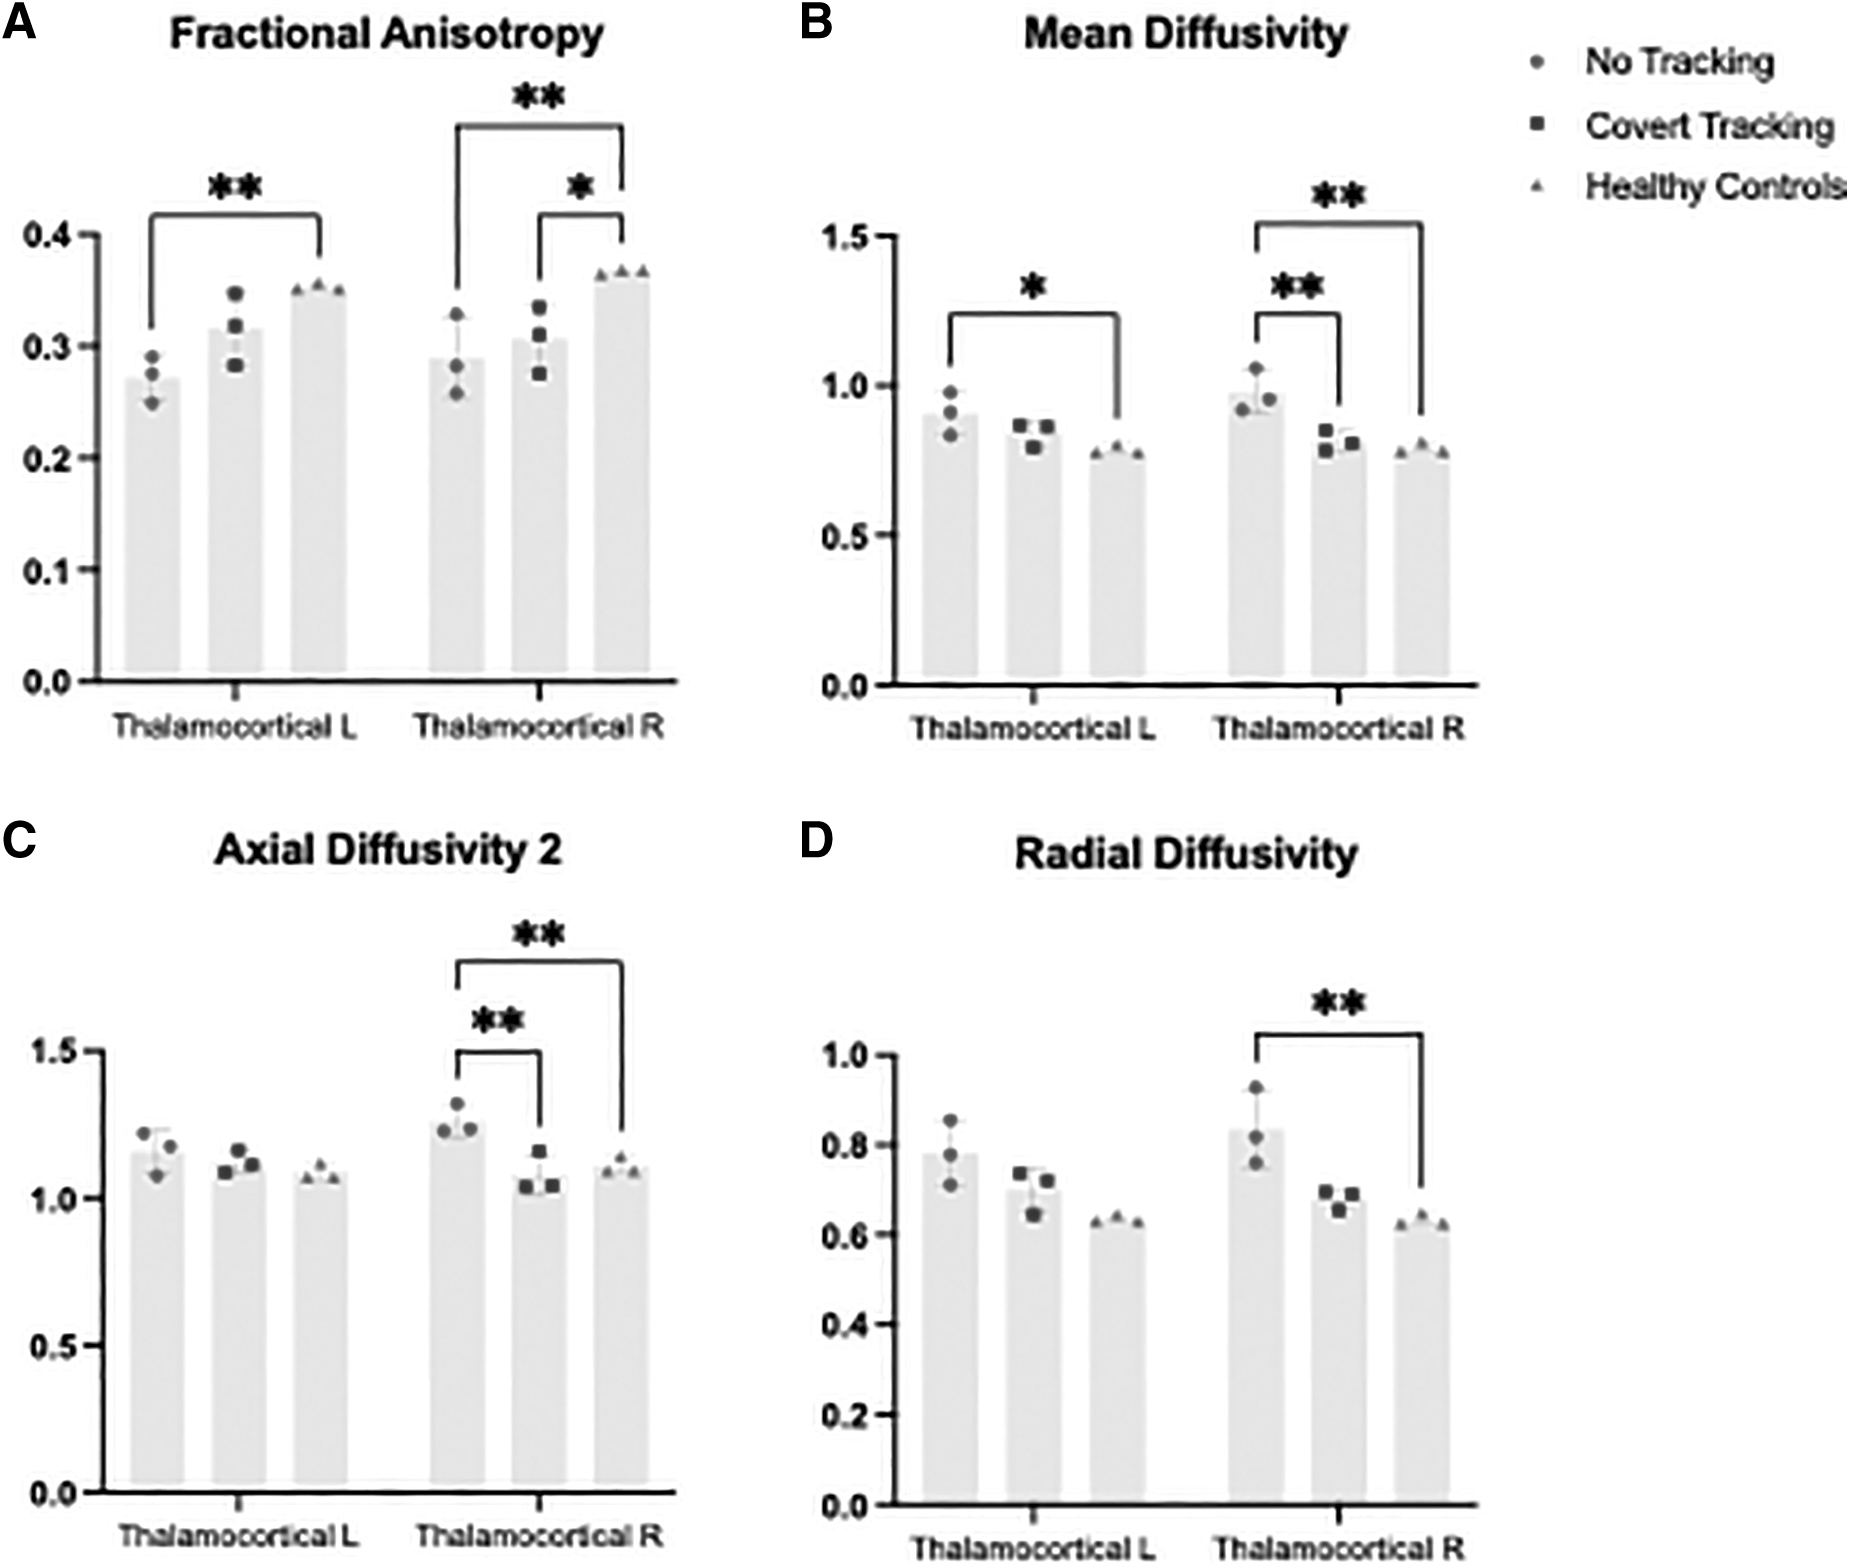
Diffusion metrics in the no tracking, covert tracking, and healthy volunteer groups. Mean values of diffusion metrics from the thalamocortical tracts for the “no tracking” (n = 3), “covert tracking” (n = 3), and healthy controls (n = 3) groups.
Eye-tracking network structural connectivity
Significant group differences in global network metrics are shown in Figure 5. The “no tracking” subjects showed significantly lower global efficiency compared with the healthy volunteers (Fig. 5A). Similarly, small-worldness and clustering coefficient were lower, although non-significant, than the “covert” and “healthy control” groups. (Fig. 5B, 5C) Interestingly, the “covert” subjects presented a higher but not-significant clustering coefficient than the “no tracking” group and healthy volunteers.

Connectivity metrics in the no tracking, covert tracking, and healthy volunteer groups.
Outcomes
At 6-month follow-up, two out of three subjects with “covert tracking” had the ability to obey commands and two out of five subjects without tracking had the ability to obey commands. At 12-month follow-up, one subject with “covert tracking” was lost to follow-up, one was deceased, and one subject suffered complications and regressed. Both subjects with “overt tracking” recovered consciousness at 6 months and had improved further at 12 months (Table 1).
Discussion
This study builds upon our previous work in identifying and further classifying the state of “covert tracking” in unresponsive TBI subjects through the utilization of VET. 6 We successfully identified “covert tracking” in subjects through VET who were deemed to not be tracking on traditional bedside assessments. We also showed higher states of thalamocortical connectivity using EEG and MRI in subjects with overt and covert tracking.
Maximizing the ability to recognize eye-tracking will identify more subjects with MCS, which may portend better functional outcomes. MCS is often misdiagnosed despite the creation of specific tool for diagnosis such as neurobehavioral scales (CRS-R). 39 Focusing on eye tracking will likely provide the best diagnostic sensitivity for MCS, as these patients are more likely to exhibit fixation and visual pursuit over any other CRS-R item. 40 It is important for clinicians to be able to differentiate MCS from vegetative state as subjects with MCS are more likely to improve than those with vegetative state. 41 Identifying covert tracking reflects the underlying function of the eye-tracking network that is not identifiable by the current task or stim-based neuroimaging or electrophysiologic techniques. Additionally, some TBI patients have auditory nerve injury, which may affect the accuracy of auditory tasks or stim-based evaluations.
The use of prerecorded and increasingly immersive visual stimuli provides a standardized, reproducible assessment that does not depend on the examiner. When compared with our previous publication, the video stimuli classified one more subject as “covert tracking” compared with VET of traditional bedside stimuli (tracking to mirror, face, finger, and optokinetic response). 6 For “overt tracking” subjects, both subjects were classified as tracking to all immersive stimuli rather than to three out of four and two out of four traditional bedside stimuli. 6 This difference may be related to the increased saliency of the stimuli or the longer length of time of stimuli presentation. A loved one or caregiver's face is more likely to prompt successful visual fixation or pursuit when compared with a neutral examiner or stimuli. 42 However, the clinical utility of this is dependent on subjects having available family members or loved ones. Using a mirror to test visual pursuit has previously been shown to have a greater potential for response than other types of stimuli. 9,43 However, using a mirror is examiner dependent and limited by the amount of time an examiner can present the stimuli. By employing screen-based pre-recorded stimuli, trials can continue for longer duration and are more standardized.
We chose our three videos in particular to maximize horizontal movement since subjects with MCS preferentially track horizontal movement. 44 We also chose videos with large active movements since brain injury subjects preferentially respond to dynamic stimuli. 44,45 The success of our prerecorded stimuli provides support that the saliency of the stimuli is an important consideration in designing eye tracking assessments. The feasibility and usefulness of screen-based stimuli also allows for streamlined creation of personalized stimuli presentations such as the faces of loved ones or personally compelling images.
As eye tracking technology continues to become more accurate, less cumbersome to use, increasingly affordable, and commercially available, its potential as a powerful clinical tool is growing. Eye tracking videos provide physicians with the ability to standardize eye tracking assessments as well as gather a more objective record of a subject's improvement over time. This study supports the importance and potential of eye tracking technology as a diagnostic and prognostic tool for disorders of consciousness.
The k-nearest-neighbors models were effectively able to predict the existence of eye tracking using features generated by the Tobii device during four of six visual paradigms. Although the small sample size limited the generalizability of these results, as well as the extent that these models could be optimized, the results were encouraging for the use of eye tracking data in machine learning to detect covert tracking of visual stimuli in subjects. Future studies can explore additional eye tracking features as well as evaluate the predictive importance of the features used here.
In this study, we also describe the state of “covert tracking” from both functional and structural standpoints. The “no tracking” group had injuries affecting more than one eye-tracking network area. Similarly, a lower thalamocortical microstructural integrity was found in the “no tracking” subjects compared with “covert” and healthy controls. This was indicated by a lower fractional anisotropy and higher mean, axial and radial diffusivity on MRI and lower “ABCD” scale on EEG. When evaluating the eye-tracking network connectivity, a lower global efficiency in the “no tracking” subjects suggested a greater degree of disconnection, which may affect parallel information transfer within the eye-tracking network compared with the “covert tracking” group and healthy controls. Additionally, a lower, although not statistically significant, small-worldness in the “no tracking” subjects may be due to the loss of long-range connections and a decrease in clustering compared with healthy controls. Interestingly, a trend toward a higher clustering coefficient in the “covert tracking” subjects compared with healthy controls may correspond to an event in which specific regions of the eye-tracking network try to compensate for the structural disconnection (specifically of long-range connections), by forming clusters. Increased connectivity in these regions following TBI might have implications for predicting recovery of consciousness.
Limitations to this study largely stem from the confines of working within the clinical ICU setting and the small sample size. This is a single center study, and our results will need validation on a larger cohort in a multi-center study, across other etiologies of acute brain injury. The number of eye tracking assessments and the timing post-injury of these assessments were not standardized across subjects. This was largely due to logistic constraints related to the acute ICU setting. For the same reason, structural and functional data were obtained earlier than VET data. The study would benefit from additional trials at multiple, standardized times of day to account for established within-day variability of visual pursuit. 46 Additionally, the traumatic brain injuries sustained by our subjects may have resulted in visual or hearing impairment or the development of spontaneous oscillating eye movements that would impair the evaluation of “covert tracking.” However, we noted no spontaneous oscillating eye movements when evaluating the videos. The small sample size is a limitation to generate more advanced machine learning models that can classify the different states. The k-nearest approach we used here can handle small amounts of data. 17 A longer follow-up period would also improve the clinical significance of outcomes for our cohort of subjects.
Conclusion
In conclusion, this study demonstrates that immersive stimuli may serve as important objective tools to differentiate subtle tracking using VET. Future studies with a larger cohort are needed to further classify the “covert tracking” state and its potential as a prognostic tool in both traumatic and non-traumatic injuries.
Transparency, Rigor, and Reproducibility Summary
The study was pre-registered at
Footnotes
Acknowledgments
Thank you to the attending physicians, fellows, residents, nurses, and support staff of the Department of Neurology at the University of Miami Miller School of Medicine and Neuroscience Intensive Care Unit at Jackson Memorial Hospital for their support.
Authors' Contributions
Study concept and design: Ayham Alkhachroum and Gabriela Aklepi.
Acquisition of data: Gabriela Aklepi, Evie Sobczak, Danielle Bass, Pardis Ghamasaee, Daniel Samano, Carlos Francisco Blandino, and Ana Bolanos Saavedra.
Analysis and interpretation of data: Ayham Alkhachroum, Gabriela Aklepi, Amin Sarafraz, Linda Robayo, and Brian Manolovitz.
Drafting the manuscript: Ayham Alkhachroum, and Gabriela Aklepi.
Critical revision of the manuscript for important intellectual content: Carlos Francisco Blandino, Brian Arwari, Nina Massad, Mohan Kottapally, Amedeo Merenda, Salim Dib, W Dalton Dietrich, Tatjana Rundek, Kristine O'Phelan, Jan Claassen, and Mark Walker.
Statistical analysis: Ayham Alkhachroum, Gabriela Aklepi, Amin Sarafraz, Linda Robayo, and Brian Manolovitz.
Study supervision: Ayham Alkhachroum, Kristine O'Phelan, Jan Claassen, and Mark Walker.
Funding Information
National Institute of Neurological Disorders and Stroke of the National Institutes of Health under Award Number R21NS128326.
Author Disclosure Statement
AA is supported by an institutional KL2 Career Development Award from the Miami CTSI NCATS UL1TR002736 and by the National Institute of Neurological Disorders and Stroke of the National Institutes of Health under Award Number K23NS126577 and R21NS128326.
WDD is supported by National Institute of Health NINDS/NIA RO1NS125578 and Florida Department of Health grant 21A13.
TR is funded by the Florida Department of Health for work on the Florida Stroke Registry and by the grants from National Institutes of Health (R01 MD012467, R01 NS029993, R01 NS040807, 1U24 NS107267), and the National Center for Advancing Translational Sciences (UL1 TR002736 and KL2 TR002737).
JC is supported by grant funding from the NIH R01 NS106014, R03 NS112760, and R21NS128326, and the DANA Foundation. JC is a minority shareholder at iCE Neurosystems.
MW is supported by grant funding from the NIH I21 RX002892 and I21 RX003750.
For the other authors, no competing financial interests exist.
Supplementary Material
Supplementary Video S1
Supplementary Video S2
Supplementary Video S3
Supplementary Table S1
Supplementary Table S2
Supplementary Table S3
Supplementary Table S4
Supplementary Figure S1
Supplementary Figure S2
Consent—Healthy Volunteers
Consent—Subjects
STROBE Checklist
References
Supplementary Material
Please find the following supplemental material available below.
For Open Access articles published under a Creative Commons License, all supplemental material carries the same license as the article it is associated with.
For non-Open Access articles published, all supplemental material carries a non-exclusive license, and permission requests for re-use of supplemental material or any part of supplemental material shall be sent directly to the copyright owner as specified in the copyright notice associated with the article.
