




Abstract
Approximately 300–550 children per 100,000 sustain a mild traumatic brain injury (mTBI) each year, of whom ∼25–30% have long-term cognitive problems. Following mTBI, free water (FW) accumulation occurs in white matter (WM) tracts. Diffusion tensor imaging (DTI) can be used to investigate structural integrity following mTBI. Compared with conventional DTI, neurite orientation dispersion and density imaging (NODDI) orientation dispersion index (ODI) and fraction of isolated free water (FISO) metrics may allow a more advanced insight into microstructural damage following pediatric mTBI. In this longitudinal study, we used NODDI to explore whole-brain and tract-specific differences in ODI and FISO in children with persistent symptoms after mTBI (n = 80) and in children displaying clinical recovery (n = 32) at 1 and 2–3 months post-mTBI compared with healthy controls (HCs) (n = 21). Two-way repeated measures analysis of variance (ANOVA) and voxelwise two-sample t tests were conducted to compare whole-brain and tract-specific diffusion across groups. All results were corrected at positive false discovery rate (pFDR) <0.05. We also examined the association between NODDI metrics and clinical outcomes, using logistical regression to investigate the value of NODDI metrics in predicting future recovery from mTBI. Whole-brain ODI was significantly increased in symptomatic participants compared with HCs at both 1 and 2 months post-injury, where the uncinate fasciculus (UF) and inferior fronto-occipital fasciculus (IFOF) were particularly implicated. Using region of interest (ROI) analysis in significant WM, bilateral IFOF and UF voxels, symptomatic participants had the highest ODI in all ROIs. ODI was lower in asymptomatic participants, and HCs had the lowest ODI in all ROIs. No changes in FISO were found across groups or over time. WM ODI was moderately correlated with a higher youth-reported post-concussion symptom inventory (PCSI) score. With 87% predictive power, ODI (1 month post-injury) and clinical predictors (age, sex, PCSI score, attention scores) were a more sensitive predictor of recovery at 2–3 months post-injury than fractional anisotropy (FA) and clinical predictors, or clinical predictors alone. FISO could not predict recovery at 2–3 months post-injury. Therefore, we found that ODI was significantly increased in symptomatic children following mTBI compared with HCs at 1 month post-injury, and progressively decreased over time alongside clinical recovery. We found no significant differences in FISO between groups or over time. WM ODI at 1 month was a more sensitive predictor of clinical recovery at 2–3 months post-injury than FA, FISO, or clinical measures alone. Our results show evidence of ongoing microstructural reorganization or neuroinflammation between 1 and 2–3 months post-injury, further supporting delayed return to play in children who remain symptomatic. We recommend future research examining the clinical utility of NODDI following mTBI to predict recovery or persistence of post-concussion symptoms and thereby inform management of mTBI.
Introduction
Pediatric traumatic brain injury (TBI) is a leading cause of childhood mortality and morbidity, contributing to >812,000 emergency department visits each year. 1 TBI is described as an insult to the brain occurring as a result of external mechanical forces, leading to impairments in cognitive, physical, and psychosocial functions. Mild TBI (mTBI), including concussion, is the most common type of TBI in children, occurring in 300–550 children per 100,000 each year. 2,3 Pediatric mTBI can lead to ongoing problems, where persistent post-concussion symptoms (PPCS) such as headaches, dizziness, fatigue, and sleep problems, as well as attention and memory difficulties occur in 50% of children for >1 month post-injury, and in 25–30% of children for 1 year post-injury. 4 –6 Attention problems, and in particular, attentional inhibition, are among the most common PPCS, and have been linked to decreased structural integrity in salience network tracts. 7
Acutely, diffuse axonal injury (DAI) and cellular injury lead to a multitude of complex metabolic cascades and cellular changes including vasogenic and cytotoxic edema, especially in the white matter (WM). 8 In the chronic stages, DAI may result in chronic neuroinflammation, causing movement of cerebrospinal fluid or edema into the extracellular space and ultimately leading to increased free water (FW) accumulation in the WM tracts. 9,10 mTBI symptoms may stem from functional or metabolic disturbances rather than from structural changes, where standard neuroimaging is unlikely to detect abnormality. 11 However, newer neuroimaging methods have challenged this perspective by quantifying microstructural abnormalities post-injury.
Diffusion tensor imaging (DTI) can be used to investigate tissue microstructure in vivo, allowing examination of WM tract damage in the brain. 12 This technique uses several metrics including fractional anisotropy (FA), parallel diffusivity (Dp), radial diffusivity (Dr), and mean diffusivity (MD) to quantify water molecule diffusion within a voxel. 12 –14 Although DTI has previously been used to investigate structural damage following pediatric concussion, results have been contradictory. Previous literature has reported not only reduced FA alongside decreased MD, but also increased FA in the WM of children with mTBI, depending on recovery stage. 15 –17 According to a recent meta-analysis, the direction of the relationship between FA and cognitive outcomes in children is inconsistent, 18 reflecting the complex interplay of physiological processes occurring across acute and chronic stages of injury. In the chronic stage, accumulation of FW in intracellular spaces may be associated with secondary injury and ongoing symptomatology following mTBI. 19 However, conventional DTI measures of FA and MD are not sensitive to the partial volume effects caused by FW contamination in voxels. 9,20
FW elimination (FWE) aims to remove the partial volume effects on diffusion measurement. 20 FWE can be performed on multi-shell or single-shell DTI data by imposing upper and lower bounds on isotropic diffusion fractions and isotropic diffusivity assumptions at each voxel. 20 The outcome of FWE is the separation of the diffusion signal into “free/isotropic diffusion” and the remaining “tissue” signal. In single-shell data, FWE can be conducted using the multi-compartment neurite orientation dispersion and density imaging (NODDI) model to estimate metrics such as orientation dispersion index (ODI) and fraction of isolated free water (FISO). ODI describes the geometric dispersion in diffusion directions, and FISO describes the isotropic diffusion fraction. 21 Following TBI, these metrics allow examination of brain structure alterations that cannot be clearly demonstrated with FA; for example, spatial reorganiaztion of neurites. 22 Further, unlike FA, measures of ODI and FISO overcome the partial volume effects of FW in voxels. 21
The NODDI model has gained popularity as an FWE method in mTBI, where it has primarily been investigated in adult populations. 22 –28 One previous study used the NODDI model to investigate structural changes in children with mTBI within 1–2 weeks of injury. 29 However, until now, there are no studies that describe how NODDI metrics change over the course of recovery and in relation to ongoing PPCS in children with mTBI. Using the NODDI model, our study aimed to characterize ODI and FISO metrics in children with different recovery trajectories following pediatric mTBI, and compare these to HC children. We also aimed to examine the association between NODDI metrics and clinical and cognitive attention outcomes, as well as the value of NODDI metrics in predicting future recovery from mTBI. We hypothesized that children with poor recovery would have more evidence of microstructural injury than those who have recovered and HCs, and that NODDI metrics could predict subsequent recovery.
Methods
Study design
This study was conducted using a prospective cohort design that recruited participants from the PLAYGAME trial: a randomized, placebo-controlled, clinical trial of melatonin conducted in children aged 8–18 years with PPCS following mTBI at 4–6 weeks post-injury (NCT01874847) 30 between February 2014 and April 2017 at the Alberta Children's Hospital, Calgary. In the PLAYGAME trial, participants were randomized to receive placebo (n = 33), 3 mg of melatonin (n = 33), or 10 mg melatonin (n = 33) for 28 days. In the PLAYGAME study, no effect of melatonin was found on cognition or PPCS overall, although there was an effect on sleep. 31 Concussion and/or mTBI was defined according to the American Academy of Neurology criteria. 32 Exclusion criteria included a loss of consciousness >30 min, or Glasgow Coma Scale (GCS) score of <13; mTBI within the previous 3 months, or failure to recover from a previous mTBI; significant past medical or psychiatric history (attention deficit hyperactivity disorder [ADHD] or mild learning difficulties were not excluded); the use of neuroactive drugs affecting functional magnetic resonance imaging (fMRI); an inability to complete questionnaires or evaluations; or a contradiction to MRI. Consent and assent were obtained from the parent and child, respectively. At enrolment, a standardized interview and medical examination were performed by a physician experienced in concussion/mTBI assessment. The study was conducted in accordance with good clinical practice and ethical approval was received by the University of Calgary Health Ethics Research Board (13–0372) and the University of Queensland (2017001523).
Participants
In total, 82 children with persisting symptoms at 4–6 weeks (symptomatic), 36 children whose symptoms had resolved (asymptomatic), and 21 HC participants underwent MRI at between 4–6 weeks post-injury (referred to henceforth as 1 month post-injury). The Post-Concussion Symptom Inventory for Youth (PCSI-Y) was used to classify mTBI participants as symptomatic or asymptomatic at 1 month post-injury. 33 Participants were considered “symptomatic” if they reported a ≥10 point increase in their total PCSI score compared with pre-injury level. Participants were considered “asymptomatic” if their total PCSI score was at or below pre-injury levels. Controls were recruited through family and friends of mTBI participants, and were excluded if they had a history of mTBI, MRI contraindication, or inability to complete the study questionnaires.
At the 1-month post-injury time point, two symptomatic and four asymptomatic participants were excluded because of poor scan quality, leaving 80 symptomatic, 32 asymptomatic, and 21 HCs. Sixty-seven symptomatic and 14 asymptomatic participants returned for a second scan 4 weeks later (2–3 months post-injury). At the 2–3-month post-injury time point, two symptomatic and three asymptomatic participants were excluded from the analysis because of poor image quality, leaving 65 symptomatic and 11 asymptomatic participants at this time point. The symptomatic participants at 1 month post-injury were further categorized by clinical recovery at 2–3 months. Symptom resolution at 2–3 months post-injury (recovered) was defined when the participant reported no change from before the injury, symptoms scores were back to or below pre-injury levels, and the participant had resumed all normal activities. 4 Twenty-three participants had “recovered” and 39 participants still had elevated symptoms; that is, “unrecovered” (see Fig. 1 Consolidated Standards of Reporting Trials [CONSORT] diagram).
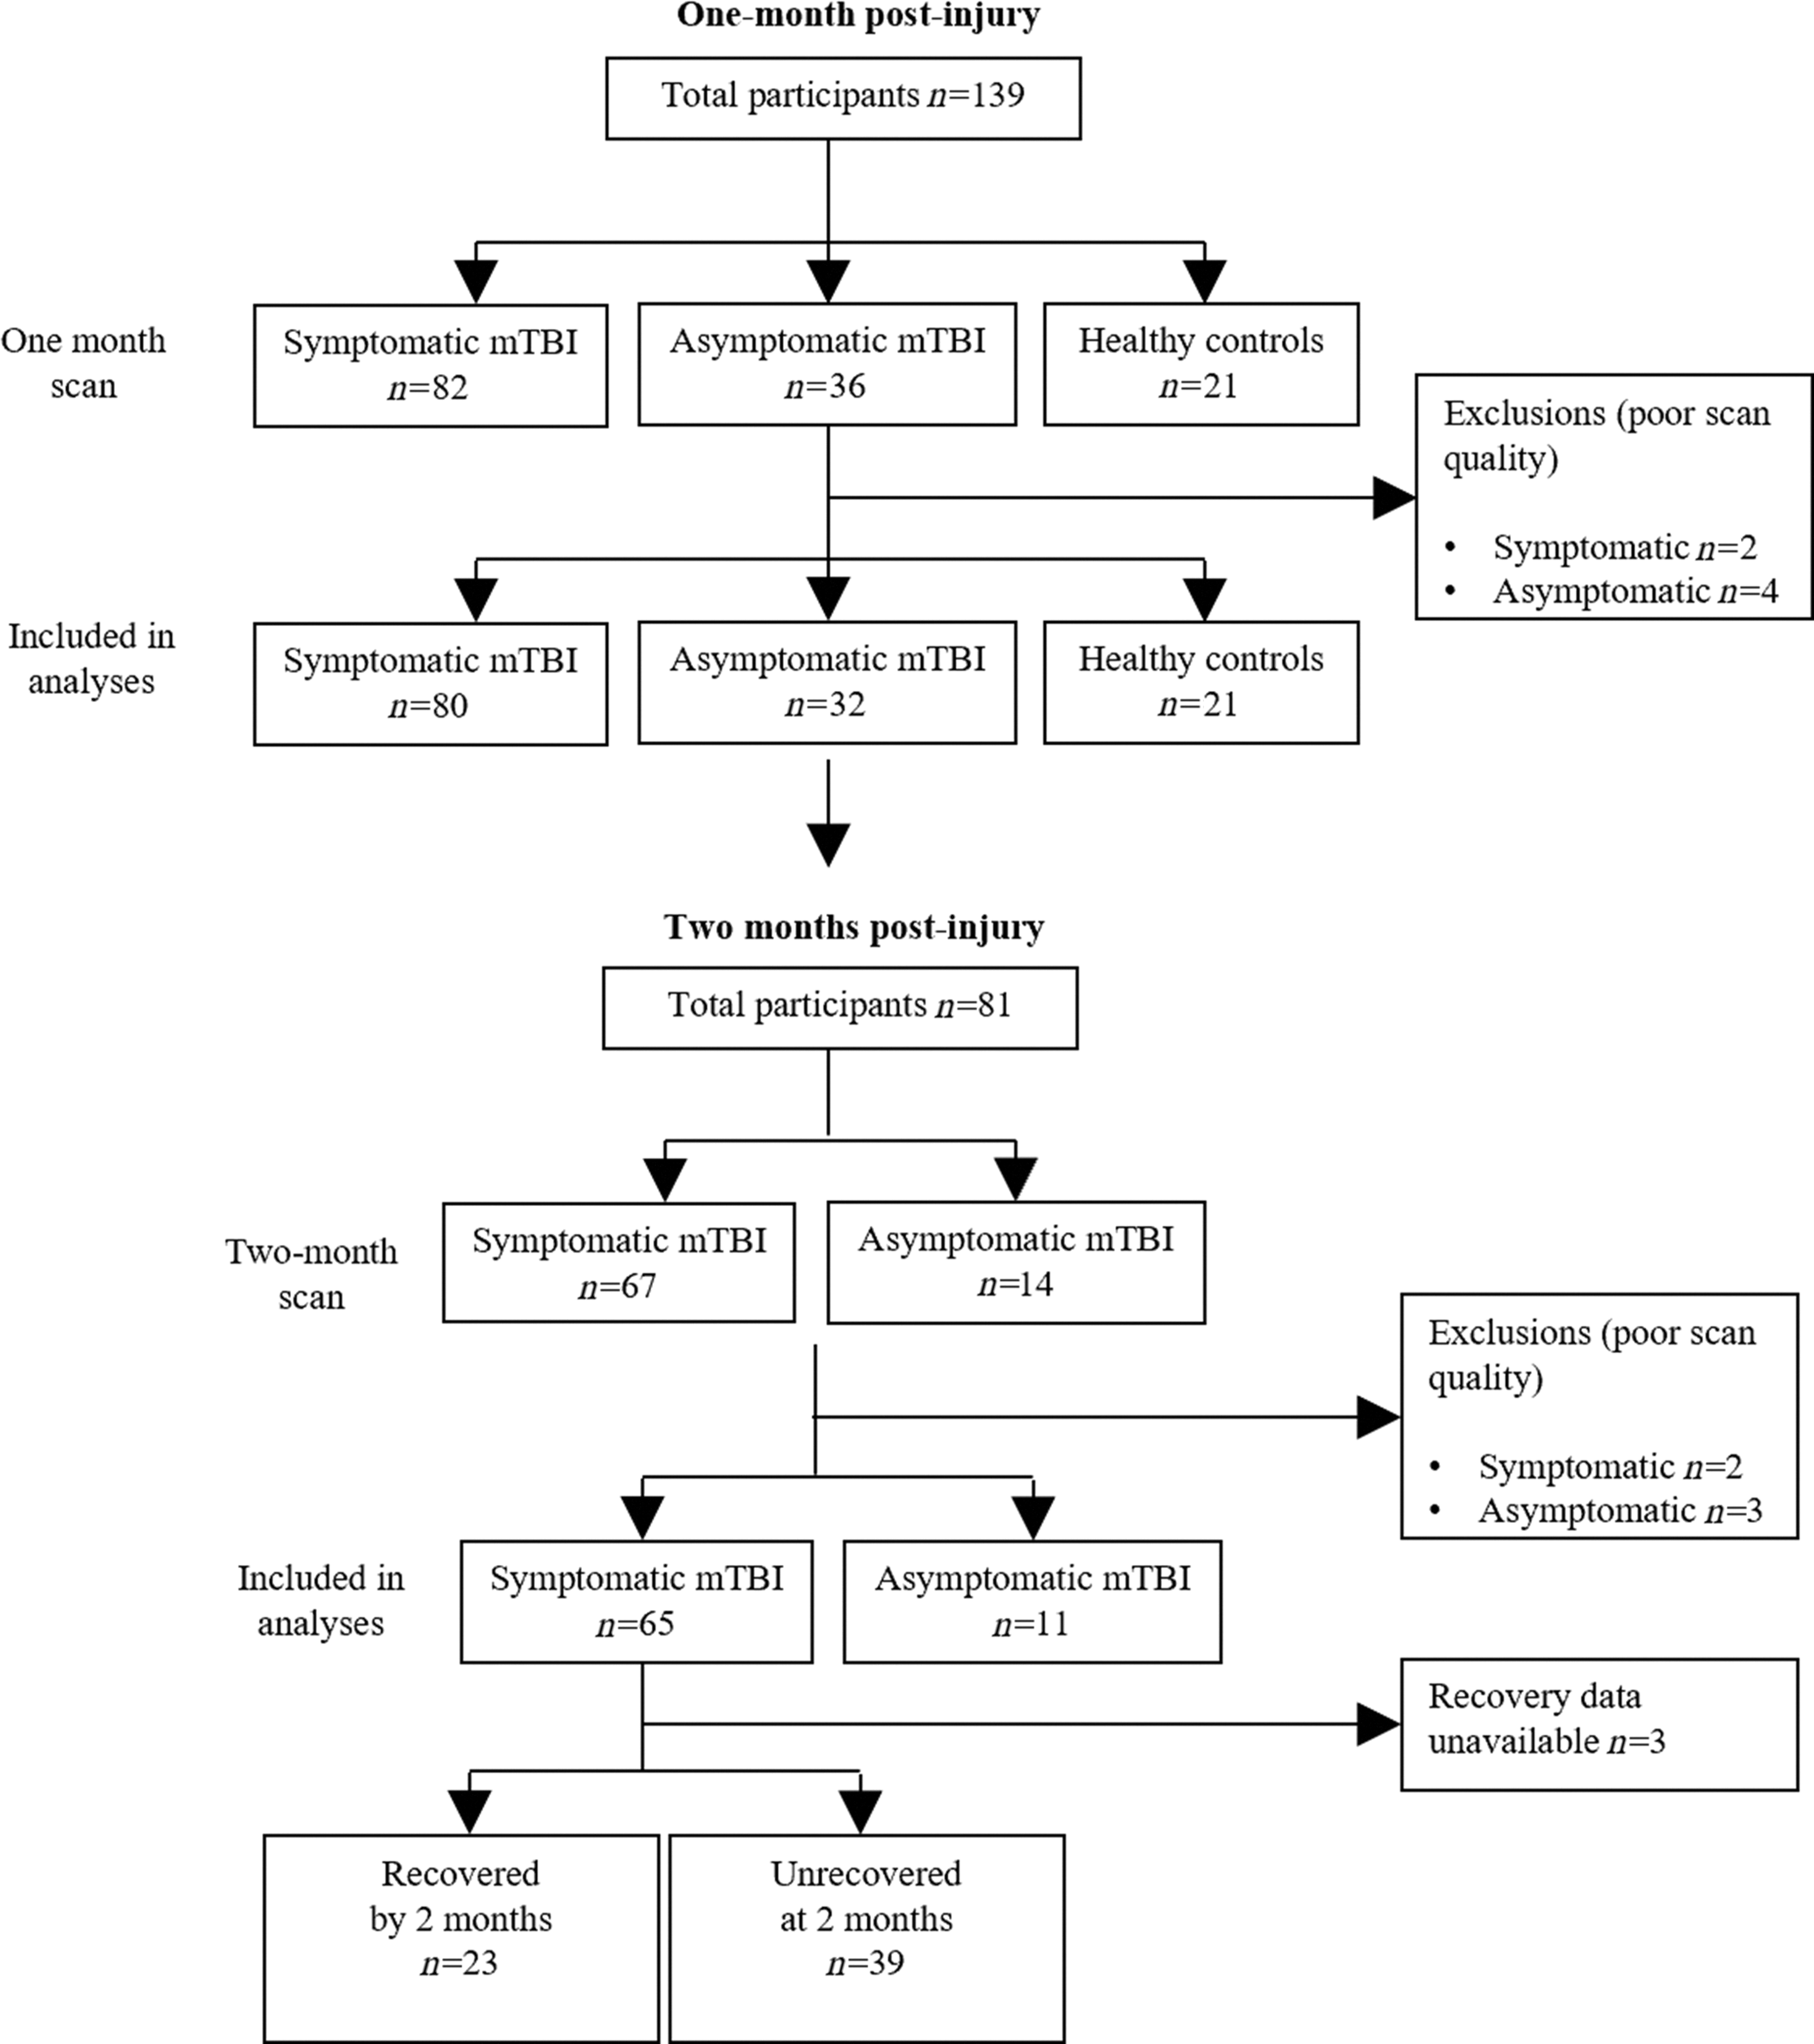
Consolidated Standards of Reporting Trials (CONSORT) diagram. Symptomatic mild traumatic brain injury (mTBI), asymptomatic mTBI and healthy control participants underwent magnetic resonance imaging (MRI) at 4–6 weeks (∼ 1 month) post-injury. Symptomatic and asymptomatic mTBI participants returned for a second scan 4 weeks later (2–3 months post injury). Participant exclusion included poor scan quality caused by excessive motion.
Procedure
A standardized clinical assessment was performed by a physician to record demographic, medical, and injury details. Cognitive and behavioral measures were completed alongside symptom validity testing using the Test of Memory Malingering (TOMM). 34,35
Clinical and neurocognitive assessment
Clinical assessments and MRI were performed as previously described in the study by Stein and colleagues. 36 PCSI-Y was used to assess symptoms and classify symptomatic status and recovery. 37 The PCSI is a validated questionnaire which provides ratings for 26 symptoms across four domains (somatic, cognitive, emotional, and sleep) and an overall rating of post-concussion symptoms following mTBI. 33 Symptoms are rated from 0 to 6, with a total score ranging from 0 to 156. The PCSI has been demonstrated to have good internal reliability. 4,5,30
Cognitive assessment was performed using the CNS-Vital Signs (CNSVS) computerized cognitive battery on the day of MRI. 38 In this study, the overall Neurocognitive Index (NCI) and Complex Attention subscale were considered (age adjusted, standard score, mean [M] = 100, standard deviation [SD] = 15). The CNSVS assessment has a good test-retest reliability (r = 0.63–0.82) in the pediatric population, as well as concurrent reliability with traditional neurocognitive testing measures. 38 –41 Executive behavior was measured with the Behaviour Rating Inventory of Executive Function (BRIEF, parent report). In this study, the Inhibit and Shift scales were considered (t-score, M = 50, SD = 10). The BRIEF has very good validity in children with TBI and concussion. 42,43
DTI image acquisition
DTI was acquired as previously described by King and colleagues. 44 Briefly, neuroimaging was performed using the Alberta Children's Hospital (ACH) General Electric 3 T MR750w MRI scanner (GE Healthcare, Waukesha, WI), with a 32-channel head coil. Participants lay supine inside the scanner with foam padding placed around the head to prevent movement. Diffusion weighted images were obtained with an axial standard spin-echo (SSE) DTI 32 direction spin echo sequence with repetition time (TR) = 11,500 ms, echo time (TE) = 69.1 ms, field of view (FOV) = 22.0, 32 diffusion encoding directions (b = 750 s/mm2), three non-diffusion encoding directions (b = 0 s/mm2), number of slices = 62, and voxel size = 0.6 × 0.6 × 2.2 mm. Symptomatic and asymptomatic groups completed DTI 1 month post-injury and at the 2–3-month follow-up time point, whereas healthy controls underwent DTI at the first time point only. The first scan (1 month post-injury) was completed prior to melatonin treatment. Following the first scan, the symptomatic group were randomized to receive melatonin or placebo for 4 weeks. The second scan (at 2–3 months post-injury) was conducted at least 1 week after melatonin treatment was completed, and urinary melatonin levels had decreased to pre-treatment levels, 31 aligning with previous melatonin washout periods. 45
Image processing
Diffusion MRI images were processed as follows. DICOM® images were converted to Neuroimaging Informatics Technology Initiative (NIfTI) using xiangruili's dicm2nii (
Skull-stripped and N4ITK bias field corrected b0 anatomical representation image in the diffusion MRI space were registered through affine transformation to the skull-stripped T1w Montreal Neurological Institute (MNI)152 template
50
using FSL (v.6.0.4)'s FLIRT.
51
The registered b0 images from eight randomly selected participants from each of the symptomatic, asymptomatic, and HC groups were used to construct a study-specific diffusion EPI template in an iterative non-linear registration and template generation automated and implemented in ANTS (v.2.3.4)'s

Diffusion tensor imaging (DTI) (fractional anisotropy [FA]) and neurite orientation dispersion and density imaging NODDI (orientation dispersion index [ODI] and fraction of isolated free water [FISO]) metrics for a representative study participant.
Statistical analysis
Descriptive statistics were performed using the IBM SPSS Statistics software (IBM Corporation Version 26 for Windows, Armonk, NY). The Shapiro–Wilk test was used to test normality of the data. Mann–Whitney U test was used to assess non-parametric differences between groups (recovered vs. unrecovered and included vs. excluded participants). Differences in demographics and neurocognitive test scores across groups were assessed using analysis of variance (ANOVA) or Fisher's Exact test (for normally distributed data) or the Kruskal–Wallis test (for non-normally distributed data), and change in PCSI over time was assessed using a Wilcoxon Sign-Rank test.
DTI
Voxelwise analysis of diffusion MRI metric images were first assessed for the group (symptomatic vs. asymptomatic) and time effect (1month vs. 2–3 month time point) using a two-way repeated measure ANOVA as implemented in the Multivariate and Repeated Measures (MRM) toolbox. 54 Statistical maps were corrected for multiple comparisons using false discovery rate (FDR) correction, where the threshold was set at p < 0.05. Further post-hoc comparisons among groups (symptomatic, asymptomatic, HC) and time points were performed using two-sample t tests applied as permutation inference for the general linear model 55 as implemented in FSL's randomize, 56 with participant age and sex included as covariates. Statistical maps were corrected using FSL's Threshold-free Cluster enhancement (TFCE) 57 and thresholded at p < 0.05.
The thresholded statistical maps from the voxelwise analysis were used to generate regions of interest (ROIs) for further analysis. Five WM ROI maps were identified as overlapping with voxels above the threshold on the following voxelwise statistical maps: the frontal part of the left or right inferior fronto-occipital fasciculus (IFOF), and left or right uncinate fasciculus (UF), using the Johns Hopkins University white-matter tractography atlas (Fig. S1), 58 –60 as well as cerebral WM using the Harvard–Oxford Cortical Structural Atlas left and right cerebral WM. 61,62 The ROIs were further refined by multiplying the WM maps with the thresholded statistical maps to create ROIs of parts of selected WM tracts that showed statistical significance in the voxelwise unrecovered versus HC statistical test. Average ODI and FISO values were quantified from the ROIs for each participant, and the group results were visualized using color-coded Beeswarm plots. Differences between groups were compared using paired or unpaired Student's t tests, Bonferroni corrected at p < 0.05.
Correlations between ODI and cognitive measures
Logistical regression was used to predict recovery at 2–3 months in symptomatic participants using age, sex, PCSI-Y, BRIEF Inhibit score, CNSVS Complex Attention score, and average ODI from one of the five selected ROIs: statistically significant areas in (1) all WM, (2) left IFOF, (3) right IFOF, (4) left UF, or (5) right UF. The predictor variables were tested for collinearity using Pearson's correlation matrix analysis in GraphPad Prism version 9.3.1 for Windows (GraphPad Software, San Diego, California, USA) (WM ODI, clinical and cognitive scores are shown in Table S1; left and right IFOF and UF ODI are shown in Table S2). Significance was ascertained using two-tailed p < 0.05 and 95% confidence interval (CI).
Logistical regression to predict recovery
Exploratory analysis using logistical regression was used to predict recovery at 2–3 months in symptomatic participants. In the logistical regression model, the outcome variable was dichotomously defined as the presence or absence of symptoms at 2–3 months post-injury compared with pre-injury status using the PCSI questionnaire, where “1” represents participants with persisting symptoms and “0” represents participants without symptoms (recovered). Logistical regression models were conducted to compare whether diffusion imaging could improve prediction of recovery at 2–3 months post-injury from examination at 1 month post-injury. Two logistical regression models were compared: an alternative model involving imaging plus null hypothesis clinical predictors (patient age, sex, PCSI-Y, and the two attention scores) versus a null model (null clinical predictors alone). These models were conducted for ODI, FISO, and FA separately. Specifically, the predictor variables included: average imaging metric (average ODI, FISO or FA) from one of the five selected ROIs: (1) all WM, (2) left IFOF, (3) right IFOF, (4) left UF, or (5) right UF; age; sex; PCSI-Y; and the two attention scores (CNSVS complex attention, and BRIEF Inhibit). The sex variable was coded as “1” for male and “2” for female. The two models were compared using a likelihood ratio test, and a classification cutoff of 0.5 was used. The validity of the two models was tested with the Hosmer–Lemeshow goodness-of-fit test. Performance of the models was quantified using Tjur's (pseudo) R2 , area under the receiver operating characteristic (ROC) curve, and classification tables of observed and predicted classifications.
To ascertain whether ODI could predict symptoms at 2–3 months with greater sensitivity than FA, two logistical regression models were compared using Akaike's Information Criterion (AICc). For each model, the AICc provided a probability that the model was likely to have generated the data. Finally, to investigate whether prediction was improved when combining FA and ODI, we compared logistical regression models including (1) ODI and FA plus null predictors versus (2) ODI plus null predictors. As ODI and FA were strongly correlated in all ROIs except for right IFO, principal component analysis (PCA) was conducted to orthogonalize data and extract principal components (PCs). During PCA, the scores were standardized and centered so that the standardized scores had a mean of zero and an SD of 1. The standardization equation was as follows:

where xstd is the standardized value, xi is the original value,
Results
A total of 139 participants were enrolled into the study. Symptomatic participants had MRI at 37.9 (SD 5.7) days post-injury (1 month post-injury) and again at 69.3 (SD 6.3) days post-injury 2–3 months post-injury). Of the 65 symptomatic participants who returned for the 2–3 month follow up, 23 participants had recovered and 39 participants remained symptomatic (“unrecovered”). The average time post-injury at the first time point was 37.7 (SD 6.1) and 38 (SD 5.6) days for recovered and unrecovered participants, respectively. The average time post-injury at the second time point was 68.5 (SD 6.2) and 70.0 (SD 6.5) days post-injury for recovered and unrecovered participants, respectively. The cause of injury was sports-related concussion (SRC) for the majority of participants in the symptomatic group (n = 53 [66.3%]) and in the asymptomatic group (n = 25 [80.6%]). Cause of injury did not significantly differ between symptomatic and asymptomatic participants (χ 2 = 7.98, p = 0.2), or between recovered and unrecovered participants (χ 2 = 2.75, p = 0.6). There were no significant differences in this study in the proportion of unrecovered and recovered participants who received placebo, 3 mg, or 10 mg of melatonin (χ 2 = 0.115, p = 0.944).
There were no differences in age, sex, handedness, or attention scores (BRIEF Inhibit and Shift scales) across symptomatic, asymptomatic, or HC groups (Table 1). Significant differences in PCSI-Y score were present across groups at both 1 and 2 months post-injury, where symptomatic participants displayed the highest PCSI-Y scores (indicating greater symptom severity). Groups significantly differed in Neurocognitive Index and Complex Attention scale scores, where symptomatic participants had the lowest score (Table 1). Further demographic characteristics can be found in previous publications from the same data set. 4,36,63 Over time, between 1 and 2–3 months, PCSI-Y scores significantly decreased across both symptomatic (Wilcoxon W = 67.5, p < 0.001) and asymptomatic groups (W = 3.0, p = 0.008). There were no differences in 1 month post-injury parent- or child-reported PCSI score between the 15 symptomatic participants who did not complete the second scan and those who returned for follow-up.
Participant Characteristics
Boldface represents significant p values (< 0.05).
Significance at p < 0.001; **Significance at p < 0.01; *Significance at p < 0.05.
SD, standard deviation; IQR, interquartile range; PCSI-Y, Post-Concussion Symptom Inventory (youth self-report); CNSVS, Central Nervous System Vital Signs; NCI, Neurocognitive Index; BRIEF, Behavioral Rating Index for Executive Function; KW, Kruskal Wallis.
When considering unrecovered and recovered subgroups of the symptomatic participants, there were no differences in age, sex, handedness, attention scores, diagnoses of ADD/ADHD, learning difficulties, or neurocognition between groups. However, PCSI-Y scores were significantly higher in the unrecovered than in the recovered participants at both 1 month (Mann–Whitney U = 303.5, p = 0.04) and 2–3 months post-injury (U = 133.5, p < 0.001). PCSI-Y score significantly decreased over time between 1- and 2–3 months post-injury in both recovered (W = 34.0, p < 0.001) and unrecovered participants (W = 0.0, p < 0.001).
ODI and FISO across groups over time
Voxelwise statistical maps indicated significant differences in ODI across groups at both 1 and 2–3 months post-injury; however, no significant differences were seen within groups over time. Symptomatic participants had significantly increased ODI compared with HCs at both 1 and 2–3 months post-injury (n = 80 and n = 65, respectively), corrected for age and sex (pFDR<0.05; Fig. 3A, B and Fig. S2). No significant differences were seen between asymptomatic participants and HCs.

Significantly increased orientation dispersion index (ODI) in symptomatic mild traumatic brain injury (mTBI) children compared with healthy controls (HCs) at
When considering the recovery status of participants, ODI was significantly increased at 1 month in unrecovered participants compared with HCs (Fig. 4). ODI did not remain significantly higher in unrecovered participants compared with HCs at 2–3 months post-injury. There were no differences in ODI between recovered participants and HCs at 1 or 2–3 months post-injury.

Significantly increased orientation dispersion index (ODI) at 1 month in children with mild traumatic brain injury (mTBI) who remained symptomatic (“unrecovered”) at the 2–3 month post-injury follow up compared with healthy controls (red), 39 unrecovered; 21 healthy controls. Voxelwise two sample t tests, ODI corrected for age and sex at p FDR < 0.05. Color bar indicates false discovery rate (Q) scaled at 0.025 – 0. Radiological convention: left side of image represents right side of brain.
ROI-based ODI across groups over time
Significant differences in ODI were found across the groups in the WM (Fig. 5), and bilateral UF (Fig. 6), and IFOF (Fig. 7) ROIs. ODI appeared to a show a decreasing linear-like trend across all ROIs as patients recovered, where ODI was highest in unrecovered symptomatic participants, and progressively lower in recovered symptomatic participants, asymptomatic participants, and then HCs, who displayed the lowest ODI (Figs. 5–7, Bonferroni corrected at p < 0.05). ODI was significantly higher in all patient groups at both timepoints compared to healthy controls in the WM and right IFOF ROIs. In the left IFOF and bilateral UF ROIs, ODI was significantly higher in all patient groups at both time points compared with HCs, with the exception of the asymptomatic participants at 2–3 months post-injury, who displayed similar ODI to healthy controls. Detailed results for ODI values across groups can be found in Table 2.
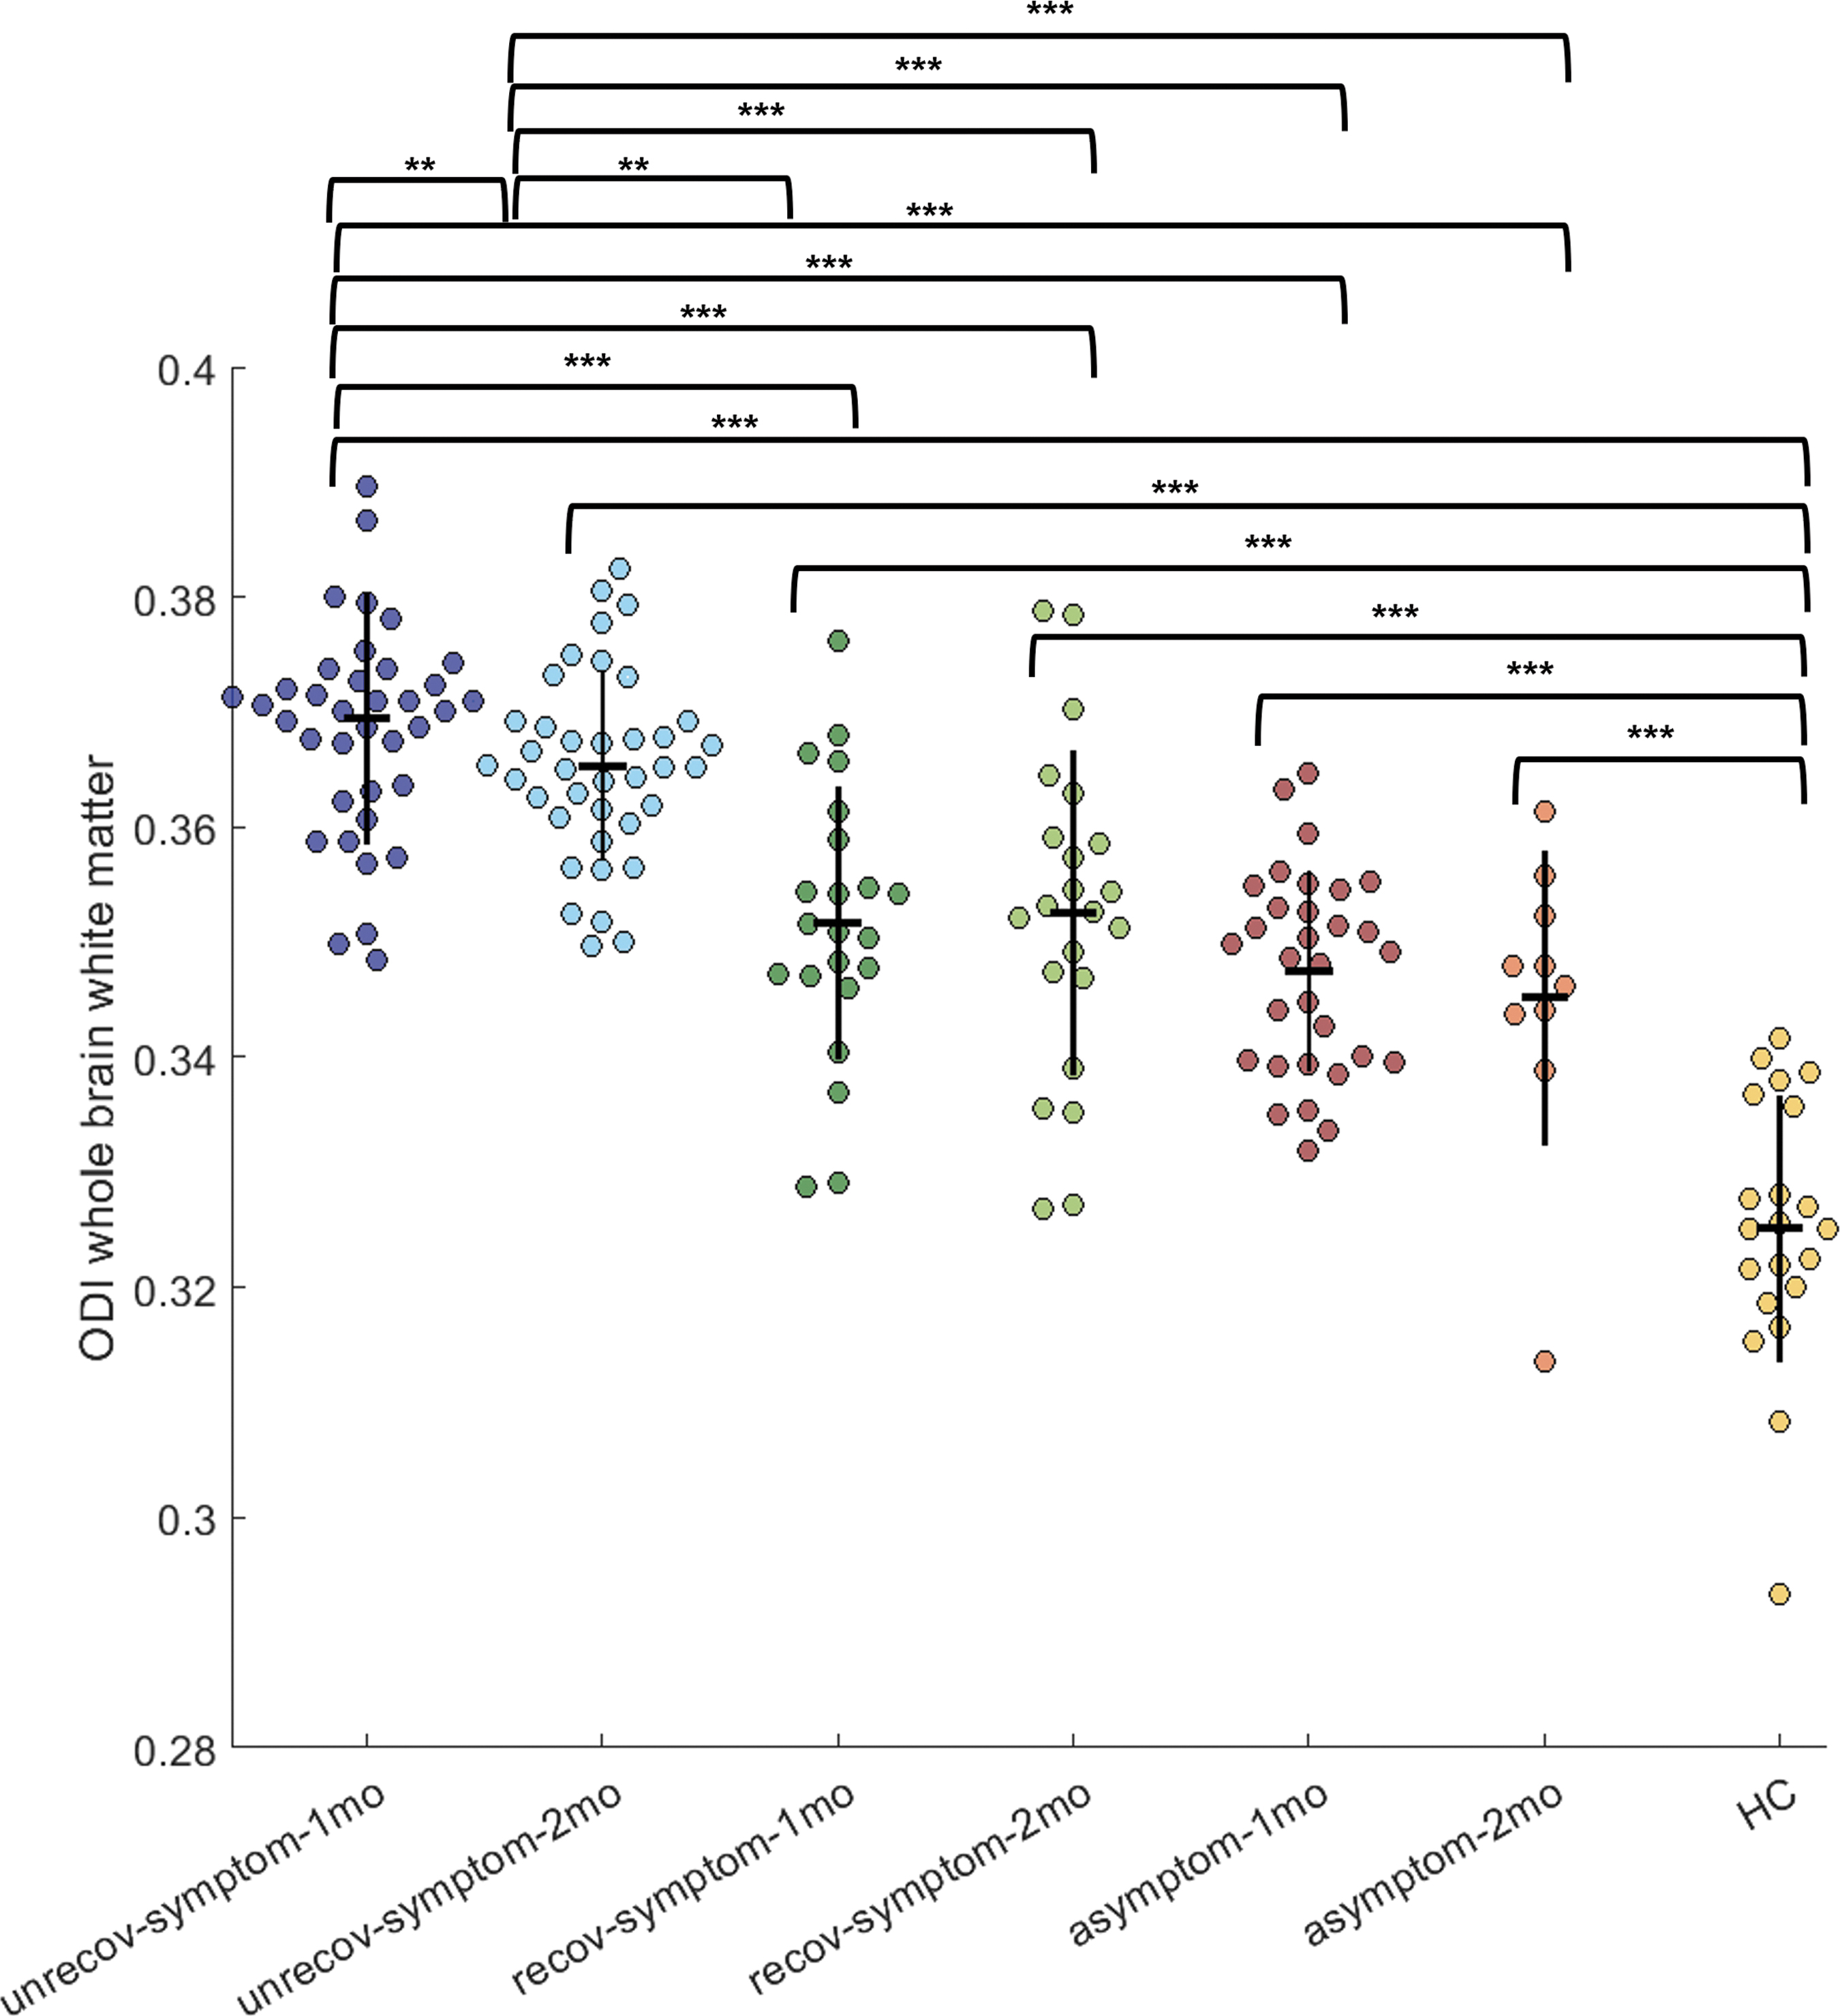
Whole brain white matter orientation dispersion index (ODI) of each participant across groups at 1 and 2–3 months post-injury. ODI values reflect both left and right hemispheres. Individual ODI values shown, where colors represent groups: dark blue = unrecovered participants at 1 month post-injury, light blue = unrecovered participants 2–3 months post-injury, dark green = recovered participants 1 month; light green = recovered participants 2–3 months; red = asymptomatic participants 1 month, orange = asymptomatic participants 2–3 months, yellow = healthy controls (HC). Vertical black line in data points represents standard deviation, horizontal black line represents mean. Only significant differences between groups displayed with brackets (paired or unpaired student's t tests, Bonferroni corrected at p < 0.05). ROI, region of interest. Significance at Bonferroni corrected ***p < 0.001, **p < 0.01.
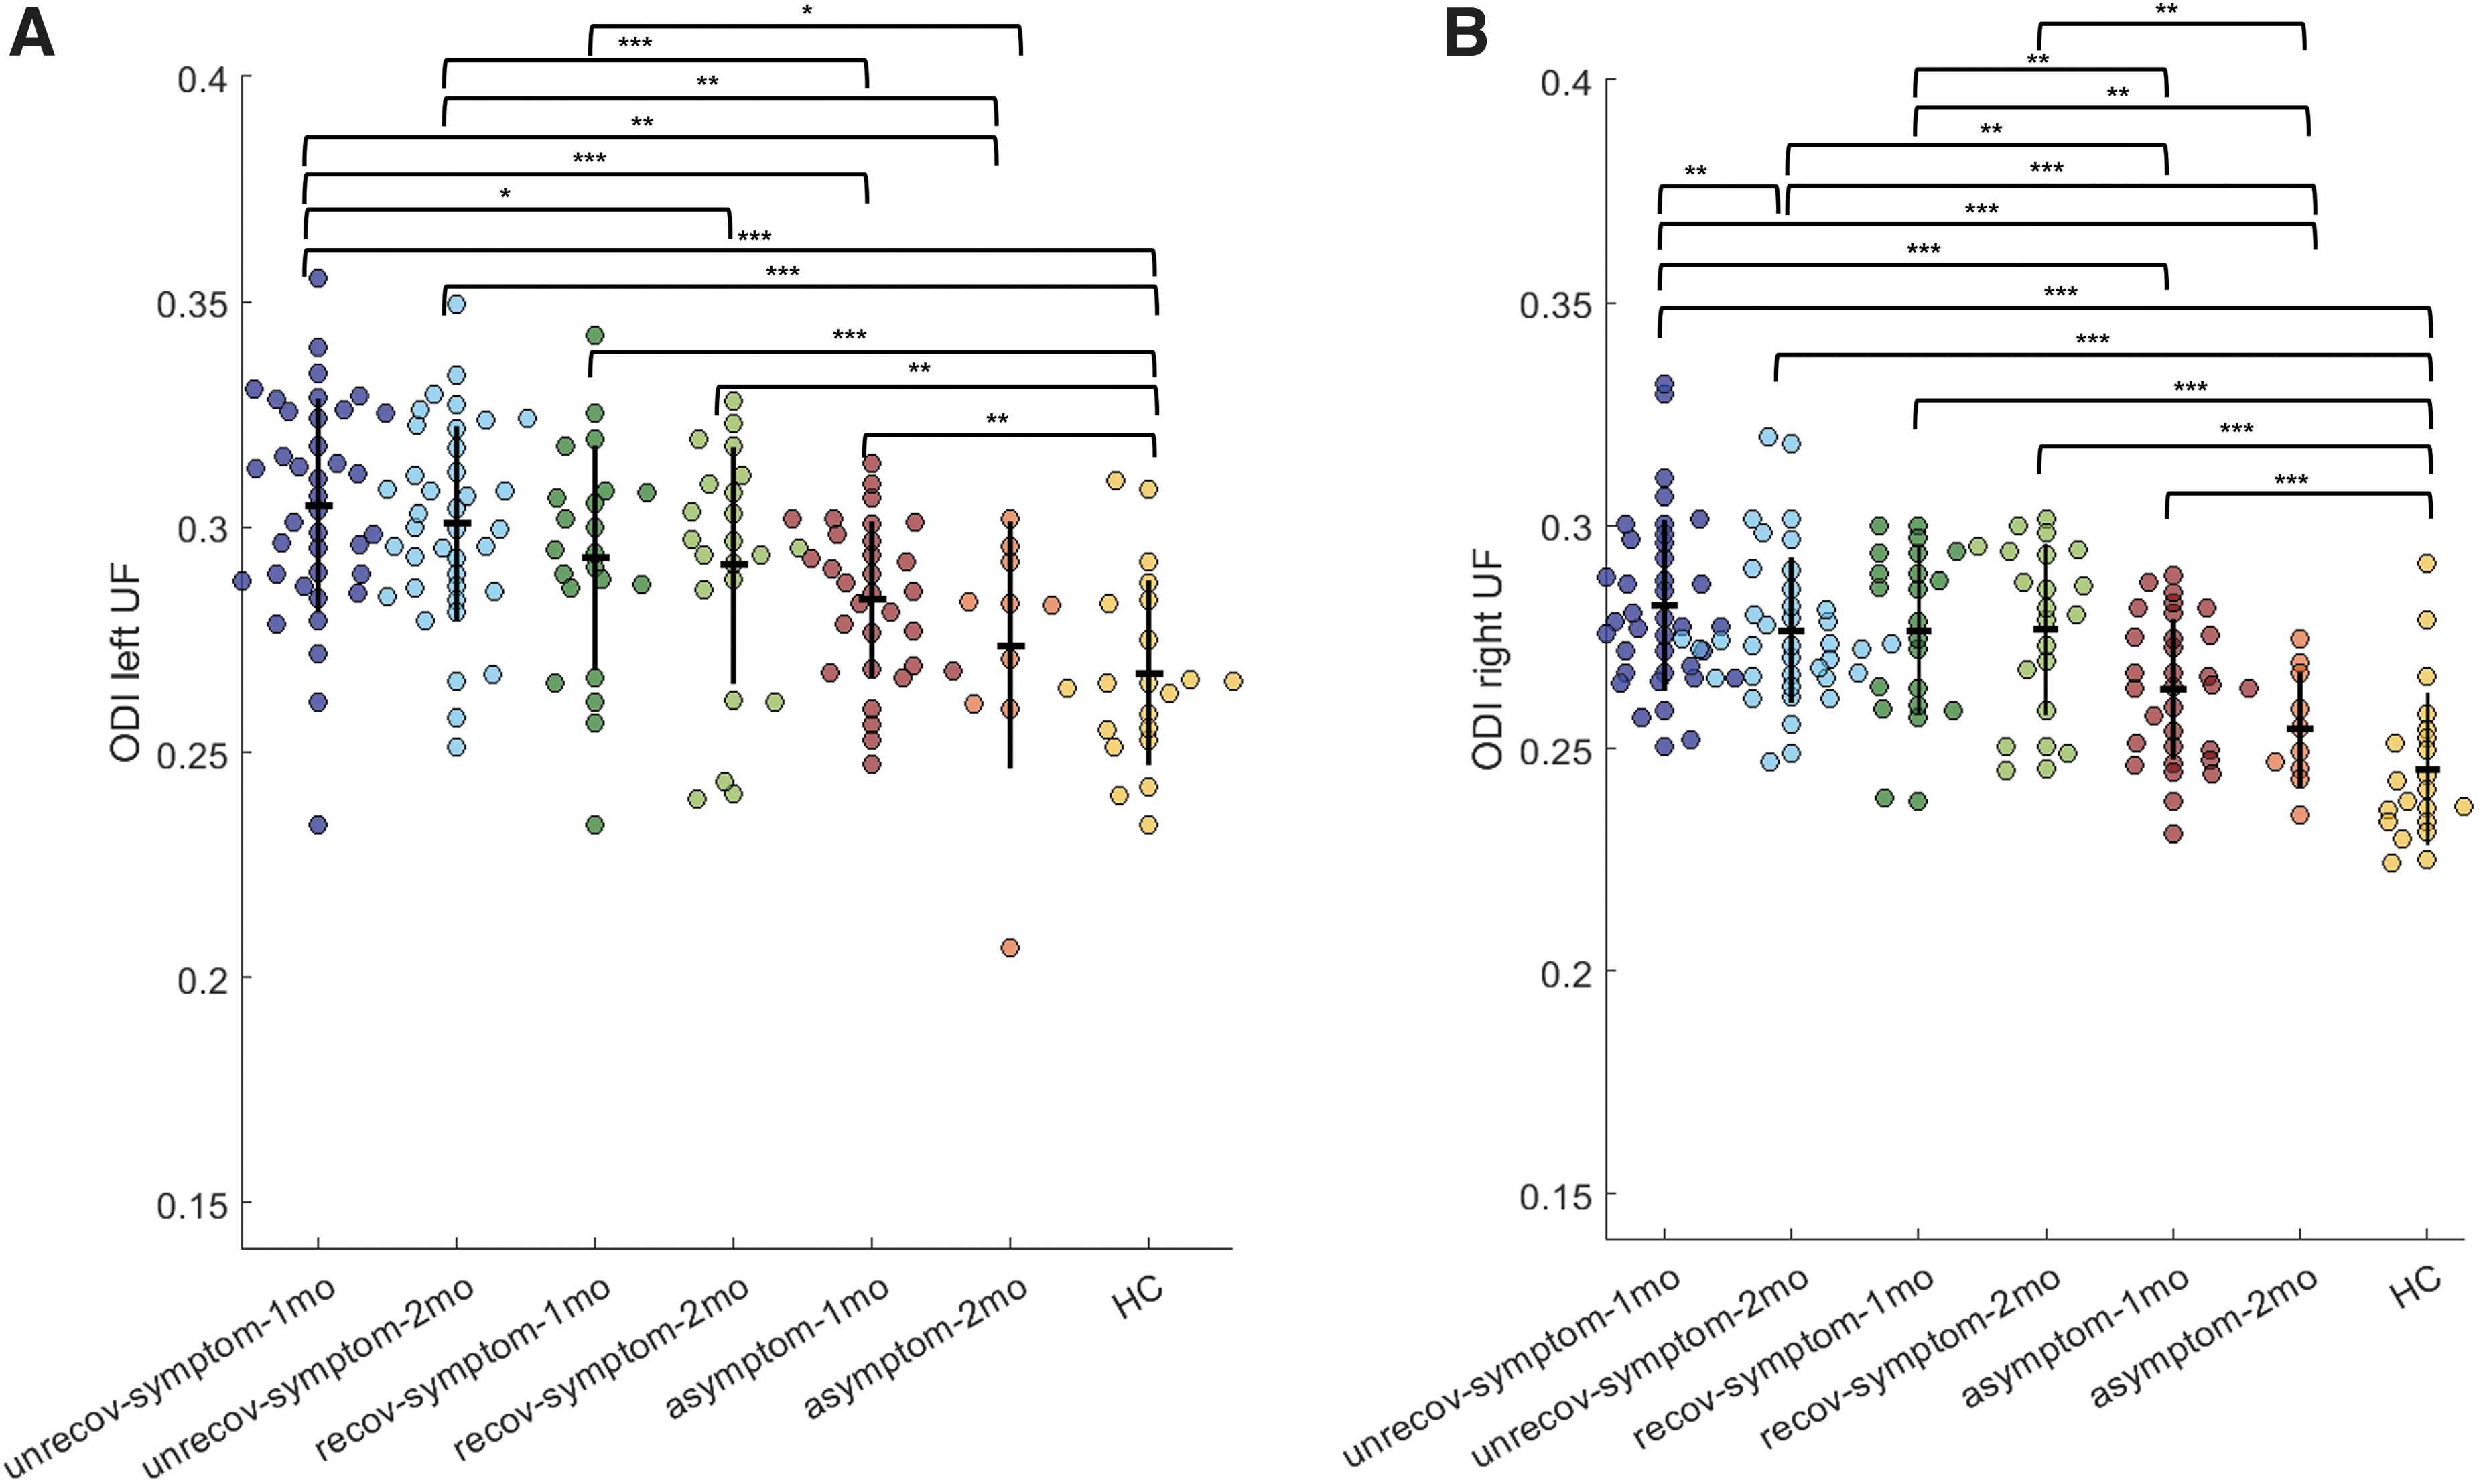
Uncinate fasciculus orientation dispersion index (ODI) of each participant across groups at 1 and 2–3 months post-injury. Displays ODI values in
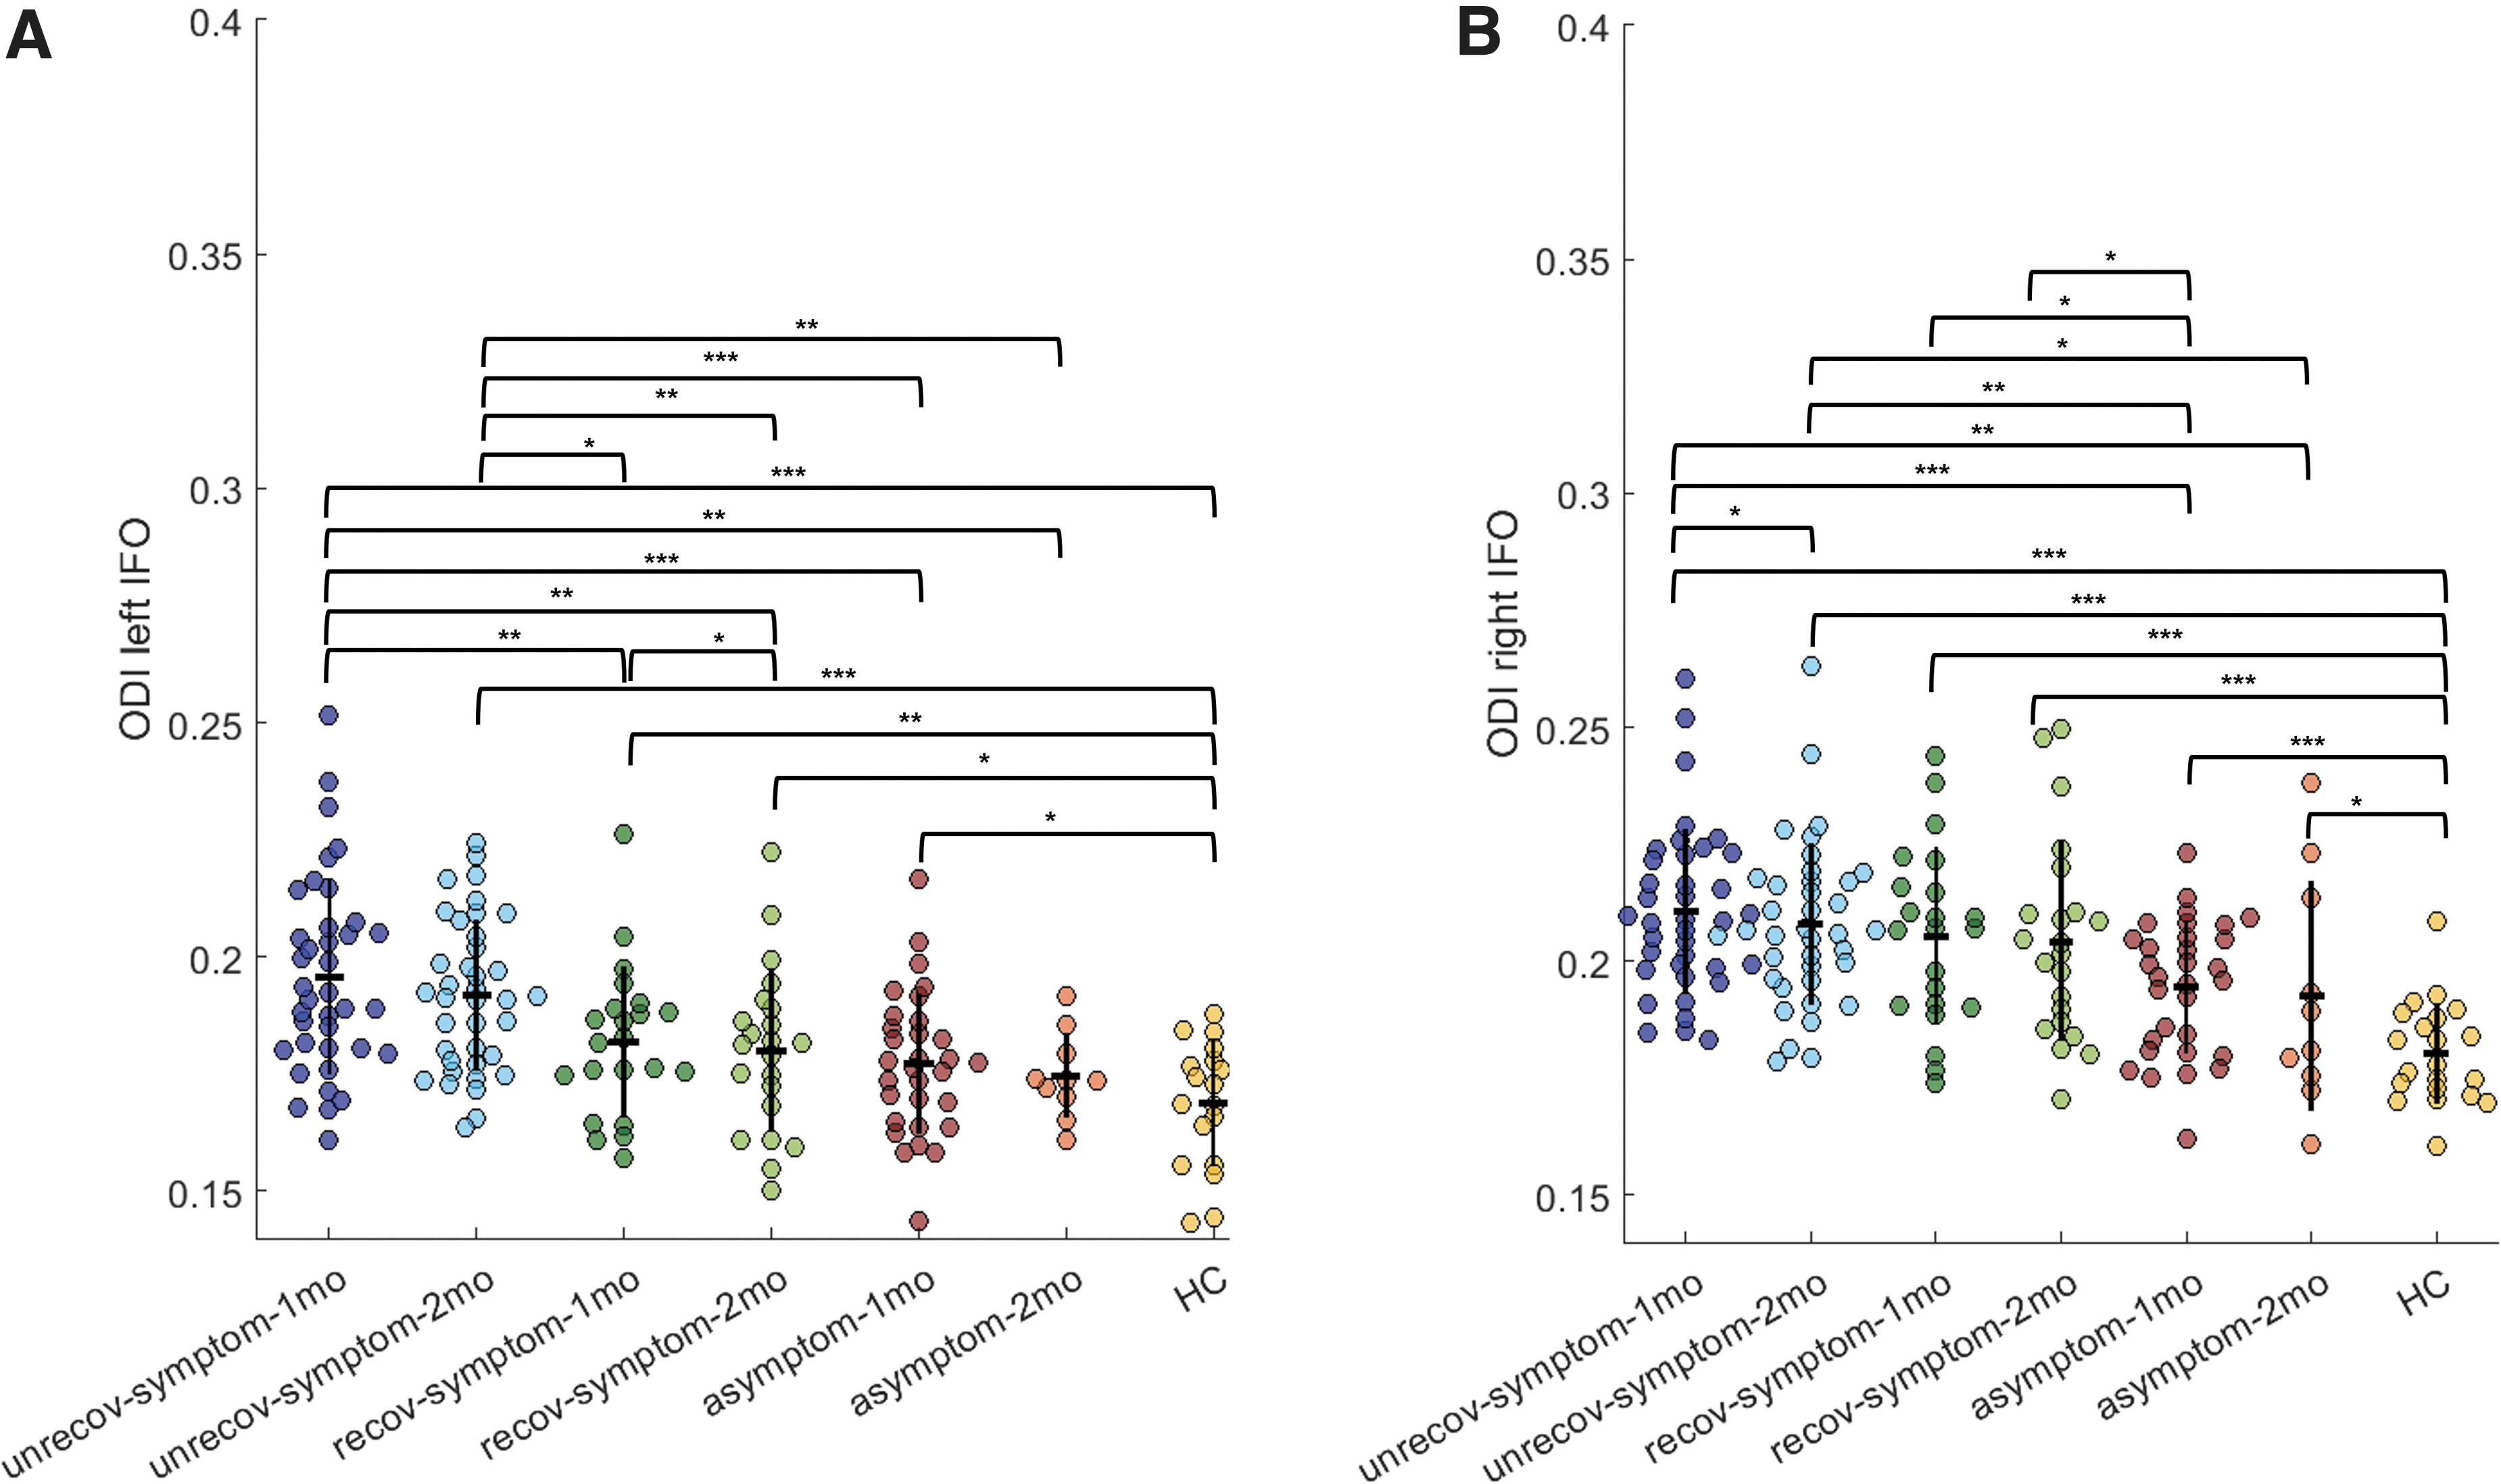
Inferior fronto-occipital fasciculus (frontal part) orientation dispersion index (ODI) of each participant across groups at 1 and 2–3 months post-injury. Displays ODI values in
Mean ODI Values in ROIs
Mean (SD) ODI across participant groups displayed.
ODI, orientation dispersion index; ROI, region of interest; SD, standard deviation; WM, white matter; IFOF, inferior fronto-occipital fasciculus; UF, uncinate fasciculus; unrec, unrecovered; rec, recovered; asymp, asymptomatic.
Correlations between NODDI metrics and clinical measures
We aimed to investigate the relationship between NODDI metrics (as a marker of microstructural injury) and clinical outcome at 1 month post-injury. Whole brain ODI and FISO across the voxelwise statistical map did not correlate with PCSI-Y, BRIEF Inhibit, BRIEF Shift, CNSVS NCI or CNSVS Complex Attention scores. On an ROI level, significant correlations were found between PCSI-Y and ODI at 1 and 2–3 months post-injury in each of the ROIs (all WM, left IFOF, right IFOF, left UF, right UF). Of all ROIs, WM ODI showed the strongest correlation with clinical measures, where higher ODI was moderately associated with higher PCSI-Y score (i.e., poorer outcome). In the WM ROI, 1-month ODI was significantly correlated with 1-month post-injury PCSI-Y score (r = 0.61, p < 0.0001, 95% CI 0.47–0.72) and 2–3-month post-injury PCSI-Y score (r = 0.48, p < 0001, 95% CI 0.29–0.63). Significant correlations were also found in the left IFOF and right UF for both 1- and 2–3-month PCSI-Y scores (Table S4). In the right IFOF, significant correlations were only found with the 2–3-month PCSI-Y score, and in the left UF, significant correlations were only found with the 1-month PCSI-Y score (see Table S4 for details). ODI did not correlate with any behavioral or cognitive scores.
Predicting outcome at 2–3 months post-injury using ODI
We sought to understand whether clinical and imaging measures (ODI, FISO, or FA) at 1 month post-injury could predict clinical outcome at 2–3 months post-injury. The null hypothesis model of the multiple logistical regression (no imaging measure, Table 3) showed that the presence of symptoms at 2–3 months post-injury can be predicted with moderate power from predictor variables collected at 1 month (Hosmer–Lemeshow test, p = 0.43; 58.8% and 70.5% negative and positive predictive power, respectively). The ODI alternative model (i.e., with ODI plus null clinical predictors) was favored over the null model (clinical predictors alone) in all ROIs. The WM ROI ODI demonstrated the greatest predictive power for symptoms at 2–3 months post-injury (Table 4), with a likelihood ratio of 27.40 (p < 0.0001), and ∼20% improvement in predictive power over the null hypothesis (81.82% and 87.18% negative and positive predictive power, respectively), with an area under the curve (AUC) of 0.90. See Table S5 for details on predictive power using ODI derived from other ROIs including left IFOF, right IFOF, left UF and right UF.
Logistical Regression Null Hypothesis Model: Prediction of Symptoms Without Imaging
Boldface represents significant p values ( <0.05).
Participants with persisting symptoms (unrecovered) classified as “1,” and participants without symptoms (recovered) classified as “0.”
PCSI-Y, Post Concussion Symptom Inventory Youth Report; ROC, receiver operating characteristic; BRIEF, Behavioral Rating Inventory of Executive Functioning; CNSVS, Central Nervous System Vital Signs.
Logistical Regression Alternative Hypothesis Model: Prediction of Symptoms With Significant WM ODI Included
Boldface represents significant p values (< 0.05).
Participants with persisting symptoms (unrecovered) classified as “1,” and participants without symptoms (recovered) classified as “0.”
WM, white matters; ODI, orientation dispersion index; ROI, region of interest; PCSI-Y, Post Concussion Symptom Inventory Youth Report; BRIEF, Behavioral Rating Inventory of Executive Functioning; CNSVS, Central Nervous System Vital Signs; ROC, receiver operating characteristic.
Models including FISO from all five ROIs did not improve prediction of clinical outcome at 2–3 months post-injury when compared with the null model (clinical predictor variables only) (Table 5). We also compared the sensitivity of FA with the null model (clinical predictors measures alone) for detecting microstructural injury and predicting outcome (Table 6; Table S6). FA (plus null predictors) in the significant WM (likelihood ratio = 16.12, p < 0.0001, AUC = 0.85) and left IFOF ROIs (likelihood ratio = 4.39, p = 0.04, AUC = 0.79) predicted recovery better than the null hypothesis model (clinical predictors alone). For the other three ROIs, the clinical predictor null hypothesis model was preferred over the alternative model (Table S6).
Logistical Regression Alternative Hypothesis Model: Prediction of Symptoms With Significant WM FISO
Boldface represents significant p values (< 0.05).
Participants with persisting symptoms (unrecovered) classified as “1,” and participants without symptoms (recovered) classified as “0.”
WM, white matter; FISO, fraction of isolated free water; ROI, region of interest; PCSI-Y, Post Concussion Symptom Inventory Youth Report, BRIEF, Behavioural Rating Inventory of Executive Functioning; CNSVS, Central Nervous System Vital Signs; ROC, receiver operating characteristic.
Logistical Regression Alternative Hypothesis Model: Prediction of Symptoms With Significant WM FA
Boldface represents significant p values (< 0.05).
Participants with persisting symptoms (unrecovered) classified as “1,” and participants without symptoms (recovered) classified as “0.”
WM, white matter; FA, fractional anisotropy; ROI, region of interest; PCSI-Y, Post Concussion Symptom Inventory Youth Report, BRIEF, Behavioural Rating Inventory of Executive Functioning; CNSVS, Central Nervous System Vital Signs; ROC, receiver operating characteristic.
We also compared (1) ODI plus null predictors versus (2) FA plus null predictors logistical regression models (Table S7). Here, the ODI model was preferred to the FA model across all five ROIs. The ratio of probabilities was highest in the significant WM ROI, where the 1-month ODI model was 281 times more likely to predict recovery at 2–3 months post-injury compared with the FA model (Table S7). Finally, to test if prediction of recovery was improved when combining FA and ODI, we compared (1) ODI and FA combined (PC scores) and null clinical predictors versus (2) ODI and null clinical predictors. The ODI model was preferred over the combined ODI and FA model in all ROIs (see Tables S8 and S9).
Discussion
This study was the first to use NODDI free-water imaging to examine longitudinal changes in brain microstructure in association with clinical outcomes in children with mTBI. Children with mTBI had significantly higher ODI than HC, indicating greater dispersion in neurite orientation and ongoing microstructural injury in WM, particularly in the uncinate fasciculus and frontal part of the IFOF. This was particularly evident in symptomatic mTBI participants who had persistent symptoms. Those with poor recovery had higher ODI than those with more favorable recovery trajectories. ODI at 1 month-post injury was a significant predictor of symptomatology at 2–3 months post-injury and was found to predict symptoms with more sensitivity than with FA. Finally, no significant differences were observed in FISO across groups or within groups over time, and FISO was not able to predict symptomatology at 2–3 months post-injury.
ODI is significantly higher in symptomatic mTBI than in HC at 1 and 2–3 months post-injury
We found significantly increased ODI in symptomatic mTBI participants compared with HCs at both 1 and 2–3 months post-injury. However, there were no significant changes in ODI over time in the symptomatic mTBI participants. Previous research has demonstrated that ODI provides more specific characterization of WM microstructural changes compared with conventional DTI metrics such as FA. 21 Following TBI, increased ODI has been demonstrated in both animal 64,65 and human studies. 24 –27,66 ODI is negatively correlated with FA, where increased ODI reflects poorer structural integrity. 25 Overall, our results indicate evidence of microstructural WM architecture changes that may reflect poorer WM structural integrity at 1 and 2–3 months following injury in children with mTBI. 66
To understand changes in microstructure in association with trajectories of clinical recovery following mTBI, we further categorized symptomatic participants into those who (1) experienced symptom resolution at 2–3 months post-injury (“recovered”) and (2) those who remained symptomatic at 2 months post-injury (“unrecovered”). Significantly increased ODI was found in unrecovered children at 1 month post-injury compared with HCs. This is in keeping with previous research in which increased ODI over time was associated with greater symptomatology and prolonged recovery in young adults with sport-related concussion (SRC). 28 Increases in ODI may reflect changes in neurite geometry, perhaps because of reorganization after injury or as an adaptive response. 28 Therefore, in alignment with NODDI studies in adults, 22 significantly increased ODI at 1 month post-injury may be associated with poorer clinical recovery in children.
It is important to note that we did not find significant differences in FISO in children with mTBI relative to HCs during the recovery period of study. Previous research has demonstrated increased FISO in acute adult mTBI compared with controls at 2 weeks post-injury, particularly in those with poorer recovery, 23 which is likely because of increased edema and possibly neuroinflammation. 26,66 Our findings, however, are similar to another pediatric mTBI NODDI imaging study in which no differences in FISO were found between children with mTBI and HCs 11 days post-injury. 29 These differences may be explained by differences in injury mechanisms between adults and children, in whom the trajectory of these neurometabolic cascades may differ. 29
WM tracts susceptible to injury
Whole brain analyses showed that increased ODI in symptomatic participants was most evident in the uncinate and inferior fronto-occipital fasciculi. These tracts are known to be susceptible to injury following adult 67 and pediatric 68 TBI. Within these tracts, using ROI analyses, we found that ODI was consistently highest in those participants with the poorest recovery, and progressively decreased in accordance with speed of clinical recovery. Both IFOF and UF are key WM association tracts important in executive function 69 and emotion processing, where deficits in these functions are common complaints in children with PPCS. 70
It is likely that the increased ODI seen in our symptomatic participants is the result of poorer WM microstructural organization, which may contribute to the executive dysfunction and poorer clinical outcomes seen following mTBI. Histological evidence from animal studies suggests that increased ODI following injury may reflect increased dispersion of axons. This may be caused by the infiltration of inflammatory cells with irregularly distributed cellular processes. 64,65 In our population, this may indicate evidence of ongoing neuroinflammation. 10 Further, in humans, increased ODI has previously been associated with decreases in FA (i.e., poorer structural integrity). 22,71 Although previous NODDI analyses specifically involving the IFOF and UF have been limited, previous DTI studies have shown that poorer WM structural integrity (e.g. decreased FA) is associated with poorer performance in a range of neuropsychological outcomes in both the acute 72,73 and chronic stages 72,74,75 of adult mTBI as well as in pediatric moderate-severe TBI. 17,76 Therefore, decreased ODI in participants who showed symptom improvement may reflect improved microstructural organization of WM and network recovery.
The findings in our study suggest ongoing WM changes between 1 and 2–3 months post-injury in children with PPCS. ODI significantly decreased over time in the participants who remained symptomatic at 2–3 months post-injury. Supporting our findings, Churchill and colleagues 28 reported ODI changes between 1–7 days and 3 weeks post-injury in young adults with SRC. Here, increases in ODI were associated with slower recovery (i.e., longer return to play times). Further to this, Palacios and colleagues 23 also found increases in ODI in the IFOF and UF between 2 weeks and 6 months in young adult SRC post-injury. The authors reported concurrent decreases in the neurite density index (NDI) (thought to indicate axonal density), which was associated with poor outcome. 23 They hypothesized that these decreases in NDI over time may reflect progressive axonal degeneration. Unfortunately, the single-shell nature of our DTI acquisition did not allow us to examine NDI changes in our participants. The decrease in ODI over time seen in our unrecovered participants is likely to reflect ongoing organization of WM bundles, and may be influenced by the greater neuronal plasticity seen in youth. 8 This is consistent with our trend of decreasing ODI with decreasing symptomatology (e.g. decreasing across unrecovered participants, recovered participants, asymptomatic participants and HC). Future longitudinal research in children and youth should be conducted using multi-shell DTI acquisitions to allow NDI analysis to confirm this hypothesis.
It should be noted that measurement of DTI metrics (such as FA) following TBI can be affected by changes in perfusion in ischemia-prone regions causing isotropic blood-oxygen level dependent (BOLD) dephasing. 77,78 We have previously demonstrated that there are ongoing cerebral perfusion changes between 1 and 3 months post-injury in a similar cohort of participants also recruited in the PLAYGAME trial. 79 The UF and IFOF, however, were not found to be particularly affected. Although it is unlikely that our DTI findings are largely the result of changes in cerebral perfusion, it is worthy of further multimodal imaging research.
ODI is a better predictor of recovery than FA or FISO
We demonstrated that, similar to in other earlier studies, 80,81 age, sex, symptom scores and attention scores at 1 month post-injury can be used to predict clinical recovery at 2–3 months post-mTBI with moderately good accuracy (70%). However, our study is the first to demonstrate that the addition of ODI obtained from single-shell diffusion imaging data can significantly improve the prediction to >87% accuracy. Further, we showed that ODI was a significantly better predictor of recovery than FA (with a probability ratio of 281.0), and that FISO could not predict recovery. Although no studies have used NODDI metrics to predict recovery following TBI, some studies have shown their predictive utility in other clinical populations (e.g., upper limb function following adult stroke). 82 According to a meta-analysis, conventional DTI metrics also have utility for predicting executive function following pediatric TBI (e.g., lower FA at <4 weeks post-injury in the cerebral peduncle and internal capsule predicts favorable executive function). 18 These findings mirrored the ODI trends found in our study, in which increased structural integrity predicted recovery at 2–3 months post-injury.
Limitations and future directions
The major strengths of our study include a large sample size, small amount of attrition, several comparator groups for (e.g., unrecovered, recovered, asymptomatic, and HCs) and consistent imaging times post-injury. The single-shell DTI data permitted the examination of ODI and FISO NODDI metrics only. Further, NODDI metrics (especially FISO) are limited by large upward biases and high variances. 21 Imaging parameters were limited by anisotropic voxels, a smaller number of diffusion-encoding directions (32 directions) and a low b value of 750 s/mm2. Further, pre-injury imaging was not performed. Although it cannot be guaranteed that changes in ODI reflect injury or pre-injury characteristics, the longitudinal differences in ODI indicate that these are likely the result of injury factors. The use of asymptomatic participants alongside HC allowed greater control for pre-injury characteristics, but a non-brain-injury control group would enable us to examine brain injury factors more comprehensively. Future research should use the NODDI model to examine longitudinal changes in brain microstructure following pediatric mTBI in multi-shell diffusion acquisitions, as well as investigate the association between NODDI metrics and cerebral blood flow.
Conclusion
Our study was the first to examine NODDI metrics including ODI and fraction of isolated free water longitudinally following mTBI in children. We found ODI to be significantly increased in symptomatic children following mTBI compared with HC at 4 weeks post-injury, correlated with degree of clinical symptoms, and that ODI progressively decreased as recovery trajectory improved. Our results show evidence of ongoing microstructural reorganization between 1 and 2–3 months post-injury, further supporting delayed return to play in children who remain symptomatic. WM ODI at 1 month was a greater predictor of clinical recovery at 2–3 months post-injury than FA, and FISO could not predict recovery at 2–3 months post-injury. Overall, we recommend future research examining the clinical utility of NODDI following mTBI to predict recovery or persistence of post-concussion symptoms, and thereby inform management of mTBI.
Transparency, Rigor and Reproducibility Summary
This study involved a convenience sample taken from an original trial (the PLAYGAME study
30
). PLAYGAME was pre-registered in June 2013 on
Footnotes
Acknowledgments
We thank all participants who were involved in this study.
Authors' Contributions
Athena Stein was responsible for software, formal analysis, data curation, visualization, writing – original draft, and writing – review and editing. Xuan Vinh To was responsible for methodology, software, formal analysis, writing – original draft, and writing – review and editing. Fatima A. Nasrallah was responsible for writing – review and editing. Karen M. Barlow was responsible for conceptualization, resources, writing – original draft, writing – review and editing, supervision, project administration, and funding acquisition.
Funding Information
This study was funded by the Canadian Institutes of Health Research (Grant 293375), the Alberta Children's Hospital Research Institute, and the University of Calgary.
Author Disclosure Statement
No competing financial interests exist.
Supplementary Material
Supplementary Figure S1
Supplementary Figure S2
Supplementary Table S1
Supplementary Table S2
Supplementary Table S3
Supplementary Table S4
Supplementary Table S5
Supplementary Table S6
Supplementary Table S7
Supplementary Table S8
Supplementary Table S9
References
Supplementary Material
Please find the following supplemental material available below.
For Open Access articles published under a Creative Commons License, all supplemental material carries the same license as the article it is associated with.
For non-Open Access articles published, all supplemental material carries a non-exclusive license, and permission requests for re-use of supplemental material or any part of supplemental material shall be sent directly to the copyright owner as specified in the copyright notice associated with the article.
