




Abstract
To validate the intracranial pressure (ICP) dose-response visualization plot for the first time in a novel prospectively collected pediatric traumatic brain injury (pTBI) data set from the multi-center, multi-national KidsBrainIT consortium. Prospectively collected minute-by-minute ICP and mean arterial blood pressure time series of 104 pTBI patients were categorized in ICP intensity-duration episodes. These episodes were correlated with the 6-month Glasgow Outcome Score (GOS) and displayed in a color-coded ICP dose-response plot. The influence of cerebrovascular reactivity and cerebral perfusion pressure (CPP) were investigated. The generated ICP dose-response plot on the novel data set was similar to the previously published pediatric plot. This study confirmed that higher ICP episodes were tolerated for a shorter duration of time, with an approximately exponential decay curve delineating the positive and negative association zones. ICP above 20 mm Hg for any duration in time was associated with poor outcome in our patients. Cerebrovascular reactivity state did not influence their respective transition curves above 10 mm Hg ICP. CPP below 50 mm Hg was not tolerated, regardless of ICP and duration, and was associated with worse outcome. The ICP dose-response plot was reproduced in a novel and independent pTBI data set. ICP above 20 mm Hg and CPP below 50 mm Hg for any duration in time were associated with worse outcome. This highlighted a pressing need to reduce pediatric ICP therapeutic thresholds used at the bedside.
Introduction
Traumatic brain injury (TBI) is a significant global health problem. 1 –4 It remains the most common cause of death and newly acquired disability in children, 4 despite advancement in clinical care over the past few decades to minimize secondary pathophysiological insults. 5 -7 Further, emerging evidence suggests that TBI has a more detrimental effect on children than on adults. 8,9 In particular, childhood TBI affects cognitive training capacities in terms of executive functions and memory formation, which are crucial for schooling and social success. 9,10 This highlights the need to continue to improve childhood TBI management if we want to minimize its long-term effects on survivors of pediatric brain trauma.
Raised intracranial pressure (ICP) is a well-recognized secondary insult following TBI. 11,12 Intracranial hypertension is an independent risk factor for mortality and unfavorable outcome in both adult and childhood brain trauma. 12 –16 Swift detection and reversal of raised ICP is, therefore, a main focus of the TBI intensive care management principles, as it was introduced initially in the late 70s. 17,18 ICP lowering therapies are recommended in adults when ICP raises above 22 mm Hg in the latest international guideline. 23 This recommendation is based on observational data rather than level 1 evidence and had little change over the past 3 decades from 20 mm Hg to 22 mm Hg in 2017. 17 –23
Pediatric guidelines on TBI-related ICP management have mostly followed the adult Brain Trauma Foundation guidelines. The international pediatric TBI intensive care management guidelines, of which the first was published in 2003, issued a similar threshold as those recommended in adult TBI. 24 So pediatric intensive care units (PICUs) globally have applied the same ICP treatment thresholds of 20 mm Hg as adults despite knowing normal ICP varies with age maturation in children. 11,12 In a British bi-center observational study of 81 TBI children, the ICP insult threshold associated with worse outcome was situated at lower values than the accepted ICP clinical treatment threshold of 20 mm Hg and appeared to differ among the three age bands studied. 12 The most recent international pediatric TBI management guidelines have therefore acknowledged ICP treatment thresholds should be less than 20 mm Hg for infants and children but was unable to recommend a specific level due to insufficient evidence. 25 This has renewed interests in defining pediatric specific therapeutic ICP thresholds for childhood TBI.
The precise effect of the raised ICP duration above a specific threshold on outcome remains unknown, although most treatment guidelines recommend commencing ICP lowering therapies if ICP of 20 mm Hg is sustained over a minimum of 5 minutes. 25,26 Using a novel visualization technique and the minute-by-minute bedside ICP monitoring data of adult and pediatric TBI, it was previously demonstrated ICP of 20 mm Hg could only be tolerated by adults for 37 min and children for 8 min. 27 These intuitive ICP dose-response plots allowed the impact of the total ICP insults burden (i.e., both duration and intensity) on recovery to be visualized and assessed. 27 This method highlighted for the first time that ICP below 20 mm Hg (e.g. 15 to 20 mm Hg in adults and 10 to 15 mm Hg in children) was not entirely harmless. 27 The ICP dose-response visualization plot methodology has only been successfully validated in adults 28 but not in an independent pediatric cohort since its first description in 2015. Our aim in this project is, therefore, to validate the ICP dose-response visualization plot methodology for the first time in an independent pediatric cohort recruited in the multi-center, multi-national KidsBrainIT study.
Methods
Patients and data
The present data informatics observational study investigated a pediatric cohort of 146 TBI patients (ages 2 to less than 16 years) admitted to a PICU within the KidsBrainIT consortium between 2017 and 2020. 29 Ethical approvals were obtained in all 16 participating PICU from seven countries (United Kingdom, Belgium, Spain, Romania, Latvia, Italy, and Germany). The study was registered with National Health Service (NHS) Research Scotland (NRSPCC) and Health Research Authority. Full informed consent was obtained prior to inclusion of the patients' data into the study. Patients underwent routine escalating treatment following pediatric TBI guidelines during their PICU stay, with all PICU within the KidsBrainIT consortium having similar treatment guidelines. All patients had minute-by-minute physiological data recorded as part of their routine clinical care. Cerebral perfusion pressure (CPP) was calculated by the bedside monitors as mean arterial blood pressure (mABP) – ICP and extracted with the other routinely collected physiological data for this study. Outcome at 6 months post-injury was assessed using a pre-designed telephone questionnaire and Glasgow Outcome Score (GOS-6) was assigned. 11,12,27,30 -32 A pre-designed clinical research proforma was used to collect demographic and clinical details (e.g., post-resuscitation Glasgow Coma Score [GCS]). The full dataset from each patient was anonymized prior to transferring via a secure data transfer service to Edinburgh for artefact detection and removal and then to Leuven for ICP dose-response analysis.
In total, 104 patients were suitable for ICP dose-response analyses, with 42 patients excluded due to missing physiology time series data (n = 30), or missing GOS-6 data (n = 12). Data assessed consisted of age, sex, motor GCS, admission pupil reactivity, physiological minute-by-minute ICP and mABP time series data, and the GOS-6. Artefacts in the respective ICP and mABP data were annotated and removed by a joint effort of a part-time KidsBrainIT researcher and a custom-built automated artefact detection system. Both the KidsBrainIT researcher and the automated artefact detection algorithm were trained using the same standard operating procedure for artefact detections employed by the independent experts in our previously reported studies. 11,12,27
Visualization method
To visualize the ICP insult duration-insult intensity plot, the methodology outlined by Güiza and colleagues was applied. 27 The minute-by-minute ICP time series were segmented along predefined intensity thresholds (5 to 40 mm Hg, step size 1 mm Hg) and duration thresholds (5 to 360 min, step size 1 min), described as “ICP events.” 27,33,34 The Pearson correlation coefficient was computed between the average number of a type of ICP event per patient and GOS-6 across the five GOS categories, resulting in a score ranging from - 1 to 1. 27,30 A positive value reflects an increased prevalence of the type of ICP event with improved outcomes (i.e., higher GOS-6). Conversely, a negative correlation indicated that a particular ICP event occurred more frequently with negative outcomes (i.e. lower GOS-6). 27 The obtained correlation values were plotted in a color-coded contour plot with intensity on the X-axis in mm Hg and duration on the Y-axis in minutes. The contour line that denoted zero correlation for its respective ICP intensity and duration values (i.e. transition curve) was plotted in black. 27
Role of cerebrovascular autoregulation status
In line with our previously published work, the influence of “active” versus “passive” vasoreactivity (as a surrogate of autoregulation status) on the association between ICP events and GOS-6 was assessed using the low-frequency autoregulation index (LAx), computed as the moving minute-by-minute correlation of prior ICP and mABP values.
27,35
Averaging LAx values across ICP insult types allowed us to classify each ICP event in its respective autoregulatory state, namely “active” (LAx ≤0) versus “passive” states (LAx >0).
27
Active and passive ICP events were considered separately to enable us to construct and compare the ICP insult plots according to the aforementioned visualization technique utilizing the derived transition curves per vasoreactive state. The derived transition curves were plotted and subsequently smoothed using locally weighted nonparametric regressions (LOESS regression) of the second order with an
Role of CPP
We also investigated the role of cerebral perfusion pressure (CPP) on the association between ICP event, intensity and duration, and outcome for three CPP thresholds: CPP ≤50, 60, and 70 mm Hg as described previously.
27
The transition curves of the latter were plotted together and smoothed using LOESS regression of the second order with an
Multi-variable analysis
Multi-variable logistic regression models were developed to assess the influence of percentage of time spent in the red zone (i.e., ICP insults associated with worse GOS-6) along with the International Mission for Prognosis and Analysis of Clinical Trials in TBI (IMPACT) model core variables (age, motor GCS, admission pupil reactivity) as covariates on outcome (GOS-6). 27,36,37 Percentage of time spent in the red zone was considered for the total monitoring time. Outcome was dichotomized as mortality, i.e. death (GOS = 1) versus alive (GOS >1), and unfavorable neurological outcome (GOS ≤3) versus favorable neurological outcome (GOS >3). 27 All analyses were performed using Python 3.7.1 and R 4.0.3. 38,39
Results
Demographic analysis confirmed a male predominance (
Patient Characteristics Summarized Along GOS-6 (n = 104)
GOS-6 ranges from 1 (death) to 5 (good outcome).
GOS-6, Glasgow Outcome Score at 6 months. GCS, Glasgow Coma Score; IQR, interquartile range.
The color-coded contour plots in Figure 1 describe the Pearson correlation between the average number of different types of ICP events per patient and GOS outcome at 6 months. The black contour line indicates a clear demarcation between the dominant red and smaller blue zone, which in turn reflect types of ICP events that occur more frequently in patients with lower and higher GOS-6, respectively. The transition curves follow a similar exponential pattern, meaning patients could tolerate lower ICP for a longer duration of time without negatively affecting GOS-6, as opposed to higher ICP intensities for which the opposite relation holds. ICP insult intensities above 20 mm Hg for 5 min were not tolerated. Figure 1 showed the comparison between our original ICP dose-response plot (Fig. 1A, reproduced with permission) and the novel ICP dose-response plot based on the KidsBrainIT data set (Fig. 1B). 27 Uncertainty estimates of Figure 1B, using Fisher transformation for each computed Pearson correlation or utilizing population bootstrapping can observed in the Supplementary Figure S2 or Supplementary Figure S3, respectively.

Visualization of the univariate correlation, expressed in color code, between the Glasgow Outcome Score at 6 months (GOS-6) and the average number of intracranial pressure (ICP) events per GOS-6 category, n = 104. Each dot in the graph represents an intracranial pressure (ICP) event. A blue color depicts a positive association between the number of such events and GOS, while a red color depicts a negative association. The color bar on the right-hand side of the figure displays the continuous transition of the process from -1 to 1 with its respective color code. The transition curve (ie., zero correlation line) is highlighted in black.
In 26.4 % (± 29.26 %) of the total monitoring time no LAx could be computed due to invalid data. When LAx was available, patients had active vasoreactivity during 54.5 % (± 21.77 %) of monitoring time and passive in 45.5 % (± 21.76 %). Investigation of the transition curves derived from ICP events with either active or passive vasoreactivity revealed no clear distinction under active or passive vasoreactivity with respect to the baseline transition curve (Fig. 2).
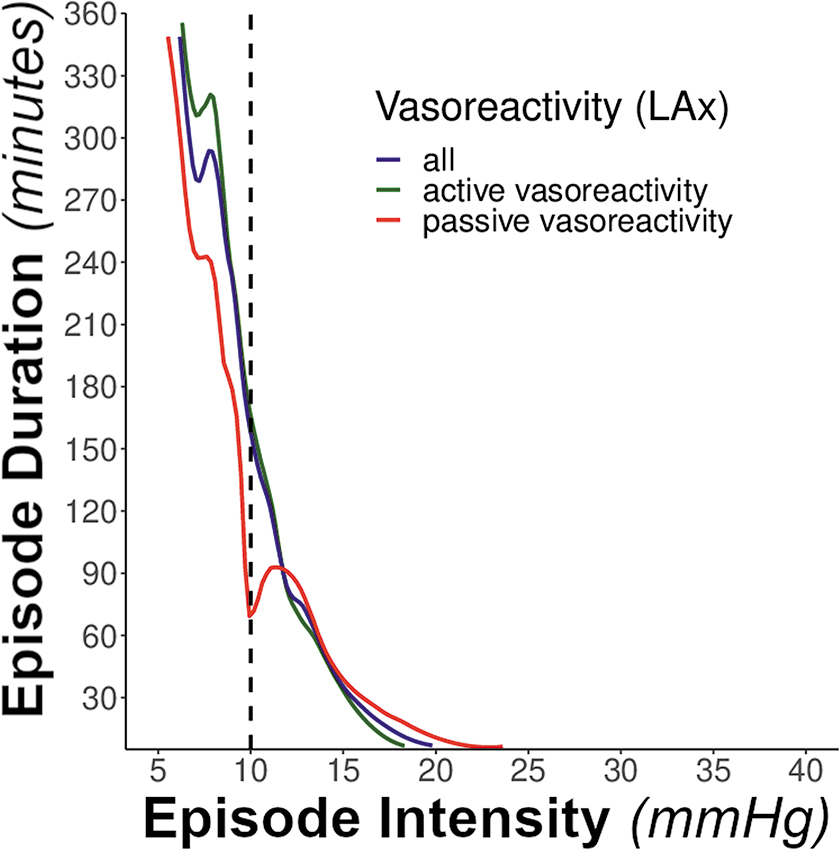
Display of the intracranial pressure (ICP) episode transition curves along vasoreactivity, n = 104. Transition curves derived from ICP events with active, passive vasoreactivity and both combined. Transition curves reflect the coordinates at which the univariate association between ICP events, defined by intensity (X-axis) and insult duration (Y-axis), and Glasgow Outcome Score at 6 months was zero. Active vasoreactivity reflected in green (LAx ≤0), passive vasoreactivity reflected in red (LAx >0) and the latter two combined transition curves reflected in blue. Transition curves were smoothed utilizing LOESS regression.
The association between ICP events and outcome was strongly related to actual CPP. When CPP was below or equal to 50 mm Hg, almost all events were associated with poor outcome regardless of the ICP intensity or duration (Fig. 3A). A stepwise increase of the CPP upper bound by 10 or 20 mm Hg resulted in a stepwise shift of the ICP-outcome transition curve to the right, albeit not to the position of the baseline transition curve (Fig. 3B).
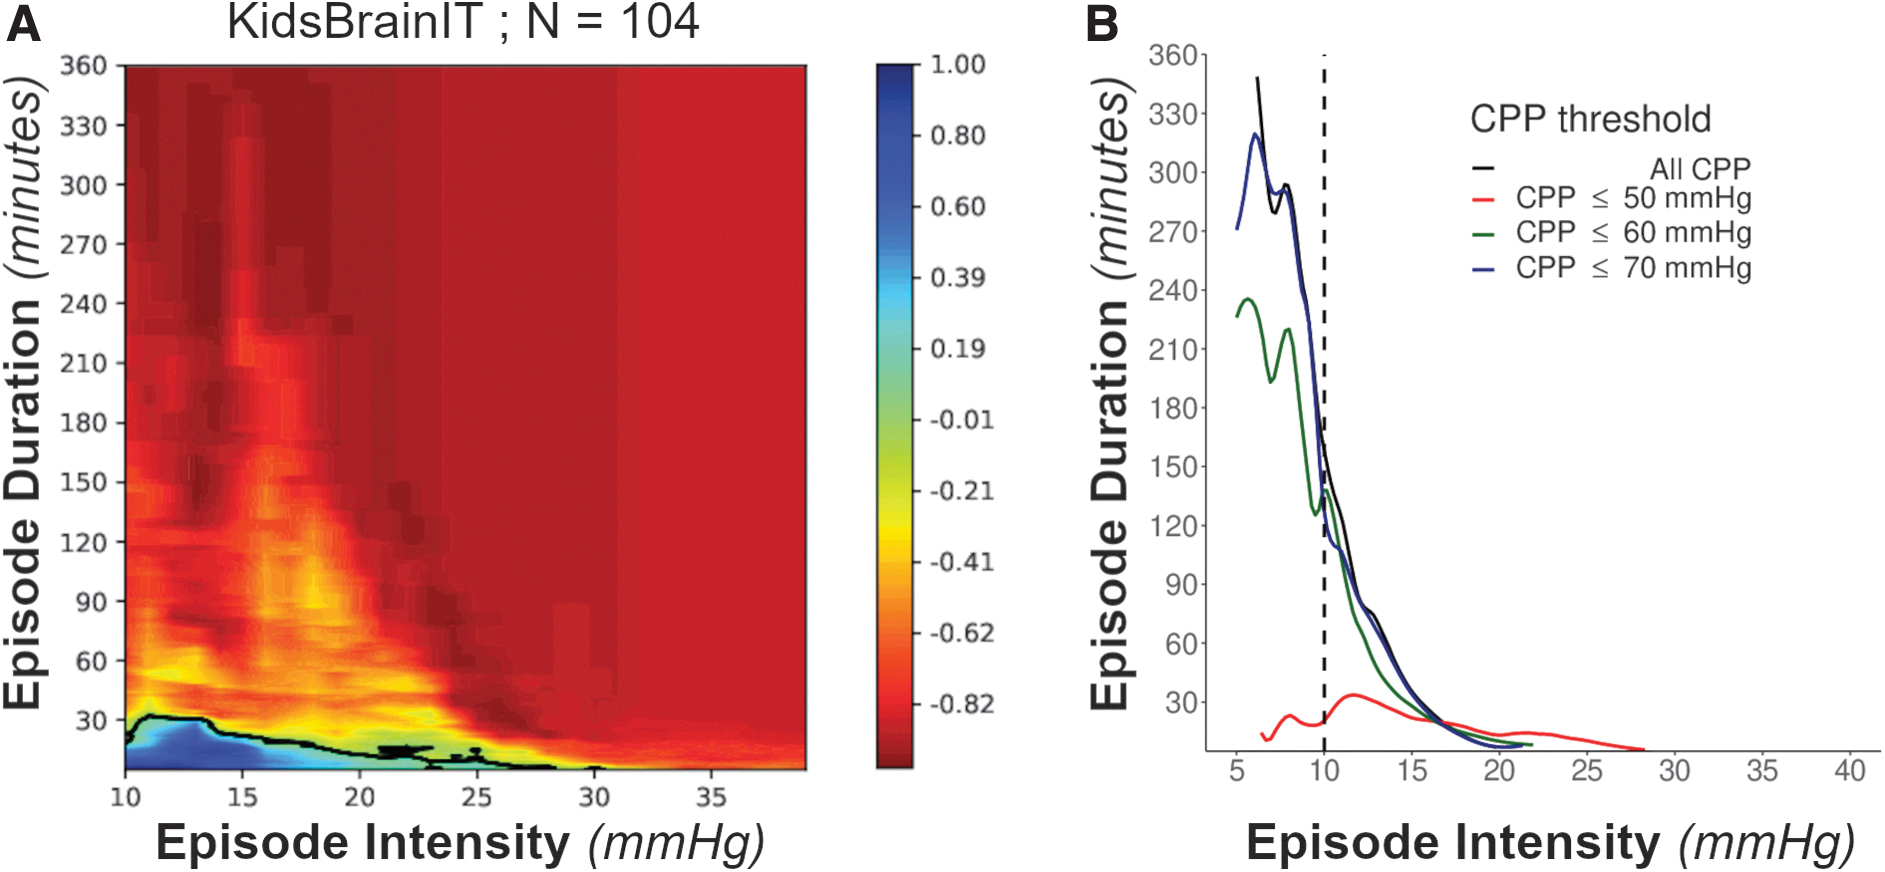
Color-coded visualizations of the univariate correlation between the Glasgow Outcome Score at 6 months (GOS-6) and the average amount of intracranial pressure (ICP) insults per GOS category along cerebral perfusion pressure (CPP) thresholds ≤50, 60, and 70 mm Hg. Red and blue color indicate a negative and positive association respectively of ICP events with GOS-6.
On average, patients spent 39.57% (± 26.94%) time of their total monitoring time in the red zone of Figure 1B. Multi-variable logistic regression with IMPACT covariates (Table 2) revealed that the percentage of time spent in the red zone was not a significant independent predictor of favorable neurological outcome (i.e., GOS >3; odds ratio [OR] 0.23; p = 0.12), while admission motor GCS was a significant predictor (OR 1.44; p = 0.019). Percentage of time spent in the red zone showed a trend towards significance in predicting mortality (OR 31.4; p = 0.057), but the IMPACT core variables were not a significant predictor for mortality. The subgroup of patients that died (GOS = 1) spent 60,04 % (± 27,63 %) of total monitoring time in the red zone which was much higher than the average patient.
Multi-Variable Logistic Regression Models
Effect of the percentage time spent in the red zone out of the total monitoring time with IMPACT model core variables on GOS favorable or GOS Mortality. Pupil Reactivity was recoded as: two pupils reacting = 1, one pupil reacting = 2, no pupils reacting = 3. Motor GCS levels correspond to the original encodings 1, 2, 3, 4, 5 and 6.
GOS, Glasgow Outcome Scale; OR, odds ratio; CI, confidence interval; GCS, Glasgow Coma Scale.
Discussion
In this multi-center, multi-national pediatric TBI study, the color-coded ICP dose-response visualization plot was successfully reproduced for the first time in an independent prospectively collected data set.
The ICP dose-response visualization plot, first described in 2015, uses prospectively collected minute-by-minute monitoring data to determine retrospectively the relationship between outcome at 6 months post TBI and the pressure time burden of ICP above 10 mm Hg. 27 It allows a more precise definition of dose of ICP burden and its relation to outcome following both adult and pediatric TBI. 27 Previous attempt by Swedish colleagues to reproduce the pediatric ICP dose-response plot was unsuccessful because of the small sample size from a single center study. 40 Our successful independent reproduction of the ICP visualization plot in childhood TBI is, therefore, particularly important as we have now confirmed ICP of 20 mm Hg or more are harmful to pediatric patients and should be avoided. The latter finding may also explain why previous randomized controlled trials in TBI using a 20 mm Hg static threshold failed to demonstrate any outcome improvement. 41 –45
Through this current study, we have also confirmed TBI patients between ages 2 and 16 years are much less tolerant of rises in ICP than adults. Additionally, we confirmed ICP values between 10 and 15 mm Hg, if sustained for sufficient duration, should not be considered harmless in childhood TBI through the exponential decay transition curve. This supports the current view on adult TBI that the harmful effects of the prolonged ICP elevations at lower levels are neglected by existing ICP treatment thresholds in published guidelines. 46 Given the importance of ICP dose burden at these lower ICP levels, the more recent literature recommends initiation of ICP therapy should be considered for ICP at lower thresholds. 46 Our finding, therefore, also strongly supports a clinical need to reduce the ICP therapeutic threshold used at the bedside when treating pediatric TBI patients rather than only avoiding ICP of 20 mm Hg or more as adults. This constitutes a significant shift in pediatric post-TBI ICP management paradigm for over 3 decades and may be an important step towards improving future childhood brain trauma outcome.
The most recent international pediatric acute TBI management guidelines did recommend the therapeutic target threshold for ICP should be lower than 20 mm Hg for infants and children. 25 However, they were unable to recommend a specific target below 20 mm Hg due to the lack of available evidence in the literature. 25 Our current data informatics study, therefore, adds to the literature by confirming the association of ICP at 20 mm Hg or more, sustained at any duration, with worse outcome in pediatric TBI. Previous studies suggested lowering the target ICP treatment threshold to 15 mm Hg for pediatric TBI may help to improve outcome, our ICP dose-response plot would support that suggestion as our patients were tolerant of having 30 min of ICP ≥15 mm Hg in both the previous report and the present study. 12,27
Pressure active and pressure passive patterns of the ICP and mABP relationships give a proxy assessment of the cerebrovascular autoregulation states. 35 In our previous report, active and passive vasoreactivity status affected how adult and pediatric TBI patients tolerated ICP insults. 27 Active or passive vasoreactivity did not affect the ICP dose-response in our current study with ICP intensity >10 mm Hg, which was in contrast to our previous report describing patients with an active pressure pattern being more tolerant of ICP-dose effect. 27 This was a surprising finding as the patient characteristics (age and sex distributions), primary brain injury severity (GCS), and treatments were very similar in both cohorts despite recruitment into the respective study being almost 2 decades apart.
We demonstrated for the first time in this present study worse outcome in pediatric TBI patients with passive vasoreactivity when considering ICP events between 5 and 10 mm Hg. ICP at this range are traditionally considered harmless, as they lie within clinically accepted normal ranges and no prior study had investigated their potential impact on childhood brain trauma outcome. Our findings suggest for the first-time brain trauma and vasoreactivity affect how children handle ICP between 5 and 10 mm Hg, and these lower ICP events should not be considered completely harmless in the injured developing brain and warrants further investigations.
We previously demonstrated almost all ICP insults were associated with worse outcome at a CPP below 50 mm Hg (i.e., the dose-response plot being almost uniformly red) in both adult and pediatric TBI. 27 This current study had validated this finding in childhood brain trauma for the first time using an independent dataset. This confirms the important concept that in the presence of critically low CPP, ICP is no longer a univariate predictor for outcome. 27 However, it is important to take caution when interpreting these data because different PICUs may have different standard practice on how arterial blood pressures are measured and zeroed. Thus, while the effects of CPP on the association between ICP and outcome were demonstrated in this study, it could not be used to recommend specific CPP target treatment thresholds.
Our study has several limitations. Despite being a multi-center, multi-national study involving seven countries, the number of patients in this study is relatively small. This reflects the reported reduction in childhood TBI incidence in higher income countries following the successful implementation of injury preventative measures. With the small sample size, it was not possible to conduct subgroup analyses to assess the age effects on ICP dose and outcome in childhood brain trauma. The small sample size resulted in wide uncertainty estimates of the transition line shown in Figure 1B. Uncertainty was assessed by computing a Fisher transformation for each computed Pearson correlation with a 80% CI, and by population bootstrapping with replacement (± 2 standard deviations) of which the visualizations can be found in the Supplementary Material. 33 A global effort to pool existing and novel PICU data could greatly enhance the uncertainty estimates of the depicted transition lines. Our analysis was performed in treated cohort of patients as an observational study. This means it is not possible to assess the individual contributions to clinical outcome of the secondary brain insult intensity compared with the possible benefit or harm of medical interventions delivered to manage them.
The obvious artefacts in the raw physiological data in this study were detected and removed using the same independent expert led operating procedure as our previously report study. However, instead of using two independent experts to remove artefacts as in our previous study, a trained researcher with prior PICU clinical experience and a custom-built automated artefact removal algorithm jointly completed the task in this current study. Using this joint approach to detect artefacts might potentially introduce bias, but we found both the trained researcher and our custom-built automated algorithm successfully identified the artefacts as well as the independent experts in our previous studies. Artefacts removed either by the trained researcher or the automated algorithm only remove the obvious artefacts like our previous study but they did not detect less obvious artefacts because we wanted to retain as much of the granularity of the minute-by-minute data as possible. Finally, while the ICP dose-response plots produced a clear single image of the observed associations, they do not imply a causative relationship between the insults and the outcome where other unmeasured confounders might have played a role.
Conclusion
An image really is worth a thousand words: the pediatric ICP dose-response visualization method validated in this study clearly summarizes the complexity of raised ICP secondary insults on outcome in childhood TBI. Further, pediatric TBI patients are completely intolerant ICP of 20 mm Hg or more. There is, therefore, a pressing need to lower ICP therapeutic thresholds used at the bedside if we want to improve childhood TBI outcome.
Transparency, Rigor, and Reproducibility Summary
The study design and analytic plan were not pre-registered but communicated prior to the funding agency of which the present paper is a subsection of the planned work and analyses. In general, the KidsBrainIT project aimed to recruit 146 patients, ages 2 to 16 years, from 16 pediatric intensive care units (PICUs) located in seven countries. Of the 146 recruited patients, 116 had 6 months follow-up data (GOS-6), essential for the outlined analyses in the present study. The number of patients was further reduced to the final number of 104 patients after data preparation and cleaning, due to lack of the key physiological time series variables: arterial blood pressure (ABP) and/or intracranial pressure (ICP) in the respective 12 patients.
The main scientific output of the study does not concern significance testing (i.e., reproducing the pediatric ICP dose-response plot in an independent novel data set), given that we want to capture both (non)significant correlations as outlined in Guïza and colleagues (2015), 27 of which the correlation matrix is subsequently visualized in the ICP dose-response plot. To do so, we used the data of the 104 patients that had all the necessary variables available: ABP, ICP, and GOS-6. No prior power calculation was performed for the reported multi-variable logistic regressions.
Footnotes
Acknowledgments
We would like to acknowledge the local Principal Investigators (PI) and their team in the KidsBrainIT consortium for their contributions to the success of patient recruitments. In the UK: K. Morris from the Birmingham Children's Hospital, Birmingham, UK; D. Wood and M. Garcia Cusco from the Bristol University Hospital, Bristol, UK; J. Kandasamy from the Royal Hospital for Children and Young People, Edinburgh, UK; R. Levin and R. O'Kane from the Royal Hospital for Children, Glasgow, UK; K. Thorburn, C. Park and N. Shetty from the Alder Hey Children's Hospital, Liverpool, UK; B. Dwarakanathan from the St George's University Hospitals NHS Foundation Trust, London, UK; G. Subramanian from the Manchester University NHS Foundation Trust, Manchester, UK; P. Davies from the Nottingham University Hospital, Nottingham, UK; J. Weitz and A. Sarfatti from the Oxford University Hospital, Oxford, UK. In the EU: G. Meyfroidt from the University Hospitals Leuven, Leuven, Belgium; M. Poca from the Vall d'Hebron University Hospital, Barcelona, Spain; S. Tascu from the Bagdasar-Arseni Clinical Hospital, Bucharest, Romania; C. Apetrei from the Emergency Hospital “Prof. Dr. N. Oblu Iasi”, Iasi, Romania; A. Moscatelli from the IRCCS Istituto Giannina Gaslini, Genova, Italy;  from the University Hospital Tübingen, Tübingen, Germany.
We send our special thanks to Prof. R. A. Minns for his contribution to KidsBrainIT pilot and mentoring Dr. Lo. Finally, we would like to thank Dr. Ir. Giorgia Carra for her guidance to Bavo Kempen on data analysis used in this study; and Rob Donald for his contribution to the semi-automated artefact detection algorithm.
Authors' Contributions
Bavo Kempen, Tsz-Yan Milly Lo, and Bart Depreitere wrote the first draft and finalized the manuscript with contributions from other co-authors. Bavo Kempen conducted the analysis with Drs. Depreitere's and Lo's feedback. Ian Piper delivered the purpose built data collection tool, and bedside monitor interfacing for data extraction that were essential for this project. Patricia Jones led the physiological data cleaning methodology. Dr. Depreitere and Dr. Lo are joint senior authors for this paper.
Funding Information
The KidsBrainIT project was funded by the ERA-NET NEURON Joint Translational Call (JTC) 2016, with MRC as its UK funding partner (MR/R004498/1).
Bavo Kempen is funded by a PhD fellowship strategic basic research from the Foundation for Scientific Research Flanders (1S12523N) and was funded through a Research Chair on Brain Trauma awarded by the Laly Foundation to Bart Depreitere. Dr. Lo's research time is funded by the NHS Research Scotland (NRS) Career Research Clinician Award.
Author Disclosure Statement
No competing financial interests exist.
Supplementary Material
Supplementary Figure S1
Supplementary Figure S2
Supplementary Figure S3
References
Supplementary Material
Please find the following supplemental material available below.
For Open Access articles published under a Creative Commons License, all supplemental material carries the same license as the article it is associated with.
For non-Open Access articles published, all supplemental material carries a non-exclusive license, and permission requests for re-use of supplemental material or any part of supplemental material shall be sent directly to the copyright owner as specified in the copyright notice associated with the article.
