




Abstract
Neurophysiological diaschisis presents in traumatic brain injury (TBI) as functional impairment distant to the lesion site caused by axonal neuroexcitation and deafferentation. Diaschisis studies in TBI models have evaluated acute phase functional and microstructural changes. Here, in vivo biochemical changes and cerebral blood flow (CBF) dynamics following TBI are studied with magnetic resonance. Behavioral assessments, magnetic resonance spectroscopy (MRS), and CBF measurements on rats followed cortical impact TBI. Data were acquired pre-TBI and 1-3 h, 2-days, 7-days, and 14-days post-TBI. MRS was performed on the ipsilateral and contralateral sides in the cortex, striatum, and thalamus. Metabolites measured by MRS included
Introduction
Diaschisis is a collection of neurophysiological changes occurring distant to a focal primary lesion, which has been broadly studied in various stroke models. Diaschisis in traumatic brain injury (TBI) models was reported in the 1950s and attributed to structural loss of neuronal integrity. 1 This interpretation has since been supported by a diffusion tensor imaging (DTI) study in a murine model that suggested remote alterations in neuronal structure. 2 DTI results from mild TBI human patients also suggest mechanical damage to axons that disrupts ionic homeostasis. 3
Diaschisis reported from stroke models suggest that remote cerebral blood flow (CBF) changes are less striking than distant neuronal and metabolic abnormalities. 4 TBI induces neurochemical changes close to the injury site, attributable to reduced substrate delivery, impaired mitochondrial function, diminished neurotransmission, and increased oxidative stress. 5,6 Neurochemical effects from TBI at sites remote from focal trauma are not well studied, but one study found unilateral cortical impact produced transhemispheric diaschisis manifesting as impaired gamma aminobutyric acid (GABA) ergic transmission and increased expression of GABA receptor subunits remote to the lesion. 7 Similar presentations of diaschisis were found in stroke models. 4 Magnetic resonance spectroscopy (MRS) in a human cohort with primary motor cortex stroke lesions revealed diaschisis of biochemical changes. 8 MRS studies in human children have reported that TBI is associated with changes in aspartate (Asp), glutamate (Glu) and N-acetyl aspartate (NAA) at approximately 3 months post-trauma. 9,10
The aim of the current study was to use MRS and brain perfusion magnetic resonance imaging (MRI) to validate the hypotheses that biochemical and CBF diaschisis occur in cortical and subcortical regions outside the primary injury site as acute sequelae to mild head trauma in a rat model.
Methods
Rat model of traumatic brain injury
Male Sprague Dawley rats (200-350 grams) from Charles Rivers Laboratories were housed singly after injury and given food and water ad libitum with two environmental enrichments, cardboard Bio-Tunnels and Enviropak. The rats were randomly assigned to the cortex (n = 7), striatum (n = 8), and thalamus (n = 8) groups since MRS protocols prohibited scanning of all three structures of interest in one session. All procedures were approved by the Institutional Animal Care and Use Committee at the University of Texas Health Science Center at San Antonio.
Open-skull TBI was induced using a controlled cortical impact (CCI), which is a model well established in our laboratory. 11 -13 Sprague-Dawley rats were anesthetized initially with 3-5% isoflurane mixed with room air and maintained at 1.5% isoflurane throughout all surgical and imaging procedures. Rats were secured in a stereotaxic frame with ear and tooth bars and body temperature was maintained using a heating pad with a temperature regulated feedback system. An incision was made at the level of the cerebellum, the periosteum was removed over the impact site, and a 3 mm diameter craniotomy was created using a rotary power tool over the left primary somatosensory cortex (S1: +0.25 mm anterior and 3.5 mm lateral to bregma), exposing the dura mater. The CCI injury was accomplished by a rapid, non-penetrating compression of the S1 cortex using a pneumatic impactor fitted with a flat metal tip (2-mm diameter) through the craniotomy. The impact parameters used were, velocity = 5.0 m/sec, depth = 1.0 mm, dwell time = 250 μsec. 11 -13 After TBI, the cranial opening was sealed with bone wax and the incision closed. Burprenex (0.05 mg/kg) was given subcutaneously for pain.
Behavioral assessments
The asymmetry forelimb placement (cylinder) test was used to assess locomotor asymmetry. 14 -16 Each animal was assessed 1-3 days prior to TBI, and again 2, 7, and 14 days post-injury. The animals were placed in a clear plastic cylinder (20 cm diameter, 30 cm height) and allowed to explore the cylinder for 5 min or until 30 forepaw placements were completed and recorded using video. The number of left or right individual forelimb placements and the number of simultaneous left and right forelimb placements onto the cylinder wall were counted. The percentage of impaired and non-impaired forelimb contacts was calculated. Behavioral data were recorded prior to each MRI session to avoid residual anesthesia effects.
The foot fault test assessed motor impairments of limb function and placement deficits during movement using a video camera. 15,17 The animal was placed on an elevated, leveled grid floor (45.7 cm × 27.9 cm) with grid openings of 3.96 cm2 and 2.54 cm2 for 5 min or until 50 steps were taken with one (right) forelimb. The animal was allowed to freely traverse the grid, the number of foot faults was counted, and the percentage of foot faults was calculated.
Magnetic resonance imaging and spectroscopy
MRI and MRS were performed on a 7 Tesla system (Biospec, Bruker Corp., Billerica, MA) under 1.0-1.5% isoflurane. The rats were initially anesthetized using 3-5% isoflurane and then secured in a custom holder with a built-in heating pad. Breathing, heart rate, and temperature were continuously monitored during imaging using a pulse oximeter and a temperature regulated feedback system. The custom-made quadrature transmit-receive surface coil (2.3 cm in diameter) was positioned close to the site of impact. A separate labeling coil was positioned on the neck to label the blood in the carotid artery for the continuous arterial spin labelling (cASL) perfusion MRI. The MRI sequences included multi-echo T2, rapid imaging with refocused echoes (RARE) for T2 parametric maps, cASL for CBF maps, and stimulated echo acquisition mode (STEAM) for MRS. All scan data were acquired pre-injury and 1-3 h, 2-, 7-, and 14-days post-TBI.
T2-RARE images were acquired at a voxel resolution of 0.267 × 0.267 mm2, which were interpolated to a 128 × 128 matrix. Nine MRI slices were acquired with 1 mm slice thickness. The middle slice was centered on the anterior commissure. Parameters for the multi-echo T2-RARE were echo time (TE) = 18, 54, 90, and 126 msec; repetition time (TR) = 3000 msec; number of signals averaged (NSA) = 8; RARE factor = 4; flip angles (FAs): FAex = 90o (excitation) and FAref = 180o (refocusing); scan time = 9´36″.
Perfusion imaging with cASL for CBF measurements was acquired with the same FOV, matrix size and slice parameters. Timing parameters for the cASL scan were TE = 13.03 msec, TR = 3070.62 msec, NSA = 1, receiver bandwidth (BW) = 250 kHz, FAex = 90o, labeling time = 2503 msec, post-labeling delay = 250 msec, and scan time = 6´ 8″.
The multi-echo T2 data and cASL for CBF was processed using in-house Matlab code (The Mathworks. Inc, Natick, MA). The RARE data, gathered at the four TEs, were used to construct a parametric T2-image which allowed edema/lesion formation to be visualized. Hyperintense signal was attributed to edema if the value of the voxel was greater than or equal to ∼55, which was set as the threshold for determining the regions of interest (ROIs) to quantify lesion size using Multi-image Analysis GUI (Mango; https://mangoviewer.com/). In-house Matlab code was used to process the cASL image data to produce CBF parametric maps after removing the skull from the brain using a brain extraction tool and then calculating the CBF value for each voxel using the equation 18 :
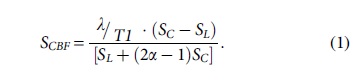
where SC and SL are signal intensities of the control and labeled images, λ is the brain-blood partition coefficient of water, T1 is the longitudinal relaxation time of the brain, and α is the labeling efficiency.
An ROI was made using the Day 2 post-injury T2 maps, as detailed in a previous study. 11 CBF quantification for the cortex used this ROI while the ROIs for the CBF in the striatum and thalamus were 3 × 3 × 3 mm3 voxels. The striatum was present in slices 5, 6, and 7. The thalamus was present in slices 1, 2, and 3.
MR spectra were acquired using STEAM with TE = 2.0 msec, mixing time = 10 msec, FA = 90o, voxel size = 3 × 2 × 5 mm3 (somatosensory cortex) and 3 × 3 × 3 mm3 (striatum and thalamus), data points = 2048, bandwidth = 4000 Hz, VAPOR (variable power radiofrequency pulses with optimized relaxation delays) water suppression (BW = 200 Hz) and outer volume saturation. Voxel homogeneity was optimized using local 1st and 2nd order shimming. TR = 4000 msec, NSA = 320 for somatosensory cortex acquisitions (21´20″), and the greater depth and poorer signal from both voxels in thalamic and striatal structures required NSA = 640 for the striatum and thalamus acquisitions (1´40″). Positionings of the ROIs in the three brain regions are shown in Figure 1A.

Magnetic resonance spectroscopy (MRS) voxel placement and features.
Spectral analyses were performed using jMRUI, which generated a basis set of the desired metabolites using NMRSCOPEB. 19 The magnetic field and MRS parameters were input to generate a “prior knowledge” basis set for the metabolites. The jMRUI2XML plugin was used to set the reference at 4.7 ppm and to apodize the spectra (Lorentzian = 2-10 Hz). 20 Water suppression was performed (4.31 to 5.11 ppm). Background subtraction was applied to remove noise, lipids, and macromolecules with 25-50 truncation points. Quantification was referenced to a spectrum acquired with water suppression turned off using the following equation 21 :

Here, the metabolite concentrations are reported in mmol/L. Sm and Sw are the signal amplitudes for the considered metabolite and the reference respectively, CorrW and CorrTiss, are the correction terms for the experimental settings with CorrW being a correction value for the acquisition of the reference/water signal and experimental signal while CorrTiss is the correction value for the water content in the volume of interest (∼0.82 for gray matter and ∼0.73 for white matter). 20 A representative spectrum from the cortex showing brain metabolites resolvable at 7 Tesla is displayed in Figure 1B.
An ROI was made using the Day 2 post-injury T2 maps, as detailed in a previous study. 11 CBF quantification for the cortex used this ROI while the ROIs for the CBF in the striatum and thalamus were 3 × 3 × 3 mm3 voxels. The striatum was present in slices 5, 6, and 7. The thalamus was present in slices 1, 2, and 3.
Statistical analysis
Data analyses were performed using the R statistical environment within the RStudio Pro (2023.09.1 Build 494.pro2) integrated development environment (Posit Software PBC, Boston, MA). 22 Student's t-test was used to compare the differences between pre-injury values to the subsequent hours and days post-TBI values for the CBF, and behavioral data. For the MR spectroscopy study, a two-way mixed analysis of variance (ANOVA) was used (package: rstatix) with the ipsilateral and contralateral (Side) and post-TBI time (Time) as factors for data sets from the somatosensory cortexes, striata, and thalami. Interactions between Side and Time factors also were determined. The Shapiro test was used to assess normality and Lavene's test was used to assess homogeneity of variance. After the ANOVA, pairwise t-tests with Holm multiple comparison adjustments were used to evaluate the differences between CBF values and metabolite concentrations for the two sides of each brain region at each measurement time-point. Pairwise t-tests with Holm multiple comparison adjustments also were used to evaluate changes within a side/brain region at each measurement time-point compared with pre-trauma baseline measurements. For all analyses, significance was deemed at adjusted p ≤ 0.05. Data are presented as mean ± standard deviation (SD) unless otherwise indicated.
Results
Lesion volume progression
Notable lesion size and behavioral deficits were reached by Day 2 and returned to pre-injury values by Day 14 post-TBI. Figure 2A shows T2 maps used to quantitate lesion volumes. In Figure 2B, measured volumes are plotted, which at 1-3 h post-injury had a mean ± SD of 24.67 ± 12.3 mm3, with a maximum on Day 2 (33.62 ± 15.1 mm3). The mean volumes then decreased from Day 7 (10.35 ± 5.9 mm3) to Day 14 (9.49 ± 5.9 mm3).
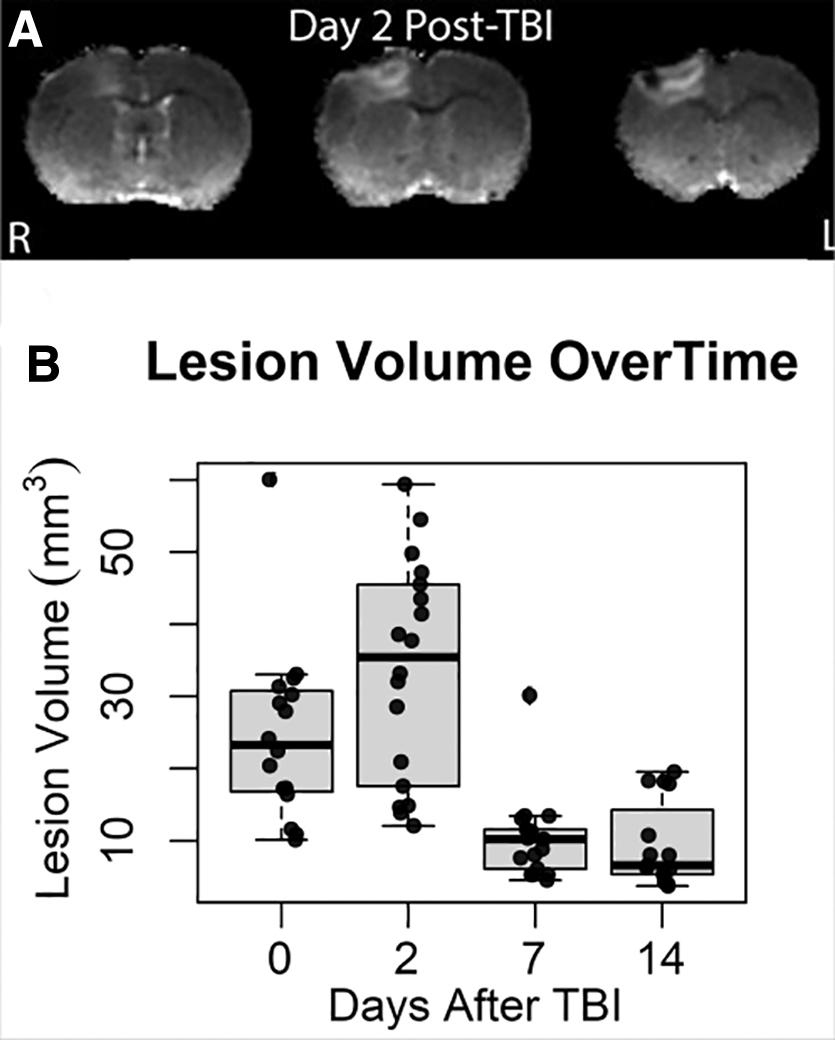
Progression of edema lesion volume is depicted in
Cerebral blood flow deficits in the cortex, striatum, and thalamus
Significant changes in CBF in the contralateral cortexes, striata, and thalami were noted, and these persisted to Day 14 post-TBI (Table 1). Figure 3 shows the CBF time courses in the ipsilateral and contralateral cortex. Significant differences in cortical CBF between sides were noted acutely (p = 0.034), as well as in Day 2 (p = 0.0003) and Day 14 (p = 0.027). In the ipsilateral striatum a significant reduction in CBF also was measured (p = 0.036), which further decreases by Day 2 (p = 0.006). No significant CBF changes from baseline were noted in the thalamus. Table 2 shows two-way ANOVA CBF results. Significant differences between Side (p = 0.04) and Time (p < 0.001) as well as Interaction (p = 0.002) were found in the cortex. Only significant differences in Time were found in the striatum (p = 0.002) and thalamus (p = 0.03).

Cerebral blood flow (CBF) measurements for two days post-TBI show acute decrease on both sides. Luxury perfusion on ipsilateral size is seen on Day 2 while contralateral CBF remains low. On later days cortical CBF is low on both sides. Values are mean ± standard error of the mean. Stars with lines indicate significant difference with respect to baseline. Stars at top indicate significant difference between sides. Contra: contralateral, Ipsi: ipsilateral. *p < 0.05, ***p < 0.005.
Summary of CBF Values Versus Pre-TBI Measurements Recorded Acutely, on Day 2, Day 7, and Day 14
CBF values in mL g−1 min−1. Data are presented as mean ± standard deviation.
CBF, cerebral blood flow; TBI, traumatic brain injury.
Results from a Two-Way Mixed ANOVA for CBF Measurements
p < 0.05.
p < 0.01.
p < 0.005.
ANOVA, analysis of variance; CBF, cerebral blood flow.
Motor deficit tests
Figure 4 presents the post-TBI time course results of the cylinder and grid test. Significant decreases in right paw placement (41.72 ± 17.1 %, p < 0.05) and increase in left paw placement (58.29 ± 17.1 %%, p < 0.05) as compared with pre-injury were found on Day 2. A significant increase in right paw faults (25.8 ± 13.8 %, p < 0.05) was observed at 2 days post-TBI.

Quantification of sensorimotor deficits. Graphs depict time-course of sensorimotor asymmetry changes of the
Post-trauma metabolite changes
Table 3 displays two-way mixed ANOVA results for metabolites showing significance values in the ipsilateral and contralateral somatosensory cortexes, striata, and thalami. Four cortical metabolites: Asp, GSH, NAA, and Lac had significant F-values for Side, Time, and Interaction in the cortex, while significant Side-Time interactions were found for cortical glucose and total creatine. In the striata, GSH was found to have significant changes in Time and Time-Side interactions. Striatal GABA and total choline had significant effects by Side and glutamate had significant Time effects. In the thalami, total creatine and Glu had significant effects by Side while GSH and NAA has significant Time-Side interactions. ANOVA results for all metabolites measured can be found in Supplementary Tables S1-S3.
Summary of Two-Way Mixed ANOVA Results of Metabolite Concentration Differences Over Time
Values are ranked by F-statistic (p value).
Tables 4 -6 list the bi-lateral metabolite concentration changes for all three brain regions at each time-point before and following TBI. In the acute phase (1-3 h post-trauma) there were only a few significant changes from baseline in the measured neurometabolite concentrations. However, the changes that were detected occurred bilaterally in the cerebral cortex, striatum, and thalamus. GSH was reduced from baseline on the ipsilateral side in both regions, from 1.30 ± 0.24 mM to 0.43 ± 0.20 mM kg−1 (p = 0.048) in the cortex and from 1.41 ± 0.19 mM kg−1 to 0.99 ± 0.29 mM kg−1 (p = 0.03) in the striatum (Fig. 5A, 5B). In the acute phase GSH also was reduced in the striatum on the ipsilateral side and from 1.48 ± 0.26 mM kg−1 to 0.85 ± 0.28 mM kg−1 (p = 0.003) on the contralateral side (Fig. 5B). Lactate was reduced in the contralateral cortex from 0.80 ± 0.45 mM kg−1 to 0.22 ± 0.14 mM kg−1 (p = 0.011; Fig. 6C). Supplementary Table S4 lists the pair-wise t-test results comparing sides of the brain during the acute phase for all three brain regions studied.
Metabolite Concentrations Following TBI in Ipsilateral and Contralateral Cortex
Acute = 0-3 h post-TBI.
TBI, traumatic brain injury; GABA, gamma aminobutyric acid.
Metabolite Concentrations (mM) Following TBI in Ipsilateral and Contralateral Striatum
Acute = 0-3 h post-TBI.
Data are presented as mean ± standard deviation.
TBI, traumatic brain injury; GABA, gamma aminobutyric acid.
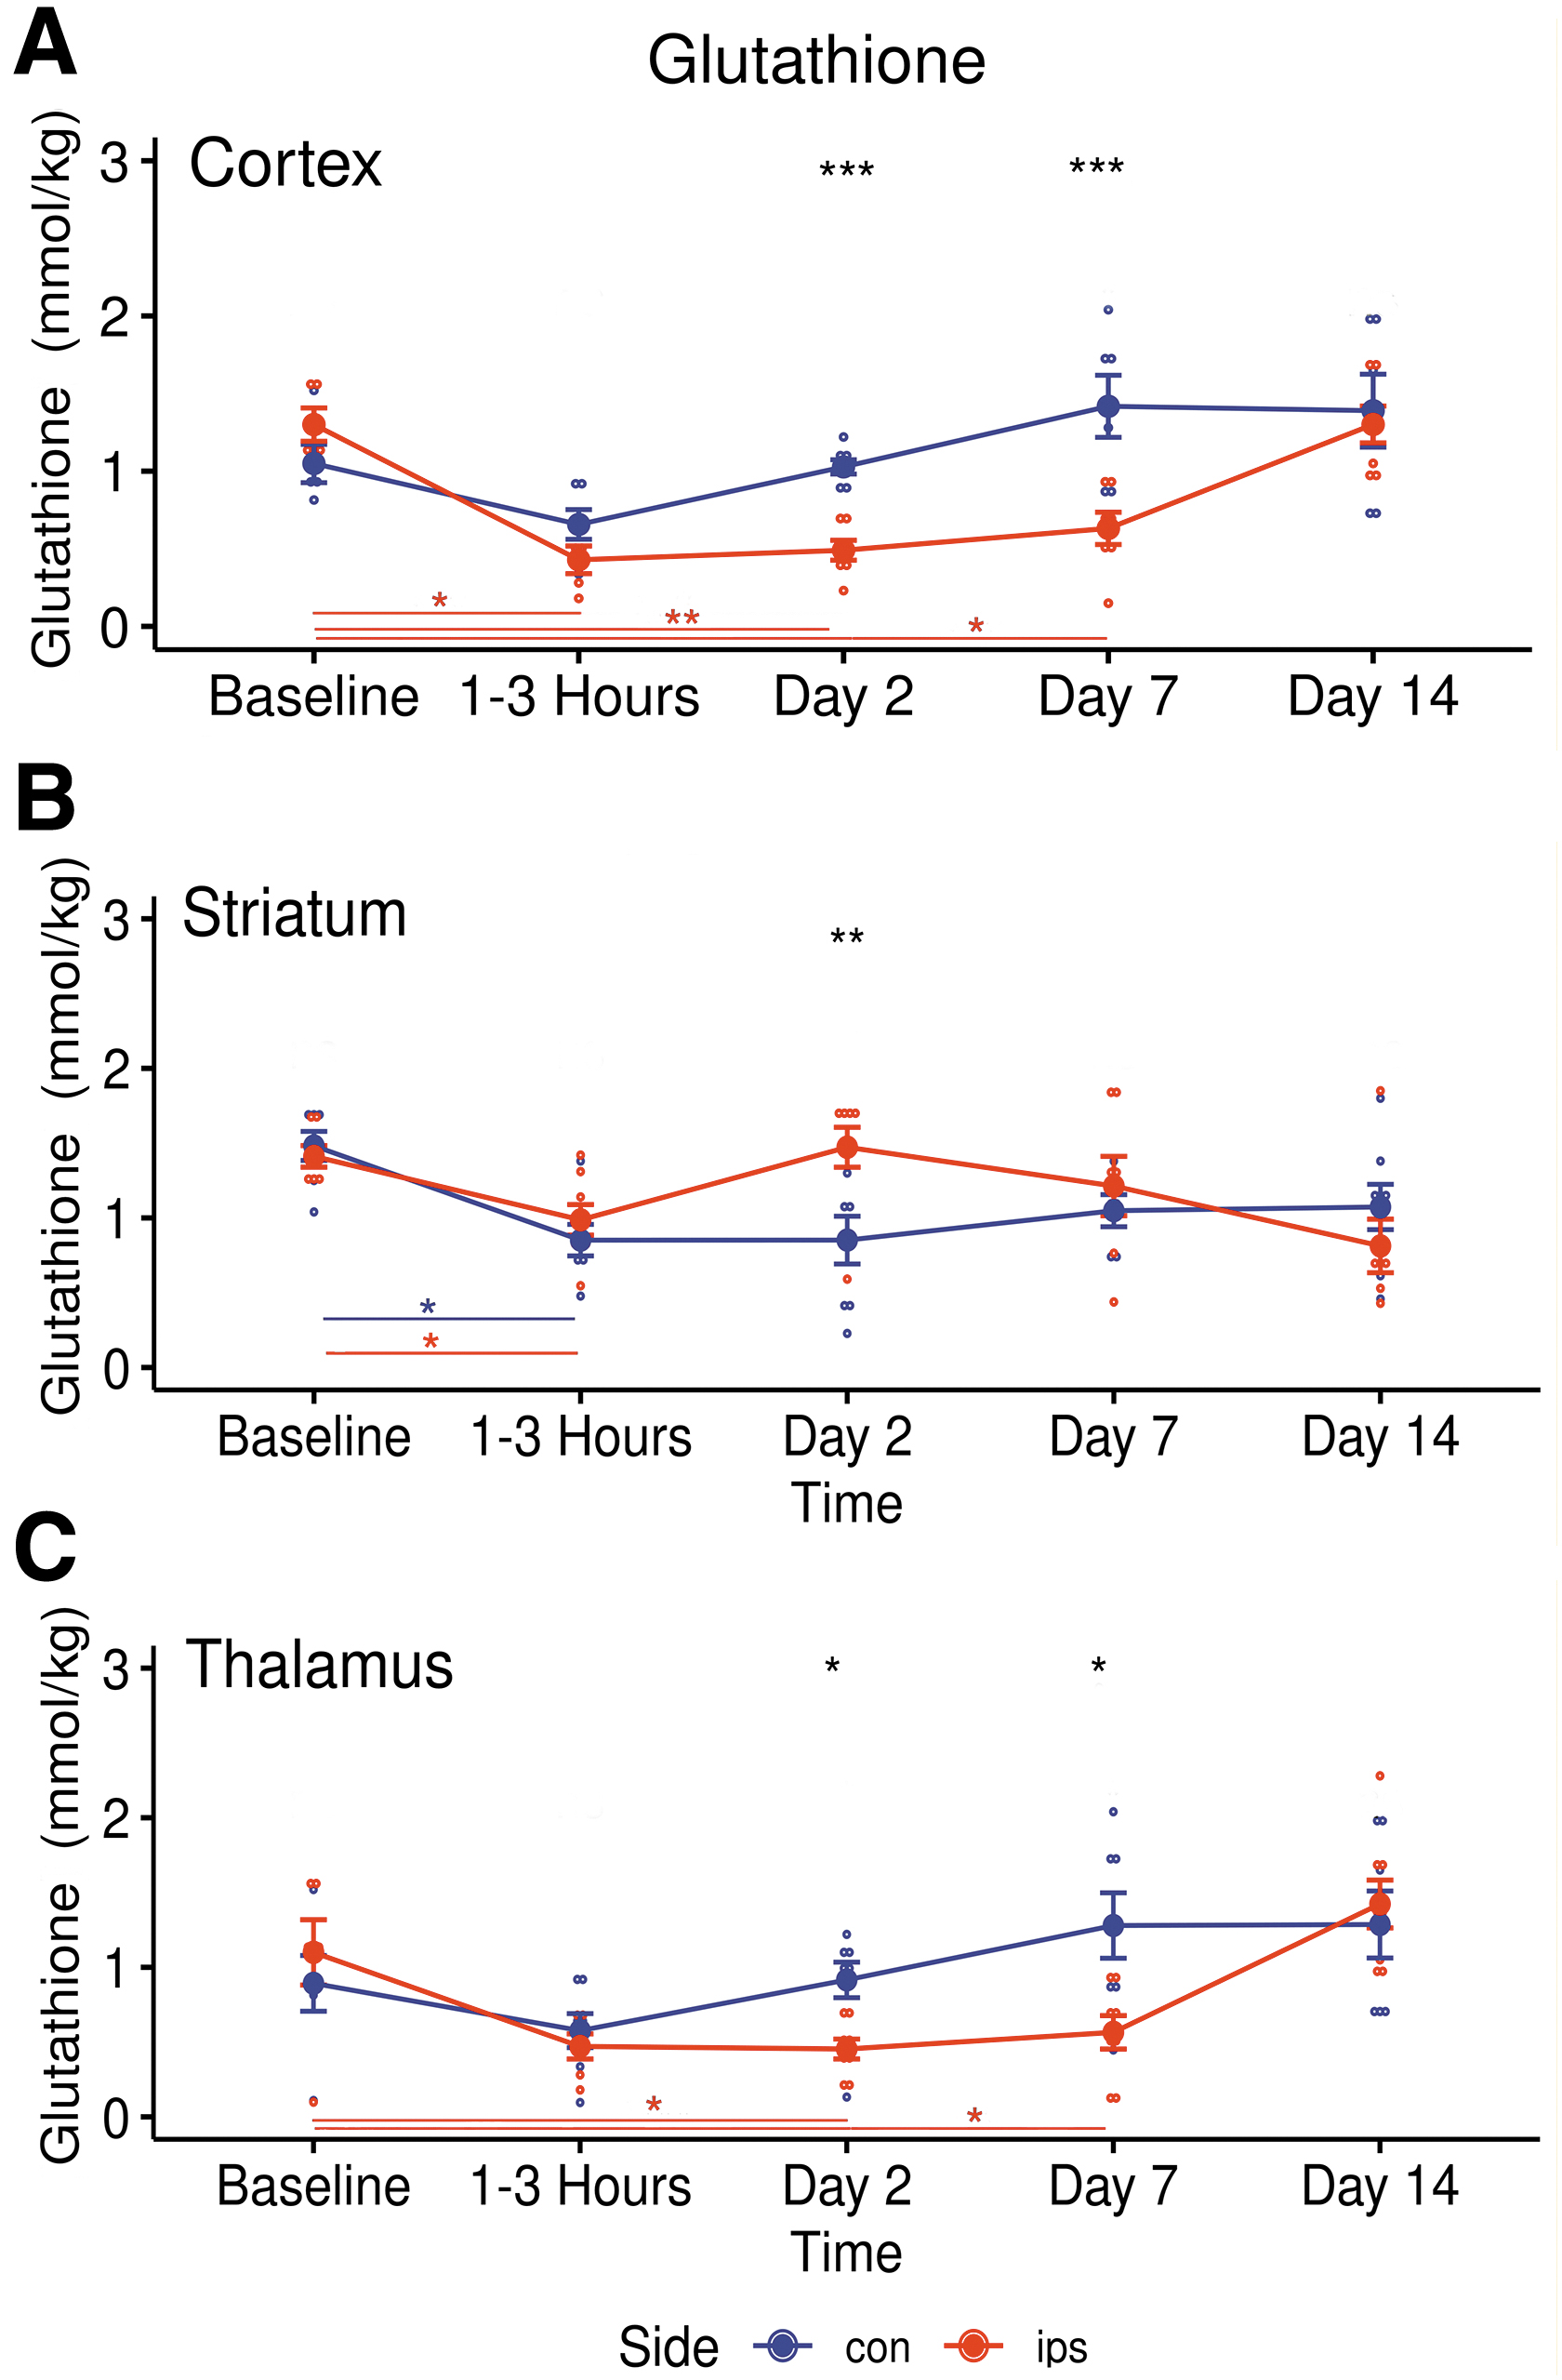
Longitudinal changes in glutathione (GSH) concentrations in ipsilateral (red) and contralateral (blue) metabolites in three brain regions following traumatic brain injury.
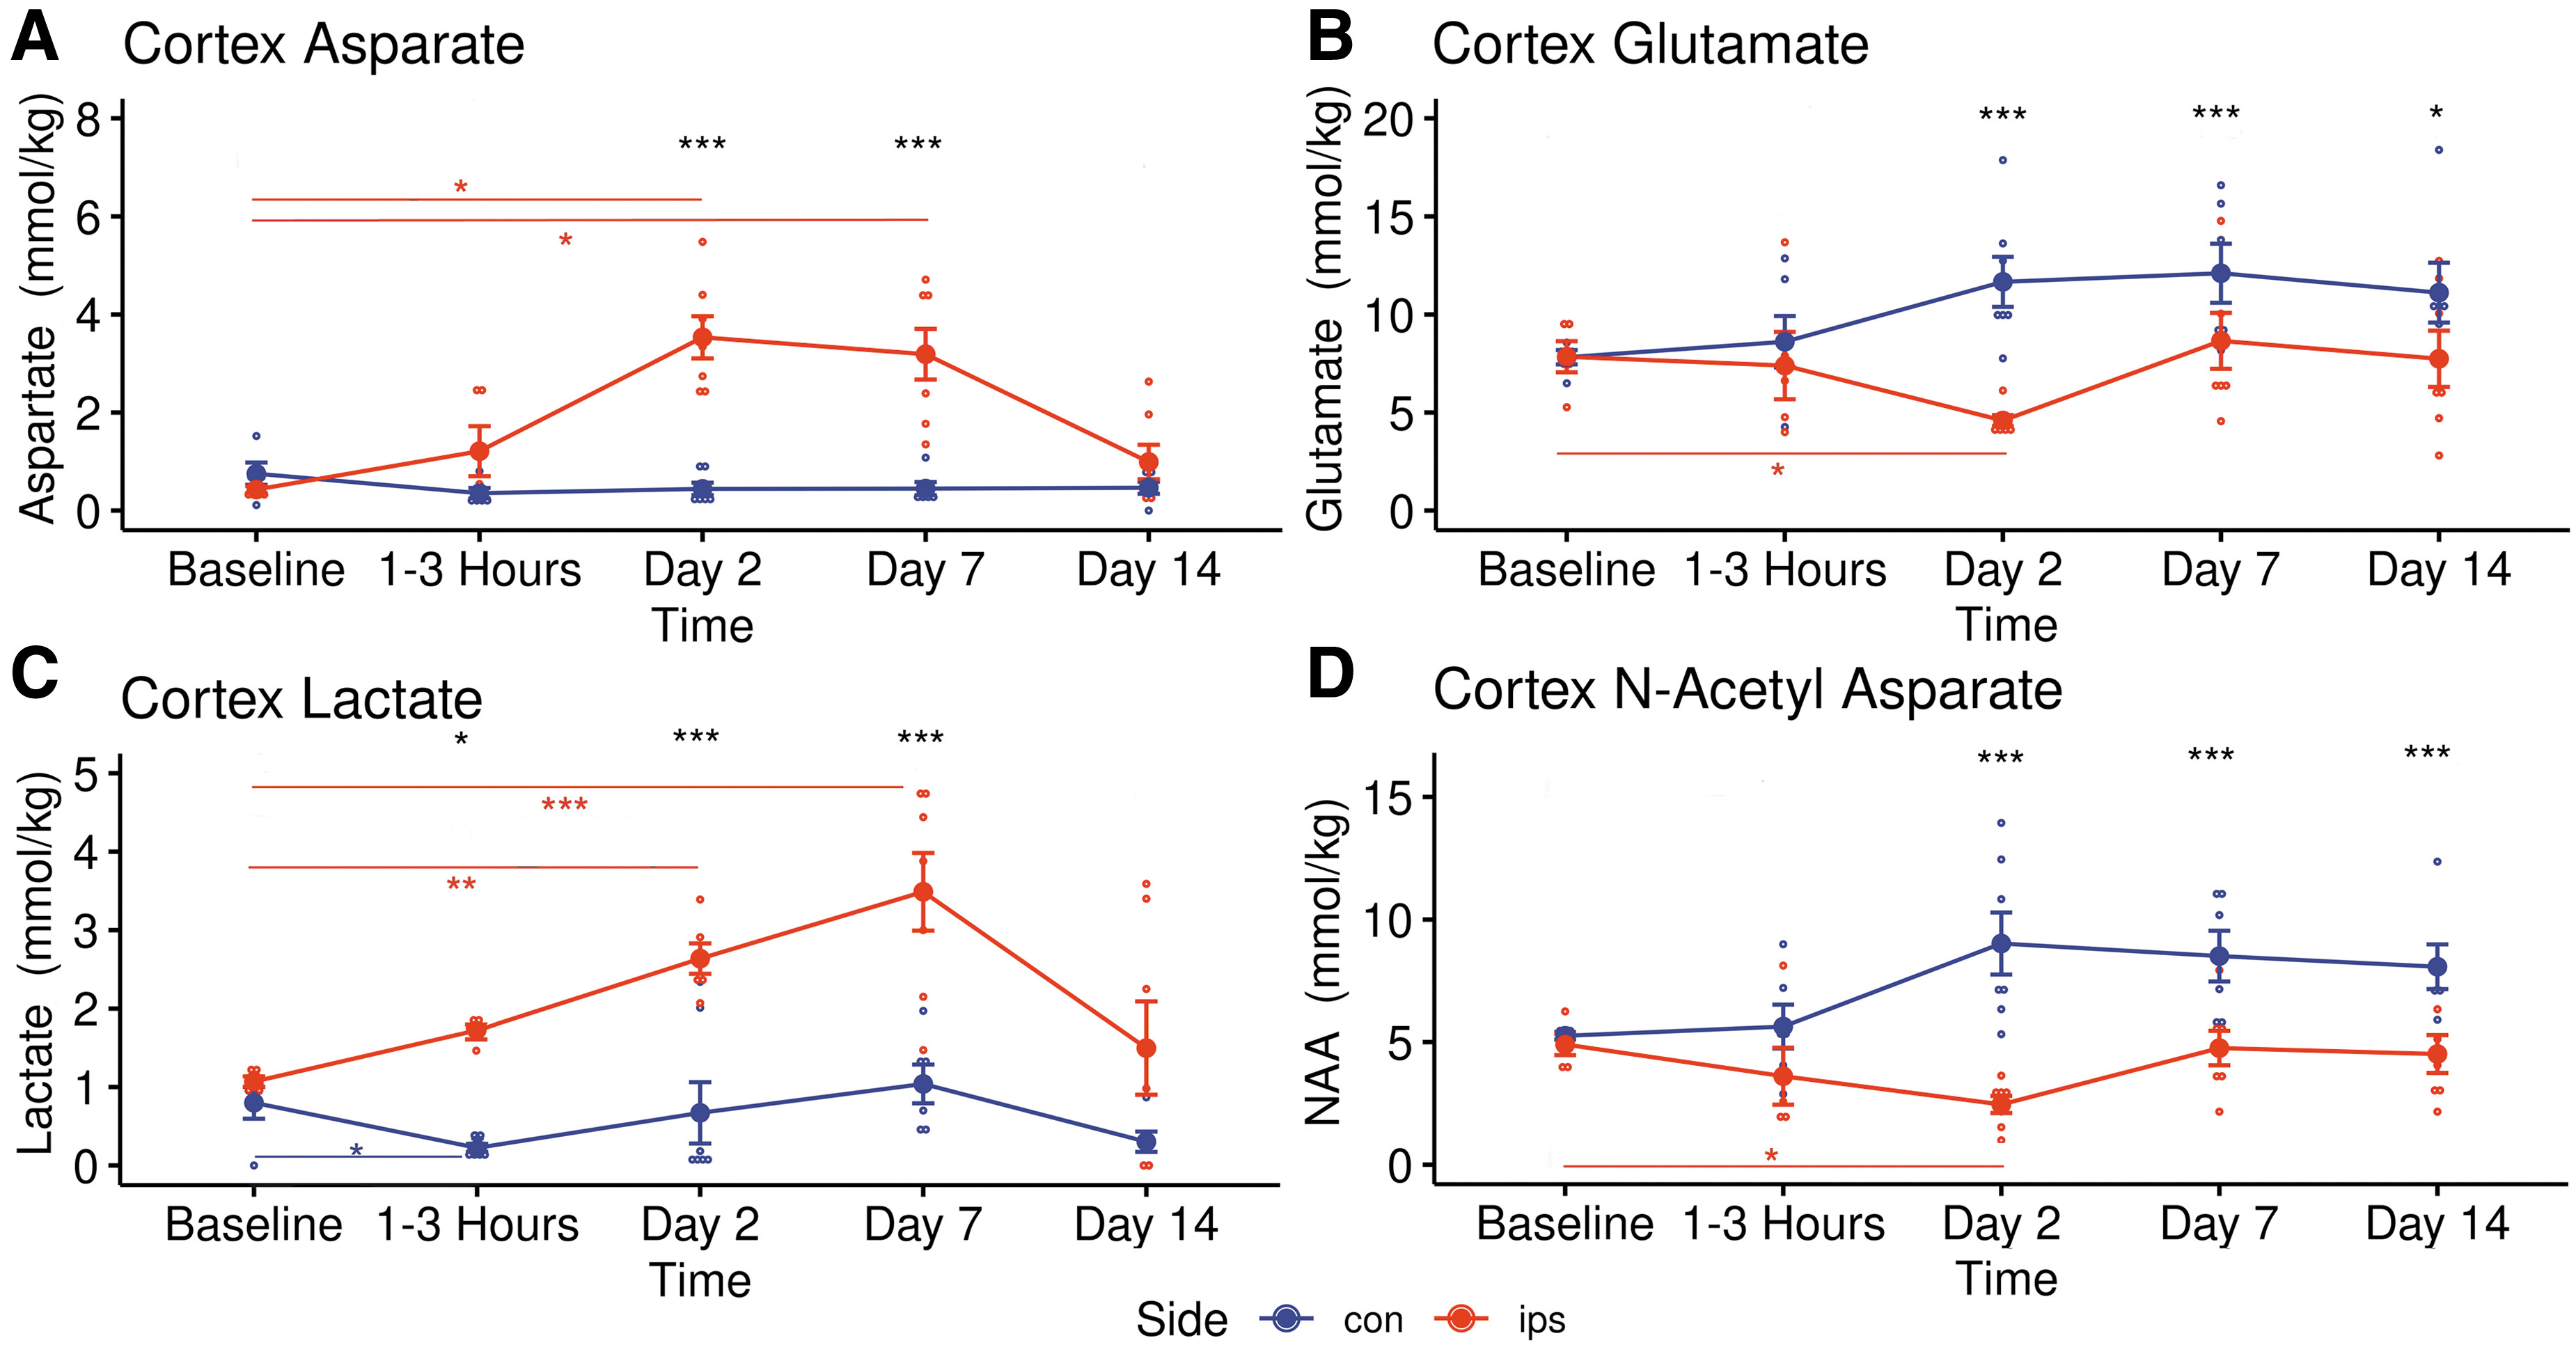
Longitudinal changes in four important metabolites in ipsilateral (red) and contralateral (blue) cortex following traumatic brain injury.
A significant post-TBI increase of Asp from baseline (0.43 ± 0.16 mM kg−1 to 3.53 ± 1.14 mM kg−1, p = 0.02) was observed in the ipsilateral cortex at Day 2 (Fig. 6A) while Glu (1.30 ± 0.24 mM kg−1 to 0.49 ± 0.17 mM kg−1, p = 0.044) decreased significantly (Fig. 6B). Glutathione stayed low in the ipsilateral cortex (p = 0.004) and thalamus (p = 0.037) during this phase (Fig. 5A and 5C). Lactate gradually increased only in the ipsilateral somatosensory cortex (Fig. 6C), reaching significance from Day 2 (p = 0.008) to Day 7 (1.07 ± 0.15 mM kg−1 to 3.49 ± 1.31 mM kg−1, p = 0.004). At 2 days post-TBI, NAA decreased from baseline in the ipsilateral cortex (4.90 ± 0.97 mM kg−1 to 2.35 ± 0.93 mM kg−1, p = 0.02) and the ipsilateral striatum (3.76 ± 0.37 mM kg−1 to 2.90 ± 0.35 mM kg−1, p = 0.002) while in the contralateral cortex NAA trended higher from Days 2-14 (Fig. 6D). Also, during Day 2 total creatine was down in the ipsilateral thalamus (p = 0.033) while GABA (p = 0.027) and total choline (p = 0.014) were significantly increased in the contralateral thalamus (Table 6). Supplementary Table S5 and Supplementary Table S6 list the pair-wise t-test results comparing sides of the brain during the Day 2 phase and the Day 7 phase, respectively, for all three brain regions studied.
Metabolite Concentrations Following TBI in Ipsilateral and Contralateral Thalamus
Acute = 0-3 h post-TBI.
Data are presented as mean ± standard deviation.
TBI, traumatic brain injury; GABA, gamma aminobutyric acid.
By Day 14, there were no longer any significant differences in metabolite concentrations from baseline in the either cortex (Table 4). In contrast, NAA (p = 0.005) and Glu (p = 0.025) were both down from baseline in the contralateral striatum by Day 14 post-TBI, returning to normal by Day 14 (Table 5). Also, total choline remained significantly elevated from Day 2, through Day 7 (0.75 ± 0.14 mM kg−1 to 0.91 ± 0.19 mM kg−1, p = 0.044) in the contralateral thalamus into Day 14 (Table 6). Supplementary Table S7 lists the pair-wise t-test results comparing sides of the brain during the Day 14 phase for all three brain regions studied.
Discussion
This study demonstrated that asynchronous CBF and neuro-metabolite concentration changes occur both close to and remote from the injury site in this rat model of mild TBI. The timing and locations of the changes, both ipsilateral and contralateral, suggest excitatory and inhibitory signaling processes are affecting post-TBI metabolic fluctuations.
Following trauma CBF levels were significantly reduced acutely in both cortexes and the ipsilateral striatum. On Day 2 in the ipsilateral cortex, transient luxury hyper-perfusion caused CBF to trend above baseline while it remained low in the striatum. The general reduction in CBF persisted even as the lesion volume shrank, and the subjects' sensorimotor test performances improved. No significant differences in CBF between Sides of the brain structures were found on Days 7 and 14 post-trauma. However, post-TBI asynchronous metabolic fluctuations were observed in all three brain regions. These results are in concordance with well-known phenomena, cited early on in a study of regional CBF in rat trauma models using laser doppler flowmetry that found hypoperfusion near the contusion at 4 h, which was attributed to vasoconstriction and microcirculatory stasis followed by a long-lasting phase of hyperperfusion from 1 to 2 days post-trauma. 23
Immediately following trauma, GSH was reduced in all brain regions, but only significantly in the ipsilateral cortex and striata. Over the next week reduced GSH levels were recorded in the ipsilateral cortex and thalamus. Glutathione (GSH) is an intracellular thiol that is found in both astrocytes and neurons. 24 GSH protects neurons against relieves oxidative stress via a redox reaction that acts directly to detoxify reactive oxygen species and functions indirectly as an enzyme cofactor. 25 Brain tissues are susceptible to oxidative stress due to their high oxidative metabolism with relative low antioxidant levels. Following oxidative stress mitochondrial function is impaired, resulting impaired synaptic function and neurodegeneration. 26 The data reported here support previous MRS observations in rat TBI subjects, which suggest that oxidative stresses, starting in the cortex and striatum, may extended to the thalamus over time. 27
Depletion of GSH has been associated with mitochondrial dysfunction and reductions in NAA, which in the current study also were noted in the ipsilateral cortex, reaching significance on Day 2. Significant reductions in NAA were also measured at Day 2 in the striatum but did not extend to the thalamus. N-acetylaspartate (NAA) is a free amino acid which is found in high concentration in neurons and is believed to function as a reservoir of acetyl-Co units. De-acylation of NAA then may supply acetate for acetyl coenzyme A synthesis for abating neuronal dysfunction. 28 Neuronal NAA turnover is enabled by its movement into oligodendrocytes and to lesser degree astrocytes. In these cells, NAA is degraded into acetate and Asp, providing another site of post-traumatic Asp accumulation. NAA levels also are reduced when mitochondrial respiration levels decrease. N-acetyl aspartate and its anabolic product NAAG have been proposed to function as metabolic water pumps that transport neuronal water to the extracellular space, which supports neuronal structural integrity. 29 Following TBI, a deficit of NAA can inhibit multiple processes that rely on acetyl coenzyme including lipid synthesis, energy generation, and protein regulation. The degree of reduction of NAA in rat brains following TBI has been associated with level of trauma severity by post-mortem high-pressure liquid chromatography. 30 -32
Histopathology studies have attributed post-TBI contralateral staining to retrograde degeneration of axons whose cell bodies are in the contralateral cortex. 33 Thus the trend to higher NAA levels in the contralateral cortex may mark a cooperative relationship with the ipsilateral cortex, in which both excitatory and inhibitory processes signaling from degenerated neurons influences each hemisphere's contribution to NAA production. The implications of this “crossed surround inhibition” model has been the subject of recent discussions of inter-hemispheric communication in stroke patients. 34,35 Reductions of NAA have been widely reported in 1 H-MRS studies of TBI in humans. 36
In the current study glutamate (Glu) also decreased in the ipsilateral cortex, reaching significance by Day 2. Striatal Glu decreased more slowly and did not significantly change until Day 14 on the contralateral side. Glutamate is a free amino acid, found in high concentration in brain, which functions as an excitatory neurotransmitter and is the precursor of GABA. Glutamate is involved in carbohydrate metabolism though its interactions with the tricarboxylic acid (TCA) cycle. 37 In the glutamate-glutamine cycle, Glu is converted to glutamine and transferred between neurons and glial cells. Glu is then released in the synaptic cleft, functioning as a neurotransmitter, before being taken up by adjoining astrocytes. The physical damage wrought by TBI causes disruption of brain cells which results a discharge of glutamate into the extracellular space. 38 To protect against excitatory injury, pyruvate is inhibited from entering the TCA cycle and Glu is taken up as an alternative fuel. 39 By increasing glutamate oxidation, the Glu available for synaptic release decreases which limits excitotoxic injury. In this scenario, the malate-aspartate shuttle becomes prominent, and Asp levels increase via oxaloacetate transamination. 40,41 The observed prompt decrease of Glu in the ipsilateral cortex and chronically in the striatum may be due to the rapid release of Glu after injury and then this Glu being taken up by astrocytes and converted to glutamine, which was not measured in our 1 H-MRS study. 27 The observed rise of Asp in the ipsilateral cortex from Day 2 to Day 7 was consistent with this interpretation.
The anionic form of lactic acid, lactate (Lac), is synthesized from pyruvate and is the end-product of anaerobic or aerobic glycolysis. In the current study Lac concentration transiently declined in the contralateral cortex while it maintained a sustained increase in the ipsilateral cortex over the first week post-TBI. Lactate also trended higher in the ipsilateral thalamus, reaching significance by Day 7, but no changes in Lac were found in the striatum. Production of Lac through aerobic glycolysis occurs in astrocytes after, which Lac is transferred to neurons via the astrocyte-neuron lactate shuttle to add fuel to the neuronal TCA cycle. 42 Lactate also functions as a signaling molecule that affects neuronal excitability, plasticity, and memory consolidation. 43 Thus, the decrease of Lac observed acutely on the contralateral side following TBI may be attributed to reduced anaerobic metabolism to increase ATP production efficiency, while the buildup of Lac levels in the ipsilateral cortex following TBI may be indicative of reduced aerobic metabolism due to mitochondrial failure in neurons and anaerobic Lac accumulation in astrocytes.
There is a strong association between the somatosensory cortex and the thalamus through the corticothalamocortical circuitry. 44 This connection may have influenced the significant metabolite changes observed in the thalamus on both the ipsilateral and contralateral sides. The total choline (tCho) peaks were elevated in both thalami, but only reached significance in the contralateral thalamus on Day 2 through Day 14. The total choline MRS signal from normal brain is mostly attributed to glycerophosphocholine (GPC), phosphocholine (PC), with free choline contributing a small amount. 24 High brain levels of free choline can occur in the setting of hypoxia/ischemia or hypoglycaemia. Alterations in tCho are attributed to non-steady state fluctuations, and membrane synthesis or breakdown. Observations reported here concur with Li and colleagues 45 who, in a study using mass spectrometry of imaging in a rat model of controlled cortical impact, found significant increases in thalamic phosphatidylcholines and lysophosphatidylcholines at 14 days after injury. Supplementary Table S8 displays which brain regions that had significant increases/decreases in measured metabolites at various time-points.
The results obtained in the current study are generally consistent with previous MRS studies of experimental TBI which did not interrogate bilaterally or in subcortical structures. In one report, in vivo MRS measurements were performed on perilesional regions and whole–brain extracts showed that significant metabolic changes can occur. 45 In another study of cortical CCI, significant changes were found in vivo in 19 of 20 metabolites in rat cortex and nine of 20 in the perilesional hippocampus. 27 Reductions in GSH, Glu, and NAA, along with increased Lac in the ipsilateral cortex at <3 days were similar to results from the current study. 27 However, a decrease in Asp was reported there as opposed to the increase noted in the current study. At chronic time-points, there was increased tCho only, but data from the current study also revealed reductions in GSH while Harris and colleagues described a GSH increase. 27 In another rat study, using the Marmarou weight drop model, metabolite changes in the ipsilateral hippocampus were found, which included a reduction in NAA at acute time-points and chronically increased Lac production. 33
Diaschisis following TBI previously has been demonstrated histologically in mice and rats, evident as silver positive lesions which revealed damaged neuritic processes in both the contralateral cortex and the ipsilateral thalamus. 27,46 In addition, microglial activation and neuronal degeneration have been reported in the ipsilateral thalamus following cortical TBI in a rat model. 47 In the ipsilateral striatum, CCI in rats has been linked to impaired neurotransmission, induction of antioxidant mechanisms, and mitochondrial dysfunction for days following TBI. 48,49
There were several limitations to this study. Even when localized to specific brain regions, in vivo MRS is sampling metabolite contributions from heterogeneous tissue. Thus, the current study cannot directly identify differences in metabolism in neurons, astrocytes, and oligodendrocytes. The cortical, striatal, and thalamic studies were not all done on each animal. Collecting MRI data and MRS data from two regions, contralateral and ipsilateral, took over an hour for the cortical regions and about 1.5 h for the subcortical regions. Due to limitations on the amount of time animals could be under anesthesia, the MRS studies were limited to acquiring data from two bilateral regions per animal. In addition, only males were studied in this project since neurochemistry of the brain is known to be different between sexes and the resources were not available to adequately power a study that would be able to discriminate between the two sexes. This study also was limited by the spectral resolution at 7T not being adequate to separate the phosphocreatine from Cr or resolve alanine, taurine, and glutamine resonances. More studies at higher magnetic fields and/or using tissue extracts could lead to better understanding the of roles of Glu:Gln balance in excitation and inhibition, edema, anaerobic glycolysis, and bioenergetics. Also, the authors were not blinded to the behavioral analyses and lesion volume calculations so some unintentional biases may have influenced the results.
Conclusions
This study showed, for the first time, a pattern that can be interpreted as focal metabolic diaschisis “at rest” following TBI using in vivo MRS. Biochemical changes occurring within the ipsilateral somatosensory cortex, the site of the focal TBI, were consistent with previous, more limited reports. Specifically, this study revealed that the contralateral somatosensory cortex, as well as striatum, and thalamus on both sides, also exhibited highly divergent metabolic changes which may have been the brain network's response to improve mitochondrial function, relieve oxidative stress, preserve neuronal integrity, and forestall glial breakdown. The current study also provided some insights, in a distinctive manner, on the uncoupling of cerebral blood flow and oxidative metabolism that was first reported by Fox and colleagues. 50 in humans and later identified in a rat trauma model. 51 The temporal and spatial variations of anaerobic metabolism in the brain, and how it functions to protect sensitive tissues from neurological damage in TBI are still not well understood. Further investigations into associations between metabolic and functional diaschisis should be performed to elucidate with more precision all the factors responsible for regional changes in metabolism and neuronal activity. Developing this knowledge would likely produce insights into key metabolic processes that could be the targets for treatment strategies.
Transparency, Rigor, and Reproducibility Summary
This study was not formally registered since this is an animal study, but the research plan was approved by the Institutional Animal Care and Use Committee (IACUC). A sample size of eight subjects per group (cortex, striatum & was planned and calculated to detect Cohen's effect size d = 0.80 with a p value <0.05. Magnetic resonance spectral data were obtained from 24 participants, and successfully analyzed in 23. Measurements were performed by investigators who were aware of relevant characteristics of the participants, handling of biomechanical data was performed by team members who were aware of relevant characteristics of the participants, biomechanical quality control decisions and analyses were performed by investigators who were aware of relevant characteristics of the participants. Data were collected with subjects in the anesthetized state, all data was collected using the same measurement device. Equipment and analytical reagents such as sensors used to perform the biomechanical measurements are widely available from companies mentioned in the article. Other equipment used to perform MRS measurements was custom built by the investigators and the schematics are available on request. There is no current or planned replication studies ongoing to our knowledge. All data included in this study and analytic code used to conduct the analyses presented in this study are available upon request by contact with the corresponding author. All materials used to conduct the study were obtained from widely available sources.
Footnotes
Acknowledgments
Portions of this manuscript are available online as a dissertation: Boggs RC, PhD in Radiological Science, University of Texas Health Science Center at San Antonio, 08/06/2018, https://www.proquest.com/openview/a45d107d0898d890b338965b65a253a8/1?pq-origsite=gscholar&cbl=18750
Authors' Contributions
Conceptualization: RCB, LTW, PTF. Formal analysis: RCB, GDC Funding acquisition: RCB, LTW, PTF. Investigation: RCB, LTW, PTF, GDC. Methodology: RCB, LTW, PTF, GDC. Project administration: RCB, LTW, PTF, GDC. Resources: PTF, GDC. Software: RCB, LTW, PTF, GDC. Supervision: LTW, PTF, GDC. Validation: RCB, LTW, PTF, GDC. Visualization: RCB, GDC Writing-original draft: RCB, LTW, GDC. Writing-review & editing: RCB, LTW, PTF, GDC.
Funding Information
The project described herein was supported by the National Center for Advancing Translational Sciences, National Institutes of Health, through Grant TL1 TR001119. The content is solely the responsibility of the authors and does not necessarily represent the official views of the NIH.
Author Disclosure Statement
No competing financial interests exist.
Supplementary Material
Supplementary Table S1
Supplementary Table S2
Supplementary Table S3
Supplementary Table S4
Supplementary Table S5
Supplementary Table S6
Supplementary Table S7
Supplementary Table S8
References
Supplementary Material
Please find the following supplemental material available below.
For Open Access articles published under a Creative Commons License, all supplemental material carries the same license as the article it is associated with.
For non-Open Access articles published, all supplemental material carries a non-exclusive license, and permission requests for re-use of supplemental material or any part of supplemental material shall be sent directly to the copyright owner as specified in the copyright notice associated with the article.
