




Abstract
While Wallerian degeneration (WD) is a crucial pathological process induced with spinal cord injury (SCI), its underlying mechanisms is still understudied. In this study, we aim to assess structural alterations and clinical significance of WD in the cervical cord following SCI using multi-modal magnetic resonance imaging (MRI), which combines T2*-weighted imaging and diffusion tensor imaging (DTI). T2*-weighted images allow segmentation of anatomical structures and the detection of WD on macrostructural level. DTI, on the other hand, can identify the reduction in neuroaxonal integrity by measuring the diffusion of water molecules on the microstructural level. In this prospective study, 35 SCI patients (19 paraplegic and 16 tetraplegic patients) and 12 healthy controls were recruited between July 2020 and May 2022. The hyperintensity voxels in the dorsal column was manually labeled as WD on T2*-weighted images. The mean cross-sectional area (CSA) and mean DTI indexes of WD at the C2 level were calculated and compared between groups. Correlation analysis was used to determine the associations of the magnitude of WD with lesion characteristics and clinical outcomes. Compared with controls, SCI patients showed evident hyperintensity (35/35) and decreased neuroaxonal integrity (p < 0.05) within the dorsal column at the C2 level. A higher neurological level of injury was associated with a larger mean CSA and reduction in neuroaxonal integrity within WD (p < 0.05). Smaller total and dorsal tissue bridges were related to greater mean CSA and lower fractional anisotropy values in WD (p < 0.05), respectively. Moreover, SCI participants with significantly larger CSAs and significantly lower microstructural integrity had worse sensory outcomes (p < 0.05). This comprehensive evaluation of WD can help us better understand the mechanisms of WD, monitor progression, and assess the effectiveness of therapeutic interventions after SCI.
Introduction
Spinal cord injury (SCI) can result in a series of secondary neurodegenerative changes across the spinal cord 1 -3 and brain 4 -6 that are closely associated with patients' clinical outcomes. 6 –9 Advanced neuroimaging technique could quantitatively assess secondary neurodegeneration, playing a crucial role in assessing case severity, predicting clinical outcomes, and stratifying patients in future clinical trials. 10 -12 However, there are currently few studies on neuroimaging biomarkers focusing on secondary neurodegeneration after SCI and few studies were carried out with large sample sizes. 13
Wallerian degeneration (WD) is a well-known secondary degenerative process. 14 The neural fibers distal to the injury site undergo WD after SCI, including loss of the myelin sheath, axonal collapse, inflammatory cells infiltration, and increased water content. 15 -17 To understand alterations in the cervical cord after SCI, quantitative MRI is the tool of choice because it allows noninvasive characterization of neurodegeneration. At the macrostructural level, demyelination, increased water content, and inflammation within neural fiber may lead to hyperintensity on conventional T2-weighted MRI. 18 The presence of WD in the dorsal column was associated with worse American Spinal Injury Association Impairment Scale (AIS) grade and worse sensory evoked potential performance after SCI. 19 At the microstructural level, neural degeneration (i.e., demyelination/axonal degeneration) 3,20 in the injured spinal cord may lead to altered diffusion properties that can be detected by diffusion tensor imaging (DTI). 21 –24 Some studies reported decreased fractional anisotropy (FA; associated with integration of axon and demyelination), axial diffusivity (AD; associated with axonal degeneration), and increased radial diffusivity (RD; associated with demyelination) at the cervical cord in chronic SCI participants, indicating microstructural WD. 17,25,26 Although some studies have reported the presence of WD at the C2 level, 18,27 the structural characteristics and functional effects of WD in SCI participants have not yet been quantitatively investigated with a relative large sample size.
The multi-modal MRI, which combines T2*-weighted imaging with DTI, provides a comprehensive evaluation of WD after SCI. In this study, we aimed to quantitatively assess macrostructural and microstructural alterations within WD at the C2 level and investigate the possible relations of the magnitude of WD with lesion characteristics and clinical measurements.
Methods
Ethics and informed consent
Our study protocol was approved by the local ethics committee and was conducted in accordance with the Declaration of Helsinki. All participants provided written informed consent before enrollment.
Participants
Between July 2020 and May 2022, we recruited 35 SCI participants (19 paraplegic and 16 tetraplegic patients) and 12 healthy controls who first admitted to the Third Affiliated Hospital of Sun Yat-sen University. The inclusion criteria were as follows: 1) traumatic SCI; 2) age between 18 and 65 years; 3) no contraindications to MRI; 4) no neurological and mental disorders; and 5) the level of injury below the C2 level. The exclusion criteria were as follows: 1) time since injury less than 3 months; 2) spinal cord compression; and 3) spasticity influencing the MRI scanning (Supplementary Figure S1). SCI participants who meet the inclusion criteria of Umbilical Cord Mesenchymal Stem Cells trial were then enrolled in clinical trial.
Clinical examination
All SCI participants underwent comprehensive clinical evaluation, including: 1) the International Standards for Neurological Classification of Spinal Cord Injury protocol for the motor, light touch, and pinprick scores, as well as determination of the neurological level of injury (the most caudal level of the spinal cord with antigravity muscle strength and intact sensation) and completeness of injury (whether sensory and motor functions were preserved below the level of injury) 28 ; and 2) the Spinal Cord Independence Measure (SCIM), including 19 items concerning self-care, respiration, and sphincter management and mobility. 29 All participants completed the full clinical evaluation.
MRI protocol
All MRI scans were conducted with a clinical 3T Siemens Prisma system using a 20-channel head and neck matrix coil combined with a spine matrix coil. Above the injury site (centered at the C2 level), we used an axial-oblique T2*-weighted image parallel to the superior endplate of the C2 vertebra to assess the macrostructural characteristics of WD. The acquisition parameters were as follows: field of view (FOV) = 180 × 180 mm2; repetition time (TR) = 550 msec; echo time 1 (TE1) = 15 msec, TE2 = 16 msec, TE3 = 17 msec, TE4 = 18 msec; flip angle = 30°; resolution = 0.40 × 0.40 × 3.00 mm3; and total acquisition time = 4:10 min.
At the identical level, DTI datasets were conducted using readout segmentation of long variable echo-trains approach, which included three T2-weighted (b = 0 sec/mm2) and 24 diffusion-weighted (b = 600 sec/mm2) volumes. This protocol (FOV = 170 × 170 mm2; slice thickness = 3 mm; TR = 4930 msec; TE = 45 msec; flip angle = 90°; refocusing pulse angle = 180°; b = 0, average number of excitations = 3, b = 600 sec/mm2, average number of excitations = 2; resolution = 1.29 × 1.29 × 3.00 mm3; total acquisition time = 13:50 min; and phase-encoding direction = anterior–posterior) was used to evaluate microscopic WD.
At the injury level, a sagittal T2-weighted image (FOV = 260 × 260 mm2; TR = 5040 msec; TE = 108 msec; flip angle = 120°; resolution = 0.40 × 0.40 × 3.00 mm3; and total acquisition time = 2:26 min) and an axial T2-weighted image (FOV = 180 × 180 mm2; TR = 3500 msec; TE = 101 msec; flip angle = 150°; resolution = 0.56 × 0.56 × 3.00 mm3; and total acquisition time = 2:27 min) were used to assess lesion severity.
Image analysis
On T2*-weighted images, the spinal cord, dorsal column and WD at C2 level were manually labeled and segmented at the C2 level using Jim 7.0 software by a 10-year experienced radiologist who was blinded to patients' information. In this study, we labeled the WD within the dorsal column by identifying voxels with signal intensities greater than those found in the dorsal horn. The C2 level was identified by the presence of C1/2 and C2/3 intervertebral discs. The cross-sectional tissue areas of the spinal cord, dorsal column, and WD were extracted and averaged across slices by spinal cord toolbox and the WD mask was created according to the segmentation of WD.
We used the spinal cord toolbox to process DTI data. 30 First, we reduced the in-plane FOV (35 × 35 mm2) and performed a slice-wise registration to correct for motion and eddy-current artifacts. Then, we used a robust fitting method to extract the following DTI maps: FA, RD, AD, and mean diffusivity (MD). 31 Next, the DTI maps were registered to T2*-weighted images following a non-linear transformation (BSplineSyn algorithm). 32,33 Finally, the created WD mask was applied to the DTI maps and the mean FA, RD, AD, and MD within WD were extracted by the spinal cord toolbox to evaluate microscopic WD. The DTI indexes of four patients were not extracted due to orthopedic fixation artifacts.
Lesion segmentation of tetraplegic patients was performed manually on the midsagittal slice of T2-weighted images. Tissue bridge (residual spinal cord tissue bridges spanning the lesion), including the widths of the ventral tissue bridge, dorsal tissue bridge, and total tissue bridge (the sum of the widths of the ventral and dorsal tissue bridges) were calculated with Jim 7.0 software. 11,34 The lesion characteristics in paraplegic patients could not be assessed due to orthopedic fixation.
To conduct voxel-wise analysis, the DTI maps including FA, RD, AD, and MD maps were underwent preprocessing steps using spinal cord toolbox. 30 This entailed the complete automatic pipeline, including automatic spinal cord segmentation, registration to the PAM50 template using a combination of affine and nonlinear registrations. 26 Subsequently, the DTI maps were smoothed with a full width at half-maximum gaussian kernel with 0.5 × 0.5 × 3 mm3. DTI maps in PAM50 space were finally analyzed using general linear models by using SPM12.
Statistical analysis
We used SPSS version 25.0 for statistical analysis. First, age was assessed by one-way analysis of variance followed by Bonferroni post hoc tests between groups. Sex differences between groups were examined using the chi-squared test. The time since injury and clinical scores were compared between paraplegic patients and tetraplegic patients using a two-sample t test. Second, MRI measurements between groups were assessed by one-way analysis of variance followed by Bonferroni post hoc tests. Finally, we used linear regression to investigate possible relations of the magnitude of WD with lesion characteristics and clinical measurements. Spearman correlation analyses were applied to determine the relationship between the magnitude of WD and neurological level of injury.
The confidence interval was set to 95%, and a p value of 0.05 or less was regarded as a significant difference. Age was regarded as a covariate of no interest in all statistical models. For voxel-wise analysis, all our statistical parametric maps were firstly thresholded with a cluster defining threshold of p < 0.01 (uncorrected). Only clusters surpassing a cluster threshold of p < 0.05 (family-wise error corrected) were reported.
Results
Demographic and clinical characteristics
We recruited 19 paraplegic patients (mean age ± standard deviation, 40.3 ± 14.3 years; two females; time since injury, 0.9 ± 0.5 years) and 16 tetraplegic patients (mean age, 46.3 ± 11.0 years; one female; time since injury, 1.5 ± 1.2 years) and 12 healthy control participants (mean age, 35.6 ± 11.3 years; three females). There were no significant differences among the groups (healthy controls, paraplegic patients, or tetraplegic patients) in terms of age (analysis of variance, f = 2.23, p = 0.11) or sex (chi-squared, p = 0.55). The time since injury did not differ between tetraplegic patients and paraplegic patients (p = 0.10). All demographic data are shown in Table 1.
Demographic and Clinical Characteristics of All SCI Patients Included in the Study
SCI, spinal cord injury; pSCI, paraplegic patients; AIS, American Spinal Injury Association Impairment Scale; NLI, neurological level of injury; SCIM, Spinal Cord Independence Measure; M, male; F, female; tSCI, tetraplegic patients.
All SCI participants underwent a comprehensive clinical evaluation. Of all SCI participants, 21 were classified as AIS A, two as AIS B, 10 as AIS C, and two as AIS D. The mean motor score (maximum 100) was 55.6 ± 9.1 (mean ± standard deviation) in paraplegic patients and 35.2 ± 18.8 in tetraplegic patients; the mean light touch score (out of a maximum of 112) was 71.5 ± 16.1 in paraplegic patients and 44.0 ± 19.9 in tetraplegic patients; the mean pinprick score (out of a maximum of 112) was 73.5 ± 15.6 in paraplegic patients and 49.8 ± 22.4 in tetraplegic patients; and the mean SCIM score (out of a maximum of 100) was 51.4 ± 16.7 in paraplegic patients and 32.2 ± 16.7 in tetraplegic patients (Table 1).
Wallerian degeneration in the dorsal column
Compared with healthy controls, all 35 SCI participants (19 paraplegic patients and 16 tetraplegic patients) exhibited hyperintensity in the dorsal column at the C2 level, which indicated macroscopic WD (Fig. 1A, 1B). The mean cross-sectional area (CSA) of WD in the dorsal column was 5.66 ± 2.22 mm2. The results are shown in Table 2.
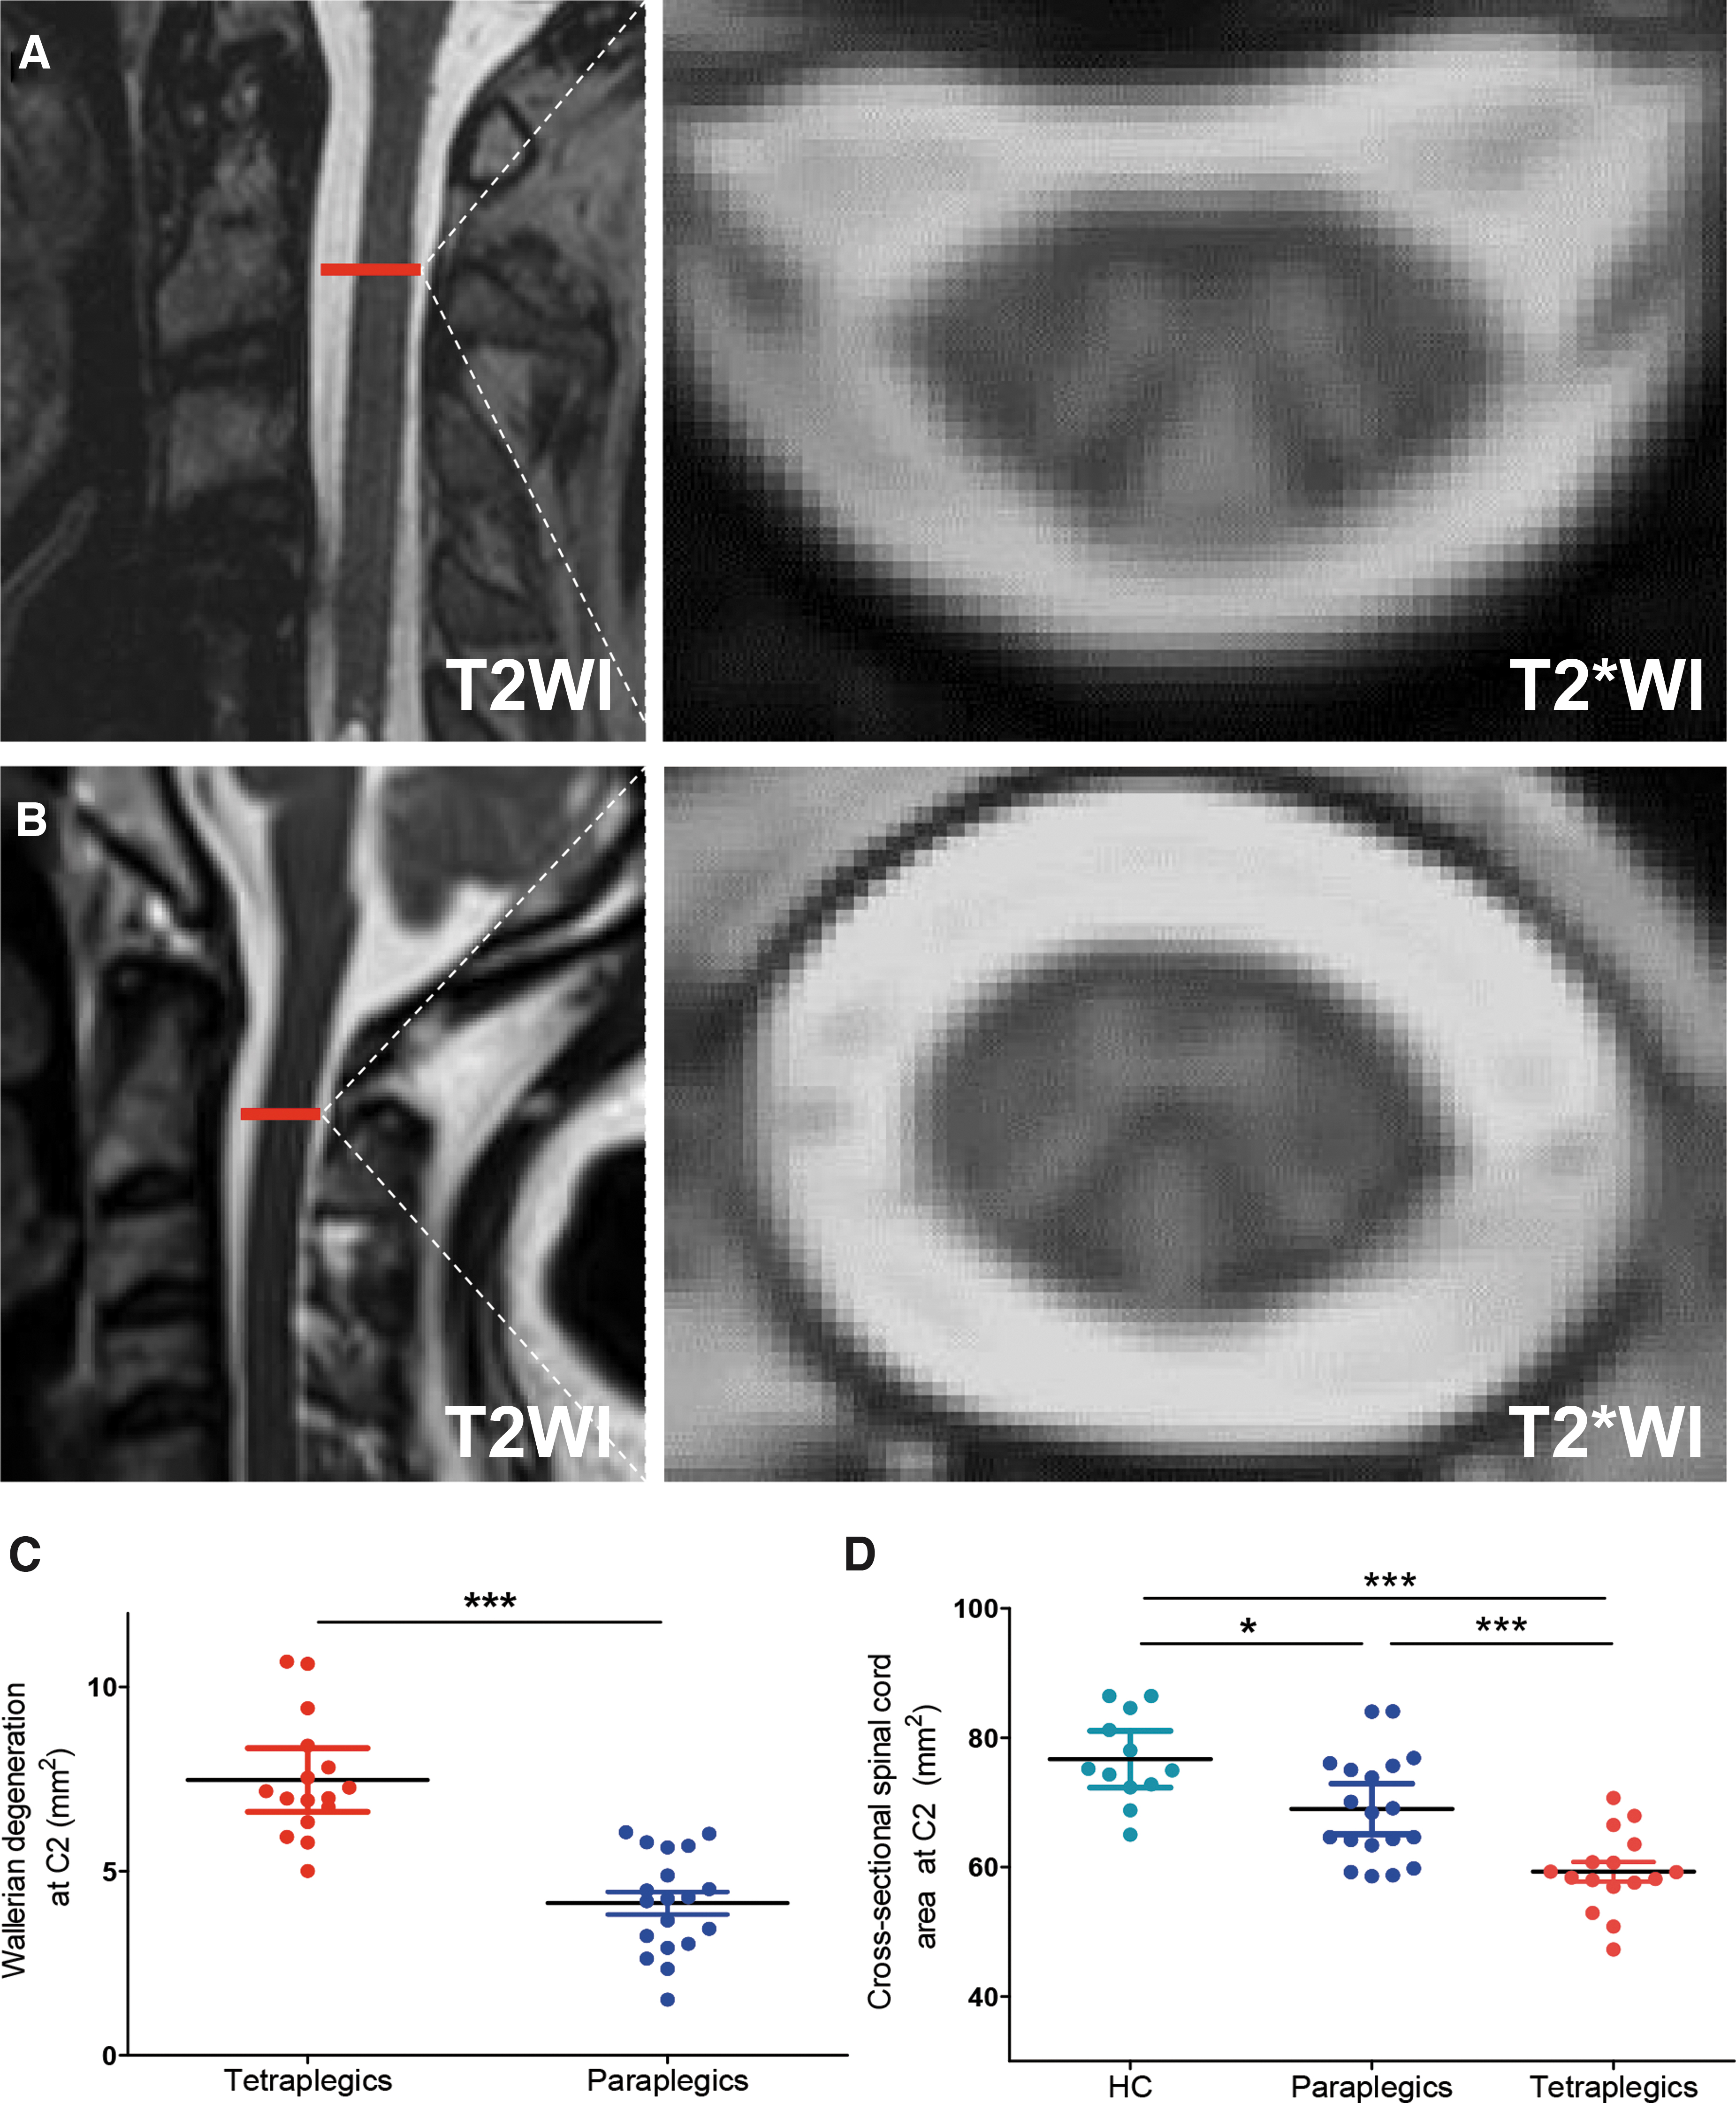
Examples of signal intensity changes in the spinal cord at the C2 level in sagittal T2-weighted images (T2WI) and axial T2*-weighted images (T2*WI) of two patients; these changes indicate macroscopic Wallerian degeneration (WD) in the dorsal column (DC). The axial plane is indicated by the red line on the corresponding sagittal image.
MRI Measures of Wallerian Degeneration in All SCI Patients at the C2 level and DTI Indexes of Healthy Controls in the Dorsal Column at the C2 Level
Data are mean values ± standard deviations.
MRI, magnetic resonance imaging; SCI, spinal cord injury; DTI, diffusion tensor imaging; HCs, healthy controls; tSCI, tetraplegic patients; pSCI, paraplegic patients; CSA, cross-sectional area.
The paraplegic patients showed hyperintensity in the medial portion of the dorsal column, while the tetraplegic patients demonstrated hyperintensity in both the medial and lateral portions of the dorsal column. The mean CSA of WD was 3.35 mm2 larger in tetraplegic patients than in paraplegic patients (p < 0.001; tetraplegic patients, 7.48 ± 1.61 mm2; paraplegic patients, 4.13 ± 1.33 mm2; Fig. 1C; Table 3). Moreover, among tetraplegic patients, complete SCI patients (i.e., AIS A) showed a larger CSA of WD than incomplete SCI patients (i.e., AIS B-D; p = 0.03; complete SCI patients, 8.43 ± 0.72 mm2; incomplete SCI patients, 6.74 ± 0.30 mm2). In paraplegics participants, cross-sectional spinal cord area at C2 was 7.69 mm2 smaller than in healthy controls (p = 0.01, paraplegic patients, 68.99 ± 8.10 mm2; healthy controls, 76.68 ± 6.87 mm2). In tetraplegics participants, cross-sectional spinal cord area at C2 was 17.38 mm2 smaller than in healthy controls (p < 0.001, tetraplegic patients, 59.29 ± 6.04 mm2; healthy controls, 76.68 ± 6.87 mm2) and 9.69 mm2 smaller than in paraplegic participants (p < 0.001, tetraplegic patients, 59.29 ± 6.04 mm2; paraplegic patients, 68.99 ± 8.10 mm2; Fig. 1D).
Comparisons of MRI Measures of Wallerian Degeneration between Healthy Controls and Spinal Cord Injury Patients
MRI, magnetic resonance imaging; SCI, spinal cord injury; HCs, healthy controls; pSCI, paraplegic patients; tSCI, tetraplegic patients; CSA, cross-sectional area.
Microstructural alterations within areas of Wallerian degeneration
In terms of microstructural alterations, we demonstrated the FA maps (Fig. 2A, 2B) and RD (Fig. 2C, 2D) maps of both SCI participants and healthy controls. The voxel-wise analysis did not report statistically significant differences in DTI maps (including FA maps, RD maps, AD maps, and MD maps) between SCI participants and healthy controls. Compared with those in the healthy controls, areas of WD in SCI patients showed a 19.1% lower FA (p < 0.001; healthy controls, 0.77 ± 0.05; patients, 0.62 ± 0.11; Fig. 2G; Table 3), 65.1% greater RD (p = 0.004; healthy controls, 0.43 ± 0.11 μm2 msec−1; patients, 0.69 ± 0.22 μm2 msec−1; Fig. 2H; Table 3), and 14.7% greater MD (p = 0.03; healthy controls, 1.02 ± 0.17 μm2 msec−1; patients, 1.17 ± 0.20 μm2 msec−1; Fig. 2I; Table 3) when compared with those of healthy controls. However, there was no significant difference in the AD (p = 0.24; healthy controls, 2.19 ± 0.21 μm2 msec−1; patients, 2.08 ± 0.31 μm2 msec−1) between patients and controls (Fig. 2J; Table 3). Patients with a larger CSA of WD also had lower FA (p < 0.001, R2 = 0.54) and higher RD (p = 0.002, R2 = 0.38) within the area of WD (Fig. 2K, 2L).

Microstructural changes in areas of Wallerian degeneration in spinal cord injury (SCI) patients. Panels
Subgroup analysis indicated that microstructural alterations of WD were most common in tetraplegic patients. Compared with the controls, tetraplegic patients demonstrated a 32.4% decreased FA (p < 0.001; healthy controls, 0.77 ± 0.05; tetraplegic patients, 0.52 ± 0.07; Fig. 2G; Table 3), 107.0% greater RD (p < 0.001; healthy controls, 0.43 ± 0.11 μm2 msec−1; tetraplegic patients, 0.89 ± 0.17 μm2 msec−1; Fig. 2H; Table 3), and 25.9% greater MD (p = 0.003; healthy controls, 1.02 ± 0.17 μm2 msec−1; tetraplegic patients, 1.29 ± 0.22 μm2 msec−1; Fig. 2I; Table 3). Tetraplegic patients did not show significant changes in AD compared with healthy controls (Fig. 2J; Table 3). Moreover, compared with controls, paraplegic patients showed a 10.4% decrease in FA (p = 0.016; healthy controls, 0.77 ± 0.05; paraplegic patients, 0.69 ± 0.06; Fig. 2G; Table 3) and a 27.2% increase in RD (p = 0.004; healthy controls, 0.77 ± 0.05; paraplegic patients, 0.56 ± 0.11; Fig. 2H; Table 3). Paraplegic patients did not show significant changes in AD and MD compared with healthy controls (Fig. 2I, 2J; Table 3).
Compared with paraplegic patients, tetraplegic patients showed 24.8% decreased FA (p < 0.001; tetraplegic patients, 0.52 ± 0.07; paraplegic patients, 0.69 ± 0.06; Fig. 2G; Table 3), 65.7% greater RD (p < 0.001; tetraplegic patients, 0.89 ± 0.17 μm2 msec−1; paraplegic patients, 0.56 ± 0.11 μm2 msec−1; Fig. 2H; Table 3) and 18.9% greater MD (p = 0.004; tetraplegic patients, 1.29 ± 0.22 μm2 msec−1; paraplegic patients, 1.08 ± 0.14 μm2 msec−1; Fig. 2I; Table 3) in areas of WD. Tetraplegic patients did not show significant changes in AD compared with paraplegic patients (Fig. 2J; Table 3).
Relationship of the magnitude of Wallerian degeneration with the neurological level of injury and lesion severity
In SCI participants, we found that a higher neurological level of injury was associated with a larger CSA of WD (p < 0.001, R2 = 0.69; Fig. 3A; Table 4) in the dorsal column. A higher neurological level of injury was also associated with a lower FA (p < 0.001, R2 = 0.66), higher RD (p < 0.001, R2 = 0.47) and lower MD (p = 0.03, R2 = 0.15) within areas of WD (Fig. 3B-D; Table 4).

Associations between lesion characteristics and magnitude of Wallerian degeneration (WD). The neurological level of injury was associated with
Associations of MRI Measures of Wallerian Degeneration With the Neurological Level of Injury and Clinical Score
The p value represents statistical significance, and the R2 value represents effect strength.
MRI, magnetic resonance imaging; SCIM, Spinal Cord Independence Measure; CSA, cross-sectional area.
In tetraplegic patients, a wider total midsagittal tissue bridge (the sum of the widths of dorsal and ventral tissue bridges) was associated with a smaller CSA of WD at C2 level (p = 0.02, R2 = 0.44; Fig. 3E), while patients with a wider dorsal tissue bridge showed higher FA within WD (p = 0.05, R2 = 0.36; Fig. 3F).
Relationship between the magnitude of Wallerian degeneration and clinical outcomes
In SCI participants, the CSA of WD was negatively associated with the light touch score (p < 0.001, R2 = 0.64), pinprick score (p < 0.001, R2 = 0.55), and SCIM score (p < 0.001, R2 = 0.45) (Fig. 4 A-C; Table 4). The FA in the WD area was positively correlated with the light touch score (P < 0.001; R2 = 0.49), pinprick score (P = 0.009; R2 = 0.32), and SCIM score (p = 0.019; R2 = 0.29; Fig. 4 D-F; Table 4). The RD in the WD region was negatively correlated with the light touch score (p = 0.004; R2 = 0.35), pinprick score (P = 0.018; R2 = 0.29), and SCIM score (p = 0.025; R2 = 0.16; Fig. 4 G-I; Table 4).
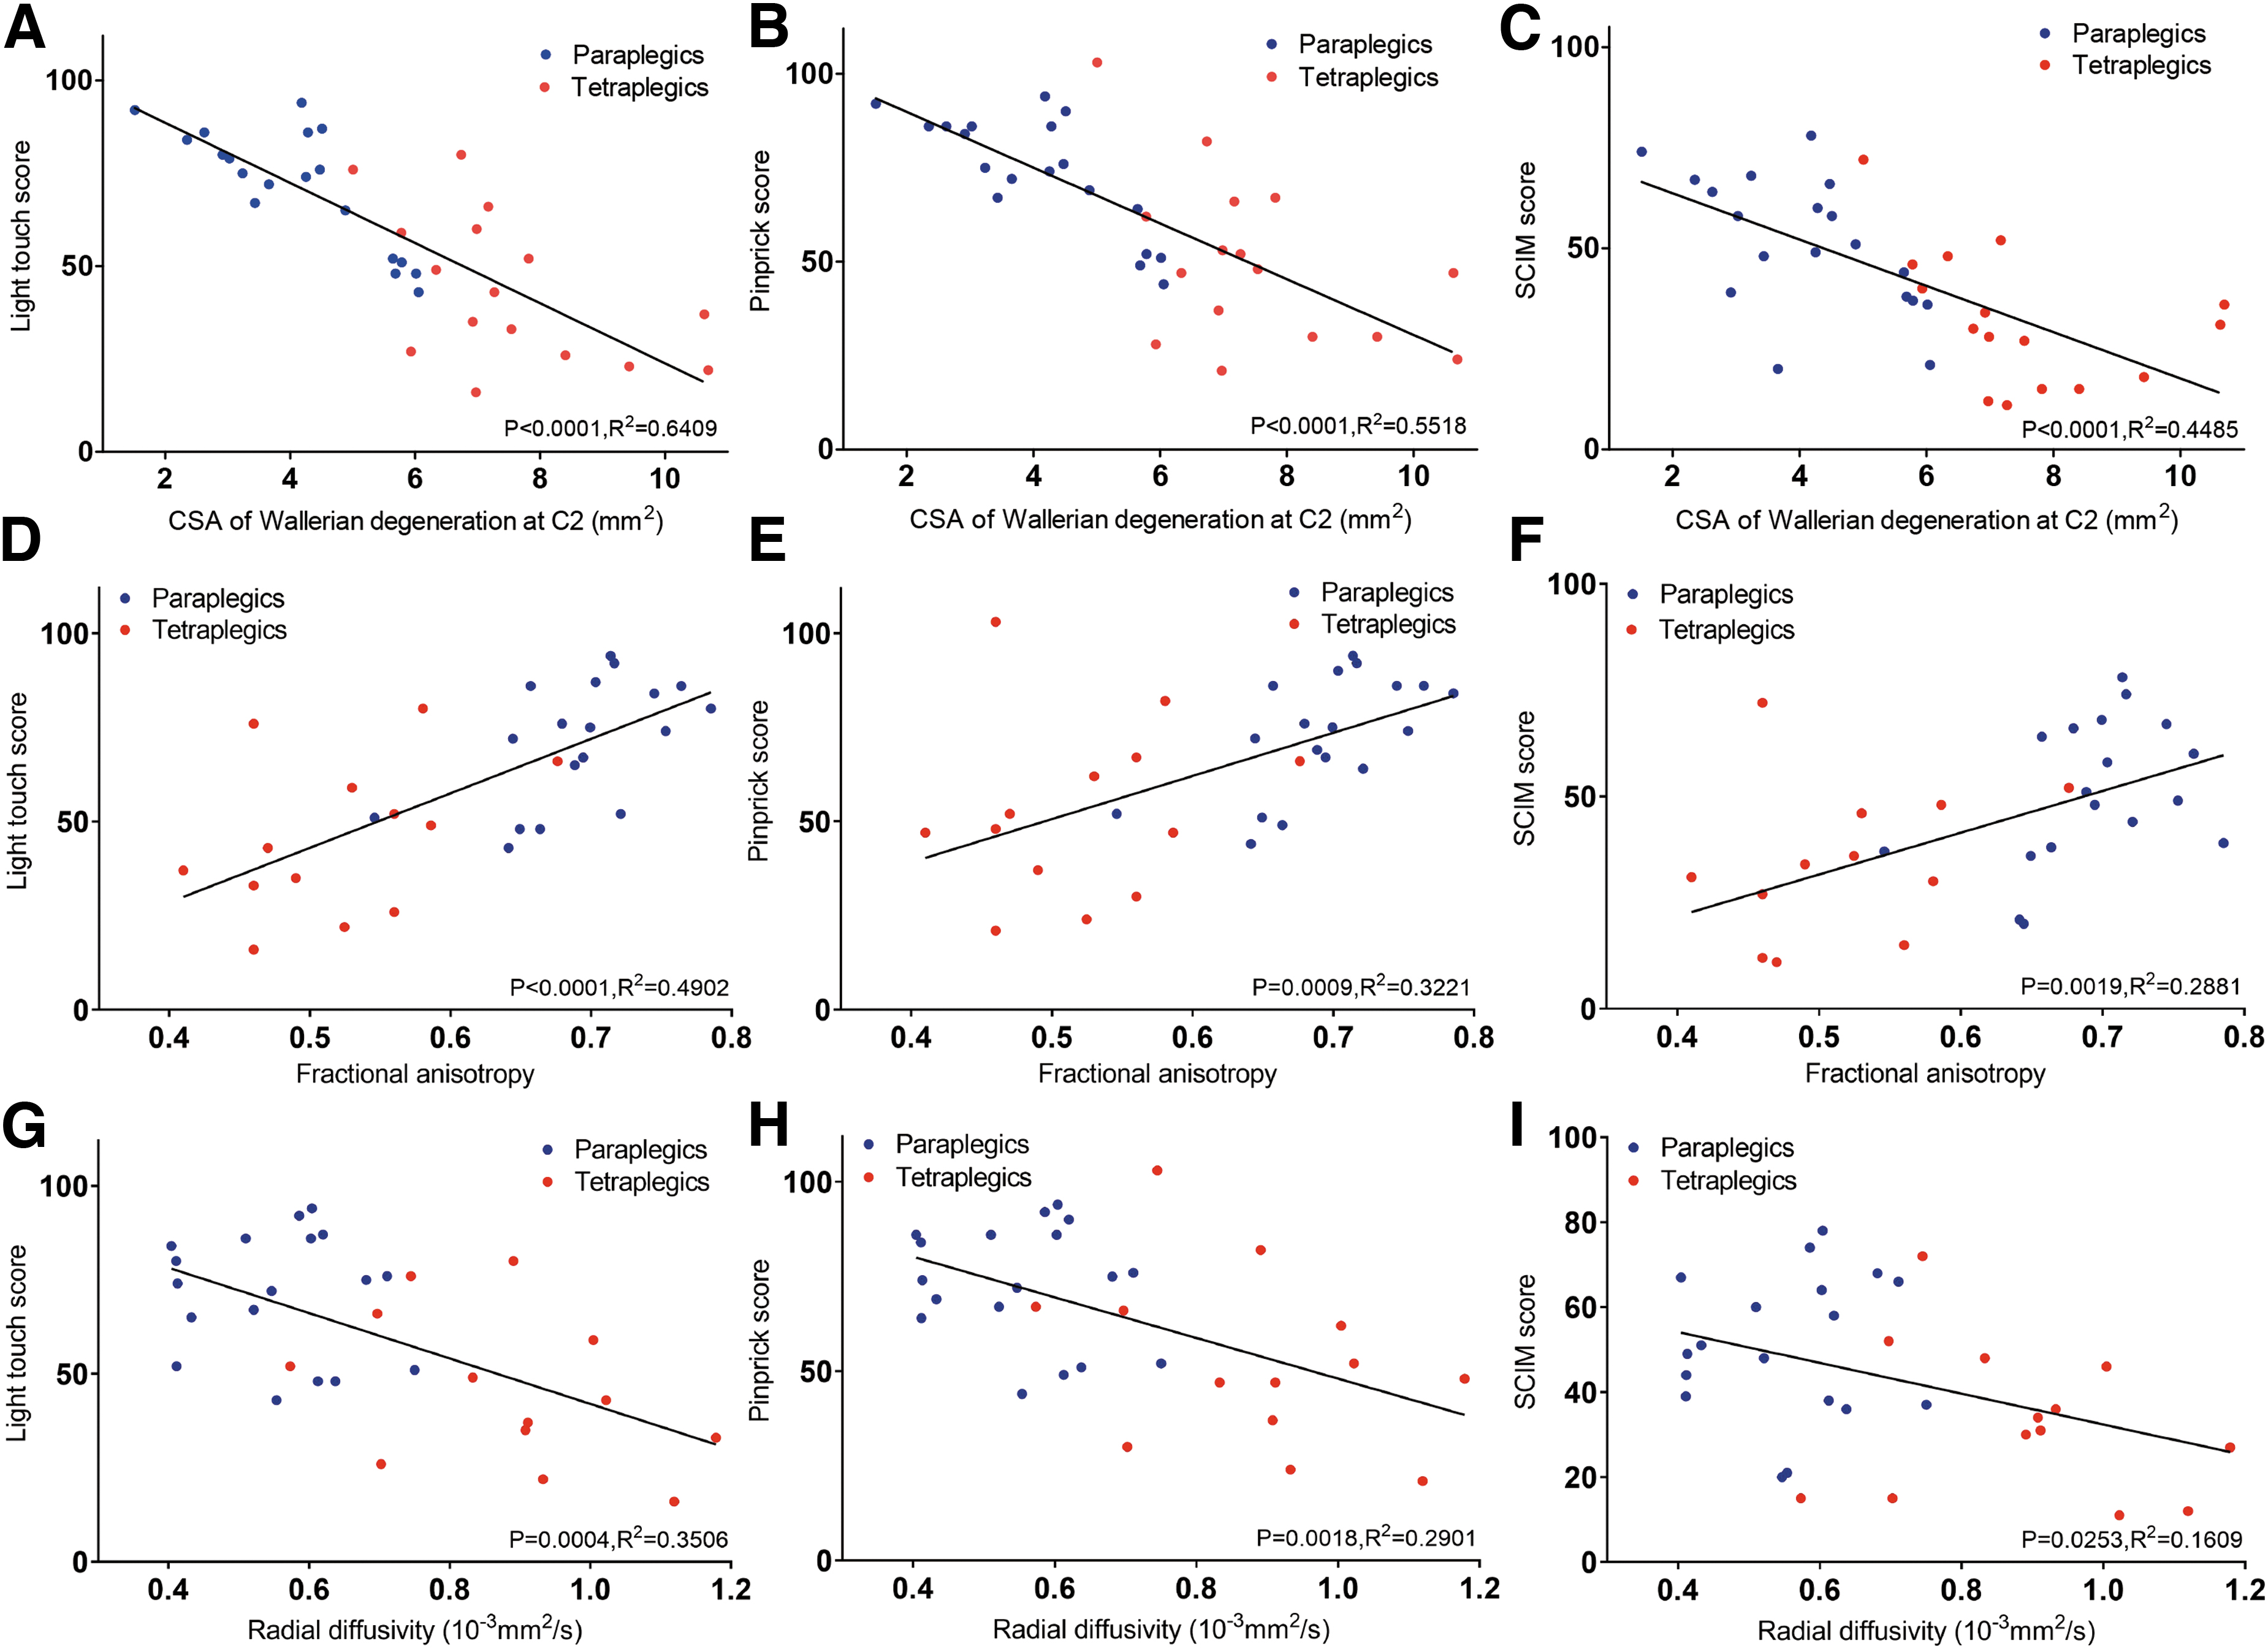
Relationship between Wallerian degeneration above the level of injury and clinical outcomes. Relationships of the cross-sectional area (CSA) of Wallerian degeneration and the
Discussion
By applying multi-modal MRI, our study quantitatively evaluated macroscopic and microscopic WD in dorsal column at the C2 level in SCI participants. The magnitude of WD was driven by lesion severity and the neurological level of injury. Moreover, we demonstrated the clinicopatological associations between WD and neurological impairment. Therefore, multi-modal MRI may play a crucial role in assessing sensory outcomes and monitoring treatment effects.
All participants in our studies showed hyperintensity, signs of macroscopic WD in the anatomical regions of the dorsal column at C2 level. In fact, T2*-weighted imaging provided fine great white matter and gray matter contrast and was sensitive to neurodegeneration alterations. 35,36 Based on the spatial distribution and morphology characters of WD gained from T2*-weighted images, we were able to quantitatively calculate the CSA of WD in dorsal column at C2 level and assess the tract-specific WD at macroscopic level. Previous studies reported that only approximately 70% of cases demonstrated hyperintensity after SCI. 26 The high occurrence of WD in this study could be attributed to the strict exclusion criteria (time since injury less than 3 months). In fact, previous histopathological analysis has shown WD in the dorsal column above the injury level as early as 8 days after spinal cord injury, which corresponded to increased signal intensity in the dorsal column on routine MRI as early as 7 weeks after injury. 18 For patients who were injured years earlier, the axon and myelin debris are likely cleaned up by astrocytic components, and the area of hyperintensity remains intact on routine MRI. 27,37 Therefore, to quantitatively analysis the tract-specific WD after SCI, patients who have been injured for more than 3 months can undergo MRI scans.
At the microstructural level, patients with SCI showed poor integrity, including decreased FA, increased RD and MD, and similar AD in areas of WD compared with that of healthy controls. According to experimental models in spinal cord, axon disintegration and demyelination can both lead to decreased FA, axon disintegration may lead to decreased AD, and demyelination of intact axons may lead to increased RD. 22,26,38 The DTI indexes in our study indicate that demyelination may be the crucial degenerative process along the ascending sensory pathway in SCI patients. 3,17,39 In postmortem studies, the myelinated axons of the ascending sensory pathway undergo retrograde degeneration, suffering gradual myelin loss over the years. 40,41 Previous voxel-wise analysis also reported SCI participants and degenerative cervical myelopathy patients showed decreased FA and AD and increased RD in the dorsal column at the C2 level, suggesting myelin and axon damage. 26,38 However, this voxel-based analysis compared the DTI indexes between SCI participants and healthy controls at group level, the extent of microstructural WD may vary between SCI participants. Based on the spatial distribution of WD gained from T2*-weighted images, we extracted the DTI indexes of each participant within WD directly, providing an accurate and personalized evaluation of microscopic WD.
Tetraplegic patients showed a greater magnitude of WD than paraplegic patients. Tetraplegic patients exhibited areas of hyperintensity in the lateral and medial parts of the dorsal column, while paraplegic patients only exhibited these areas in the medial part of the dorsal column. The medial and lateral portions of the dorsal column represent leg and arm function, respectively. 42 Moreover, tetraplegic patients demonstrated more severe microstructural alterations than paraplegic patients, including decreased FA and increased RD and MD within areas of WD. Further investigation indicated that microstructural integrity was driven by neurological level of injury. These observations are consistent with previous findings showing greater neurodegeneration in proximity to the lesion and decreasing severity of neurodegeneration with increasing distance. 37,43
The total tissue bridge is important for evaluating lesion severity, as the dorsal tissue bridge plays a crucial role in conducting sensory information toward the dorsal column. 12,34 Previously, the preservation of the tissue bridge is negatively associated with gray matter and white matter atrophy above and below the level of injury. 26 Similarly, we found that the magnitude of distal WD within the dorsal column was associated with the preservation of the midsagittal tissue bridge in tetraplegic patients, which suggests that more severe initial damage at the epicenter results in more axons impacted by WD above the level of injury. 44 In our study, the magnitude of WD may somehow reflect lesion severity in tetraplegic patients. For paraplegic patients, the quantitative evaluation of lesion severity at injury site is often difficult due to the influence of orthopedic fixation, thus the quantification of WD could provide a novel method for assessing injury severity.
In our study, the CSA and DTI indexes of WD in the dorsal column correlated with the light touch score, pinprick score, and SCIM score in SCI participants. On the one hand, a larger CSA of hyperintensity within the dorsal column at the C2 level indicates that more sensory tracts in fasciculus gracilis and fasciculus cuneatus have underwent WD. 45 A higher number of impaired afferent sensory tracts in SCI patients leads to severe sensory deficits. 46 On the other hand, the decreased FA and MD and increased RD in SCI participants showed the magnitude of demyelination in the dorsal column. 25,36 The magnitude of microscopic WD was closely related to the sensory score, showing clinicopathological associations. Compared with routine clinical sequences at the lesion site, our method is better for detecting macroscopic alterations and is more sensitive to microstructural changes (axon demyelination and degeneration), providing pathological information on SCI patients. 47,48
Also, we found that the R2 between CSA of WD and clinical outcomes were higher than that between DTI indexes and clinical outcomes, which indicated that the macroscopic WD may be more sensitive to neurological evaluations than microscopic WD. Aside from complementing the current diagnosis and clinical evaluations, the mentioned macroscopic and microscopic characteristics of WD within the dorsal column could act as neuroimaging biomarkers and therefore predicting the sensory recovery and stratification for interventional trials.
Our study has some limitations. The controls were 5 years younger than the patients, which may affect the MRI measurements. Thus, we regarded age as a covariate of no interest in statistical models. In addition, the dorsal column is a crucial pathway for conducting evoked somatosensory potentials. Due to the lack of neurophysiological examinations, the structural-functional relationship between WD and clinical outcomes is understudied.
Conclusion
In conclusion, multi-modal MRI revealed that the magnitude of WD is associated with clinical impairment and is driven by the lesion level and lesion severity.
Transparency, Rigor, and Reproducibility Summary
This study was pre-registered at the Clinical Trial Management Public Platform (http://www.medresman.org.cn/pub/cn/proj/projectshow.aspx?proj=4141). The analysis plan was registered after beginning data collection but before data analysis at (https://osf.io/pvjn4). A sample size of 33 SCI patients and 11 healthy controls were planned to yield 80% power to detect a statistically significant using two-sample t test with a p value <0.05 (d = 1) calculated by G*Power 3.19.7. A total of 45 SCI patients were screened, 10 patients were excluded following exclusion criteria, and 35 SCI patients were successfully analyzed. Human participants were blinded to the results of the imaging assessments throughout the study, even after clinical assessments were complete. Imaging quality control was performed by a radiologist who was blinded to relevant characteristics of the participants, and clinical outcomes were assessed by team members blinded to imaging results. All imaging data were acquired between July 2020 and May 2022. All equipment and software used to perform imaging and preprocessing are widely available from commercial sources. The key inclusion criteria and outcome evaluations are established standards. Statistical analysis was performed by SPSS version 25.0. The confidence interval was set to 95%, and a p value of 0.05 or less was regarded as a significant difference. De-identified data from this study and full content of the manuscript will be made available by emailing the corresponding author.
Footnotes
Acknowledgments

Authors' Contributions
Conceptualization, Yu Haiyang, Liu Zhenzhen, Liu Bin and Rong Limin; Methodology, Yu Haiyang, Liu Zhenzhen, Pang Mao, Liu Bin and Rong Limin; Software, Yu Haiyang, Liu Zhenzhen and Luo Qiuxia; Validation, Yu Haiyang and Huang Chong; Formal analysis, Yu Haiyang and Liu Zhenzhen; Investigation, Yu Haiyang, Liu Zhenzhen, Pang Mao, Luo Qiuxia, Huang Chong, He Weijie and Rong Limin; Resources, Liu Zhenzhen, Pang Mao and He Weijie; Data curation, Yu Haiyang, Liu Zhenzhen, Pang Mao, Luo Qiuxia and Huang Chong; Writing – original draft, Yu Haiyang, Liu Zhenzhen, Liu Bin and Rong Limin; Writing – review & editing, Yu Haiyang, Liu Zhenzhen, Pang Mao, Huang Chong, He Weijie, Liu Bin and Rong Limin; Visualization, Yu Haiyang, Liu Zhenzhen, Pang Mao, Luo Qiuxia, He Weijie, Liu Bin and Rong Limin; Supervision, Pang Mao, Liu Bin and Rong Limin; Project administration, Yu Haiyang, Liu Bin and Rong Limin; Funding acquisition, Pang Mao, Liu Bin and Rong Limin.
Funding Information
This research was supported by the National Natural Science Foundation of China (U22A20297, 8217243, 82072455, 82102642), the Key Research and Development Program of Guangdong Province (2019B020236002), the Key Research and Development Program of Guangzhou (202206060003), and the Guangdong Basic and Applied Basic Research Foundation (2023A1515010313).
Author Disclosure Statement
No competing financial interests exist.
Supplementary Material
Ethics
Supplementary Figure S1
Informed Consent
STROBE Checklist
References
Supplementary Material
Please find the following supplemental material available below.
For Open Access articles published under a Creative Commons License, all supplemental material carries the same license as the article it is associated with.
For non-Open Access articles published, all supplemental material carries a non-exclusive license, and permission requests for re-use of supplemental material or any part of supplemental material shall be sent directly to the copyright owner as specified in the copyright notice associated with the article.
