
Abstract
Current neurointensive care guidelines recommend intracranial pressure (ICP) and cerebral perfusion pressure (CPP) centered management for moderate-severe traumatic brain injury (TBI) because of their demonstrated associations with patient outcome. Cerebrovascular reactivity metrics, such as the pressure reactivity index (PRx), pulse amplitude index (PAx), and RAC index, have also demonstrated significant prognostic capabilities with regard to outcome. However, critical thresholds for cerebrovascular reactivity indices have only been identified in two studies conducted at the same center. In this study, we aim to determine the critical thresholds of these metrics by leveraging a unique multi-center database. The study included a total of 354 patients from the CAnadian High-Resolution TBI (CAHR-TBI) Research Collaborative. Based on 6-month Glasgow Outcome Scores, patients were dichotomized into alive versus dead and favorable versus unfavorable. Chi-square values were then computed for incrementally increasing values of each physiological parameter of interest against outcome. The values that generated the greatest chi-squares for each parameter were considered to be the thresholds with the greatest outcome discriminatory capacity. To confirm that the identified thresholds provide prognostic utility, univariate and multivariable logistical regression analyses were performed adjusting for the International Mission for Prognosis and Analysis of Clinical Trials (IMPACT) variables. Through the chi-square analysis, a lower limit CPP threshold of 60 mm Hg and ICP thresholds of 18 mm Hg and 22 mm Hg were identified for both survival and favorable outcome predictions. For the cerebrovascular reactivity metrics, different thresholds were identified for the two outcome dichotomizations. For survival prediction, thresholds of 0.35, 0.25, and 0 were identified for PRx, PAx, and RAC, respectively. For favorable outcome prediction, thresholds of 0.325, 0.20, and 0.05 were found. Univariate logistical regression analysis demonstrated that the time spent above/below thresholds were associated with outcome. Further, multivariable logistical regression analysis found that percent time above/below the identified thresholds added additional variance to the IMPACT core model for predicting both survival and favorable outcome. In this study, we were able to validate the results of the previous two works as well as to reaffirm the ICP and CPP guidelines from the Brain Trauma Foundation (BTF) and the Seattle International Severe Traumatic Brain Injury Consensus Conference (SIBICC).
Introduction
Traumatic brain injury (TBI) is a significant contributor to global morbidity and mortality, affecting ∼69,000,000 people each year and accumulating costs of up to $400 billion annually. 1 –3 Both primary brain injury, occurring at the time of the incident, and secondary brain injury, resulting from downstream brain herniation and cerebral ischemia, contribute to the poor outcomes associated with TBI. Although there is little that can be done to reverse primary brain injury, the mechanisms involved in secondary brain injury are potential targets for therapeutic intervention. 4 Therefore, management of moderate/severe TBI, defined as a Glasgow Coma Scale (GCS) score of ≤12, primarily focuses on preventing intracranial hypertension and maintaining sufficient cerebral perfusion, with current guidelines recommending an intracranial pressure (ICP) treatment threshold of 20 mm Hg or 22 mm Hg and a cerebral perfusion pressure (CPP) target range of 60 – 70 mm Hg. 5,6 However, although there have been significant improvements in our capabilities to therapeutically achieve these goals over the past decades, there has been little to no change in the poor outcomes associated with moderate/severe TBI. 2,7,8
Because of its high metabolic demand and limited energy reserves, cerebral tissue is highly susceptible to ischemic damage. 9 A loss of blood flow for a mere 5 min is sufficient to cause irreversible neuronal death in several key areas of the brain. 9 Therefore, the ability of the cerebral vasculature to maintain constant cerebral blood flow (CBF), despite constantly changing systemic blood pressure, by autoregulating tone is crucial for limiting secondary brain insult. 10 –12 Unfortunately, this vital autoregulatory mechanism is frequently impaired in those with TBI, exposing the brain to further damage from pressure-passive changes in CBF. 11 –13
Current signal processing capabilities now allow for the continuous bedside assessment of this cerebral autoregulatory function through the measurement of cerebrovascular pressure reactivity. 14,15 This parameter is derived by calculating the Pearson correlation coefficient between a surrogate measure of cerebral blood volume, such as the pulse amplitude of ICP (AMP), and a measure of the pressure driving CBF, such as mean arterial pressure (MAP) or CPP. 16 –18 Various ICP-derived metrics of cerebrovascular reactivity exist; however, the most studied are the pressure reactivity index (PRx – correlation between ICP and MAP), the pulse amplitude index (PAx – correlation between AMP and MAP), and RAC (the correlation [R] between AMP [A] and CPP [C]). 19 –21 These indices range from -1 to +1, with positive values indicating impaired cerebrovascular reactivity and negative values indicating normally reactive vasculature. 22 As an example, PRx assesses cerebrovascular reactivity by examining the response of ICP to fluctuations in MAP. 19 When autoregulatory capacity is intact, ICP should theoretically be unaffected by changes in MAP, resulting in a zero or negative Pearson correlation coefficient. However, when this function is impaired, ICP moves in the same direction as MAP, resulting in a positive correlation coefficient.
Over the past decade, impaired cerebral autoregulation has been proposed as a major driver of the poor outcomes witnessed in moderate/severe TBI, with recent single-center and multi-center prospective cohort studies demonstrating a strong relationship between impaired cerebrovascular reactivity and poor long-term outcome. 16,19,22 –26 This has led some neurointensive care units to include cerebrovascular reactivity monitoring in their management of moderate/severe TBI patients. 17 Further, recent multimodal monitoring consensus statements now recommend the use of PRx for the bedside assessment of cerebral autoregulatory function. 27,28
However, despite the increasing interest in ICP-derived cerebrovascular reactivity metrics, their critical thresholds for predicting outcome have only been investigated in two studies, originating from the same single center. 16,22 Further, only one of these studies have looked at PAx and RAC thresholds. 16 Therefore, validation of their results using a multi-centered cohort is needed. In this study, we perform chi-square analysis using a unique multi-centered database to identify the critical thresholds of ICP-based cerebrovascular reactivity indices in patients with moderate/severe TBI.
Methods
Study design
We conducted a retrospective multi-centered cohort study utilizing prospectively collected data from the Canadian High Resolution-TBI (CAHR-TBI) Research Collaborative. 29 Local ethics approval pertaining to all aspects of data collection for this database has been obtained from the University of Manitoba Health Research Ethics Board (H2017:181, H2017:188). Additionally, retrospective access of the database and anonymous data transfer between centers have been fully approved (H2020:118, H20-03,759, and REB20-0482). Given that data collection is performed in a fully anonymized fashion, a waived consent model is used under the approval of the research ethics board and provincial patient privacy offices of Manitoba.
Patient population
As part of the ongoing CAHR-TBI research collaborative, high-resolution physiological data was collected from all adult (≥18 years of age) moderate/severe TBI patients admitted to the intensive care units (ICU) of four university-affiliated hospitals: Foothills Medical Centre (University of Calgary), Health Sciences Centre Winnipeg (University of Manitoba), Maastricht University Medical Center+ (University of Maastricht), and Vancouver General Hospital (University of British Columbia). Data were entered into the database from 2011 to 2021 for the University of Calgary, January 2019 to March 2023 for the University of Manitoba, 2017–2022 for the University of Maastricht, and 2014–2019 for the University of British Columbia. Additionally, the following data were collected from each patient at the time of monitoring: demographic information, admission characteristics, imaging patterns, and clinical outcome assessments. All patients received standard care, as outlined by the Brain Trauma Foundation (BTF) guidelines. 5 This included invasive ICP and arterial blood pressure (ABP) monitoring, and therapeutic maintenance of ICP <20–22 mm Hg and CPP >60 mm Hg. 5 However, hyperemic CPP was generally not treated, as per local practice. It should also be noted that cerebrovascular reactivity metrics were not considered to be part of standard guideline-based patient management in this cohort. Lastly, long-term outcome was assessed during each patient's 6-month follow-up using the Glasgow Outcome Scale (GOS). 30 All data were collected in an entirely de-identified fashion in accordance with the relevant guidelines.
Physiological data collection
Each patient had their ICP continuously monitored using an intra-parenchymal strain gauge probe (Codman ICP MicroSensor, Codman & Shurtlef Inc., Raynham, MA, USA; NEUROVENT-TEMP, RAUMEDIC, Helmbrechts, Germany) placed in the frontal lobe or an external ventricular drain. ABP was obtained using a radial or femoral arterial line connected to a pressure transducer (Baxter Healthcare Corp. CardioVascular Group, Irvine, CA, USA; Edwards, Irvine, CA, USA) that was zeroed at the level of the tragus. High-frequency full wave-form physiology, across the entire recording period, was pulled in time series from bedside ICU monitors using Intensive Care Monitoring “Plus” software (ICM+) (Cambridge Enterprise Ltd, Cambridge, UK,
Signal analysis
All post-acquisition signal processing was performed using ICM+. To determine AMP, Fourier analysis of the fundamental amplitude of the ICP pulse waveform was performed over sequential 10-sec windows.
20,34
A 10-sec non-overlapping moving average filter was then applied to down-sample ICP, ABP (producing MAP), CPP, and AMP in order to focus on the frequency range associated with cerebrovascular reactivity and minimize the effects of the respiratory cycle.
8,35,36
CPP was calculated by subtracting ICP from MAP (CPP = MAP – ICP). In order to evaluate cerebrovascular reactivity, three ICP-based surrogate metrics were derived: PRx, PAx, and RAC. These metrics were calculated as the Pearson correlations between 30 consecutive 10-sec windows of ICP and MAP (for PRx), AMP and MAP (for PAx), or AMP and CPP (for RAC), continuously updating every minute.
19,22,37,38,21
The resulting data were then down-sampled to minute-by-minute resolution for each patient and outputted as comma-separated values (CSV) files for further processing in R Statistical Computing software (R Core Team [2020]. R: A language and environment for statistical computing. R Foundation for Statistical Computing, Vienna, Austria.
Statistical analysis
R Statistical Computing software was used to perform all statistical analysis. Alpha was set to 0.05 for all statistical tests, with all p values adjusted for multiple comparisons using the false discovery rate (FDR) method. 39 –41 Physiology and demographics were summarized for the entire patient cohort using medians and interquartile ranges (IQR), or raw counts where appropriate. Patients were then dichotomized based on 6-month outcome into alive (GOS >1) versus dead (GOS = 1) and favorable (GOS >3) versus unfavorable (GOS ≤3). 42 To compare physiological and demographic variables between the dichotomized groups, Mann–Whitney U and Chi-square testing were used.
Threshold analysis was then conducted using a sequential chi-square method, similar to those used in the previous studies investigating critical thresholds for indices of cerebral autoregulation. 16,22,43 Sequential 2 × 2 tables were created for each physiological metric of interest (ICP, CPP, PRx, PAx, or RAC), grouping patients based on outcome (alive vs. dead or favorable vs. unfavorable) and on whether the metric of interest, averaged over the entire recording period, was above or below sequential thresholds (in increments of 0.5 for ICP, 1 for CPP, and 0.05 for the cerebrovascular reactivity indices). Pearson's Chi-square values were then calculated for each 2 × 2 table and plotted against the physiological metrics. For each plot, the threshold that produced the largest statistically significant (p < 0.05) chi-square value was considered to have the greatest capacity for differentiating outcome and was identified as the critical threshold. For plots where either two distinct peaks or a broad-based peak was observed, the mid-point was selected as the critical threshold, as the goal of this study was to delineate a single critical value associated with dichotomized outcomes. This is similar to what was done in previous literature. 16,22,43
Next, the proportion of time that each physiological metric spent above/below its identified critical threshold was calculated for each patient. We then employed univariate logistical regression analysis to examine the relationship that % time above/below these critical thresholds had with outcome. In order to confirm that any relationships found remain robust after accounting for variables known to be associated with outcome, multivariable logistical regression analysis was conducted using the International Mission for Prognosis and Analysis of Clinical Trials (IMPACT) Core Model. 24 The IMPACT Core Model consists of age, admission GCS motor score, and pupillary response (bilaterally reactive, unilaterally unreactive, or bilaterally unreactive). 24 Then, % time of each physiological metric above/below their identified thresholds were added to the model for analysis. Additionally, a secondary analysis was performed using models that included Marshall computed tomography (CT) score and % time with CPP <60 mm Hg, ICP >18 mm Hg, ICP >20 mm Hg, or ICP >22 mm Hg, with % time with cerebrovascular reactivity metrics above their identified thresholds added.
Next, the area under the curve (AUC) of each model, and their confidence intervals, were calculated using bootstrapping methodology and reported alongside Akaike information criteria (AIC), p values, and Nagelkerke's pseudo-R 2 values. Then, the added variance in outcome prediction from adding the % times with the physiological metrics of interest above/below their identified critical thresholds to the IMPACT Core Model was determined by calculating the difference in Nagelkerke's pseudo-R 2 values. This approach is in keeping with previous multi-center studies investigating the associations between cerebrovascular reactivity and outcome. 24 Lastly, we performed an additional secondary analysis in which patients were separated based on mean PRx, using the thresholds identified in this study, into those with intact versus impaired cerebrovascular reactivity. Mann–Whitney U/Chi-square testing, univariate and multivariable logistical regression analyses, and added outcome variance analysis were all performed on these two cohorts and compared. This was done to observe whether the relationships that ICP and CPP have with outcome are stronger when cerebral autoregulation is dysfunctional.
Results
Patient population
A total of 354 patients from the CAHR-TBI database were included in this study (123 from the University of Calgary, 103 from the University of Manitoba, 51 from the University of Maastricht, 25 and 77 from the University of British Columbia). The cohort was composed of 276 (78%) males and had a median age of 39 years (IQR = 24–55). All patients had sustained a moderate or severe TBI with a median admission GCS of 6 (IQR = 3–7). At 6 months post-admission, ∼35% of the cohort had died and 50% was assessed as having a favorable outcome. Demographics and cerebral physiology for the entire patient cohort are summarized in Table 1.
Patient Demographics and Cerebral Physiology
These metrics were added based on the findings of this study's chi-square analysis.
CPP, cerebral perfusion pressure; CT, computed tomography; GCS, Glasgow Coma Scale; GOS, Glasgow Outcome Scale; ICP, intracranial pressure; IQR, interquartile range; MAP, mean arterial pressure; PAx, pulse amplitude index; PRx, pressure reactivity index; RAC = correlation (R) between slow waves of AMP (A) and CPP (C).
Critical thresholds for outcome prediction
The sequential chi-square method was performed for each parameter of interest and for both outcome dichotomizations using grand averages of the entire recording period. Plots presenting the chi-square values for incremental thresholds of each parameter for both alive versus dead and favorable versus unfavorable are presented in Figure . For each plot, the threshold resulting in the highest chi-square value was identified as the critical threshold. For some plots, a distinct single peak did not exist, but rather two peaks or a broad-based peak was found. In these cases, the two peaks were averaged to produce one critical threshold value. The one exception to this was for ICP, where its two peaks were both identified as critical thresholds, given their close alignment with existing guideline-based ICP treatment threshold recommendations. 5,6
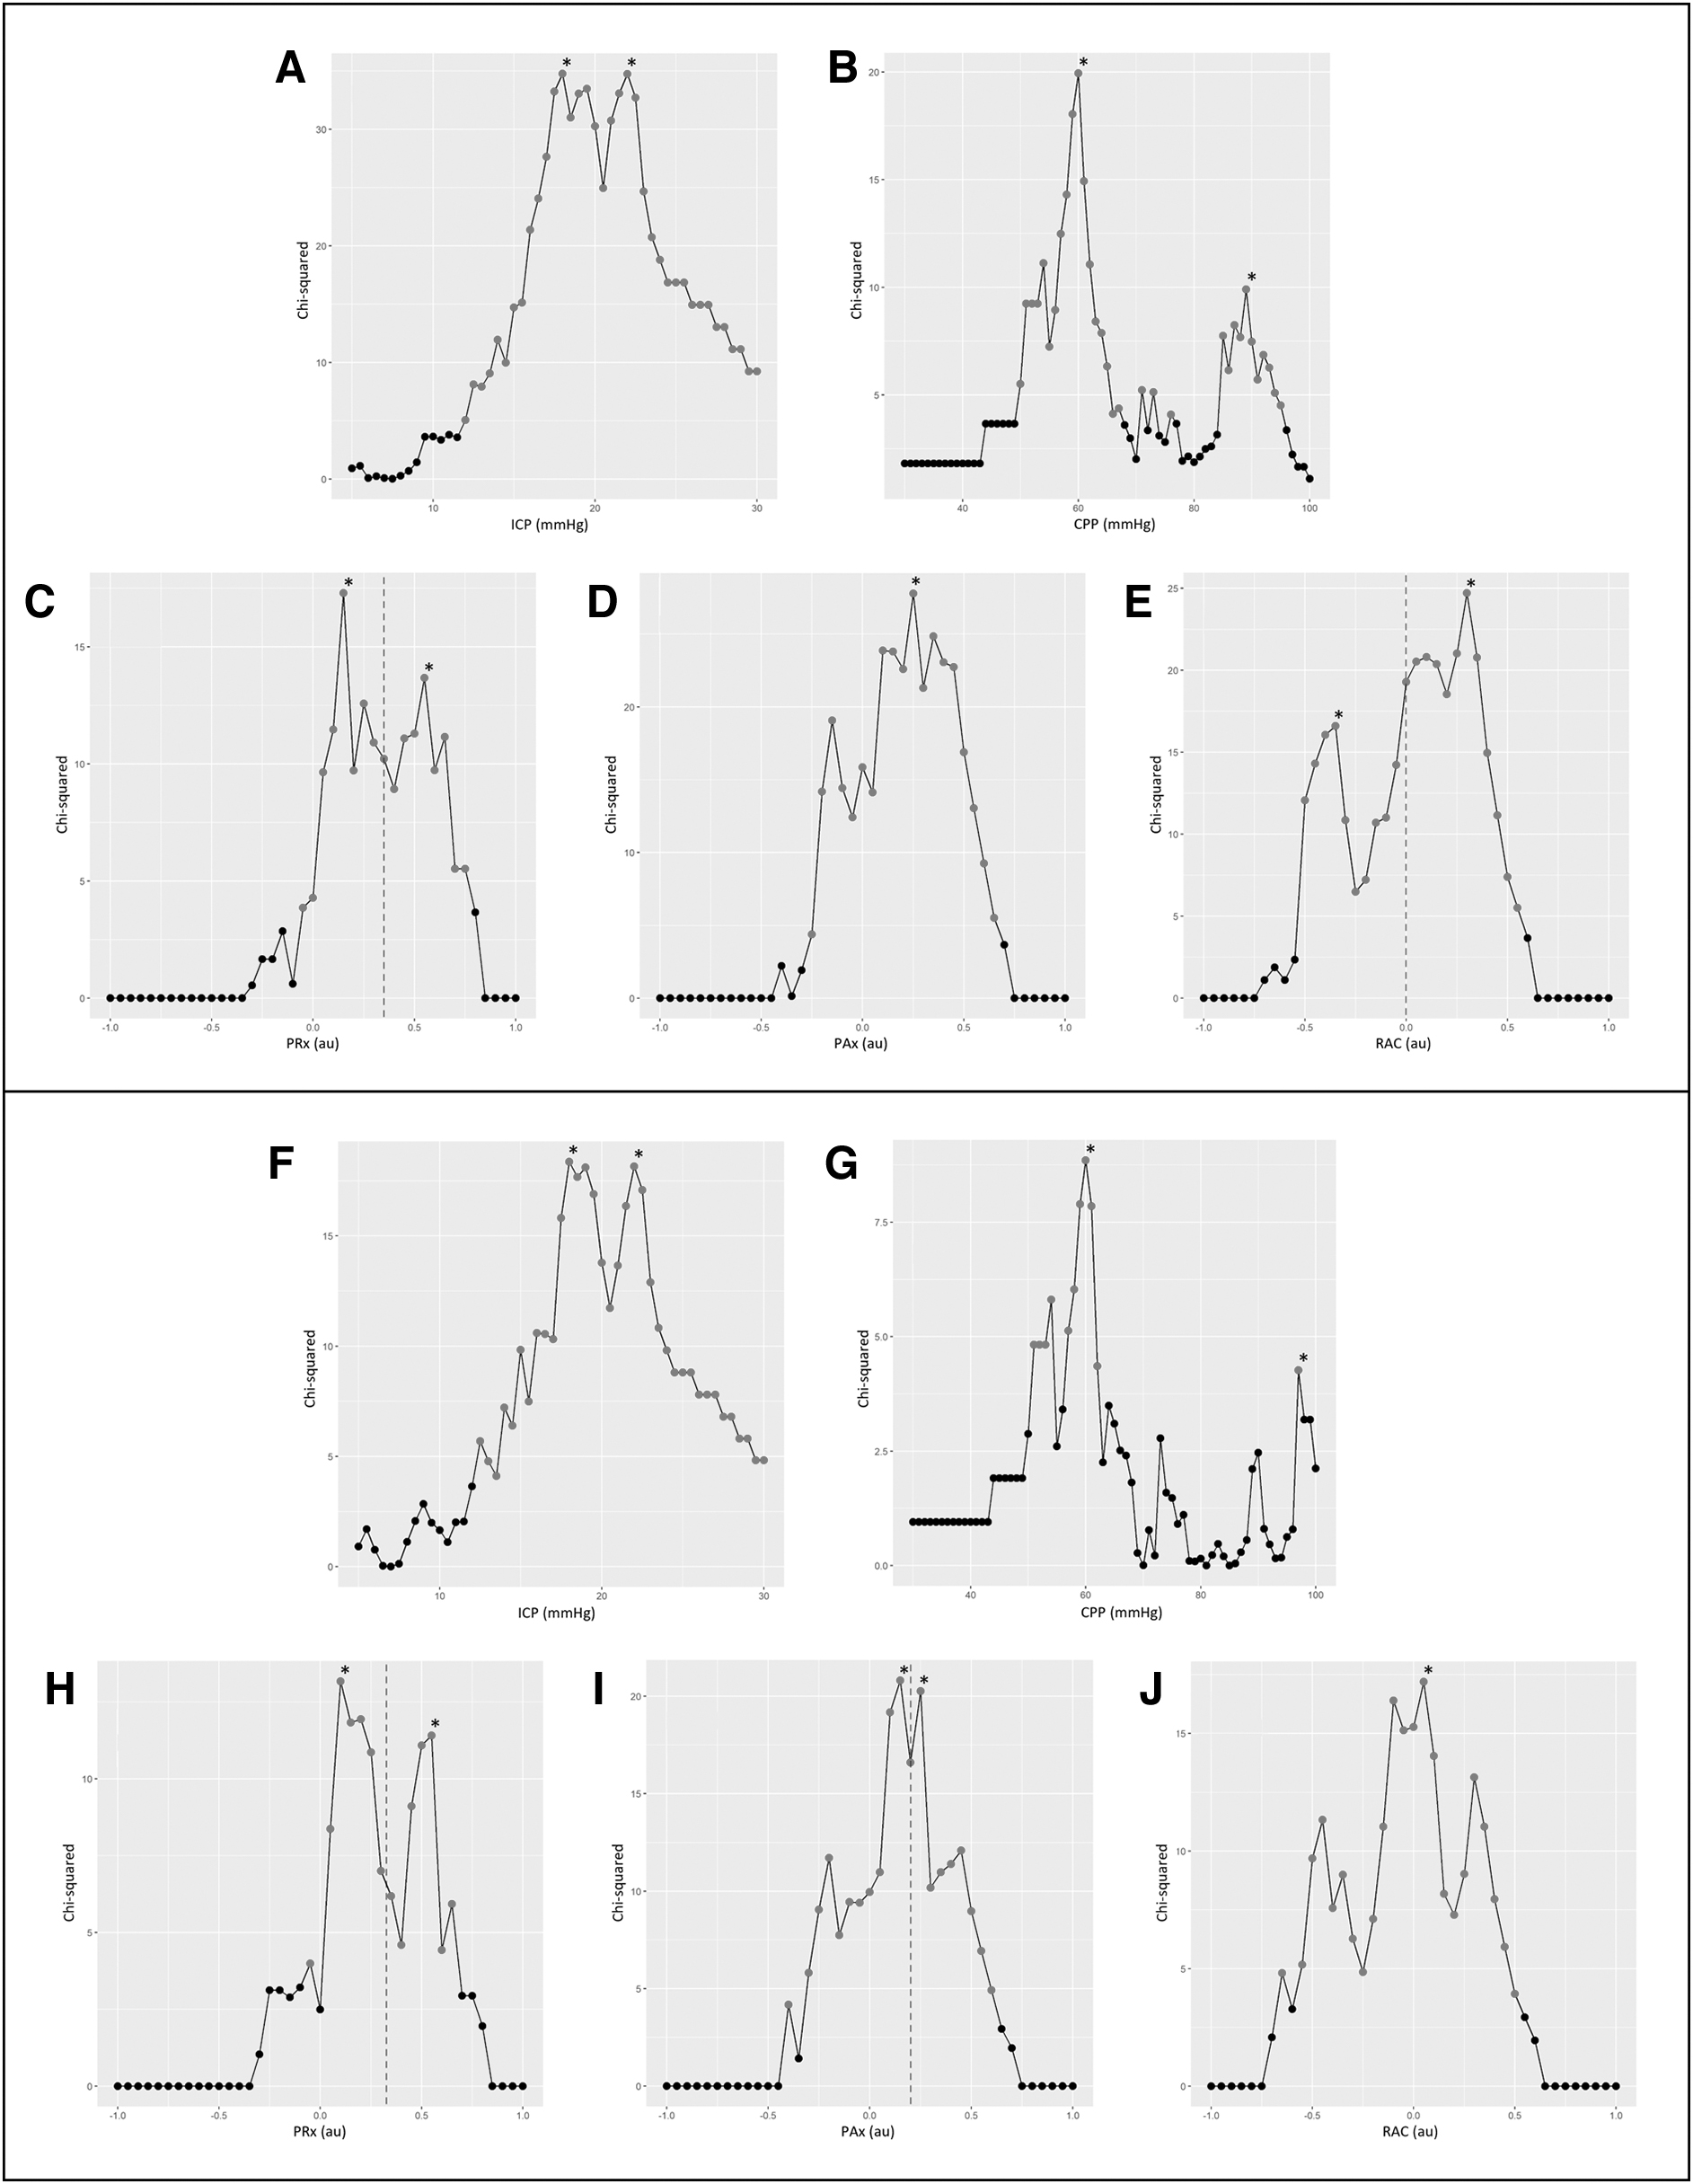
Plots of chi-square results for incremental thresholds of each parameter of interest. Alive versus dead plots are presented in the top panel for intracranial pressure (ICP) (
ICP thresholds of 18 mm Hg and 22 mm Hg and a lower limit CPP threshold of 60 mm Hg produced the greatest chi-square values for both outcome dichotomizations. Interestingly, there were only weak thresholds identified for the upper range of CPP. For both dichotomizations, the identified upper limit threshold produced a chi-square value of approximately half of that of the lower limit threshold. Upper limit CPP thresholds of 89 mm Hg and 97 mm Hg were identified, for alive versus dead and favorable versus unfavorable, respectively. For all three of the cerebrovascular reactivity indices, different critical thresholds were found for alive versus dead and favorable versus unfavorable. The PRx plots produced peaks at 0.15 and 0.55 for survival prediction and at 0.1 and 0.55 for favorable outcome prediction. These peaks were averaged to produce critical thresholds of 0.35 and 0.325, respectively. A PAx threshold of 0.25 was found to produce the greatest chi-square value for alive versus dead. For favorable versus unfavorable, the PAx plot produced peaks at 0.15 and 0.25, which were averaged to produce a critical threshold of 0.2. The RAC plot produced peaks at -0.35 and 0.3 for alive versus dead, which were averaged to produce a critical threshold of 0. For favorable outcome prediction, a RAC threshold of 0.05 produced the greatest chi-square value and was identified as the critical threshold. All identified values produced chi-square values with a p value <0.05. It is worth noting that chi-square values were generally higher for survival prediction than for favorable outcome prediction, for their respective plots.
Cohort comparison
The results of the Mann–Whitney U and chi-square testing comparing demographic and cerebral physiological data for alive versus dead and favorable versus unfavorable are presented in Table S1. Statistically, older age, lower admission GCS, higher Marshall CT grade, greater mean and insult burden values of ICP and the cerebrovascular reactivity metrics, greater % time with CPP <60 mm Hg, and lower mean CPP and % time with CPP >70 mmHg were found among the non-survivors. Similarly, patients in the unfavorable cohort were older and exhibited lower admission GCS, more abnormal admission pupillary response, longer recording periods, and higher mean and insult burden values of ICP and the cerebrovascular reactivity metrics. The results of the Mann–Whitney U and chi-square testing for intact versus impaired cerebrovascular reactivity can be found in Table S2. The impaired cohort had statistically lower mean CPP, % times above upper limit CPP thresholds, 6-month GOS, and duration of physiological data recording; while having statistically greater ICP metrics, % time with CPP <60 mm Hg, and proportion with hypoxic or hypertensive episodes at admission.
Logistical regression analyses
The results from the univariate logistical regression analysis are presented in Table 2. Time spent above/below each identified critical threshold produced a statistically significant association with survival. For favorable versus unfavorable outcome prediction, all critical thresholds, except for CPP <60 mm Hg (AUC: 0.514 [95% CI: 0.447–0.577], p value = 0.3336) and CPP >97 mm Hg (AUC: 0.519 [95% CI: 0.456–0.580], p value = 0.2984), produced a statistically significant association. Time spent with PAx above their thresholds produced the greatest AUC values for both survival (AUC: 0.670 [95% CI: 0.604–0.729], p value <0.0001) and favorable outcome prediction (AUC: 0.649 [95% CI: 0.586–0.705], p value <0.0001), as well as the greatest Nagelkerke's R2 for favorable outcome prediction (R 2 = 0.109). However, time spent with ICP >22 mm Hg produced the greatest Nagelkerke's R2 for survival prediction (R 2 = 0.147). Time spent above critical thresholds produced greater AUC and Nagelkerke's R2 values for alive versus dead prediction than for favorable versus unfavorable outcome prediction.
Univariate Logistical Regression Analysis
All p values have been adjusted using the false discovery rate (FDR) method. Bolded p values are those reaching statistical significance, p < 0.05.
AIC, Akaike information criterion; AUC, area under the curve; CI, confidence interval; CPP, cerebral perfusion pressure; ICP, intracranial pressure; Pax, pulse amplitude index; PRx, pressure reactivity index; RAC, correlation (R) between slow waves of AMP (A) and CPP (C).
The results of the multivariable logistical regression analysis are displayed in Table 3. The core model, as well as all of the models with the % time with a physiological parameter of interest above/below its identified thresholds added, reached statistical significance for both alive versus dead and favorable versus unfavorable outcome prediction. The addition of the critical thresholds generally resulted in greater AUC and Nagelkerke's R2 values compared with the core model on its own for both outcome dichotomizations, indicating that, overall, their addition to the model contributes to superior outcome prediction. The only exception to this was the addition of % time with CPP >97 mm Hg for favorable outcome prediction, which provided no added variance. Table 4 summarizes the added variance of the addition of the various identified thresholds to the core model, by presenting the difference in Nagelkerke's R2 values of the core model on its own and the models with time spent above/below critical thresholds added. Time spent with CPP above its identified upper critical thresholds provided the smallest additions in variance to the core model for both outcome dichotomizations (0.002 for alive vs. dead and -0.006 for favorable vs. unfavorable outcome). For survival, ICP >22 mm Hg provided the largest addition in variance to the core model (Δ = 0.116), whereas for favorable outcome, PAx >0.20 supplied the greatest addition in variance (Δ = 0.072).
Multivariable Logistical Regression Analysis
All p values have been adjusted using the false discovery rate (FDR) method. Bolded p values are those reaching statistical significance, p < 0.05.
Core model consisted of age, admission Glasgow Coma Scale, and admission pupil response.
AIC, Akaike information criterion; AUC, area under the curve; CI, confidence interval; CPP, cerebral perfusion pressure; ICP, intracranial pressure, PAx, pulse amplitude index; PRx, pressure reactivity index; RAC, correlation (R) between slow waves of AMP (A) and CPP (C).
Added Variance in Outcome Offered by the Identified Thresholds Over the IMPACT Core Model
Core model consisted of age, admission Glasgow Coma Scale, and admission pupil response.
CPP, cerebral perfusion pressure; ICP, intracranial pressure; IMPACT, International Mission for Prognosis and Analysis of Clinical Trials; PAx, pulse amplitude index; PRx, pressure reactivity index; RAC, correlation (R) between slow waves of AMP (A) and CPP (C).
Table S3 summarizes the results of a multivariable logistical regression analysis where time spent with CPP <60 mm Hg, ICP >18 mm Hg, ICP >20 mm Hg, or ICP >22 mm Hg was added to the core model. The addition of % time spent with cerebrovascular reactivity metrics above their critical thresholds to these models produced statistically significant results and resulted in greater Nagelkerke's R2 values for both outcome dichotomizations (range of added variance: 0.012–0.060). Table S4 presents the results of a similar multivariable logistical regression analysis where Marshall CT score was also added. The addition of time spent with PRx, PAx, or RAC above their identified critical threshold produced statistically significant results and greater Nagelkerke's R2 values for both outcome dichotomizations here as well (range of added variance: 0.010–0.080).
Table S5 presents the results of the univariate logistical regression analysis where patients were separated based on mean PRx, and its identified thresholds, into those with intact versus impaired cerebrovascular reactivity. Time spent above/below all of the identified ICP and CPP thresholds produced statistically significant associations with outcome, both alive versus dead and favorable versus unfavorable, in the impaired cohort, but failed to do so in the intact cohort. All AUC and Nagelkerke's R2 values were significantly greater in the impaired group. Table S6 summarizes the results of the multivariable logistical regression analysis where patients were separated into intact vs impaired. All models here reached statistical significance, except for the stand-alone core model in the impaired cohort. Table S7 summarizes the added variance in outcome prediction, in the form of differences in Nagelkerke R2 values, for these multivariable models. Added variance in outcome prediction was greater in the impaired group across all models.
Discussion
Through this chi-square analysis we were able validate the findings of the two previous articles investigating critical thresholds of ICP-derived cerebrovascular reactivity indices, 16,22 as well as to provide validation for both the BTF and the Seattle International Severe Traumatic Brain Injury Consensus Conference (SIBICC) guideline-suggested ICP and CPP treatment thresholds. 5,6 For CPP, chi-square analysis identified a distinct peak at 60 mm Hg for both survival and favorable outcome prediction. This strongly supports the practice of therapeutically maintaining CPP above this threshold when treating moderate/severe TBI patients, as recommended by the BTF and SIBICC. 5,6 Interestingly, no similarly sized peaks were identified in the upper range of CPP despite current guidelines recommending an upper threshold limit of 70 mm Hg. 5,6 However, we did observe smaller peaks with approximately half the chi-square values at 89 mm Hg and 97 mm Hg, for survival and favorable outcome prediction respectively. It is surprising that these values were quite a bit higher than the guideline-recommended upper limit threshold. The smaller chi-square values are consistent with recent literature demonstrating that elevated CPP is not strongly correlated with poor long-term outcome. 44 –47 This suggests that elevated CPP, as long as it is not too extreme, may not actually overwhelm the blood–brain barrier and cause hemorrhage to the extent as once thought. For ICP, a peak range was observed rather than a single distinct peak. For both survival and favorable outcome prediction, peaks were found at 18 mm Hg and 22 mm Hg, with the values between producing only slightly lower chi-square values. Therefore, it is likely that any ICP threshold in the range of 18–22 mm Hg would be effective for predicting outcome. This supports the BTF and SIBICC guideline of therapeutically controlling ICP below 20 mm Hg or 22 mm Hg. 5,6
The results for the cerebrovascular reactivity metrics were not as clear cut. For PRx, both the survival and the favorable outcome analyses produced a range of significant values; however, when the most prominent peaks were averaged, we identified critical threshold values of 0.35 and 0.325, respectively. This supports the previous articles that found a critical threshold of ∼0.25– 0.35 for outcome predictions. 16,22,43 Findings here are comforting, as they support current lower limit of autoregulation threshold ranges for continuous indices referenced in pre-clinical animal literature, 37,48 –55 and form the basis for modern personalized therapeutic approaches in TBI care leveraging continuous ICP-derived autoregulation metrics. 44,56 –+ PAx produced more distinct results than PRx. Peaks were observed at 0.25 for survival prediction, and at 0.20 for favorable outcome prediction. The only previous article evaluating critical thresholds for PAx also found a critical threshold of 0.25 for predicting death; however, the authors observed an optimal threshold of 0.05 for favorable outcome prediction. 16 For alive versus dead prediction, RAC produced a wide peak. After averaging the two most significant peaks, a critical threshold of 0 was determined. For favorable versus unfavorable outcome, a peak was observed at 0.05. These results fall well in line with previous work, which found critical thresholds of -0.05 and -0.10, respectively. 16 It is interesting that, for these metrics, we often observed broad-based peaks or multiple peaks that necessitated averaging in order to identify a single threshold value. This can possibly be explained by the existence of variability in critical thresholds between patient subgroups. For example, a study by Sorrentino and colleagues observed a different critical PRx threshold for favorable outcome prediction in females than in other subgroups. 22
As noted earlier, the magnitude chi-square test-statistic values for survival prediction were higher than those for favorable outcome prediction for all the physiological parameters of interest. This suggests that all the parameters of interest are superior at predicting survival than at predicting favorable outcome. This is further supported by the results of the logistical regression analyses, where the AUC and Nagelkerke's R2 values were consistently higher for the alive versus dead dichotomization. This finding is in slight contrast to the those in the article by Sorrentino and colleagues, which found that the chi-square values for PRx seemed almost equal between survival and favorable outcome prediction. 22 However, we did observe that the extent of the difference in chi-square values was greater for ICP and CPP, where chi-square values for survival prediction were more than double those for favorable outcome prediction, than for the cerebrovascular reactivity metrics. A potential explanation for this is that when there is significant difficulty maintaining ICP and CPP goals, life-sustaining therapy is often withdrawn, therefore strengthening the association between de-ranged ICP/CPP and death.
Using logistical regression analysis, we were able to confirm that the identified critical thresholds are effective at predicting outcomes. Other than the CPP <60 mm Hg and CPP >97 mmHg models for favorable outcome prediction, all univariate models were able to reach statistical significance. Each multivariate model reached statistical significance, with every parameter of interest, except for % time with CPP >97 mm Hg, adding variance to outcome prediction over the IMPACT Core Model. In addition to demonstrating that all of the identified critical thresholds are able to improve prognostication in moderate/severe TBI, a few additional interesting findings were observed. First, % time spent with CPP above the identified upper range thresholds, 89 mm Hg and 97 mm Hg, consistently performed the worst for their respective outcome dichotomization, producing the smallest AUC and Nagelkerke's R2 values by significant margins. This is consistent with the lower chi-square values associated with these thresholds during their identification, and further suggests that cerebral hyperperfusion may not be as detrimental as once thought. Time with CPP <60 mm Hg also performed quite poorly overall. At first glance this may be quite surprising, as sufficient CPP is vital for brain health; however, this finding is likely explained by the fact that CPP is highly controlled therapeutically. The cohort had a % time with CPP <60 mm Hg of <5%, and therefore, it would be unlikely for this variable to have a significant correlation with outcome.
Next, among the cerebrovascular reactivity metrics, PAx and RAC performed consistently better than PRx for all tests, with PAx slightly outperforming RAC. This indicates that PAx and RAC may be superior to PRx for predicting outcomes, as suggested by existing literature in the field. 21,23,38,60 The previous article by Zeiler and colleagues showed similar findings, observing that PAx and RAC outperformed PRx; however, rather than PAx, the authors found that RAC performed the best. 16 Further work is needed to determine which cerebrovascular reactivity metric is superior for outcome prognostication. Lastly, through our secondary analysis we were able to show that % time with the cerebrovascular reactivity metrics above their identified thresholds continue to add additional variance to the core model when % time with ICP above its guideline-based thresholds is controlled for. This demonstrates that the identified cerebrovascular reactivity thresholds provide additional utility to current prognostic models.
The secondary analysis in which patients were dichotomized into the those with intact versus impaired cerebrovascular reactivity produced numerous interesting findings as well. First, the Mann–Whitney U /chi-square testing demonstrated that those with impaired cerebrovascular reactivity had worse outcomes, more intracranial hypertension, and more cerebral hypoperfusion. This makes sense, because impaired autoregulation exposes the brain to pressure-passive changes in blood flow, increasing the brain's susceptibility to ischemic damages and herniation, and subsequent neuronal death. Interestingly, the intact group spent more time with a CPP above the identified upper thresholds than the impaired group. This is somewhat counterintuitive and may indicate that the autoregulatory function may not limit hyperperfusion to the extent that had been currently believed. With regard to the results of the logistical regression analyses, we saw that CPP- and ICP-based metrics produced significantly stronger associations with outcome in the impaired group than in the intact group. This indicates that when cerebrovascular reactivity is dysfunctional, CPP and ICP control is drastically more important. This can once again be explained by the fact that impairment of autoregulation exposes the brain to pressure-passive changes in blood flow, thus necessitating therapeutic CPP and ICP control to compensate for this function loss.
Limitations
Although this study used a large multi-center database, there are a few limitations that must be addressed. First, this study used grand-averaged values when performing the chi-square analyses. There are significant downsides to using such values, as they do not properly reflect momentary de-rangements. For example, a patient may have a relatively normal mean CPP despite having episodes of extremely low CPP, as long as the recording period is long enough to dilute the effects of those episodes. Additionally, one could have a relatively normal mean value if there are extreme lows and extreme highs that balance each other out during averaging. Therefore, patients who spend a significant amount of time in de-ranged states may theoretically not display this in their averaged values. Further, the use of such grand-averaged values limits the generalizability of our results, because the patients included in the study may not accurately represent the general TBI population seen across the world. Therefore, future work should be geared toward using metrics that take acute events into account, such as % time of dose-time above/below threshold. However, for the purpose of this study, the above-mentioned statistical methods were applied in order to conform with prior studies in an attempt to validate previously referenced and currently utilized thresholds for ICP-derived cerebrovascular reactivity indices.
Another limitation of this study is that the results of the chi-square analysis present population-based thresholds that fail to account for individual factors. There have been numerous studies that have demonstrated that the individual physiological response to TBI varies greatly within the population depending on factors such as age, genetic makeup, and biochemistry. 28,61 –64 This is further supported by the fact the results of this study differed to a certain extent from those of the previous two studies, which utilized a different database. It is also likely that physiological response varies temporally across a patient's time in the ICU. Further, the literature has demonstrated that the current population-based prognostic models account for only a small part of the total variance in outcome. 61,65,66 Therefore, a more individual specific approach for prognostication and care is required.
Recent work has demonstrated that it is possible to continuously calculate a personalized optimal CPP target (CPPopt), at bedside, using the relationship between a cerebrovascular reactivity metric and CPP. 56,57,67 Similarly, using the relationship between cerebrovascular reactivity and ICP, it is possible to calculate an individualized ICP threshold (iICP). 68,69 These individualized metrics have been shown to be more strongly associated with outcome than population-based metrics. 45,57,70 –72 Future work on TBI prognostication and treatment goals should focus on such personalized medicine approaches rather than on the current population-based method. Because algorithms for these personalized metrics are still currently being optimized and are not yet integrated into clinical care, we decided not to include them in this analysis. Further, considering that the primary objective of this study was to validate prior single center works that identified critical thresholds of autoregulatory indices, we felt that such inclusion would fall out of the scope of this study. However, future validation work on these metrics, CPPopt and iICP, and their associations with outcome, is planned.
Such future work will require much larger cohort sizes with high-frequency multi-modal physiological data. To our knowledge, the CAHR-TBI cohort described in this study, in its current state, represents the largest published multi-center collection of high fidelity cerebral physiological data, with the next largest being the Collaborative European NeuroTrauma Effectiveness Research In TBI (CENTER-TBI) High Resolution ICU Sub-Study. 58,73 With that said, this current study had only 354 patients, and therefore, future studies will necessitate similar multi-center coordination but on a much wider international scale, if such sub-group analyses are to be conducted.
Despite being the largest high-frequency cerebral physiological multi-center database in the world, to our knowledge, there are limitations that exist within the CAHR-TBI database. One major shortcoming is the heterogeneity among the different sites in regard to the clinical and demographic data collected. For example, data such as imaging results and admission characteristics are often missing for a large portion of the data sets. This poses a significant problem when trying to provide detailed pathological descriptions of the patient population or perform properly powered subgroup analyses.
Another limitation that needs to be highlighted is the potential effect that the strict adherence to guideline-based care may have had on the results. Throughout each patient's stay in the surgical ICU (SICU), they had their ICP and CPP tightly controlled therapeutically to reach the guideline-recommended targets. Patients were potentially more likely to be palliated by the treatment team when therapeutics failed to maintain these parameters. This may have resulted in a self-fulfilling prophecy in which failure to reach guideline-recommended targets led to termination of aggressive treatment, thus producing data that support the legitimacy of these guideline-based thresholds.
Conclusion
In this study, we used a unique multi-center database to identify and validate ICP, CPP, and cerebrovascular reactivity thresholds that are able to optimally differentiate between alive versus dead and favorable versus unfavorable outcomes. We identified a CPP lower limit threshold of 60 mm Hg and ICP thresholds of 18 mm Hg and 22 mm Hg for both survival and favorable outcome prediction. For PRx, PAx, and RAC thresholds 0.35 and 0.325, 0.25 and 0.20, and 0 and 0.05 were found for survival and favorable outcome prediction, respectively. Both univariate and multivariable logistical regression analysis confirmed the ability of the identified thresholds to predict outcome. Our results validate previous works, as well as the BTF- and SIBICC-suggested ICP threshold and CPP target.
Transparency, Rigor, and Reproducibility Summary
We conducted a retrospective multi-centered cohort study utilizing prospectively collected data from the CAHR-TBI Research Collaborative. This study was not formally registered; however, local ethics approval pertaining to all aspects of data collection for this database has been obtained from the University of Manitoba Health Research Ethics Board (H2017:181, H2017:188). Additionally, retrospective access of the database and anonymous data transfer between centers have been fully approved (H2020:118, H20-03,759 and REB20-0482). Given that data collection is performed in a fully anonymized fashion, a waived consent model is used under the approval of the research ethics board and provincial patient privacy offices of Manitoba. Statistical power and sample size calculations were not performed; rather, sample size was chosen based on the amount of available data at the time of analysis. However, the sample size used falls well in line with recommendations for cerebral physiological studies.
74
The analysis plan was not formally pre-registered. Data from 354 patients in the CAHR-TBI database were used in this analysis; 114 patients of these patients had died at the time of the analysis. Data were collected from 2011 to 2021 at the University of Calgary, January 2019 to March 2023 at the University of Manitoba, 2017–2022 at the University of Maastricht, and 2014– 2019 at the University of British Columbia. Data acquisition was performed using ICM+. Statistical analysis was performed using ICM+ and R Statistical Computing software (R Core Team [2020]. R: A language and environment for statistical computing. R Foundation for Statistical Computing, Vienna, Austria. URL
Footnotes
Authors' Contributions
Kevin Y. Stein was responsible for investigation, formal analysis, data curation, visualization, and writing – original draft; Logan Froese was responsible for methodology, investigation, formal analysis, visualization, and writing – review and editing; Mypinder Sekhon, Donald Griesdale, Eric P. Thelin, Rahul Raj, Jeanette Tas, Marcel Aries, Clare Gallagher, and Francis Bernard were responsible for data curation and writing – review and editing; Alwyn Gomez was responsible for formal analysis, data curation, and writing – review and editing; Andreas H. Kramer was responsible for data curation, writing – review and editing; and Frederick A. Zeiler was responsible for conceptualization, data curation, writing – review and editing, supervision, and funding acquisition.
Funding Information
This work was directly supported through the Endowed Manitoba Public Insurance (MPI) Chair in Neuroscience. F.A.Z. is supported through the Endowed MPI Chair in Neuroscience/TBI Research Endowment, The Natural Sciences and Engineering Research Council of Canada (NSERC) (DGECR-2022-00260, RGPIN-2022-03621, ALLRP-578524-22, ALLRP-576386-22, I2IPJ 586104–23, and ALLRP 586244-23), Canadian Institutes of Health Research (CIHR), the MPI Neuroscience Research Operating Fund, the Health Sciences Centre Foundation Winnipeg, the Canada Foundation for Innovation (CFI) (Project #: 38583), Research Manitoba (Grants 3906 and 5429), and the University of Manitoba Vice President of Research and Innovation (VPRI) Research Investment Fund (RIF). K.Y.S. is supported through the NSERC Canada Graduate Scholarships - Doctoral (CGS-D) program (CGS-D-579021-2023), University of Manitoba R.G. and E.M. Knight Graduate Fellowship (Doctoral) in Biomedical Engineering, and the University of Manitoba MD/PhD program. L.F. is supported through a Research Manitoba PhD Fellowship, the Brain Canada Thomkins Travel Scholarship, NSERC (ALLRP-578524-22, ALLRP-576386-2), and the Graduate Enhancement of Tri-Council Stipends (GETS) – University of Manitoba. A.G. is supported through a CIHR Fellowship (Grant 472286).
Author Disclosure Statement
No competing financial interests exist.
Supplementary Material
Supplementary Table S1
Supplementary Table S2
Supplementary Table S3
Supplementary Table S4
Supplementary Table S5
Supplementary Table S6
Supplementary Table S7
References
Supplementary Material
Please find the following supplemental material available below.
For Open Access articles published under a Creative Commons License, all supplemental material carries the same license as the article it is associated with.
For non-Open Access articles published, all supplemental material carries a non-exclusive license, and permission requests for re-use of supplemental material or any part of supplemental material shall be sent directly to the copyright owner as specified in the copyright notice associated with the article.