




Abstract
Neurofilament-light chain (NF-L) and phosphorylated neurofilament-heavy chain (pNF-H) are axonal proteins that have been reported as potential diagnostic and prognostic biomarkers in traumatic brain injury (TBI). However, detailed temporal profiles for these proteins in blood, and interrelationships in the acute and chronic time periods post-TBI have not been established. Our objectives were: 1) to characterize acute-to-chronic serum NF-L and pNF-H profiles after moderate-severe TBI, as well as acute cerebrospinal fluid (CSF) levels; 2) to evaluate CSF and serum NF-L and pNF-H associations with each other; and 3) to assess biomarker associations with global patient outcome using both the Glasgow Outcome Scale-Extended (GOS-E) and Disability Rating Scale (DRS). In this multi-cohort study, we measured serum and CSF NF-L and pNF-H levels in samples collected from two clinical cohorts (University of Pittsburgh [UPITT] and Baylor College of Medicine [BCM]) of individuals with moderate-severe TBI. The UPITT cohort includes 279 subjects from an observational cohort study; we obtained serum (n = 277 unique subjects) and CSF (n = 95 unique subjects) daily for 1 week, and serum every 2 weeks for 6 months. The BCM cohort included 103 subjects from a previous randomized clinical trial of erythropoietin and blood transfusion threshold after severe TBI, which showed no effect on neurological outcome between treatment arms; serum (n = 99 unique subjects) and CSF (n = 54 unique subjects) NF-L and pNF-H levels were measured at least daily during Days (D) 0-10 post-injury. GOS-E and DRS were assessed at 6 months (both cohorts) and 12 months (UPITT cohort only). Results show serum NF-L and pNF-H gradually rise during the first 10 days and peak at D20-30 post-injury. In the UPITT cohort, acute (D0-6) NF-L and pNF-H levels correlate within CSF and serum (Spearman r = 0.44-0.48; p < 0.05). In the UPITT cohort, acute NF-L CSF and serum levels, as well as chronic (Months [M]2-6) serum NF-L levels, were higher among individuals with unfavorable GOS-E and worse DRS at 12 months (p < 0.05, all comparisons). In the BCM cohort, higher acute serum NF-L levels were also associated with unfavorable GOS-E. Higher pNF-H serum concentrations (D0-6 and M2-6), but not CSF pNF-H, were associated with unfavorable GOS-E and worse DRS (p < 0.05, all comparisons) in the UPITT cohort. Relationships between biomarker levels and favorable outcome persisted after controlling for age, sex, and Glasgow Coma Scale. This study shows for the first time that serum levels of NF-L and pNF-H peak at D20-30 post-TBI. Serum NF-L levels, and to a lesser extent pNF-H levels, are robustly associated with global patient outcomes and disability after moderate-severe TBI. Further studies on clinical utility as prognosis and treatment-response indicators are needed.
Introduction
The ability to use blood-based protein biomarkers to assess patients with traumatic brain injury (TBI) is one of the major advances in translational TBI research in recent years. Blood-based biomarkers offer a minimally invasive method to detect and monitor pathological changes within the brain. Recently, a U.S. Food and Drug Administration (FDA)-cleared biomarker panel was approved for its ability to predict positive findings of TBI on brain computed tomography (CT) scanning. 1 Glial fibrillary acidic protein (GFAP; astrocyte source) and ubiquitin C-terminal hydrolase L1 protein (UCH-L1; neuron source) are the two markers that comprise this panel, although challenges remain in adoption to routine clinical use. 2 Increased attention has been turned to exploring markers of progressing brain injury and recovery, as evidence of pathological processes with different rates of expression are widely observed among individuals post-TBI. 3 Axonal injury is common after TBI, but neither GFAP nor UCH-L1 directly informs this issue after TBI. 4 Neurofilament-light chain (NF-L) and phosphorylated neurofilament-heavy chain (pNF-H) are axonal proteins strongly associated with multiple acquired neurological conditions, 5,6 and have been recently studied as potentially useful TBI biomarkers. 7 -9 Axonal injury after TBI is a key brain injury mechanism, and biomarkers reflecting axonal damage, (e.g., NF-L and pNF-H), may offer opportunities to detect and monitor this pathology.
Neurofilaments (NFs) are class IV intermediate filaments (10 nm diameter) that are neuron-specific. NFs are abundant in axons, and relatively sparse in dendrites and perikarya. 10 NFs have three major components: NF-light (NF-L, 70 kDa), NF-medium (NF-M, 150 kDa), and NF-heavy (NF-H, 200 kDa). There are 6-15 Lys–Ser–Pro (“KSP”) repeats in NF-M, and 40-52 KSP repeats in NF-H. These acidic KSP motifs radiate outward from the core neurofilament structure, and regions near the C-terminus are heavily phosphorylated.
NF-L is an increasingly recognized biomarker linked to TBI pathology and outcomes. Shahim and colleagues reported cerebrospinal fluid (CSF) and serum NF-L levels correlate with post-concussive symptoms after sports-related concussion/mild TBI and relate to diffusion tensor imaging (DTI) measures, including brain volume and fractional anisotropy. 7 Other data from a full range of TBI severity suggest acute serum NF-L levels correlate with diffuse axonal injury detectable by magnetic resonance imaging (MRI). 11,12 Chronic serum NF-L levels were also associated with MRI brain atrophy and DTI measures of traumatic axonal injury among clinic patients with mild-to-severe TBI. 13 Shahim and colleagues also characterized NF-L serum levels between 1 month and 5 years after TBI (all severities), with levels gradually declining over this time course but remaining elevated compared with controls. 7,13 Recently, Graham and colleagues reported that NF-L, unlike tau, UCH-L1, GFAP, and S100B, is the only marker that continues to rise in serum up to 6 weeks after moderate-severe TBI, before returning towards baseline. 14 They also found peak NF-L plasma concentration was associated with poor patient outcome (GOSE at 6- and 12-months post-injury). 14 Despite these prior cohort studies, no detailed NF-L temporal profile characterizations from the time of injury through subacute and chronic recovery phases have been reported.
The phosphorylated form of NF-H (pNF-H) is a distinct but related axonal protein biomarker relevant to TBI diagnosis and outcome. Pre-clinical models show serum and CSF pNF-H levels are elevated after TBI 15 ; pNF-H data in clinical TBI populations are limited. In one study with 32 subjects with severe TBI, 24-h serum pNF-H levels accurately predicted mortality as well as poor outcome (Glasgow Outcome Scale [GOS] ≤ 4). 16 Hellewell and colleagues also identified in an erythropoietin clinical trial for severe TBI that pNF-H serum levels continue to rise within the first 5 days, and D3-4 levels correlated with Glasgow Outcome Scale-Extended (GOS-E) outcome score. 17 Otani and colleagues examined serial pNF-H changes among patients with D1-D28 serum samples and found the highest average levels at D14 post-injury. 18 They also demonstrated 24-72 h pNF-H serum levels were associated with GOS score. 18 In mild TBI, reported D1 serum pNF-H levels were associated with Glasgow Coma Scale (GCS) and CT-detectable brain lesions. 19
However, important gaps remain in our understanding of NF-L and pNF-H dynamics after TBI. For example, exactly when NF-L peaks following TBI is still elusive; prior studies examine either acute or subacute-to-chronic time courses. Additionally, while NF-L and pNF-H have been studied separately after TBI, the markers have not been studied together, and relationships between serum and CSF biomarker levels are unclear. More rigorous characterization of NF-L and pNF-H profiles after TBI is necessary for clinical translation, use as surrogate endpoints in future clinical trials, and to establish pharmacodynamic/drug target engagement using biomarkers as a readout. Here, we utilize two prospectively and independently enrolled cohorts of individuals with moderate-severe TBI to characterize temporal profiles of NF-L and pNF-H through Month 12 (M12) post-injury using the Quanterix SIMOA [Single Molecule Array] platform, and we describe relationships between NF-L and pNF-H. In addition to characterizing the temporal dynamics of NF-L and pNF-H, we hypothesized that acute CSF and serum NF-L and pNF-H levels, and subacute to chronic NF-L and pNF-H temporal serum profiles, would be associated with neurological outcome and disability at 6 and 12 months post-TBI.
Methods
Study design and participants: Two prospective cohorts
We analyzed data and samples from 279 individuals in the University of Pittsburgh (UPITT) cohort and 103 individuals in the Baylor College of Medicine (BCM) cohort (Fig. 1). In the UPITT cohort, serum samples were available in 277 subjects, and CSF was available in 95 subjects. In the BCM cohort, serum was available in 99 subjects, and CSF was available in 54 subjects.
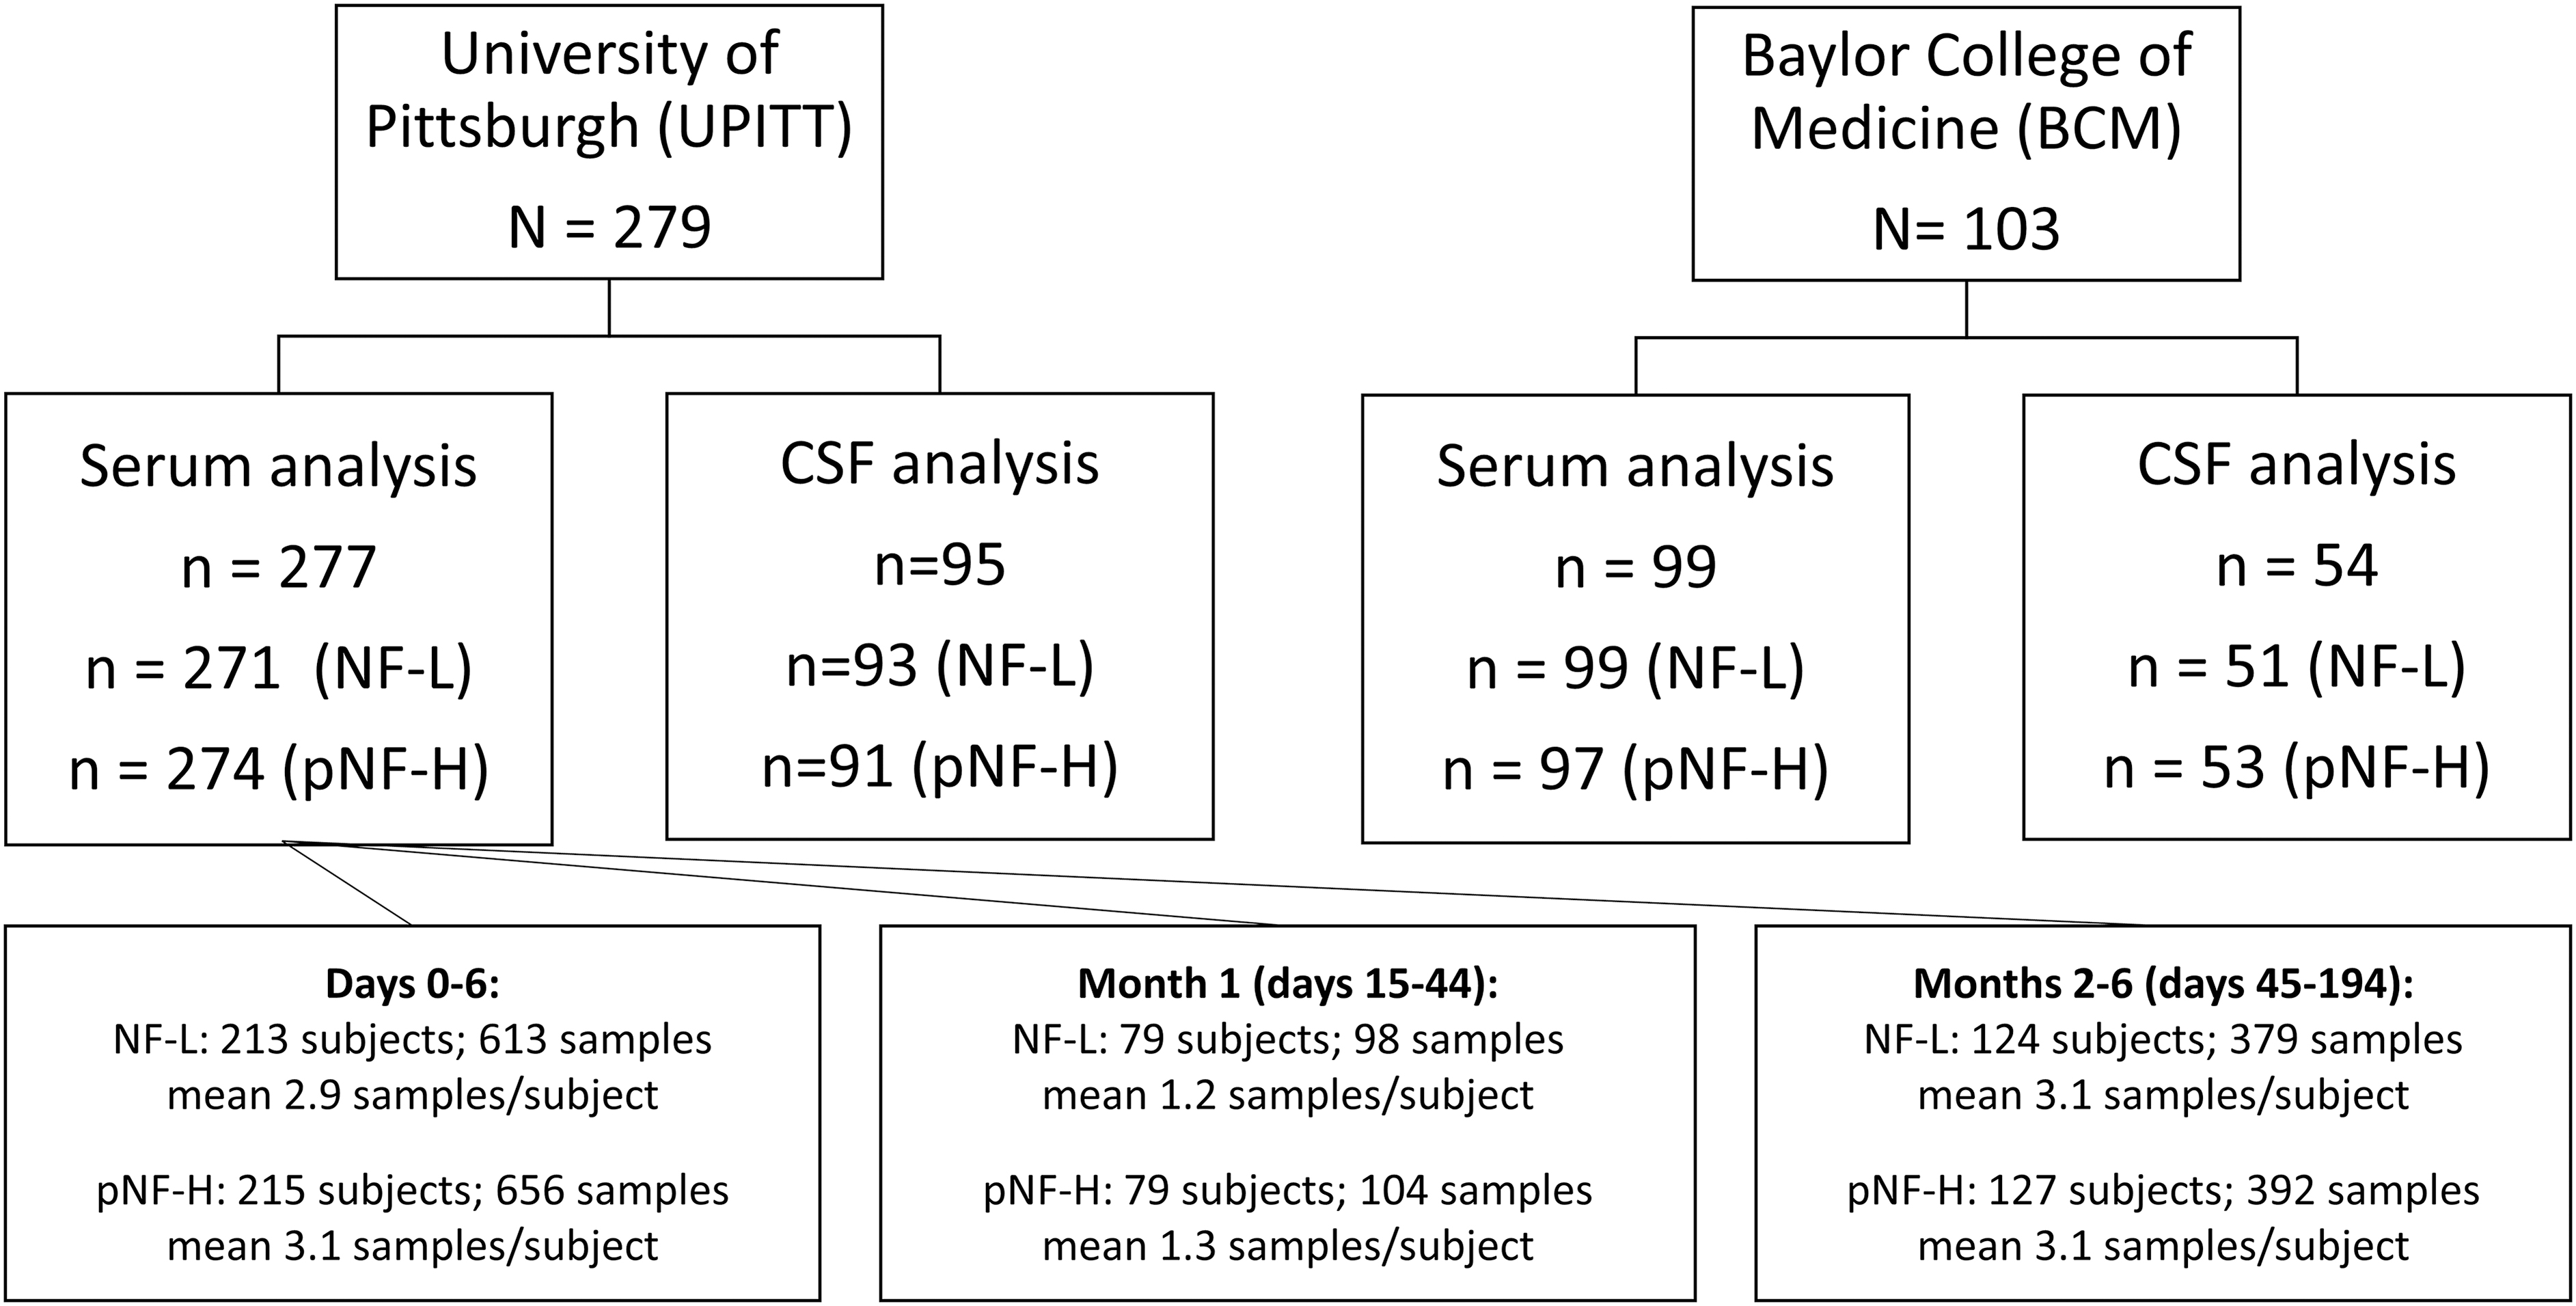
Study cohorts, sample flow diagram and cerebrospinal fluid (CSF) and serum neurofilament-light chain (NF-L) and phosphorylated neurofilament-heavy chain (pNF-H) analysis characteristics by three time intervals: CSF levels are acute only (Days 0-5 for University of Pittsburgh [UPITT] Days 0-10 for Baylor College of Medicine [BCM]). Serum NF-L and pNF-H levels are shown in three time intervals: Days 0-6 (acute), Days 15-44 (1 Month, subacute), and months 2-6 (chronic). We also include serum (n = 92) and CSF (n = 92) samples from healthy volunteers (at UPITT and supplemented with a commercial source: BioIVT).
The UPITT cohort is derived from a prospective longitudinal observational cohort study that enrolled patients admitted to an academic hospital system with two level 1 trauma centers. In the UPITT cohort, acute blood and CSF samples (D0-6 post-TBI) were available in subjects with severe TBI enrolled during initial acute care hospitalization (initial GCS score ≤8; n = 224). Additional subjects with moderate-severe TBI (initial GCS <13; n = 55) were enrolled at time of inpatient rehabilitation; therefore, D0-6 samples were unavailable. Inclusion criteria were initial GCS <8 (severe) or GCS <13 (moderate and severe) with sufficient clinical evidence of TBI (i.e., positive anatomic neuroimaging findings or focal neurologic signs) at presentation. Exclusion criteria were penetrating head injury, prolonged cardiac or respiratory arrest (> 30 min) prior to admission, evidence of brain death within three days after injury, Abbreviated Injury Scale (AIS) score of 5 in regions other than the head or neck, untreated endocrine diseases, autoimmune disorders, known ongoing neurological or neurodegenerative diseases, and hormone-related cancer. Blood samples were collected at D0-6, up to every 2 weeks for 6 months, and at M12. CSF was collected at D0-6 via external ventricular drain when available.
The BCM cohort was part of a multi-factorial randomized clinical trial of erythropoietin versus placebo, and blood transfusion thresholds using hemoglobin levels of 7 g/dL versus 10g/dL, in patients with severe TBI. 20 This study found no differences in neurological outcome between treatment groups, so we treated the full study sample as one cohort. Inclusion criteria for the trial included age ≥15 years, hospital admission with closed-head injury, motor GCS ≤5 after resuscitation, and enrollment ≤6 h of injury. Exclusion criteria were GCS of 3 with fixed/dilated pupils, penetrating trauma, pregnancy, life-threatening systemic injuries, and severe pre-existing disease. Blood and CSF samples were collected daily for 10 days, when available.
Although the two cohorts include similar patient types, we analyzed the cohorts separately due to study design differences noted above and to compare and contrast biomarker profiles across cohorts, as recently described. 21 Institutional review boards at UPITT and BCM each approved this research.
Control values were measured from serum (n = 92) and CSF (n = 68) samples collected from healthy volunteers (at UPITT and supplemented with a commercial source: BioIVT; Supplementary Table S1). Supplementary Table S1 shows that: 1) among individuals with CSF samples, controls were older than both UPITT and BCM cohorts (p < 0.001) and UPITT and BCM TBI subject ages were similar (Kruskal-Wallis test with Dunn's multiple comparisons post-hoc tests); 2) among individuals with serum samples, the BCM cohort was younger than the UPITT cohort (p = 0.04), but other comparisons showed no significant differences.
Biomarker assays
We assayed NF-L and pNF-H using a high-sensitivity immunoassay paired with digital array technology (Single Molecule Array [SIMOA]). We used the Human Neurology 4-Plex B assay (N4PB; Item 103345) for NF-L and the pNF-H discovery kit (Item 102669) using the SR-X benchtop platform (Quanterix Corp., Lexington, MA) at the University of Florida (Gainesville, FL) according to the manufacturer's instructions. 22 For pNF-H, the lower limit of quantification (LLOQ), lower limit of detection (LOD), and dynamic range were 2.88 pg/mL, 0.663 pg/mL, and 0.663-8,400 pg/mL, respectively. Inter-assay and intra-assay %coefficients of variation (CV) were 2.7-10.1% and 4.2-9.9%, respectively. For pNF-H, the LLOQ, LOD, and dynamic range were 2.50 pg/mL, 0.0971 pg/mL, and 0.0971-2,000 pg/mL, respectively. Inter-assay and intra-assay %CV were 4.6-6.9% and 3.5-7.5%, respectively. Three assay batches were performed, and we indexed subsequent batches to the initial batch values using linear regression with zero-intercept and common samples assays across batches. Laboratory staff members were blinded to outcome data.
Outcome measures
For both UPITT and BCM cohorts, trained assessors obtained outcome information at 6 months (both cohorts) and 12 months (UPITT only) post-injury. We measured global neurological outcome via the GOS-E, an eight-category scale ranging from death (1) to good recovery (8). 23,24 GOS-E was dichotomized for analysis into favorable outcome (scores 5-8) and unfavorable outcome (scores 1-4). We measured disability with the Disability Rating Scale (DRS), a 30-point scale ranging from 0 (no disability) to 30 (dead). 25 DRS was trichotomized for group-based analysis of biomarker levels (DRS 0-3, 4-14, and 15-30) or dichotomized (DRS 0-14 vs. 15-30). 21,26 -28
Temporal nomenclature
We adopted three different time interval groupings (acute (D) 0-6, subacute (D15-44), chronic (M2-6, inclusive of D45-194). This approach maintained consistency with time course reporting. The only exception is group-based trajectory analysis which was performed separately for each of the following time periods: D0-6 (Daily), W1-6 (Weekly; inclusive of D0-41), and M1-6 (Monthly, inclusive of D15-194). Here we included the first week in subacute interval, and 1 month in the chronic interval to better characterize change over time and to maximize sample size, given that the analysis requires an individual to have ≥2 data points within each time period to generate a trajectory.
Biokinetic modeling method
Biokinetic modeling and plots for serum NF-L and pNF-H levels were generated using the kinetic module in the program R. Non-compartmental kinetic calculations as described in Pharmacokinetics 29 were used to determine the maximal concentration (Cmax), Time to maximum concentration (Tmax), and half-life (T1/2). Since we noted that there is a delayed serum NF-L and pNF-H peak between about 20-30 days (see the “Results” section), we selected an analytic subcohort (UPITT) with biomarker levels available for at least one acute time-point (D0-6), at least one subacute to chronic level (D15+), and with a minimum of three data points per subject. For this analysis, the BCM cohort did not have the available data points. For both NF-L and pNF-H, 84 UPITT subjects fulfilled these criteria and were included in these analyses.
Group-based trajectory analysis
Group-based trajectory analysis (SAS, Proc TRAJ) was also used to identify subgroups of individuals with similar longitudinal biomarker profiles. Iterative modeling was performed to identify optimal models with the lowest Bayesian Information Criteria (BIC) values, posterior probabilities of group membership >80%, and significant p values for the models using CNORM distribution. 30 We created trajectory models for log-transformed values of each biomarker in three time periods (acute (Daily): D0-6, subacute (Weekly): W1-6 (D0-41), and chronic (Monthly): 1-6 months) in the UPITT cohort. Trajectory groups were used as categorical variables and compared with outcome. When TRAJ analysis was applied to D0-6 (acute), W1-6 (subacute), and M1-6 (chronic) serum NF-L and pNF-H data, each model best grouped individuals into two trajectory groups, with significant polynomial order fits to the data, ranging from linear to cubic polynomials (p < 0.05 for all TRAJ group classifications). The posterior probabilities for groups in all models were sufficiently high, ranging from 0.83-0.99, indicating strong adherence of individuals to the 2-group memberships assigned in each model.
Statistical analysis
Descriptive statistics were used to identify means (± standard deviation [SD]), or medians (interquartile range [IQR]) if data were non-normally distributed. Individuals with multiple values in a time period had their values within that period averaged before analyses were performed. Statistical tests were performed using GraphPad Prism 9.1.1 or Stata SE 16.1. Biomarker data were analyzed using nonparametric tests. CSF NF-L and pNF-H acute time course data were analyzed using maximum likelihood estimation mixed effects linear regression models with subject-level random intercept and slope to test the effect of time on each biomarker level in separate models. Biomarker associations with outcomes were assessed using Mann-Whitney tests (for GOS-E), Kruskal-Wallis tests with post hoc Dunn's multiple comparisons tests (for DRS), and logistic univariate regression with receiver operator curve (ROC) analysis (for both GOS-E and DRS). Multi-variable logistic regression models were generated to model favorable GOS-E (5-8) and unfavorable GOS-E (< 5) outcomes using NF-L or pNF-H levels, controlling for common clinical and demographic factors (age, sex, GCS). 31 Similarly, ordinal logistic regression models were used to model trichotomized DRS scores consistent with bivariate analyses. Proportional odds assumptions were tested and met for all ordinal logistic regressions. All tests were two-tailed and considered significant with p values <0.05.
Results
Clinical characteristics/description of cohorts
Table 1 shows the study subject characteristics of both cohorts. In the UPITT cohort, we cumulatively measured 1049 serum samples (271 subjects) for NF-L, 1,107 serum samples (274 subjects) for pNF-H (differences due to sample availability), and 202 CSF samples for NF-L (93 subjects) and pNF-H (91 subjects). In the BCM cohort, we measured serum NF-L and pNF-H in 730 samples (99 subjects) and 739 samples (97 subjects), respectively, and CSF NF-L and pNF-H in 237 samples (51 subjects) and 252 samples (53 subjects), respectively (Fig. 1). All serum and CSF samples come from overlapping patients.
Subject Demographic and Clinical Characteristics
UPITT, University of Pittsburgh; BCM, Baylor College of Medicine; IQR, interquartile range; BMI, body mass index; GCS, Glasgow Coma Scale.
CSF NF-L and pNF-H levels and global outcome associations
CSF NF-L and pNF-H levels were measured for 5 days post-injury in the UPITT cohort and for 10 days post-injury in the BCM cohort (Fig. 2). In both cohorts, CSF NF-L and pNF-H levels were elevated each day post-injury compared with controls (p < 0.01, all comparisons). Further, there was an upward trend of NF-L and pNF-H levels over the first 10 days observed by visual inspection only in the BCM cohort (Fig. 2A, 2B). Mixed model linear regression also revealed significant linear increase of CSF NF-L (p = 0.001), but not pNF-H (p = 0.09), in this cohort over the first 10 days. We compared serum and CSF NF-L and pNF-H levels between treatment groups in the BCM cohort to verify similarity for aggregated analyses. Median serum and CSF biomarker levels were similar between hemoglobin transfusion threshold groups (7 g/dL vs. 10 g/dL) and between erythropoietin vs. placebo treatment groups (Supplementary Fig. S1), with the exception that CSF NF-L was lower in the erythropoietin group compared with placebo (3,074 pg/mL [IQR 1586-5,142] vs. 10,435 pg/mL [IQR 5,617-18,093]; p = 0.0009 by Mann-Whitney test).

Temporal profile levels of cerebrospinal fluid (CSF) neurofilament-light chain (NF-L) and phosphorylated neurofilament-heavy chain (pNF-H) levels and their correlation to outcome. (Left) University of Pittsburgh (UPITT) cohort, (Right) Baylor College of Medicine (BCM) cohort. Data are shown as box-and-whiskers plot of median, interquartile range, and range. Data points are shown as red (NF-L;
We next analyzed CSF NF-L and pNF-H associations with GOS-E and DRS (Fig. 2C-2J). UPITT cohort CSF NF-L levels were significantly higher in the unfavorable GOS-E (1-4) versus favorable GOS-E (5-8) groups at both 6 and 12 months, as well as in DRS categories (0-3 vs. 15-30), at 12 months (p < 0.05, all comparisons). UPITT CSF pNF-H levels did not statistically differ by either outcome. Similar CSF trends for CSF NF-L and pNF-H correlation with 6-month GOS-E and DRS were observed in the smaller BCM cohort, but none achieved statistical significance.
Although erythropoietin treatment was found to not influence outcome, 20 we performed multi-variable logistic regression models of GOS-E and DRS using CSF NF-L and controlling for erythropoietin treatment group to ensure there was no confounding relationship; neither CSF NF-L nor treatment group were significantly associated with GOS-E or DRS (data not shown).
Serum NF-L and pNF-H time course
The UPITT cohort provides a longitudinal time window from D0 to 12M post-injury. We considered serum levels of NF-L and pNF-H in three intervals: D0-6 (acute), Weeks [W]2-6 (subacute), and M2-6 and M12 (chronic). Median levels of both NF-L and pNF-H peaked during the subacute interval at Week 3 (Fig. 3A, 3B). In the chronic interval, NF-L and pNF-H gradually decreased, but the median NF-L and pNF-H values over the time course remained above healthy control levels (p < 0.0001, all comparisons).

Longitudinal serum levels of neurofilament-light chain (NF-L) and phosphorylated neurofilament-heavy chain (pNF-H). University of Pittsburgh (UPITT) cohort data are shown as box-and-whiskers plot of median, interquartile range, and range.
To study serum biokinetic profiles, we employed kinetic modeling previously reported for other biomarkers (e.g., UCH-L1). 32 We selected subsets of subjects with ≥3 serial samples (n = 84 for both NF-L and pNF-H) that spanned the time course. Figure 3C and 3D show spaghetti plots of individual subject's NF-L and pNF-H temporal profiles, demonstrating a peak by 20-30 days post-injury. Serum NF-L level achieves time to maximum (Tmax) at 30.5 days, with a maximum concentration (Cmax) of 1,107 pg/mL and half-life from Cmax (T1/2) at 68.7 days (Fig. 3E). Serum pNF-H Tmax occurred at 21.5 days, with a Cmax of 2,070 pg/mL and T1/2 at 92.1 days (Fig. 3F).
Relationships between NF-L and pNF-H
We assessed correlations between NF-L and pNF-H levels, compartments (CSF vs. serum), and time periods (acute vs. chronic; Supplementary Fig. S2 and S3). Acute CSF NF-L and pNF-H levels were strongly correlated with Spearman correlation coefficients of r = 0.69 (p < 0.0001) and r = 0.67 (p < 0.0001) in UPITT and BCM cohorts, respectively (Supplementary Fig. S2A, S2D). Acute serum levels (D0-6 mean) of NF-L and pNF-H were also correlated with each other in both cohorts (with identical r = 0.48, p < 0.0001; Supplementary Fig. S2B, S2E). Finally, chronic NF-L and pNF-H levels (M2-6 mean; UPITT) were significantly correlated (r = 0.44, p < 0.0001; Supplementary Fig. S2C).
Between-compartment correlation (CSF vs. serum) assessments show that BCM cohort CSF and serum NF-L (D0-6 mean) were modestly correlated with each other (r = 0.37, p = 0.01) but this association within the UPITT cohort was not significant (Supplementary Fig. S3A, S3C). Similarly, BCM CSF and serum pNF-H (D0-6 mean) were correlated (r = 0.50, p = 0.0003), but there was no UPITT cohort association (Supplementary Fig. S3B, S3D).
Serum NF-L and pNF-H correlations with covariates and mortality
In the UPITT cohort, higher age was associated with lower injury severity, as measured by both GCS and Injury Severity Score (ISS), but higher age was associated with increased mortality by D7 (Supplementary Table S2). Age positively correlated with serum NF-L levels at D0 (r = 0.22, p = 0.04) but negatively correlated with serum NF-L levels at D15-44 (r = -0.28, p = 0.01) and M2-6 (r = -0.22, p = 0.01). D0 and M2-6 pNF-H serum levels also positively correlated with age (r = 0.22-0.27; p < 0.05 all comparisons; Supplementary Table S2). D0-6, D15-44, and M2-6 mean NF-L serum levels positively correlated with initial GCS (r = 0.16-0.32, p at least <0.02; Supplementary Table S2). No GCS correlations with pNF-H levels were found. Global injury ISS score correlated with mean D0-6, D15-44, and M2-6 serum NF-L levels (r = 0.17-0.36, p < 0.03), as well as D0-6 mean serum pNF-H levels (r = 0.17, p = 0.01; Supplementary Table S2).
Also, in the UPITT cohort, CSF D0-6 mean NF-L levels were higher among subjects who died within 7 days (4127.4 pg/mL; IQR 3649.1-5559.9) versus survivors (1176.7 pg/mL; IQR 446.3-2850.6; p = 0.01). Serum NF-L levels for non-survivors were higher at D0 (157.6 pg/mL; IQR 105.5-419.7) and D0-6 (321.7 pg/mL; IQR 139.3-824.6) than their respective survivor counterparts at D0 (77.8 pg/mL; IQR 45.3-165.6; p = 0.01) and D0-6 (128.8 pg/mL; IQR 77.9-224.7, p = 0.0004). D0 serum pNF-H levels were also associated with mortality, with non-survivors having higher levels (157.2 pg/mL; IQR 78.8-329.9) versus survivors (42.5 pg/mL; IQR 27.0-115.5; p = 0.003; Supplementary Table S2).
In the BCM cohort, age was also negatively correlated with ISS (r = -0.19, p = 0.049), but was not associated with initial GCS (Supplementary Table S2). Both D0 and D0-6 mean serum NF-L levels were significantly associated with GCS (p < 0.05, both comparisons). D0 serum pNF-H levels were associated with age (r = 0.25, p = 0.02; Supplementary Table S2). D0 serum NF-L levels were higher among non-survivors (median 298.6 pg/mL; IQR 55.3-308.8) as compared with survivors (41.9 pg/mL; IQR 28.4-96.6; p = 0.03). Similarly, D0 serum pNF-H levels were higher among non-survivors (1678.3 pg/mL; IQR 385.8-2970.9) compared with survivors (45.6 pg/mL; 15.3-135.2; p = 0.03), whereas D0-6 mean NF-L and pNF-H serum levels were not associated with mortality (Supplementary Table S2).
ROC curve analysis (nonparametric, unadjusted) was performed using D0 serum NF-L to predict 7-day mortality, which demonstrated an area under the curve (AUC) of 0.75 (95% CI, 0.60-0.90) in the UPITT cohort, and AUC of 0.87 (95% CI, 0.62-1.00) in the BCM cohort. However, there was not a reliable high-specificity cutoff value identified for clinical utility (Supplementary Fig. S4).
Higher serum NF-L and pNF-H levels are associated with worse global outcomes
Acute (D0-6 mean) serum NF-L levels, but not pNF-H, were higher among individuals with unfavorable GOS-E scores (1-4) compared with those with favorable GOS-E scores (5-8) at both 6 and 12 months in the UPITT cohort (p < 0.05, Mann-Whitney tests; Fig. 4A, 4B). The BCM cohort confirmed acute higher serum NF-L levels were significantly associated with unfavorable GOS-E (p < 0.01; Fig. 4C). While serum pNF-H showed a similar magnitude of increase with unfavorable compared with favorable GOS-E, differences did not reach significance in either cohort (Fig. 4D).
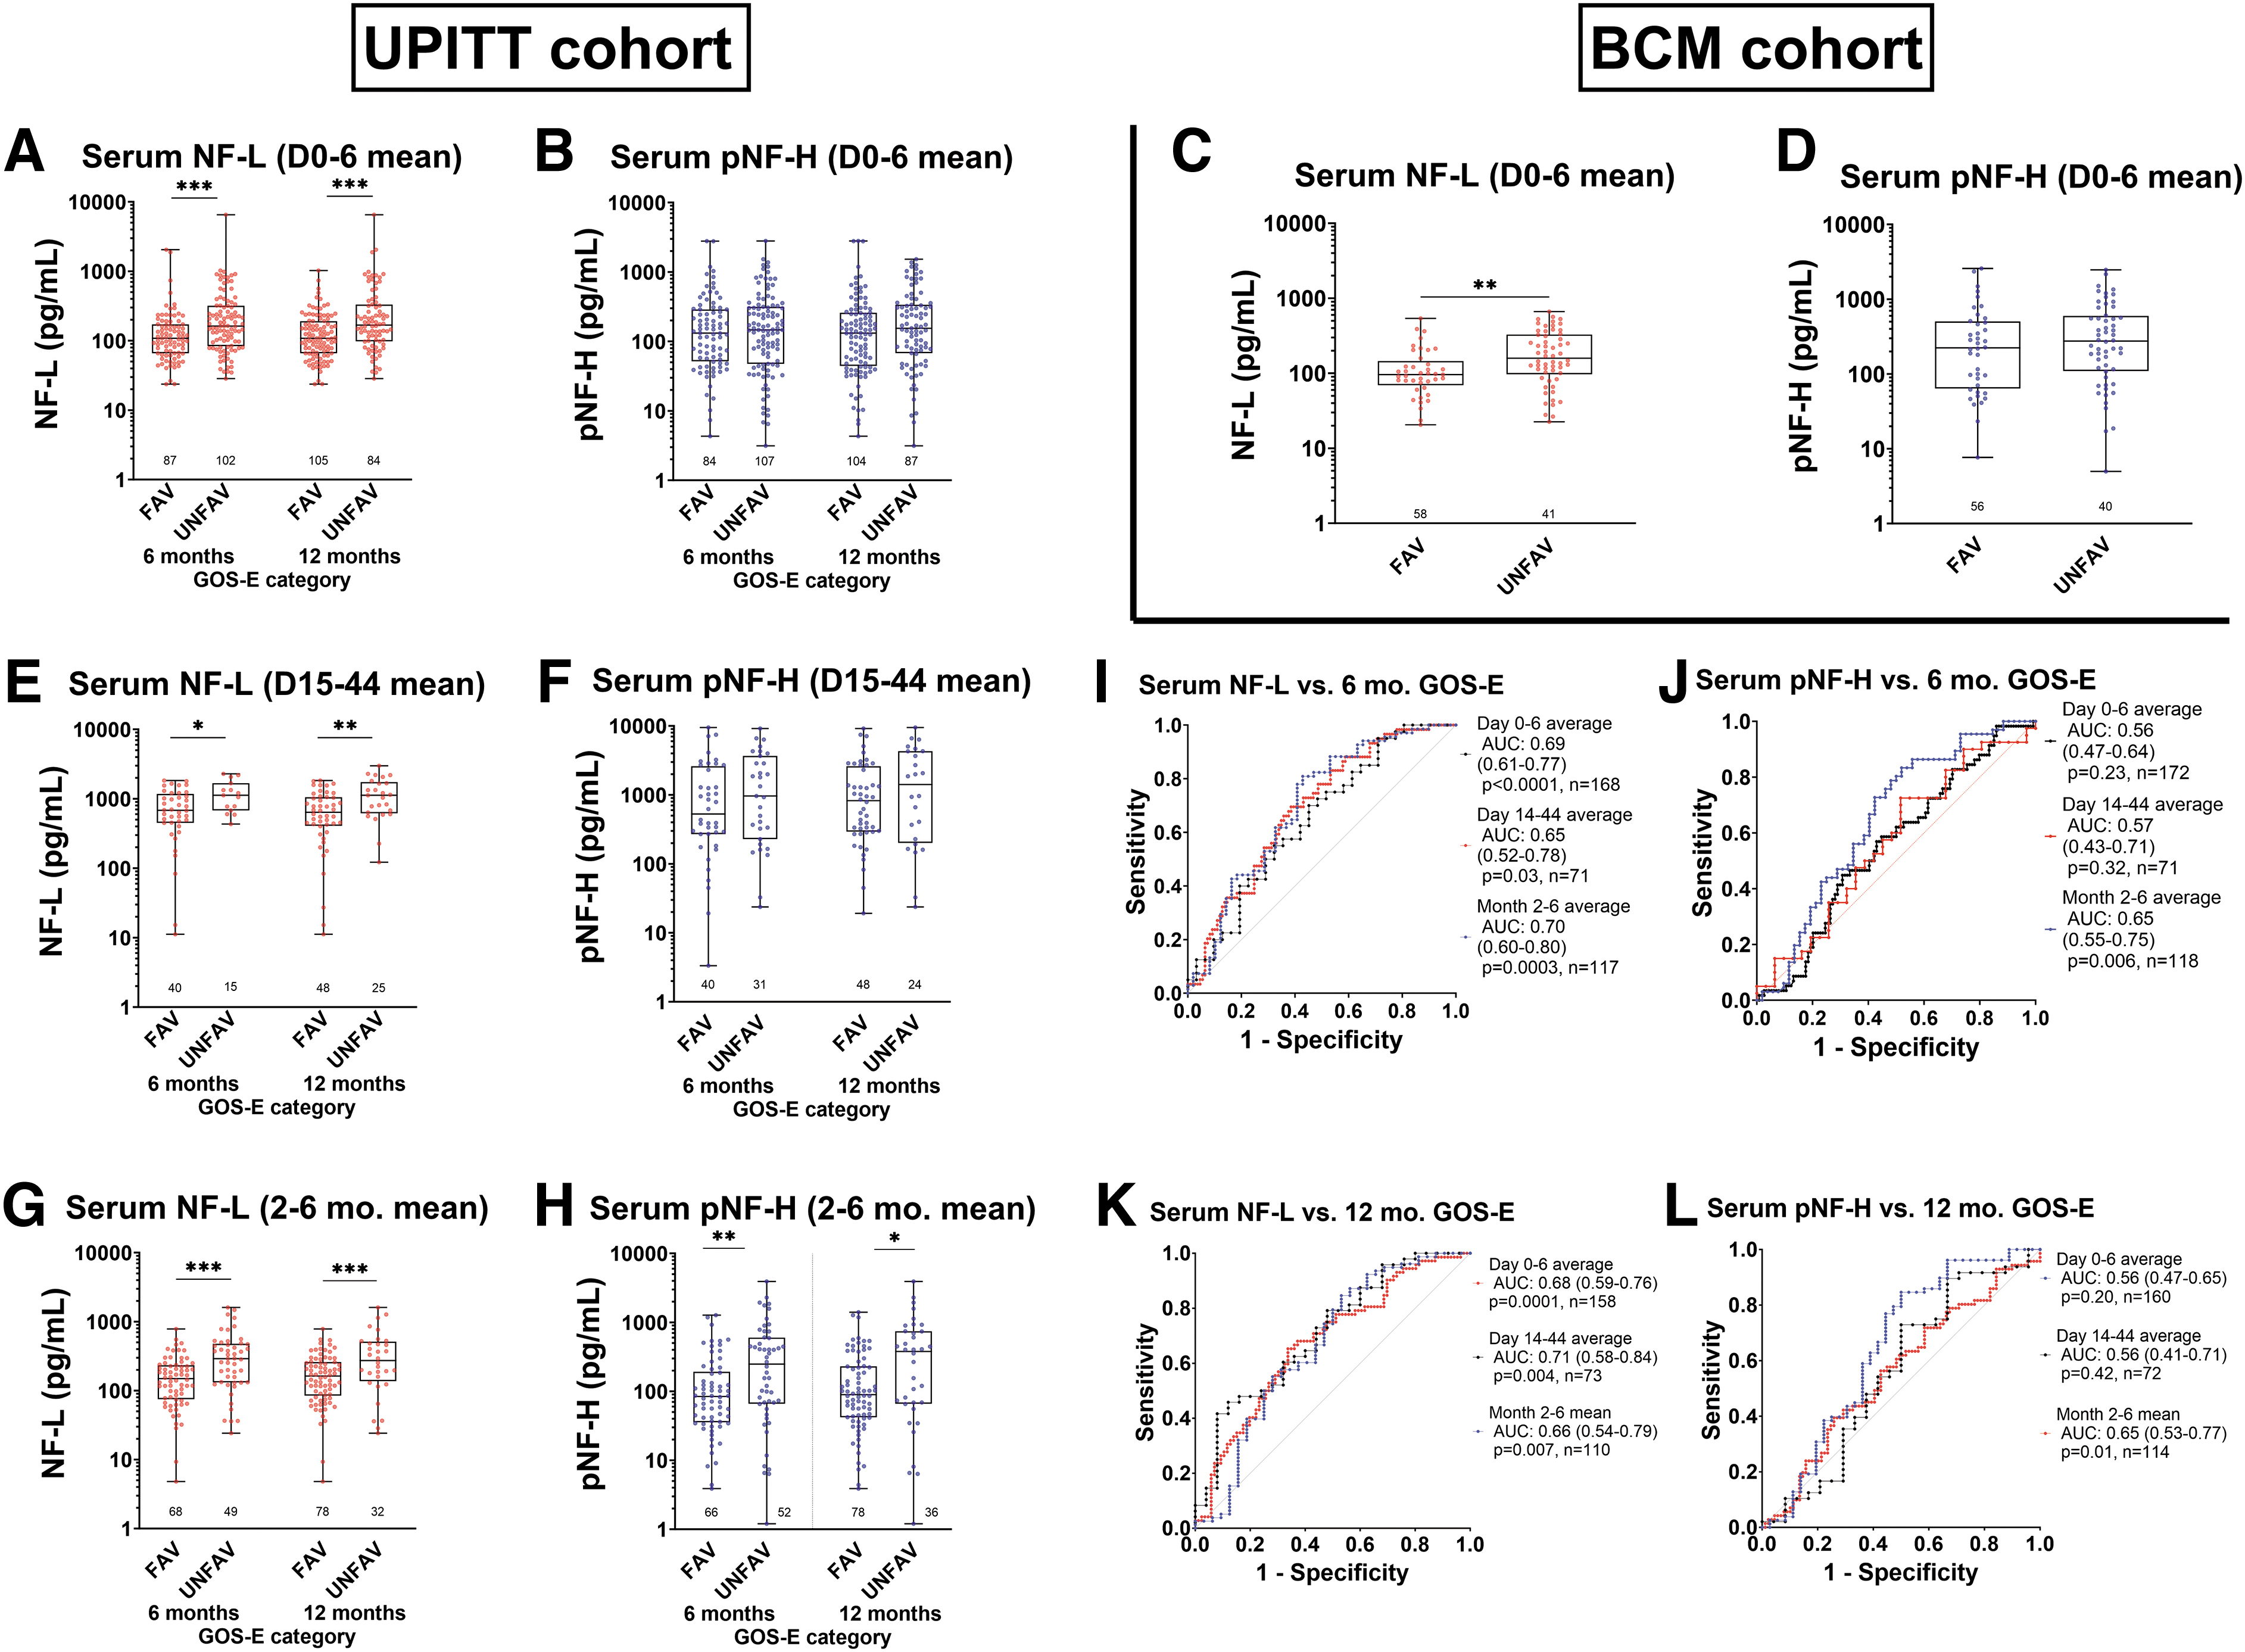
Glasgow Outcome Scale-Extended (GOS-E) outcome association with serum neurofilament protein levels in traumatic brain injury subjects. Unfavorable: GOS-E 1-4; favorable: GOS-E 5-8. Data are shown as box-and-whiskers plots of median, interquartile range, and range. GOS-E was recorded at 6 months and 12 months in University of Pittsburgh (UPITT) cohort, and 6 months only in Baylor College of Medicine (BCM) cohort. (
In the UPITT cohort, subacute (W2-6 mean) higher serum NF-L was associated with unfavorable outcome at both 6 and 12 months (p < 0.05, Mann-Whitney tests; Fig. 4E). Again, serum pNF-H levels also appear higher in the GOS-E 1-4 group than the GOS-E 5-8 group at 6 and 12 months but did not reach statistical significance (Fig. 4F).
Also, in the UPITT cohort, higher chronic (M2-6) mean serum NF-L and pNF-H levels were associated with unfavorable GOS-E at both 6 and 12 months (p < 0.05, Mann-Whitney tests; Fig. 4 G, 4H). Univariate logistic regression ROC analysis with NF-L levels at all three time intervals (acute, subacute, and chronic) showed a significant AUC of 0.65-0.70 and 0.66-0.71 for modeling 6- and 12-month GOS-E, respectively, (Fig. 4I, 4K), while M2-6 pNF-H had an AUC of 0.65 for both 6- and 12-month GOS-E (Fig. 4J, 4L; all p values <0.05 by likelihood ratio tests).
We also examined relationships between acute, subacute, and chronic neurofilament protein levels and disability by DRS category (Fig. 5). In the UPITT cohort, mean D0-6 NF-L serum levels distinguished between all three DRS categories at 6 and 12 months (Fig. 5A). D0-6 pNF-H discriminated between DRS 0-3 and 15-30 at 6 months (Fig. 5B). In the BCM cohort, D0-6 NF-L serum levels also distinguished between all three DRS categories at 6 months. (Fig. 5C; all p values <0.05, Kruskal-Wallis tests).
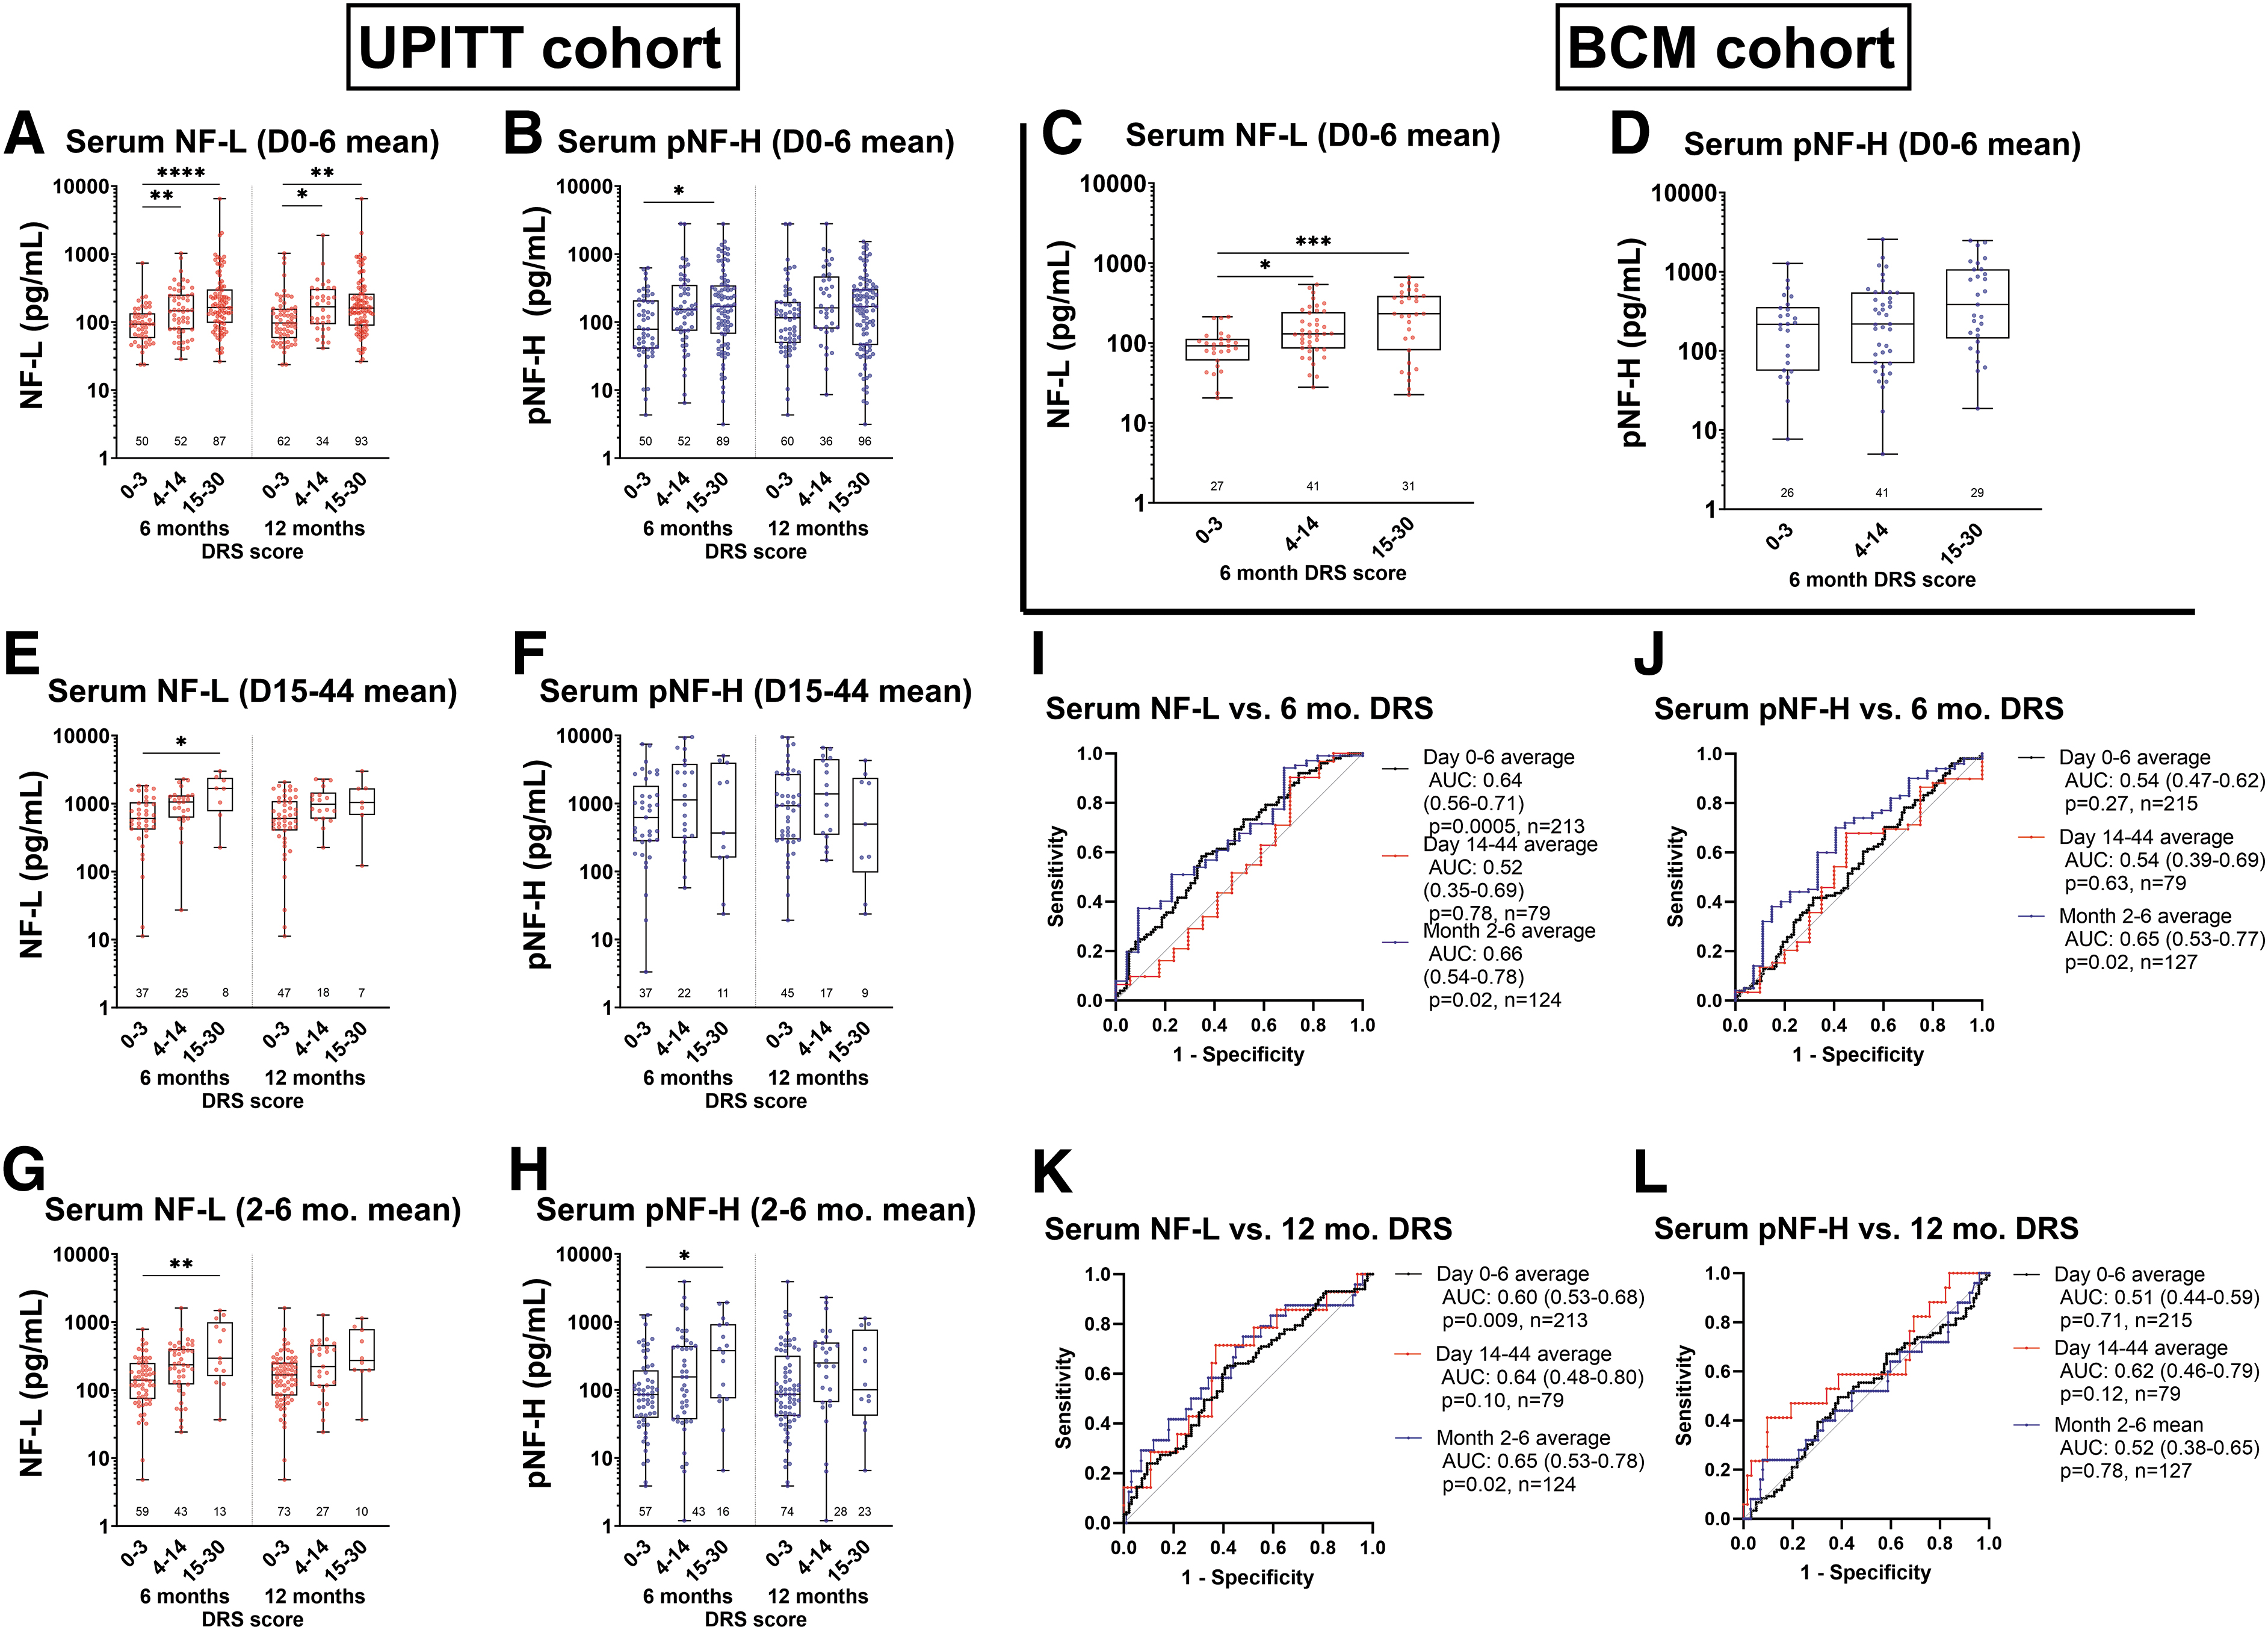
Disability Rating Scale (DRS) category association with serum neurofilament protein levels in TBI subjects. Trichotomized DRS category analysis (DRS 0-3, DRS 4-14, DRS 15-30) is shown. Data are shown as box-and-whiskers plots of median, interquartile range, and range. DRS was recorded at 6 and 12 months (University of Pittsburgh [UPITT] cohort), and 6 months only in Baylor College of Medicine (BCM) cohort. (
Subacute D15-44 NF-L mean serum levels in the UPITT cohort distinguished between DRS 0-3 and DRS 15-30 (Fig. 5E). Both NF-L and pNF-H chronic (M2-6) mean serum levels distinguished between DRS 0-3 versus 15-30 (Fig. 5I, J). Logistic univariate regression ROC analysis showed a modest, but significant, association between 6-month disability (DRS 0-3 vs. DRS 15-30) and both acute and chronic NF-L and pNF-H levels, respectively, with AUC of 0.64-0.66 (p < 0.05, likelihood ratio tests; Fig. 5G). Similarly, 12-month DRS 0-3 versus 15-30 was modestly associated with higher acute and chronic NF-L levels (AUC 0.60-0.65, p < 0.05, Fig. 5K).
Multi-variable logistic regression of outcomes
In multi-variable logistic regression models (UPITT cohort) controlling for age, sex, and injury severity (GCS), lower levels of mean acute (D0-6) serum NF-L were significantly associated with favorable 6- and 12-month GOS-E (p = 0.004 both comparisons; Table 2). Similarly, lower subacute (W2-6) serum NF-L levels was significantly associated with favorable 12-month GOS-E (p = 0.049), while mean chronic (M2-6) serum NF-L were significantly associated with favorable 6- and 12-month GOS-E (both comparisons p = 0.012).
Univariate Logistic Regressions of Trajectory (TRAJ) Groups Modeling Favorable Outcome (GOS-E) and Disability Rating Scale (DRS) Score in UPITT Cohort
Bolded p values are < 0.05.
(A) Odds ratios (OR) represent odds of favorable GOS-E (5-8) in the high trajectory group vs. the low trajectory group for each separate TRAJ model.
(B) OR represent odds of favorable DRS score (DRS 0-14) in the high trajectory group vs. the low trajectory group for each separate TRAJ model.
All cases of unfavorable 12-month DRS score are in the high NF-L TRAJ group; thus, OR not calculable.
GOS-E, Glasgow Outcome Scale-Extended; UPITT, University of Pittsburgh; CI, confidence interval; NF-L, neurofilament-light chain; pNF-H, phosphorylated neurofilament-heavy chain.
Repeating these analyses with pNF-H, less robust associations to GOS-E were observed (Table 3). While acute D0-6 pNF-H levels were not associated with GOS-E (consistent with unadjusted data), higher mean subacute pNF-H levels were significantly associated with worse GOS-E at 6 months (p = 0.041), and higher mean chronic serum pNF-H were significantly associated with worse 6- and 12-month GOS-E (p = 0.043 and p = 0.01, respectively), suggesting observed unadjusted relationships are the result of injury.
Multi-Variable Logistic Regression Model of GOS-E With Respect to Average D0-6, W2-6, and M2-6 NF-L levels (UPITT Cohort)
Bolded p values are < 0.05.
GOS-E, Glasgow Outcome Scale-Extended; D, Day; W, Week; M, Month; NF-L, neurofilament-light chain; OR, odds ratio; Std., standard; CI, confidence interval
Multi-variable Ordinal Logistic Regression Model of DRS With Respect to Average D0-6, W2-6, and M2-6 NF-L levels (UPITT Cohort)
Bolded p values are < 0.05.
DRS, Disability Rating Scale; D, Day; W, Week; M, Month; NF-L, neurofilament-light chain; UPITT, University of Pittsburgh; OR, odds ratio; Std., standard; CI, confidence interval.
In adjusted ordinal logistic regression models of DRS controlling for age, sex, and GCS (UPITT cohort), lower mean levels of acute, subacute, and chronic serum NF-L were associated with lower DRS score (i.e., less disability) at 6 months, while acute, and chronic serum NF-L were also associated with lower DRS score (p values shown in Table 3B). However, acute, subacute, and chronic pNF-H levels were not associated with DRS score at either time-point (Table 4B).
Multi-Variable Logistic Regression Model of GOS-E With Respect to Mean day 0-6, Week 2-6, and Month 2-6 pNF-H Levels (UPITT Cohort)
Bolded p values are < 0.05.
GOS-E, Glasgow Outcome Scale-Extended; pNF-H, phosphorylated neurofilament-heavy chain; UPITT, University of Pittsburgh; D, Day; W, Week; M, Month; NF-L, neurofilament-light chain; OR, odds ratio; Std., standard; CI, confidence interval.
Multi-Variable Ordinal Regression Model of DRS with Respect to Mean Day 0-6, Week 2-6, and Month 2-6 pNF-H Levels (UPITT Cohort)
Bolded p values are < 0.05.
DRS; D, Day; W, Week; M, Month; PNF-H, phosphorylated neurofilament-heavy chain; UPITT, University of Pittsburgh; OR, odds ratio; Std., standard; CI, confidence interval.
Group-based trajectory (TRAJ) analysis of serum NF-L and pNF-H levels
TRAJ analysis was applied to D0-6 (acute), W1-6 (D0-42) (subacute), and M1-6 (chronic) serum NF-L and pNF-H data from the UPITT cohort. In each case, we identified two classes (high and low) best fitted the NF-L and pNF-H data. (Fig. 6 shows the acute, subacute, and chronic NF-L and pNF-H mean (± SD) group levels plotted against the high and low TRAJ for both analytes and for each time interval.
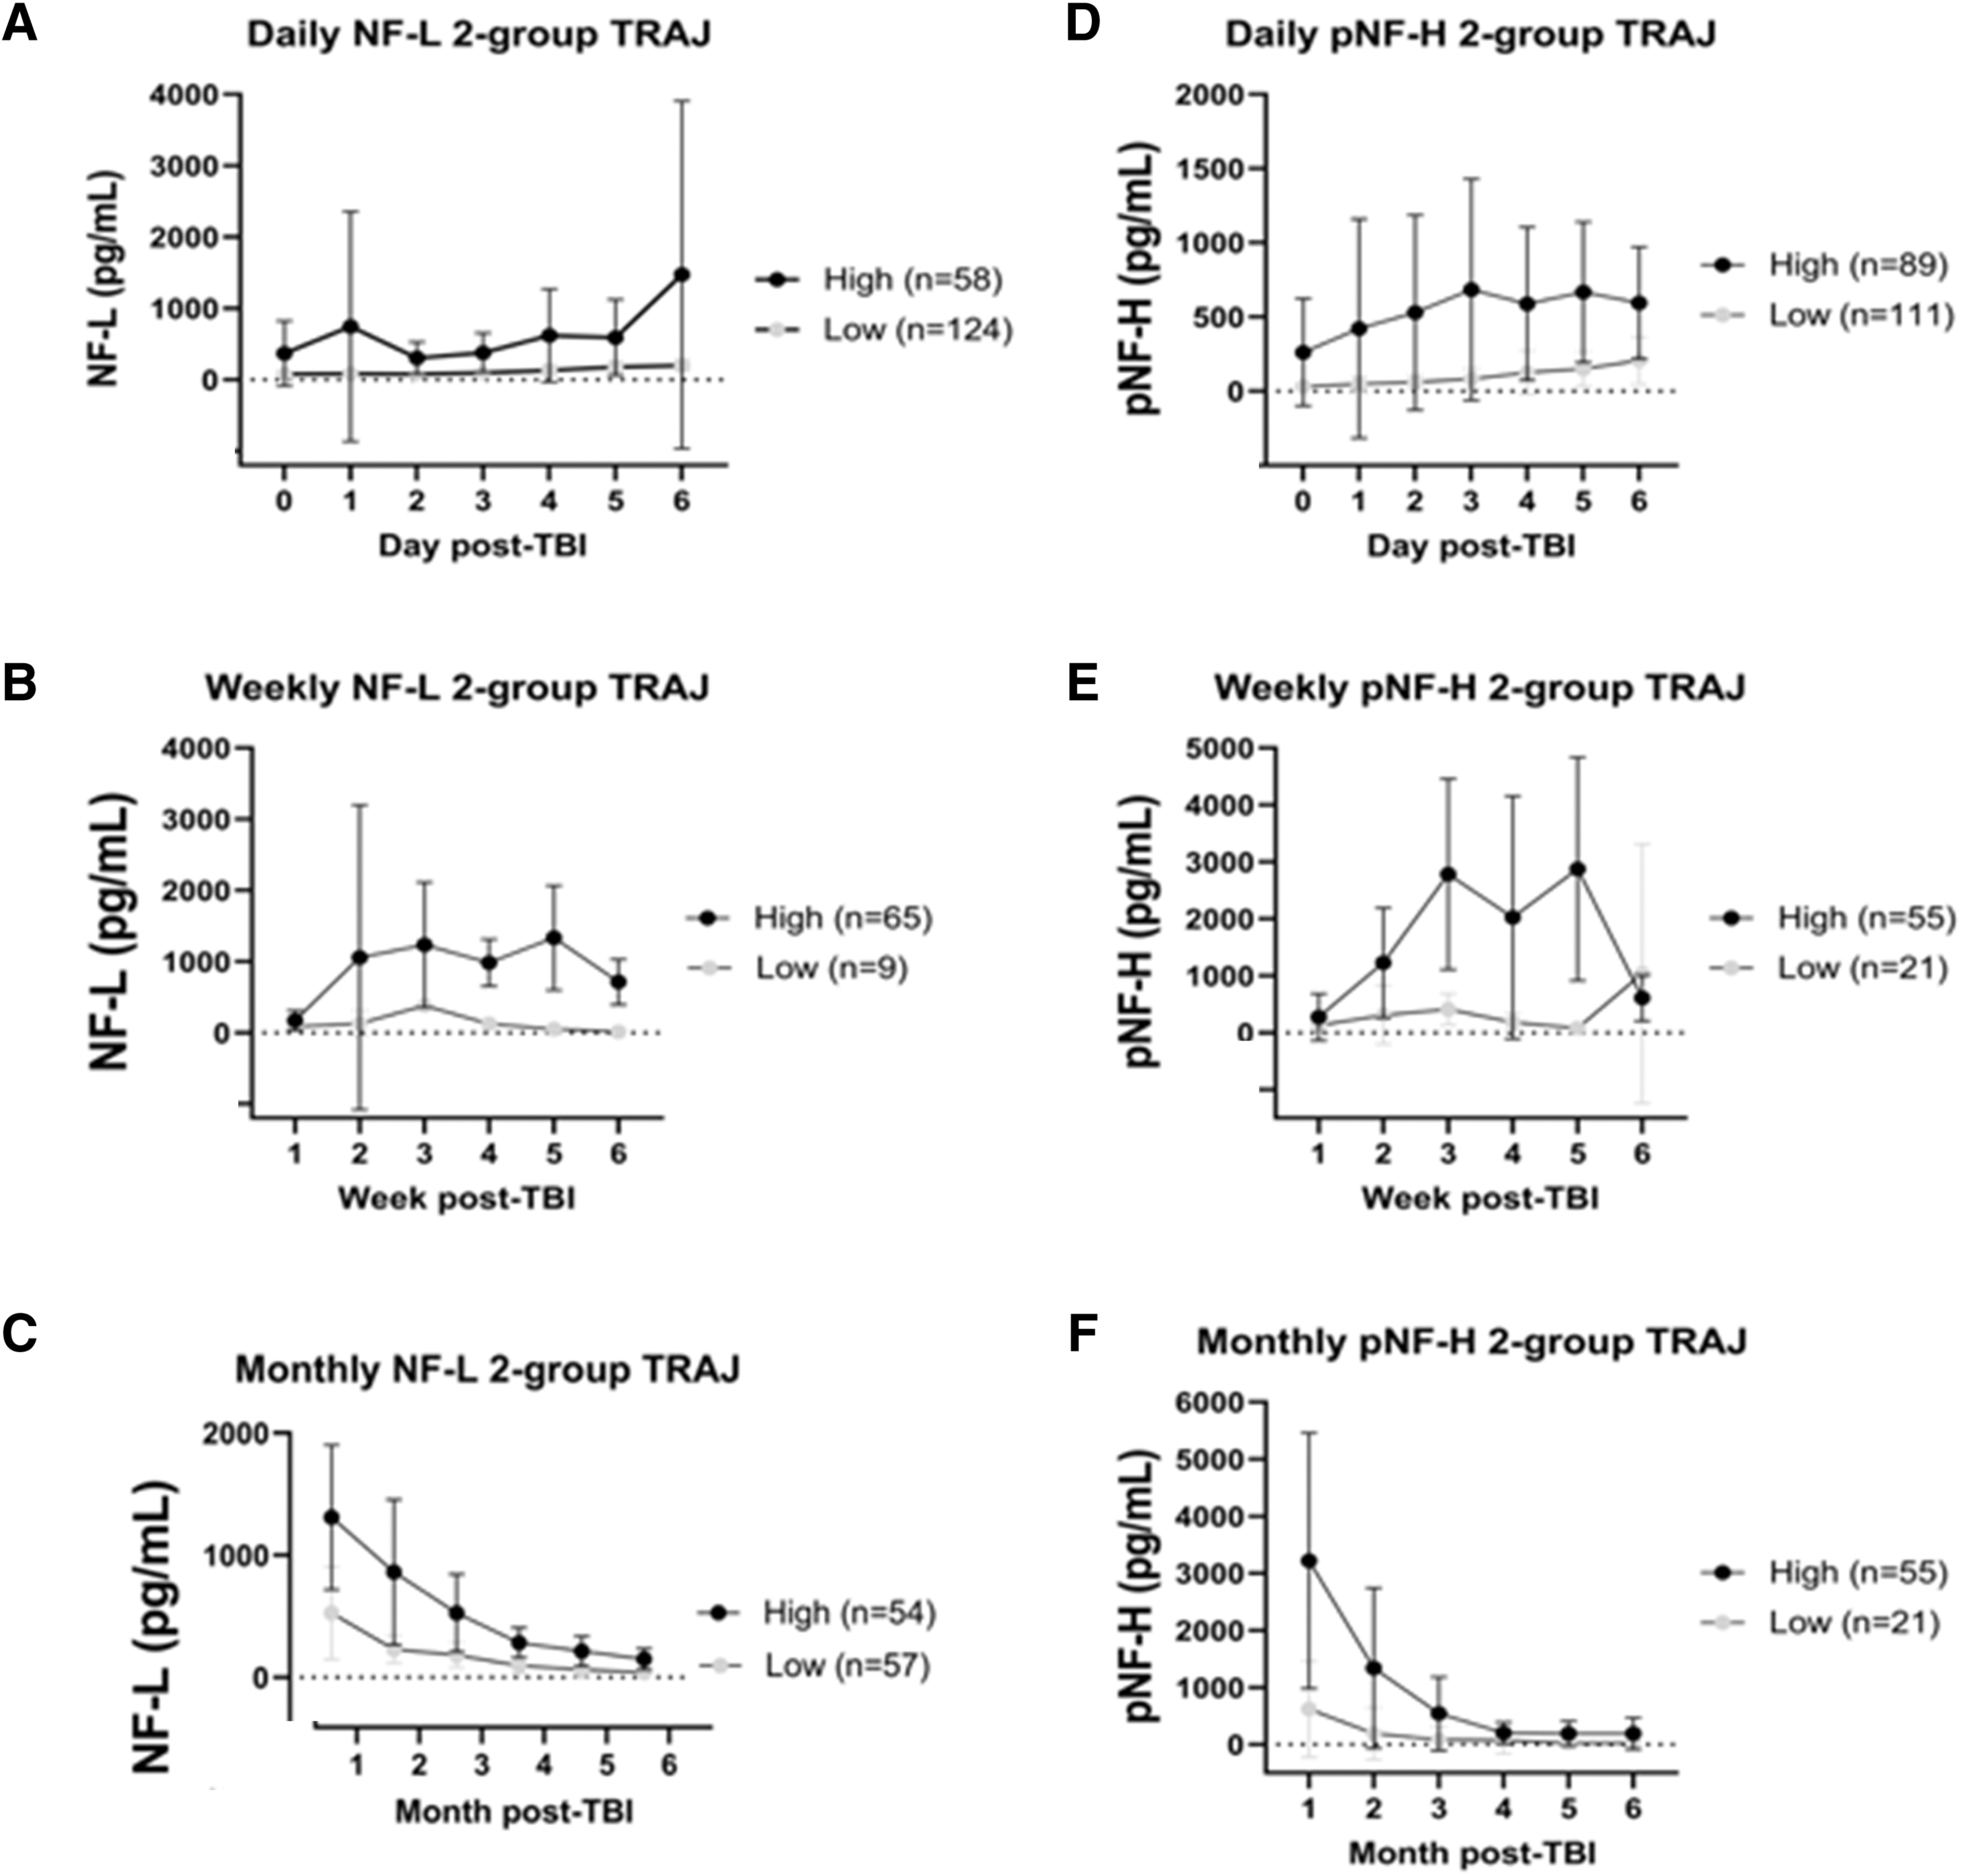
Trajectory analysis of serum neurofilament-light chain (NF-L) and phosphorylated neurofilament-heavy chain (pNF-H) levels based on three time intervals. Our data were shown to be best fitted for 2-group TRAJ for both biomarkers (see body). For 2-group trajectory analysis (TRAJ), daily biomarker groupings cover 0-6 days, weekly biomarker groupings cover 1-6 weeks, and monthly biomarker groupings cover 1-6 months. High and Low TRAJ classes in each case are as indicated (class size as n). For two group selection criteria, see main body.
TRAJ group associations with subsequent NF-L and pNF-H levels
Next, we examined the full post-injury time course of serum NF-L and pNF-H levels when graphed against acute, subacute, and chronic trajectory groups established above. For NF-L (Fig. 7A-7C), the acute high TRAJ group did not show higher subacute or chronic levels (Mann-Whitney tests). Using frequency table analysis, there was also no concordance between the high acute vs. subacute TRAJ group (p = 0.09, Fisher exact tests) or acute versus chronic TRAJ groups (p = 0.38). Similarly, subacute TRAJ groups were not concordant with chronic TRAJ groups (p = 0.28).

Daily, weekly, and monthly serum neurofilament-light chain (NF-L) and phosphorylated neurofilament-heavy chain (pNF-H) trajectory classes (TRAJ; from Fig. 6) plotted against extended post-injury time intervals. High and Low TRAJ classes in each case are as indicated (class size as n). TRAJ classes were developed using Days 0-6, Weeks 1-6, and Months 1-6 as in Figure 6. Data shown are subsequently plotted intervals of Days 0-6, Weeks 2-6, and Months 2-6 (to avoid plotting overlapping data in first week and month).
In parallel, for pNF-H, comparing high acute TRAJ groups showed higher subacute levels at 2, 5, and 6 months (p < 0.05, Mann-Whitney tests; Fig. 7D-7F). The high subacute TRAJ group also showed higher chronic pNF-H levels at months 2, 3, and 6 (p < 0.05). Consistent with these patterns, high acute and subacute TRAJ groups showed significant concordance with the high chronic TRAJ group, respectively (p = 0.002 and 0.001, Fisher exact tests).
High serum NF-L and pNF-H TRAJ groups are associated with unfavorable outcome
We next assessed whether different acute, subacute and/or chronic neurofilament protein TRAJ groups were associated with global patient outcomes with univariate logistic regression analysis. For NF-L, high acute (D0-6) TRAJ group had decreased odds of favorable GOS-E (5-8) at 6 and 12 months (odds ratio [OR] 0.24-0.38), as well as favorable DRS at 6 and 12 months (OR 0.40-0.47; Table 4). For pNF-H, high acute TRAJ group also had decreased odds of favorable DRS at 6 and 12 months (OR 0.40-0.44) but not GOS-E (Table 4).
On the other hand, high subacute NF-L or pNF-H TRAJ membership were not associated with favorable GOS-E or DRS (Table 4). Lastly, the high chronic TRAJ NF-L and pNF-H groups were again associated with decreased odds of favorable 6- and 12-month GOS-E (OR 0.25- 0.31; Table 4). When evaluating DRS outcome, both high chronic NF-L and pNF-H TRAJ group memberships decreased odds for favorable 6-month DRS (OR 0.17-0.033).
Discussion
In this two-cohort longitudinal study of NF-L and pNF-H levels after moderate-severe TBI, we observed that NF-L and pNF-H levels rise in CSF on D5 through D10 in the BCM cohort, while serum levels of NF-L and pNF-H rise acutely in both cohorts and peak between 20-30 days post-injury based on our kinetic modeling. While chronic NF-L and pNF-H serum levels decline from 1 month through 12 months in the UPITT cohort, they remain elevated when compared with healthy controls. This is the first study, to our knowledge, to bridge acute and chronic levels to track the peak and overall serum time course of these two neurofilament proteins, which is a critical step in furthering the utility of these biomarkers for longitudinal TBI assessment. We also provide novel data showing NF-L levels correlate with pNF-H levels in acute CSF, acute serum, and chronic serum after TBI. In addition, we show that serum and CSF NF-L levels are associated with 6- and 12-month global outcomes after TBI, including GOS-E and DRS, whereas pNF-H had less robust relationships to these global outcomes.
Understanding the longitudinal presentation of TBI biomarkers is critical to enhancing their translation into clinical use. Such knowledge can potentially be used to characterize disease progression or recovery management biomarkers. Few prior studies have investigated NF-L protein time course in-depth, and no previous studies have examined detailed temporal pNF-H profiles. Shahim et al. found that NF-L has slow rising levels over 1-3 months post-injury, which contrasts with the gradual decay of UCH-L1, GFAP, and tau levels observed post-injury. 13 However, this work lacked sampling between 30 to 90 days, so the exact peak for NF-L was not defined. Our UPITT cohort data adds more precision to the time course, with serial samples that span the acute, subacute, and chronic phases, allowing us to perform kinetic modeling on a subset to define the Tmax for NF-L as ∼30.5 days (Fig. 3) and the pNF-H Tmax to be 21.5 days. We suggest that since both NF-L and pNF-H temporally track closely with each other, these delayed peaking profiles are likely an authentic TBI-mediated phenomenon. We hypothesize that delayed NF-protein release might reflect delayed axonal degeneration. 33
We postulated that understanding the timing in which NF-L and pNF-H proteins peak is also important for monitoring therapeutic responses (e.g., pharmacodynamic biomarkers). pNF-H has been used, for example, in pre-clinical TBI rat models (CCI, FPI, penetrating ballistic brain injury) to monitor drug effects (e.g. nicotinamide, levetiracetam). 15 Another study monitored NF-L levels through D10 post-injury to assess valproate effects in a rat TBI model. 34 Karlsson and colleagues also identified rising NF-L levels in a micro pig TBI model that were blunted by cyclosporine treatment. 35
Monitoring NF-L and pNF-H levels across an expanded post-injury time may have additional clinical utilities, given our observations that acute NF-L and pNF-H were associated with injury severity and acute mortality within moderate-severe TBI (Supplementary Table S2). We found that D0-6 NF-L levels were robustly associated with later GOS-E and DRS outcomes, while acute pNF-H was only associated with 6-month DRS outcome. (Fig. 4 and 5). D15-44 NF-L levels were also associated with unfavorable GOS-E and DRS outcome, while chronic NF-L protein levels also had significant associations with GOS-E and DRS (Fig. 4 and 5). Regarding the prognostic value of acute NF-L and pNF-H levels in predicting 6-month unfavorable outcome (GOS-E), they have ROC AUC of 0.69 and 0.56, respectively (Fig. 4). While of note, these values appear weaker than those reported for Day 1 GFAP and UCHL-1 plasma levels in a broader severity range of TBI (GCI 3-12), which demonstrated an AUC range of 0.83-0.89. 36
Overall, serum NF-L appears to be a more reliable outcome indicator (GOS-E/DRS) than serum pNF-H. This finding may be related to the larger variability observed in pNF-H levels than in NF-L levels; however, our data on pNF-H biomarker performance metrics suggest that there may be greater natural variability with this biomarker, decreasing signal to noise potential. Subtle differences may exist between NF-L and pNF-H regarding their biological function and/or intracellular locations, which may in turn contribute to differences in prognostic performance. For example, NF-H and NF-L might show differential dynamics in neurofilament assembly/disassembly. 37 Also, NF-H, rather than NF-L, appears to selectively accumulate in the distal regions of growing axonal neurites in differentiated NB2a/d1 neurons and DRG neurons. 38 Lastly, a recent study showed that NF-L is more abundantly associated with post-synaptic dendritic spines than NF-H and NF-M. 39
Together, the new findings presented here showing parallel temporal profiles for both NF-L and pNF-H (peaking at about 20-30 days) after moderate-severe TBI strengthen the concept that they might reflect post-TBI delayed axonal degeneration in the injured brain. 33 NF-L and pNF-H could then be expected to positively correlate with the degree of neurodegeneration, atrophy, or encephalomalacia. Graham and colleagues indeed observed that peak NF-L serum level within 6 weeks of TBI was associated with 6-month gray and white matter atrophy on MRI at 6 months post-injury. 14 We do not have quantitative imaging data in the current study to test this hypothesis, but future work comparing neuroimaging markers with NF biomarkers could support this assertion.
There are limitations to this study. This study was based on archived serum samples from two established study cohorts. The cohorts differed in their subject characteristics and study design which prevented us from combining data into a single data set. Chiefly, the BCM cohort included only severe TBI, whereas the UPITT cohort included both moderate and severe TBI, potentially accounting for some observed differences in outcome correlation. Other clinical findings were discrepant between cohorts; for example, ISS was associated with biomarker levels in the UPITT cohort but not in the BCM cohort. This may reflect differences in brain injury burden, but may also indicate potential for non-neurologic injury to influence TBI recovery, given ISS is a global injury measure. Nevertheless, independent results on time course and biomarker-outcome relationships from these two cohorts improve the generalizability of findings, which was well demonstrated with the overall consistency of the serum NF-L findings across cohorts.
While the BCM cohort had significant correlation between CSF and serum biomarker levels, this finding was not replicated in the UPITT cohort (Supplementary Fig. S3). It is possible there would be better correlation at the time of peak levels in the serum (20-30 days per our data), but we do not have CSF available for analysis in these cohorts at these times. In addition to the aforementioned injury severity difference between cohorts, higher serum levels may suggest the injury has resulted in significant blood-brain barrier (BBB) permeability, and so elevated serum levels (that correlate with CSF) may be an indicator of worse BBB damage and underlying TBI severity. As outcome relationships are stronger with serum biomarkers compared with CSF, these findings suggest better prognostic performance with serum. This may also be a more useful and easier-to-obtain biofluid clinically.
We note that the Tmax for NF-L and pNF-H do not completely align with each other (31.5 vs. 21.5 days). These differences could be a function of true biological release variability between the two markers, or they could be due to limited sample sizes and data missingness resulting in imprecise assignment of Tmax. However, a strength of our study is that we complemented the biokinetic analysis with use of group-based trajectory analysis, which imputes missing data when characterizing clusters of individuals with unique temporal dynamics for each marker studied. Applying these trajectory groups to clinical populations will require validation studies that could incorporate predictive dynamic pattern recognition or machine learning modelling. Current TRAJ groupings are not available to apply clinically based on these data. Nonetheless, these TRAJ groupings reflect the importance of evaluating longitudinal patterns of biomarkers rather than single-point or peak levels for diagnostic or prognostic models, as well as patient clustering for potential TBI patient subtype identification. Consistent with this framework, Allam and colleagues described that health measurement-based patient trajectories can be analyzed with the aid of artificial intelligence. They proposed that distinct patient trajectory grouping in the “observation window” (early time interval) can help inform on the trajectory patterns or disease state in the “prediction window” (later time interval). 40
Taken the GOS-E and DRS data as a whole (Fig. 4 and 5; Table 4), acute and chronic serum NF-L and pNF-H appear to be strongly associated with outcome. Rather unexpectedly, subacute levels of both NF proteins (when both NF proteins peak) or their subacute trajectory groupings did not show significant associations with global outcome. Thus, these findings might suggest that the rising phase of NF proteins in blood as well as the decline phase are informative with respect to TBI patient management.
Future research is needed to identify NF-L and pNF-H relationships with other survivor-based outcome measures (e.g., cognition), and imaging measures of axonal injury, and to provide a focused assessment of clinical utility for TBI diagnosis and/or prognostication. In addition, currently it is not known if the residual serum NF-L and pNF-H levels stay above those of normative controls when extended to longer than 12 months. Lastly, it will be equally important to investigate blood NF-L and pNF-H temporal profiles in mild TBI populations (GCS 13-15).
Transparency, Rigor, and Reproducibility Summary
Serum and CSF samples were obtained from two cohorts (acute, subacute and chronic samples from UPITT (N = 279 subjects; cohort not formally pre-registered due to pre-dating registry standards) and acute samples from BCM cohort (pre-registered at clinicaltrials.gov: NCT00313716 (N = 103 subjects). BCM samples were collected between 2008-2013. UPITT CSF samples were obtained between 2004-2011 and serum samples were obtained between 2004-2016. An overall description of the samples procured from each site is provided as a CONSORT diagram (Fig. 1). The analysis plan was not formally registered.
UPITT cohort serum samples were centrifuged at 2500 rpm for 10 min (CSF for 5 min) at room temperature and supernatants for biomarker analyses aliquoted and stored at either -20° C (for short-term) or -80° C (for long-term) until batch analysis. BCM cohort blood and CSF samples were centrifuged for 15 min at 1500 × g. Serum was removed, aliquoted and stored at -80o C until analyzed. Healthy controls were sourced from the UPITT cohort and commercially (BioIVT). Serum control samples collection, processing and storage protocols followed the NINDS TBI common data element recommendations and essentially matched those for the TBI subjects.
Handling of all biofluid samples and fluid biomarker measurements were performed by team members blinded to participant characteristics (e.g., diagnosis, outcome, etc.). All sample transfers, handling, and storage procedures have been consistent over study periods. At UPITT, samples underwent an average of 2-4 freeze thaw cycles with no detrimental effects. Samples were assayed for NF-L and pNF-H using Quanterix SIMOA high sensitivity assays as stated in Methods. Coefficients of variance for assays are reported in the “Methods” section.
Demographic, clinical and outcome measures (Common Data Elements) are provided for each of the UPitt and BCM cohorts and sub-cohorts (Table 1). CT scans were within 6 h of the initial blood sample. UPITT GCS was used as an initial neurological injury assessment while BCM GCS scores represented the initial post-resuscitation GCS sum and motor component upon admission. The primary outcome assessments include the GOS-E and DRS at 6 months. (BCM/UPITT) and 12 months (UPITT) post-injury, which are established as standards in the field.
Given our study consisted of retrospective cohorts with fixed sample sizes, we performed statistical power calculations post-hoc using observed effect sizes and sample sizes for each comparison, assuming alpha of 0.05. Statistical power for detecting differences in GOS-E group comparisons (favorable vs. unfavorable) of mean CSF biomarker levels in the UPITT cohort was 0.62 (NF-L, 6 months), 0.53 (NF-L, 12 months), 0.34 (pNF-H, 6 months), and 0.31 (pNF-H, 12 months). In the BCM cohort CSF, power was 0.24 (NF-L, 6 months) and 0.05 (pNF-H, 6 months). Statistical power for GOS-E group comparisons of mean serum biomarker levels in the UPITT cohort was 0.48 (D0-6 NF-L, 6 months), 0.73 (D0-6 NF-L, 12 months), 0.06 (D0-6 pNF-H, 6 months), 0.08 (D0-6 pNF-H, 12 months), 0.63 (D15-44 NF-L, 6 months), 0.83 (D15-44 NF-L, 12 months), 0.16 (D15-44 pNF-H, 6 months), 0.26 (D15-44 pNF-H, 12 months), 0.96 (M2-6 NF-L, 6 months), 0.80 (M2-6 NF-L, 12 months), 0.86 (M2-6 pNF-H, 6 months), and 0.76 (M2-6 pNF-H, 12 months). In the BCM cohort serum, power was 0.89 (NF-L, 6 months) and 0.07 (pNF-H, 6 months). As expected with the smaller sample sizes in the BCM cohort, statistical power was generally lower than in the UPITT cohort power calculations.
De-identified clinical data are available in the Federal Interagency Traumatic Brain Injury Research (FITBIR). Biomarker data will be available in FITBIR in the future and are available by contacting the corresponding authors. No future use of these biofluid samples is possible because insufficient quantities remain. The authors agree to provide the full content of the manuscript on request by contacting the corresponding authors.
Footnotes
Authors' Contributions
KKWW: conceptualization, data curation, formal analysis, funding acquisition, investigation, methodology, project administration, resources, supervision, validation, visualization, writing—drafting, review, and editing. DJB: conceptualization, data curation, formal analysis, investigation, project administration, visualization, writing—drafting, review, and editing. LEM: data curation, formal analysis, project administration, software, methodology. FB: project administration, writing—review and editing. GC: data curation, investigation. HX: data curation, investigation. ZY: data curation, investigation, project administration. ET: conceptualization, methodology, investigation. JBW: conceptualization, funding acquisition, supervision, writing—review and editing. RR: conceptualization, funding acquisition, resources, project administration, supervision, writing—review and editing. CSR: conceptualization, funding acquisition, resources, supervision. AKW: conceptualization, funding acquisition, investigation, resources, project administration, supervision, writing—review and editing.
Funding Information
U.S. Department of Defense, Grant Numbers W81XWH19-2-0012 and W81XWH-071-0701; National Institutes of Health, Grant Number T32HL134615; National Institute on Disability, Independent Living, and Rehabilitation Research, Grant Number 90DP004; Centers for Disease Control and Prevention, Grant Number R49CCR23155. This work was supported by the Assistant Secretary of Defense for Health Affairs endorsed by the Department of Defense, through the Defense Medical Research and Development Program. Opinions, interpretations, conclusions and recommendations are those of the author and are not necessarily endorsed by the Department of Defense.
Author Disclosure Statement
KKW is shareholder of Gryphon Bio, Inc., a company interested in developing diagnostic and therapeutic products for CNS diseases.
For the other authors, no competing financial interests exist.
Supplementary Material
Supplementary Table S1
Supplementary Table S2
Supplementary Figure S1
Supplementary Figure S2
Supplementary Figure S3
Supplementary Figure S4
References
Supplementary Material
Please find the following supplemental material available below.
For Open Access articles published under a Creative Commons License, all supplemental material carries the same license as the article it is associated with.
For non-Open Access articles published, all supplemental material carries a non-exclusive license, and permission requests for re-use of supplemental material or any part of supplemental material shall be sent directly to the copyright owner as specified in the copyright notice associated with the article.
