




Abstract
Accurate early diagnosis of concussion is useful to prevent sequelae and improve neurocognitive outcomes. Early after head impact, concussion diagnosis may be doubtful in persons whose neurological, neuroradiological, and/or neurocognitive examinations are equivocal. Such individuals can benefit from novel accurate assessments that complement clinical diagnostics. We introduce a Bayesian machine learning classifier to identify concussion through cortico-cortical connectome mapping from magnetic resonance imaging in persons with quasi-normal cognition and without neuroradiological findings. Classifier features are generated from connectivity matrices specifying the mean fractional anisotropy of white matter connections linking brain structures. Each connection's saliency to classification was quantified by training individual classifier instantiations using a single feature type. The classifier was tested on a discovery sample of 92 healthy controls (HCs; 26 females, age μ ± σ: 39.8 ± 15.5 years) and 471 adult mTBI patients (158 females, age μ ± σ: 38.4 ± 5.9 years). Results were replicated in an independent validation sample of 256 HCs (149 females, age μ ± σ: 55.3 ± 12.1 years) and 126 patients with concussion (46 females, age μ ± σ: 39.0 ± 17.7 years). Classifier accuracy exceeds 99% in both samples, suggesting robust generalizability to new samples. Notably, 13 bilateral cortico-cortical connection pairs predict diagnostic status with accuracy exceeding 99% in both discovery and validation samples. Many such connection pairs are between prefrontal cortex structures, fronto-limbic and fronto-subcortical structures, and occipito-temporal structures in the ventral (“what”) visual stream. This and related connectivity form a highly salient network of brain connections that is particularly vulnerable to concussion. Because these connections are important in mediating cognitive control, memory, and attention, our findings explain the high frequency of cognitive disturbances after concussion. Our classifier was trained and validated on concussed participants with cognitive profiles very similar to those of HCs. This suggests that the classifier can complement current diagnostics by providing independent information in clinical contexts where patients have quasi-normal cognition but where concussion diagnosis stands to benefit from additional evidence.
Introduction
Traumatic brain injury (TBI) is a physical impact to the head associated with structural and functional disruptions to brain tissue. Patients with mild TBI (mTBI) may be at risk of both neurodegenerative conditions—such as Alzheimer's disease—and accelerated brain aging, as evidenced by these patients' larger differences between chronological and biological brain ages. 1 –4 The most current diagnostic criteria for mTBI require a non-penetrating force to the head resulting in one or more of the following: more than one clinical sign (e.g., loss of consciousness, post traumatic amnesia, altered mental state), more than two symptoms within 72 h (e.g., altered cognition, physical symptoms), as well as more than one clinical examination or laboratory findings (e.g., balance or cognitive impairment), or neuroimaging evidence of intracranial abnormalities, according to Silverberg and colleagues. 5
Diagnosis of mTBI, whether acute (less than 48 h after injury) and/or subacute (2 days to 2 weeks after injury), is important to prevent sequelae and improve neurocognitive outcomes. 6 However, mTBI is a heterogeneous condition that can be challenging to diagnose acutely when: 1) early clinical signs or acute symptoms (e.g., confusion, difficulty concentrating) are equivocal or insufficiently specific; and 2) there is delay in the onset of such symptoms. 7 Moderate-to-severe TBI is ruled out by the absence of focal lesions or injuries apparent on acute computed tomography (CT) or magnetic resonance imaging (MRI). 8 Concussion, a condition held by 93.8% of medical professionals to be synonymous with mTBI, 5 is sometimes considered to include all forms of mTBI, including repetitive head injury and complicated mTBI. 9 Here and throughout, concussion is used interchangeably with mTBI to refer to head injuries meeting standard criteria for mTBI according to Silverberg and colleagues, 5 in the absence of evidence for anatomic intracranial injury.
Conventional concussion diagnosis uses standardized clinical assessments. The Glasgow Coma Scale (GCS), classifying consciousness levels, is frequently used to diagnose TBI and designate its severity. The GCS holds diagnostic power for moderate-to-severe TBI 10 but is not sensitive to the symptoms and mental alterations, such as confusion, attention, and concentration problems, seen in concussion. 7 Cognitive tests assessing language, memory, and executive functioning can be used as evidence of concussion. 11 However, many neurocognitive batteries have low diagnostic power distinguishing concussed patients from neurologically healthy controls (HCs). 12,13 Variability in diagnosis also stems from potential subjectivity in the interpretation of clinical guidelines, 14 leading to ∼50%-90% of concussion cases going without formal diagnosis at hospital admission. 15
The standard MRI protocols for suspected brain injuries include T1- or T2-weighted anatomic scans, primarily providing radiologists with evidence of brain pathology to differentiate concussion from moderate-to-severe TBI. 16 However, the absence of identifiable lesions on T1- or T2-weighted MRIs does not rule out concussion. For example, traumatic axonal injury (TAI) is not always detectable by such scans. 17 In these and other cases, diffusion weighted imaging (DWI) can assess concussion's impact on structural connectivity. 3,17 –26 TAI-related white matter (WM) disruption mapped using DWI-estimated diffusion tensors can be a major contributing factor to poor cognitive outcome. 27
Tensors enable quantification of fractional anisotropy (FA), a surrogate measure of WM integrity defined as the directional coherence of water molecules in axonal bundles. 28,29 Some studies suggest that, compared with HCs, FA is typically lower in concussed patients within WM structures such as the corona radiata, cingulum, superior longitudinal and uncinate fasciculi, cortico-spinal tract, and corpus callosum. 22,30 A shift from voxel-wise analysis towards whole–brain connectomics has improved understanding of how concussion affects macroscale neural networks. 21,23,25,31 The integrity of WM connectivity, as conveyed by the mean FA of WM bundles between brain structures, is diminished in patients with acute concussion relative to HCs. 32 Further, FA-derived structural connectivity measures can distinguish the connectomes of concussed patients from those of HCs. 33 Thus, given concussed patients' expected lack of neuroradiological findings on T1- or T2-weighted MRIs, analyzing DWI-derived connectome features is a reasonable strategy to identify concussion-related structural brain abnormalities.
This study introduces a Bayesian machine learning (ML) classifier to identify subacute concussion in the absence of neuroradiological MRI findings on T1- or T2-weighted scans. To produce classifier features, our workflow generates connectivity matrices specifying the mean FAs of WM connections between brain structures. Entries in these matrices become features for ML classifiers trained to detect in a discovery sample including both concussed and HC participants, and in an independent validation sample. In both samples, our classifier identifies concussion with accuracy above 99% in the absence of neuroradiological MRI findings, evidencing its ability to differentiate between concussed and healthy brains in typical cases where diagnosis may be unclear.
Methods
Participants
This study was conducted in accordance with the US Code of Federal Regulations (45 CFR 46), the declaration of Helsinki, and with approval from the Institutional Review Board of the University of Southern California. Concussion was defined based on: an acute GCS score of 13-15 at the time of the initial clinical examination; a loss of consciousness shorter than 30 min; and post-traumatic amnesia lasting less than 24 h. Study inclusion criteria for concussed participants included the availability of MRIs acquired 14 days ±4 days (subacutely) post-injury. Additionally, concussed participants had no history of brain injury prior to the concussion accounting for their inclusion in the study group. Participants satisfying these criteria and who were both able and willing to provide written informed consent were invited to participate. Excluded were participants with pre-traumatic histories of clinical neurological disease, psychiatric disorder, or drug/alcohol abuse. For healthy controls, study inclusion criteria included a history of no TBI or concussion within the last 12 months, as well as the ability to provide written informed consent.
To train and validate classifiers, two samples were studied: a discovery (training) sample and a validation (testing) sample. The discovery sample comprised HCs and participants diagnosed with mTBI by the Transforming Research and Clinical Knowledge in Traumatic Brain Injury (TRACK-TBI) Consortium, including 471 mTBI participants and 92 HCs (Table 1). The ages of participants in this sample ranged from 17 to 83 years. The discovery sample was an adult cohort to exclude the effects of microstructural WM changes associated with early childhood development. The validation sample comprised 126 participants diagnosed with concussion, whose data are available at the University of Southern California (henceforth labeled as the USC subsample, n = 126) and 256 HCs from the Human Connectome Project (HCP subsample). 34 The ages of participants in this sample ranged from 12 to 83 years. The validation sample involved primarily an adult cohort, although some younger participants were included to ensure classifier robustness to age as a potential confound. Linear regressions to partial out the statistical effect of age are included at later stages of analysis. Because training and testing samples were completely distinct, non-overlapping, and independent, data leakage is not a concern.
Demographics of Discovery and Validation Samples
Blank entries represent unknown or missing data.
Cognitive assessments
Cognitive assessments were summarized to calculate average cognitive profiles of participants in each injured sample (discovery and validation), in each of which different tests were available. Here and throughout, the “injured” designation refers to patients with formal diagnoses of mTBI. The discovery sample had three tests for both study group participants and HCs. The first is the Rey Auditory Verbal Learning Task (RAVLT), 35 evaluating verbal memory and learning ability through immediate and delayed recall of a list of 15 unrelated words. The second is the Trail-Making Test (TMT), 36 quantifying visuomotor function, perceptual-scanning, and cognitive flexibility, with longer times indicating worse performance. The third test is the processing speed index of the Wechsler Adult Intelligence Scale (WAIS), 37 consisting of two timed tasks (the coding and symbol tasks, 120 sec each). These tasks together index processing speed and visual motor coordination.
The validation sample had the Brief Test of Adult Cognition by Telephone (BTACT) 38,39 available for injured participants. The BTACT is a short phone-based assessment with six subtests assessing cognitive function implicated in pathology and aging: 1) episodic verbal memory—immediate recall (EVMI); 2) episodic verbal memory—delayed recall (EVMD) of words on a 15-item list; 3) working memory span (WMS, assessed using a backward digit span task); 4) inductive reasoning (IR; assessed using a number series completion task); 5) processing speed (PS; measured using a backward counting task); and 6) verbal fluency (VF; assessed using a category fluency task). To situate injured participants in the discovery sample relative to the uninjured (HC) population, their cognitive scores were compared against those of 4179 HCs from the Midlife in the United States (MIDUS) study. 40 For all participants in this study, cognitive assessments were performed within 3 days of imaging.
First-order statistics (i.e., mean, standard deviation) of cognitive scores were calculated for injured participants and HCs in SPSS version 28. Independent-sample t-tests were used to compare mean differences between injured and uninjured participants in the discovery and validation samples separately (i.e., discovery-injured vs. discovery-uninjured; validation-injured vs. validation (MIDUS)-uninjured). Whenever Levene's test statistic was significant, unequal variances were assumed. Effect sizes of the differences between groups were assessed using Cohen's d, where effect sizes d < 0.19 are negligible, 0.20 < d < 0.49 are small, 0.50 < d < 0.79 are medium, 0.80 < d < 1.20 are large, and d < 1.20 are very large. 41 Multiple comparisons were accounted for using a false discovery rate (FDR) correction. 42
Imaging in the discovery sample
For both injured and uninjured participants, MRIs were selected from the TRACK-TBI Consortium, which has standardized protocols for acquisition of imaging data (https://www.tracktbi.ucsf.edu). T1-weighted images were acquired in three dimensions with a multi-echo magnetization-prepared rapid gradient-echo sequence. DWIs were acquired with a multi-slice single-shot spin echo echo-planar pulse sequence (64 gradient directions; voxel size = 2.7 mm × 2.7 mm × 2.7 mm; maximum b = 1300 sec/mm2; eight volumes with b = 0 sec/mm2). Standardized echo and repetition times were not available for TRACK-TBI subjects across study sites, but all MRIs were acquired on approved 3 Tesla (3T) magnetic resonance scanners. Further, an isotropic diffusion phantom developed by the National Institute of Standards and Technology, together with a traveling volunteer, ensured standardization of DTI measures across imaging sites. 43 Scans additionally underwent quality control to ensure compliance with necessary protocols for inclusion in the TRACK-TBI Consortium.
Imaging in the validation sample
The MRIs of injured participants in the validation sample were acquired on a 3T Prisma MAGNETOM Trio TIM scanner (20-channel head coil, Siemens Corporation, Erlangen, Germany). T1-weighted images were acquired in three dimensions using a magnetization-prepared rapid gradient-echo sequence (voxel size = 1.0 mm × 1.0 mm × 1.0 mm; repetition time (TR) = 1.95 sec; echo time (TE) = 2.98 sec; inversion time (TI) = 0.9 sec). DWIs were acquired axially in 64 gradient directions (voxel size = 2.73 mm × 2.73 mm × 2.7 mm; TR = 8.3 sec; TE = 72 msec; maximum b = 1300 sec/mm2; one volume with b = 0 sec/mm2). For HCs, MRIs were selected from the HCP-Aging repository (https://www.humanconnectome.org/study/hcp-lifespan-aging), acquired on a 3T PRISMA scanner (32-channel head coil, Siemens Corporation, Erlangen, Germany). T1-weighted MRIs were acquired in three dimensions with a multi-echo magnetization-prepared rapid gradient-echo sequence (voxel size = 0.8 mm × 0.8 mm × 0.8 mm; TR = 2.5 s; TE = 2.22 msec; TI = 1 sec). DWIs were acquired axially in 98 gradient directions (voxel size = 1.5 mm × 1.5 mm × 1.5 mm; TR = 3.23 sec; TE = 89.20 msec; maximum b = 1300 sec/mm2; seven volumes with b = 0 sec/mm2).
Image processing
T1-weighted MRIs were pre-processed and segmented automatically using Freesurfer 6.0 (http://surfer.nmr.mgh.harvard.edu) 44 with default parameters and a standard protocol described elsewhere. 45 Non-cortical structures were stripped using a hybrid-watershed deformation process, image intensities were normalized, and volumes were registered into Talairach space. Segmentation followed the Destrieux parcellation scheme, containing 165 structures: 74 cortical and eight subcortical in each hemisphere, as well as one brainstem structure. 46
DWIs were processed using 3DSlicer 4.11 (https://www.slicer.org) and DTIPrep 0.1.1 (https://www.nitrc.org/projects/dtiprep), as detailed elsewhere. 22 Skull-stripped DWIs and b0 images were registered to T1-weighted volumes using the BRAINSFit module of 3DSlicer. 47 Any DWI volume with poor registration to the corresponding T1-weighted volume was corrected with user supervision using a transformation matrix estimated from the registration between the b0 volume and the original T1-weighted volume. Unscented Kalman filter (UKF) two-tensor tractography was performed in 3DSlicer using whole–brain seeding, with default parameters described elsewhere 48 and five seeds per voxel. UKF tractography is a deterministic tractography approach that fits two tensors at each step. 49 The UKF algorithm utilizes previous tracking positions to direct model estimation and to improve tracking. FA was calculated from UKF-derived tensors at each voxel. Tractograms were co-registered onto anatomical segmentations of the brain.
Streamlines shorter than 1.5 cm were discarded due to their higher likelihood to be spurious. The quality of participants' imaging data was verified by a statistical quality control process described below. To reduce heterogeneity due to differences in protocols, scanners, and software used across samples, all DWIs were harmonized using the ComBat-GAM pipeline. 50
Connectivity calculation
Connectivity matrices specifying the mean FAs of connections between all pairs of brain structures were constructed using purpose-built software.
5
Let M and N be the number of brain structures and subjects, respectively. The connectivity matrix C has scalar entries
To reduce spurious connectivity due to noise and tractography artifacts, we removed outlier participants' information from
Machine learning classification and interpretability
To classify participants as injured or uninjured, we trained 25 standard supervised ML classifiers available in MATLAB's classification learner, using five-fold cross-validation to alleviate overfitting. For each classifier, in addition to predictive accuracy (i.e., the percentage of participants whose diagnostic status was identified correctly), we calculated sensitivity (i.e., true positive rate, TPR), specificity (i.e., true negative rate, TNR), precision (i.e., positive predictive value, PPV), and negative predictive value (NPV). From the set of trained classifiers, we chose the Gaussian naïve Bayesian classifier for further analysis based upon its predictive accuracy and overall suitability to the computational problem. This classifier was applied to the validation sample, where its classification measures were calculated.
In choosing between classifiers that yielded sufficiently high accuracy, the following characteristics were considered. Two naïve Bayesian classifiers were tested; a Gaussian and a kernel classifier. The Gaussian classifier assumes that features are normally distributed, but the kernel classifier makes no such assumptions, being more flexible in its ability to model nonlinear class boundaries. Compared with Bayesian classifiers, both standard and ensemble decision trees perform similarly well and are more parsimonious. However, they are also more vulnerable to overfitting and more reliant upon features with low predictive power. 52 Decision trees are less suited to our setting due to the relatively unbalanced nature of our samples (discovery sample: 471 injured participants and 92 HCs; validation sample: 126 injured participants and 256 HCs). Both naïve Bayesian classifiers trained here are scalable and robust to overfitting, 53 but the Gaussian iteration is better for features consisting of continuous variables, such as FA. 54 By contrast, kernel classifiers are typically more suitable for categorical or discrete data. 54
To rank connections according to their classification utility (saliency), we trained distinct instantiations of the optimal model which only included a pair of bilateral features consisting of a single connection and its contralateral homolog. For example, to quantify the classification saliency of hippocampo-amygdalar connectivity, we included both: 1) the connection between the right hippocampus and the right amygdala; and 2) the connection between the left hippocampus and the left amygdala. We opted for this type of bilateral saliency analysis to alleviate the potential confounds of asymmetric injury effects on neurocircuitry. Inclusion of bilateral feature pairs contributes to reducing such confounds because it allows study of the bilateral saliency of a connection to the classifier rather than the unilateral asymmetry of injury effects on that connection.
To provide model interpretability, we computed classifier sensitivity and specificity when it was trained using each bilateral pair (left and right homologs) of features. Both measures were evaluated as indicators of classifier performance to ensure that our findings were sensible. We sought to confirm that connections deemed most salient for classification exhibited mean FAs that differed significantly between classes (injured vs. uninjured). This step helped to ensure that high classification accuracy was not due to artifactual or erroneous mean FA differences between classes that might confound findings. For confirmation, the empirical probability distribution functions (PDFs) of mean FA were calculated for each discovery sample class and for each connection. The null hypothesis of no group difference in mean FA PDFs was tested using the Kolmogorov-Smirnov (KS) goodness of fit test. Its test statistic quantified whether the mean FA PDF of the most useful connections differed between classes. We hypothesized that this difference was significant for connections with highest individual predictive accuracy and nonsignificant for those with lowest individual accuracy.
Results
Demographic description of samples
In the discovery sample, 20.64% of injuries were due to accidental falls, 71.64% were due to vehicular accidents, and 7.72% were due to other causes (Table 1). The validation sample's injury mechanisms are unknown. Most participants were right-handed (discovery-uninjured: 93.48%, discovery-injured: 86.97%, validation-uninjured: 89.56%). Participants were predominantly white (discovery-uninjured: 77.53%, discovery-injured: 77.56%, validation-uninjured: 66.01%) and non-Hispanic (discovery-uninjured: 81.91%, discovery-injured: 77.17%, validation-uninjured: 90.59%). The majority of participants had a bachelor's or higher degree (discovery-uninjured: 80.22%, discovery-injured: 69.31%, validation-uninjured: 89.96%) The validation-injured sample's handedness, race/ethnicity, and level of education were not available.
Cognitive and imaging profiles
Consistent with their diagnoses and with our definition of concussion, all injured participants lack neuroradiological findings. Within the discovery sample, injured participants recalled significantly fewer words (9.53 ± 3.17 on average, compared with 10.48 ± 3.06 by HCs) from the RAVLT immediately after learning (Table 2; Fig. 1). However, Cohen's d is small (d = -0.301; Table 2). 41 There are no other differences between injured patients and HCs in the discovery sample after FDR correction. More than 93% of injured participants have cognitive scores within the HC normal range (i.e., z > -1.96). In other words, most injured participants' cognitive scores are not meaningfully distinguishable from HCs.

Comparison of cognitive scores between injured (concussion/mild traumatic brain injury) and uninjured participants. Cognitive scores for injured (orange) and uninjured (blue) subjects. Error bars denote standard errors, and asterisks denote comparisons that are significantly different after false discovery rate correction.
Means, Standard Deviations, and Independent Sample t-tests Comparing Injured to Uninjured Cognitive Scores on Available Tests. Cognitive Scores in the Injured Validation Subsample Were Compared With Those of HCs (Uninjured) in MIDUS
Percentage of injured patients whose cognitive score was within the normal range of HCs (i.e., whose z-scores were above the left-tailed two-sigma cutoff of -1.96 for the listed task).
The statistic of Levene's test for equality of variances between injured and uninjured cognitive scores was significant, so equal variances were not assumed.
dx, diagnosis (injured or uninjured); N, sample size; μ, mean; σ, standard deviation; t, independent samples t-value; df, degrees of freedom; p, two-tailed significance value; μΔ, mean difference; σΔ, standard error of the difference; d, Cohen's d. RAVLT IR, Rey auditory verbal learning task immediate recall; RAVLT DR, RAVLT delayed recall; TMT A, trail-making test trial A time; TMT B, TMT trial B time; WAIS PS, Weschler adult intelligence scale processing speed (standardized).
In the validation sample, injured participants' average BTACT scores are significantly lower than that of HCs (Table 2; Fig. 1). For instance, on both immediate and delayed recall tasks, the average injured participant remembered half the number of words (EVMI: 3.82 ± 2.72; EVMD: 2.23 ± 2.34) that HCs did (EVMI: 6.68 ± 2.29; EVMD: 4.36 ± 2.63) and could retain one fewer digit in the working memory task (injured: 3.78 ± 1.58; uninjured: 4.96 ± 1.53). Injured participants were able to name, on average, 13.07 ± 7.03 animals/fruit in 60 seconds, while HCs could name 18.58 ± 6.17. A medium-sized effect (d = -0.481) of injury diagnosis on IR scores was observed, where the negative sign indicates that injured participants' mean scores are lower than HCs’. All other effect sizes are large (d = -0.697 to d = -0.891) except for EVMI (where the effect is very large, d = -1.242). Despite injured patients having significantly lower average scores relative to HCs, individual scores are largely indistinguishable, in a statistical sense, from those of HCs (Table 2). Specifically, no injured participant exceeds the two-sigma cut-off (z < -1.96) for “poor” EVMD, WMS, or IR scores. Only for a small minority of injured participants are PS and VF z-scores significantly lower than those of HCs (15% and 18%, respectively), and fewer than half (39%) have EVMI z-scores below the cut-off.
ML classification
No significant relationship of age, sex, and/or their interaction on mean FA was found (p > 0.05, corrected). Of 25 supervised probabilistic classifiers tested, 17 could be trained on the discovery sample. Eight classifiers—the support vector machine and discriminant models, both linear and quadratic—were discarded from ulterior analysis because they failed to converge. We also tested k-nearest neighbor classifiers (fine, medium, coarse, cosine, cubic, weighted, and subspace ensemble varieties), logistic regression, boosted trees ensemble, and subspace discriminant ensemble classifiers. These yielded 83.7% predictive accuracy as they incorrectly classified all HCs as injured participants.
Two naïve (Gaussian and kernel) Bayesian classifiers achieved 100% predictive accuracy in the discovery sample (Table 3). For reasons discussed in the Machine learning classification & interpretability section, the Gaussian naïve Bayesian classifier was selected for further analysis. This classifier could identify injured participants in the validation sample with accuracy above 99%.
Classification Error Rates on the Discovery Sample for a Selected Subset of Well-Performing Approaches, Expressed in Percentages
TPR, true positive rate (i.e., sensitivity); TNR, true negative rate (i.e., specificity); PPV, positive predictive value (i.e., precision); NPV, negative predictive value (i.e., miss rate).
Interpretability
Our analysis singles out brain connections that are particularly sensitive and specific to concussion as defined here (Table 4). Notably, 13 bilateral cortico-cortical connection pairs form classification features predicting diagnostic status with accuracy higher than 99% in both discovery and validation samples. These connection pairs link frontal lobes to limbic, temporal, parietal, and occipital structures (Fig. 2). The cortical structures linked by these 13 connections are displayed on the cortex (Fig. 3A), visualized using a connectogram (Fig. 2), 21,25 and displayed using streamlines (Fig. 4). One connection pair with high predictive accuracy links the occipital lobes to the subcallosal aspects of the ipsilateral limbic lobes (Fig. 2). The two connections pairs with highest predictive accuracy link (A) the fusiform gyrus to the ipsilateral hippocampus and (B) pericallosal to precentral sulci, ipsilaterally (Table 4). To further contextualize the connections most representative of concussion, those that predict diagnostic status with accuracy above 95% in both discovery and validation samples are visualized in Supplementary Figure S1. A notable proportion of such connections link the frontal lobe to subcortical structures and to the parietal lobe, both ipsilaterally and contralaterally.
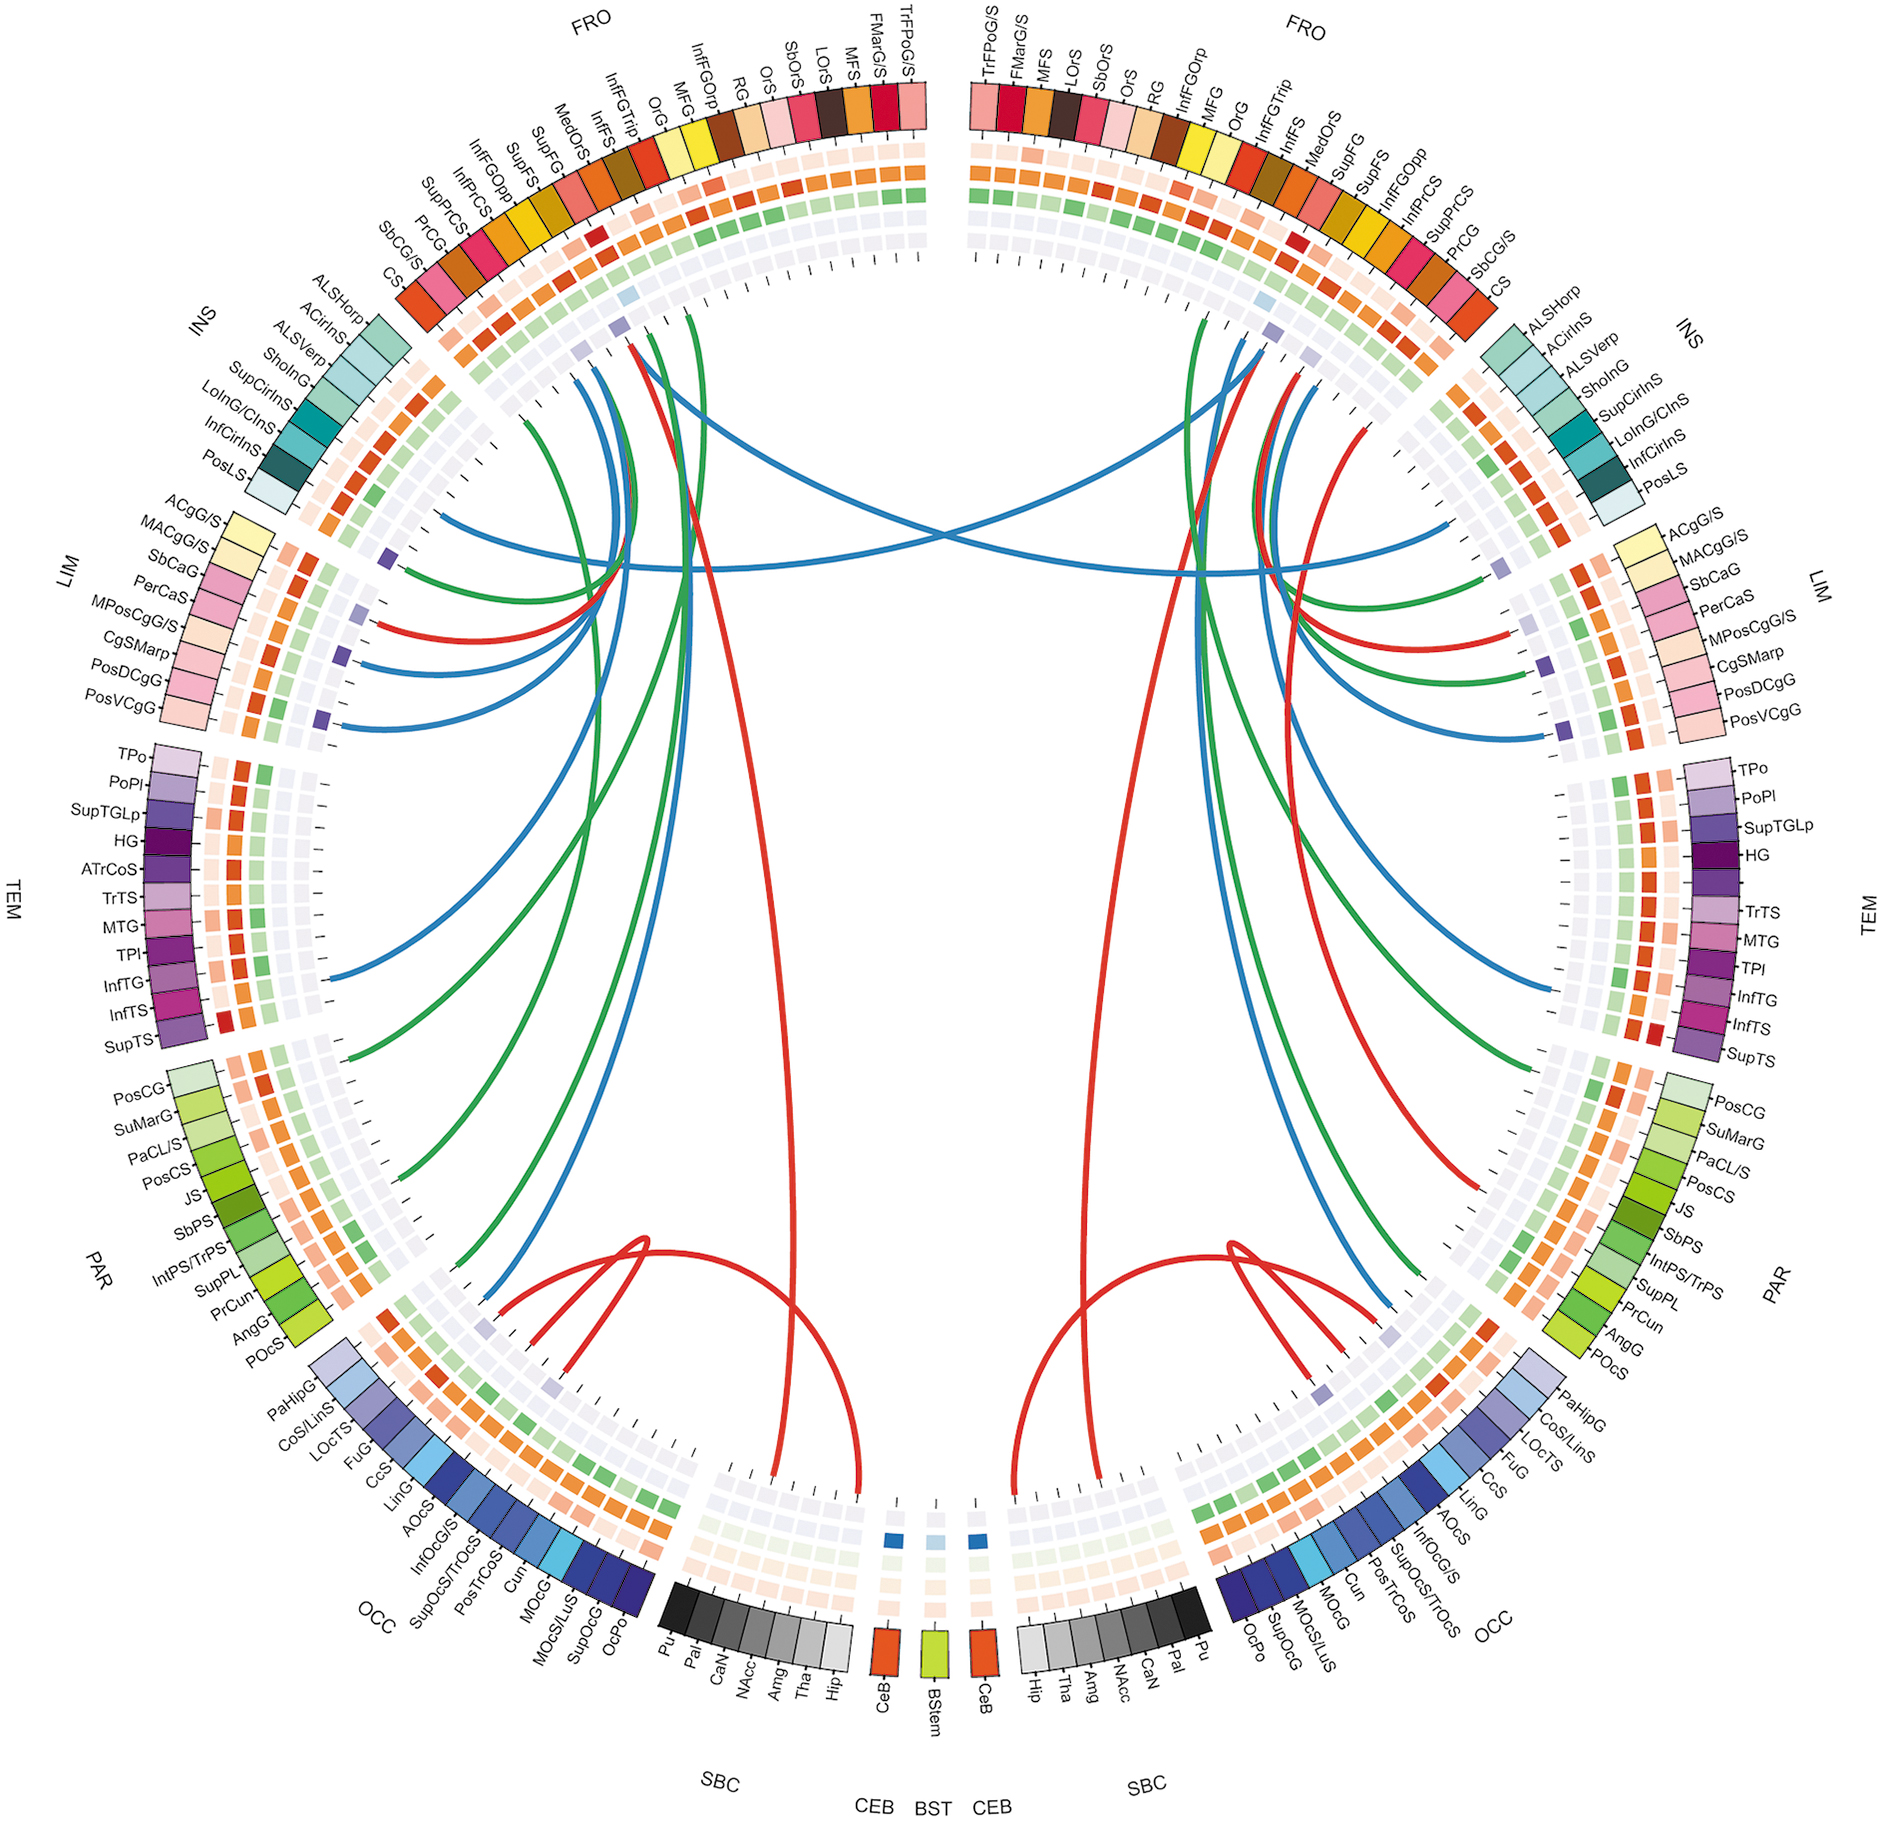
Connectogram of classification features that best facilitate identification of injury status. These features are part of a highly salient network of brain connections, i.e., connections with above 99% accuracy in both discovery and validation samples. The outermost ring encodes brain structures arranged by lobe (fr—frontal; ins—insula; lim—limbic; tem—temporal; par—parietal; occ—occipital; nc—non-cortical; bs—brain stem; CeB—cerebellum). Lobes and structures are ordered from anterior to posterior according to their center-of-mass locations within the right-anterior-superior (RAS) brain coordinate system. Each lobe has a unique dominant color scheme with distinct hues for each constituent structure. The color of each structure on the cortical plot of Figure 3B matches the corresponding color on the outer ring of the connectogram. A complete description of color schemes is available in our previous publication on the connectogram. 25 Connectogram links encode the mean fractional anisotropy (FA) of streamlines forming the respective connection between any two structures. Links shaded in red denote tractography-resolved pathways in the lower tercile of the mean FA distribution (lowest mean FAs), links in green are pathways with mean FAs in the middle tercile, and links in blue are in the top tercile (highest mean FA).

Brain structures linked to other parts of the brain by connections with optimal discriminative ability to identify injury status.
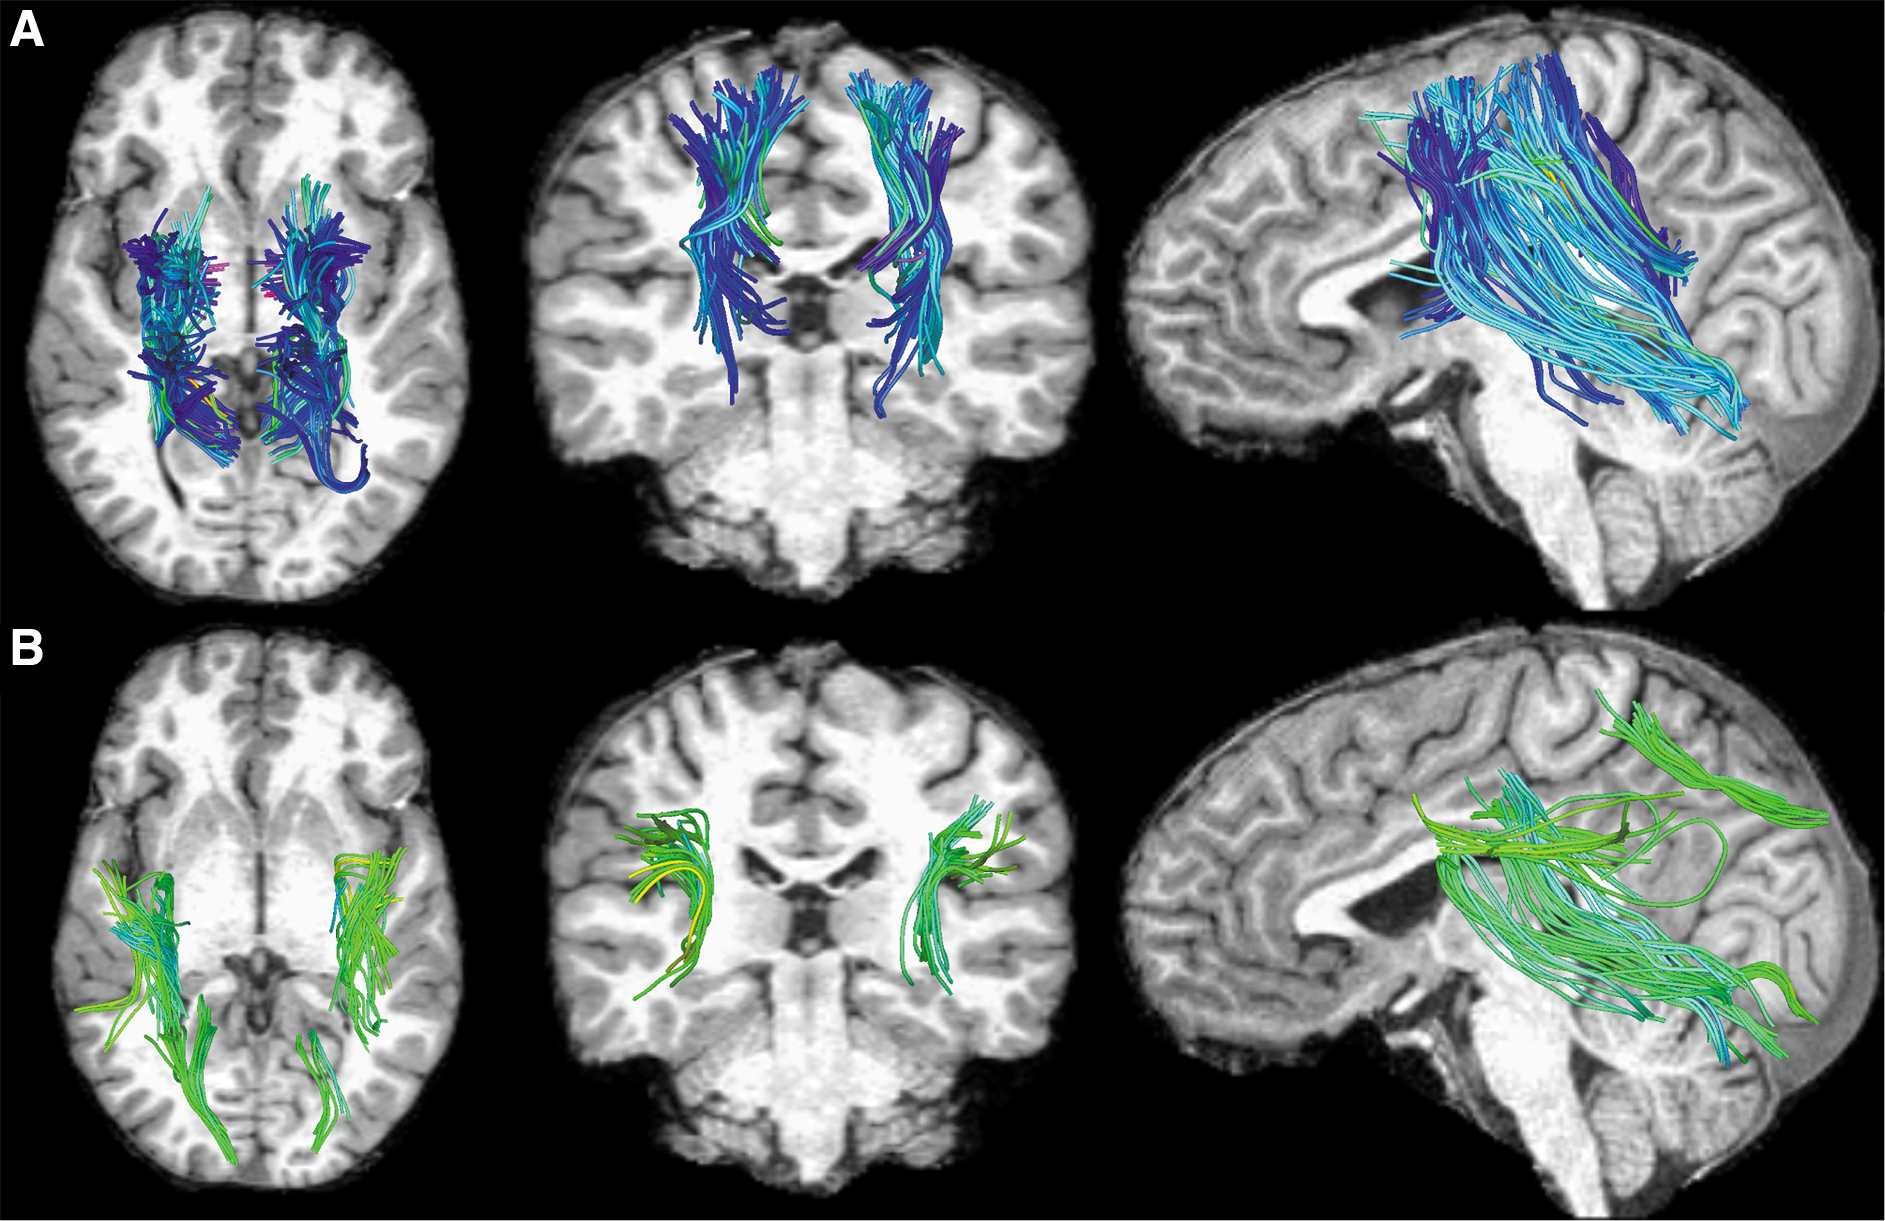
Streamline representations of white matter connections whose mean fractional anisotropy (FA) values have the highest classification accuracy to identify injury status. Structures connected by these streamlines are shown in Figure 3A, and the connections are visualized in the connectogram in Figure 2. All magnetic resonance images are displayed in radiological convention (the left-hand side of the reader is the right-hand side of the subject). Streamlines are colored according to mean streamline orientation (green streamline trajectories primarily span the sagittal plane (i.e., they proceed from the anterior to the posterior part of the brain); blue streamlines are along the coronal plane (i.e., inferior to superior); red streamlines are along the transverse plane (i.e., left to right).
Bayesian Classification Accuracies of Single Features Conveying the Mean FA of Cortico-Cortical Connectivity Between Two Regions
FA, fractional anisotropy.
Mean FA histograms were compared across groups for each bilateral connection pair. For the 13 connection pairs with highest predictive accuracy, a two-sample KS test rejected the null hypothesis that the mean FAs of concussed and HC subjects were from the same continuous distribution (p < 0.05; Fig. 5; Supplementary Fig. S2-S4). This confirms that brain features enabling our classifier's high discriminant ability reflect genuine diffusion properties (mean FA) of connections on which classification relies. It also suggests that the classifier's accuracy is not simply due to an overfit model. By contrast, for the connections with lowest prediction accuracy, the null hypothesis of the KS test was not rejected (p > 0.05; Fig. 6).

Comparison of mean fractional anisotropy (FA) for representative connections with near-ideal accuracy. Red bars depict injured participants, while blue bars depict uninjured participants.
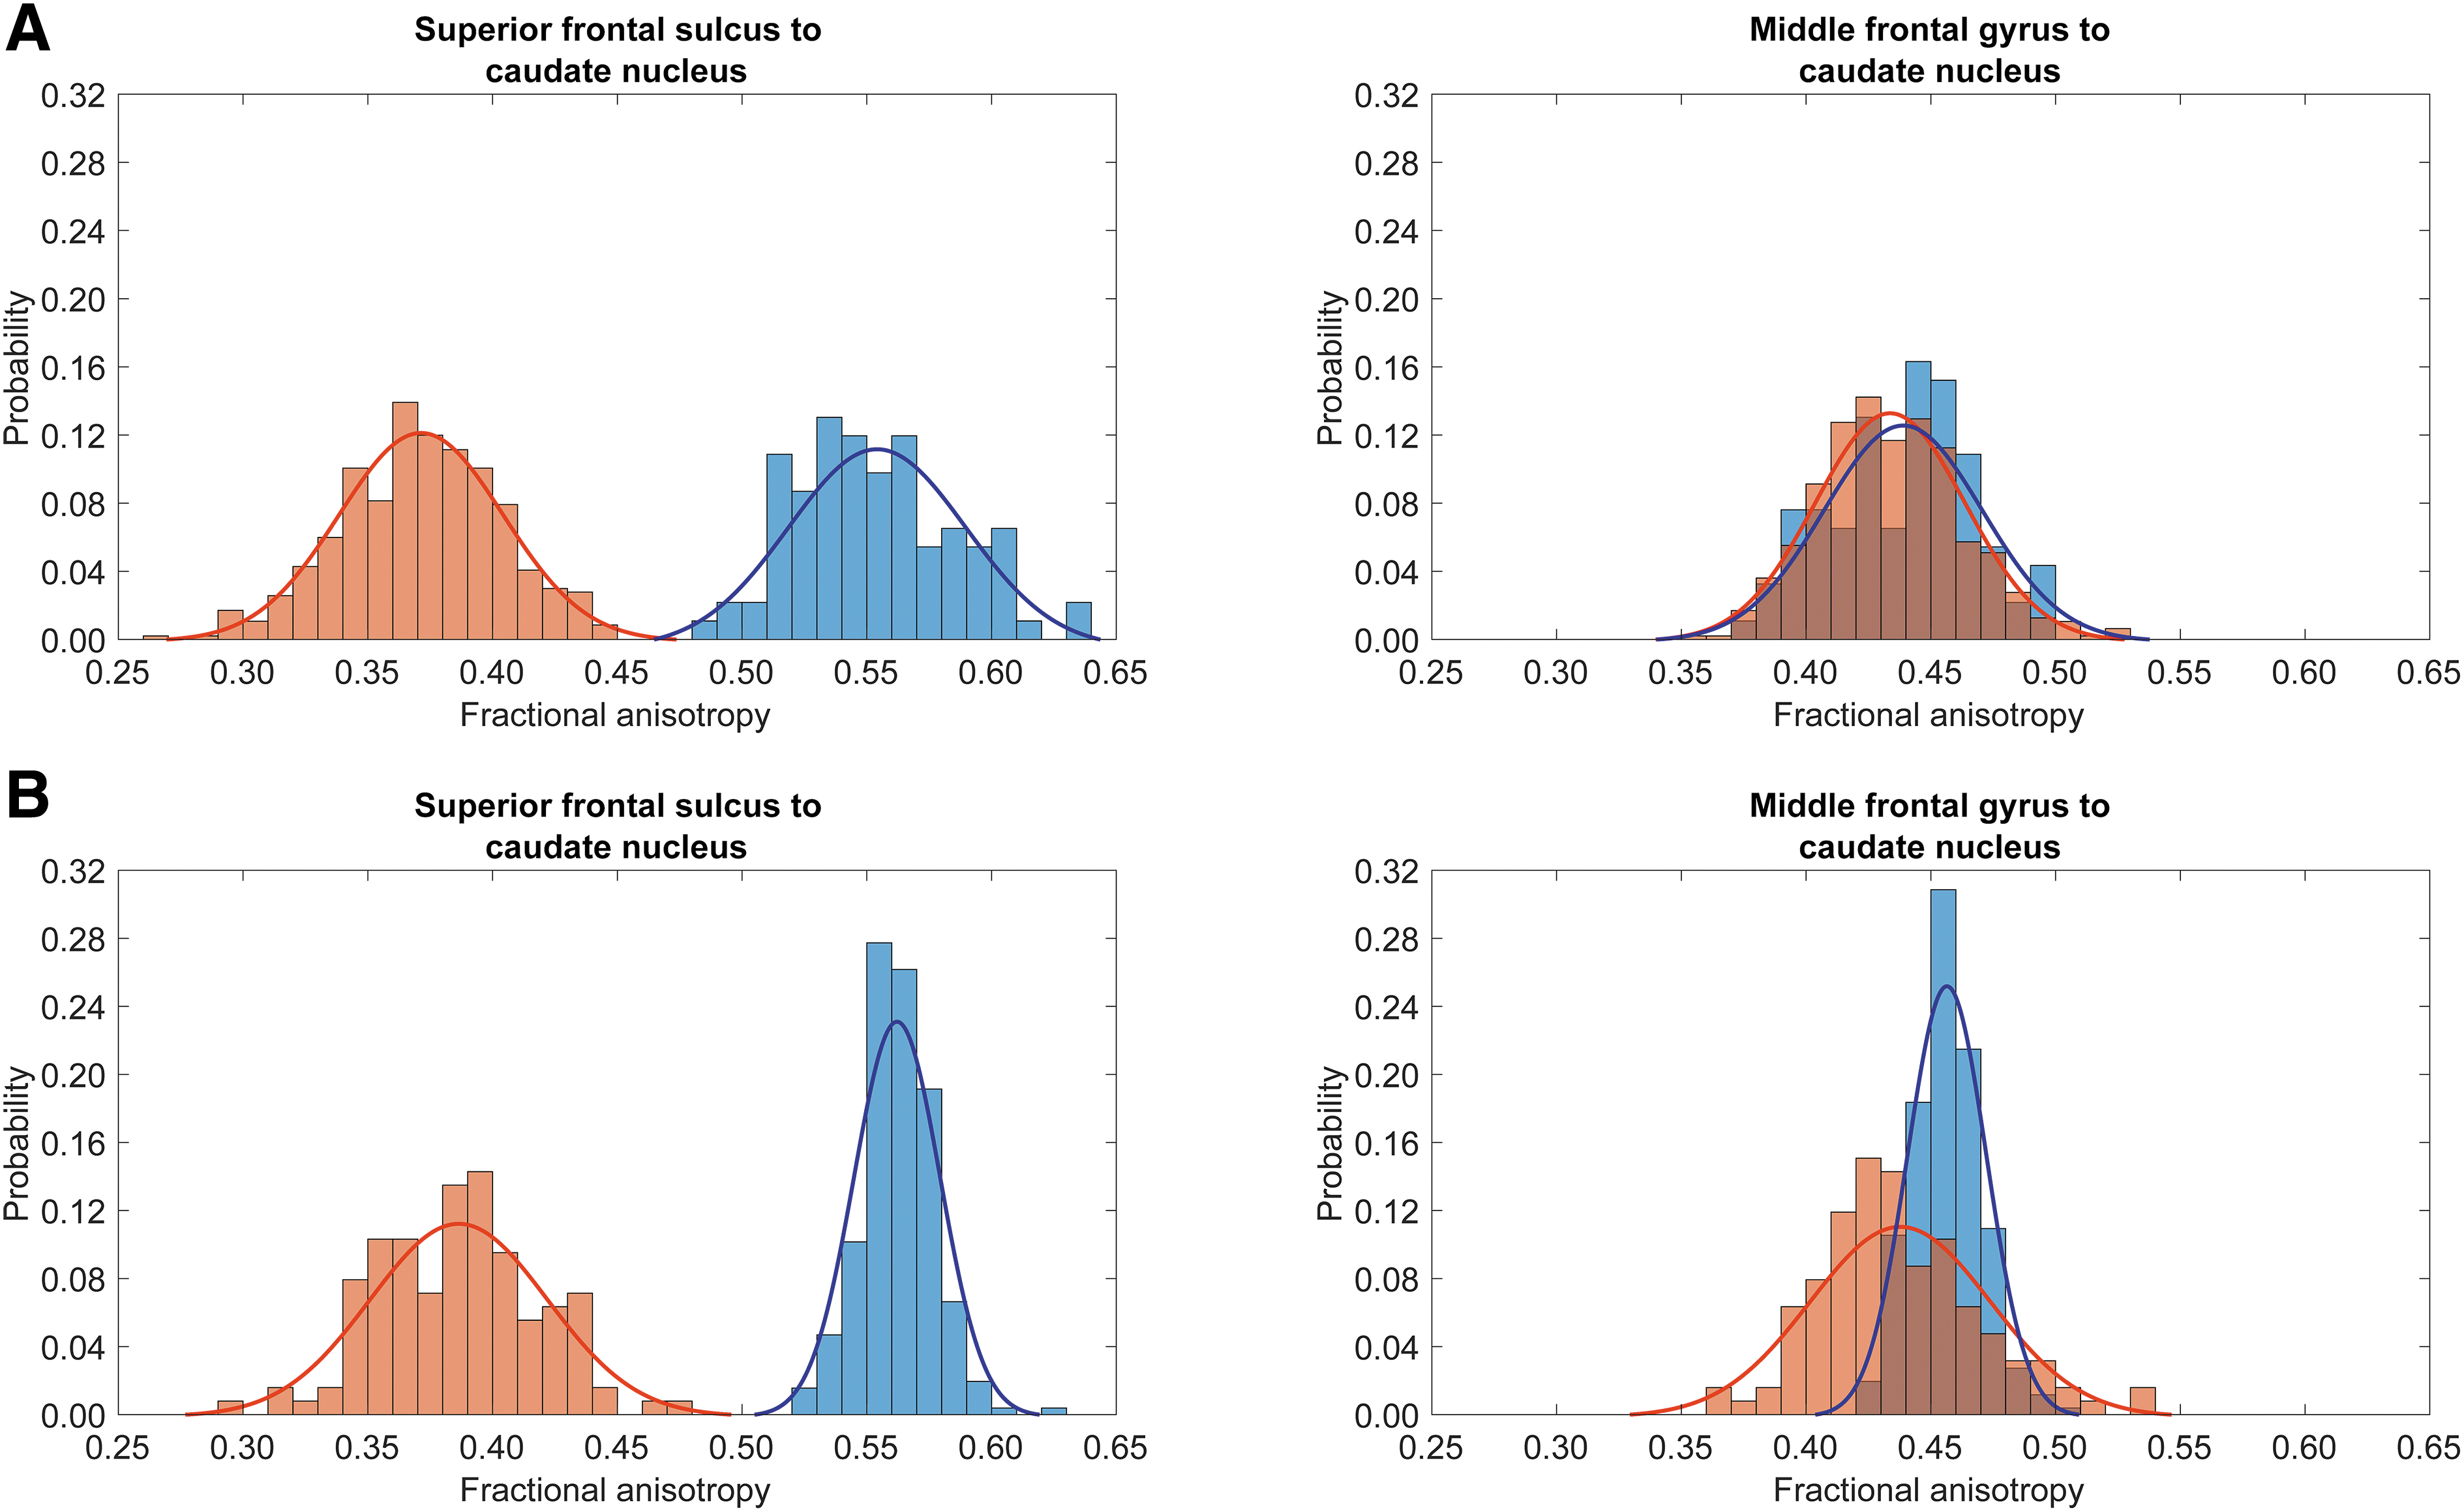
Comparison of mean fractional anisotropy (FA) for representative connections of both near-ideal and poor accuracy. Red bars depict injured participants, while blue bars depict uninjured participants.
We identified 1265 connections confidently, and their sensitivity and specificity were tallied. The sum of TPR and TNR is above 1.65 in both discovery and validation samples for 49 connections (3.87% of all connections). Other studies have suggested that tests with accuracies above 90% are “excellent” for diagnosis, whereas accuracies between 75% to 90% have “good” diagnostic value. 55,56 By this measure, 279 connections (22.06%) have excellent accuracies in both discovery and validation samples, while 174 (13.75%) connections have good accuracies in both discovery and validation samples (Supplementary Fig. S5). A total of 812 connections (64.19%) have discovery or validation accuracies below 75%, suggesting that these features would be diagnostically suitable neither on their own nor as part of a diagnostic classifier or panel (Supplementary Fig. S5). Together, these findings confirm our appraisal of the Bayesian classification and lend credibility to the premise that our analysis is based on both direct quantitative measures of brain water diffusion and sound inferences.
Discussion
Significance
Neuropsychological assessment for concussion typically occurs weeks to months after injury due to perceived mildness of neuropsychological symptoms in the sub/acute phase of injury. 8 In the subacute phase, many concussion victims experience persistent cognitive deficits, including memory difficulties, impulsivity, and impaired information processing. 57 Misdiagnosed patients with sub/acute concussion miss necessary treatments and psychoeducation, increasing the risk of recovery complications. 58 Our classifier is trained on MRIs of patients without neuroradiological findings, thus being particularly appealing for clinical cases where imaging does not corroborate a concussion diagnosis. Our classifier is less relevant for subacute concussions with CT findings but without MRI findings, as a lack of CT findings does not guarantee a lack of MRI findings.
Some participants exhibit cognitive symptoms allowing unambiguous concussion diagnosis. Hypothetically, our classifier may only be useful in the presence of such symptoms. On average, the injured discovery sample includes participants who exhibit deficits in EVMI but are otherwise not impaired significantly compared with HCs. Injured participants in the validation sample exhibit, on average, deficits in working and episodic verbal memory, slowed processing, impaired inductive reasoning, and limited verbal fluency. Nevertheless, injured participants' individual cognitive scores are rarely outside the normal range established in HCs.
Specifically, no injured participant scores significantly lower than HCs on TMT-A, TMT-B, EVMD, WMS, or IR. At most, 39% of injured participants score lower than HCs on EVMI (Table 2). Thus, injured participants in both samples have cognitive profiles representative of routinely observed concussion syndromes. However, a majority of injured participants have cognitive profiles difficult to distinguish from those of HCs, corroborating reports of difficulties in distinguishing individual injured patients from HCs based solely on cognitive scores. 59 The training and validation of our classifier involved injured participants with cognitive profiles similar to those of HCs. This suggests its applicability to persons with quasi-normal cognition but whose concussion diagnosis can benefit from further insights.
Comparison to previous research
We successfully distinguish injured participants from HCs with accuracy above 99%. Of 25 supervised classifiers trained, the naïve Bayesian classifier demonstrates the highest classification accuracy and generalizability to an external independent validation sample with acquisition and pre-processing pipeline different from those of the discovery set. No other MRI-based classifier known to us has higher predictive accuracy. For example, Vergara and colleagues 60 trained classifiers to identify subacute mTBI from resting-state functional MRIs (maximum accuracy: 84.1%) or diffusion MRIs (maximum accuracy: 75.5%). Italinna and colleagues 61 developed an ML classifier that used resting-state magnetoencephalography in mTBI patients to achieve a classification accuracy of 79%. These classifiers, in contrast to ours, failed to reach the high sensitivity and specificity thresholds expected in clinical settings. Nevertheless, because biomarkers and classifiers with (quasi) errorless classification rates are rare in biomedical sciences, we emphasize the need for further independent validation, both retrospective and prospective.
Interpretability
A small pool of features was uniquely useful for subacute injury identification. WM connections most useful to our classifier constitute a network of brain connectivity particularly sensitive to the neurological sequelae of head impacts.
Many connections idiosyncratic to concussion involve the prefrontal cortex (PFC), important in cognitive control of emotion and behavior, 62 where it exerts top-down influence on subcortical and limbic structures like the amygdala. 63 Such disturbances frequently manifest themselves as anxiety or depression, whose severities are mediated by damage to fronto-limbic WM connections. 64 Socio-emotional dysregulation and impulsivity can occur after concussion due to fronto-subcortical and fronto-limbic dysconnectivity. 65 The prominence that the classifier assigns to connections between the PFC and both subcortical and limbic regions may explain the high incidence of affective disorders (23% of adults within 4 years of injury) 66 and behavioral disturbances such as aggression (34% of adults within 6 months of injury) 67 following concussion.
Many connections with near-ideal classification accuracy involve the superior frontal gyrus. This voluminous structure spans the superior extremity of dorsolateral PFC along the anteroposterior axis, where shear and strain forces are often strong during injury. The connection between the superior frontal sulcus and the caudate nucleus spans a notable portion of frontal WM, where connectivity from superficial frontal areas travels to deeper subcortical regions. Thus, it is unsurprising to find these and similar structures among the connections with high concussion classification accuracy.
Somatosensory and somatomotor areas are prominent in our network of connections salient to concussion. Specifically, connectivity between inferior precentral and inferior temporal sulci is involved in nociceptive and somatomotor memory circuits, and both are often affected by concussion. 68,69 These connections originate/terminate along the boundary between the somatomotor and somatosensory cortices; their high sensitivity to concussion may reflect cortical dynamics of post-traumatic pain syndromes. Primary somatosensory cortex and several supplementary motor areas localize to the central sulcus and the superior parietal lobule, respectively. The significant traumatic disruption of connections involving these areas may explain the frequency of post-concussion complaints pertaining to sensorimotor integration and balance problems. 70
Many connections salient to concussion identified here belong to the ventral (“what”) visual pathway subserving object recognition and storage of visual and long-term memory. This pathway includes the fusiform gyrus, the lateral occipito-temporal sulcus, and the inferior temporal sulcus. After injury, persons with concussion exhibit impaired object recognition through the ventral visual processing stream. 71 Connectivity between the superior frontal gyrus and both the parahippocampal gyrus and the lateral occipito-temporal sulcus also links attention to memory systems. 72 Similarly, connections linking the hippocampus to the (ipsilateral) fusiform gyrus are involved in visual processing and memory. 73 Both structures are vulnerable to concussion partly due to their locations in the brain. 73 Disruption of connections between these structures may partly explain memory symptoms common after concussion, 73 as seen in our patients' lower-than-normal RAVLT, EVMI/EVMD, and WMS scores.
Connectivity between the superior part of the precentral sulcus (dorsolateral PFC) and the pericallosal sulcus (limbic lobe) perfectly predicts concussion status in the validation sample. Kim and colleagues 74 found that WM tracts innervating the pericallosal sulcus exhibit altered connectivity properties in preclinical Alzheimer's disease. Because pericallosal and precentral areas mediate cognitive functions affected by concussion and Alzheimer's disease, 75 the connectivity identified here may suggest neurocognitive parallels between these conditions 76 that future studies should examine.
Reproducibility and generalizability
Reproducible classification with accuracy above 95% is difficult in medicine and life sciences and therefore warrants skepticism. To strengthen trust in our classifier, we compared mean FAs between groups across all bilateral pairs of connectivity features, including those either most or least salient to the classifier. Because FA quantifies water diffusion measured by MRI, we reasoned that this analysis could relate abstract features identified by our classifier to concrete measures of connectivity. Unsurprisingly, our results indicate that connections salient to the classifier exhibit significant mean FA differences between diagnostic groups. Conversely, connections with poor saliency have nonsignificant group differences in mean FA. These results strengthen the premise that the classifier relies on physical alterations affected by concussion on connectivity features rather than on spurious properties of WM streamline bundles.
In this study, 50 features (∼4%) achieve classification accuracies above 95%. Since 13 features were used for classification, this suggests that accurate binary classification of concussion is possible based on connection pairs other than those used here, assuming that such classification relies on this pool of highly salient features. 77 Because the pool size is not similar to the number of features used for classification, our diagnostic strategy is robust to numerical analysis choices pertaining to optimization scheme, hyperparameters, etc. Overfitting is more likely when the salient feature pool is small relative to the number of classifier features, because a paucity of salient features suggests poor class separation in the eigenspace of the discriminant function. The fact that our salient feature pool is ∼four times larger than the number of features used for classification alleviates concerns that our classifier relies on overfit features, or that our accuracy may be irreproducible or ungeneralizable.
Classifiers like ours require testing on MRIs from both patients with subacute concussion without radiological findings and matched HCs, causing difficulty in identifying samples suitable for this study. The validation sample comprises two subsamples from distinct studies where participants were imaged on the same scanner type but using slightly different scan parameters. For this reason, the validation sample's classification accuracy is partly affected by the statistical interaction between diagnostic status and scan protocol. In the USC validation subsample, which lacks HCs, we calculated the true positive (100%) and false negative (0%) rates, because the false positive and true negative rates are unknown. Similarly, in the HCP validation subsample, the true negative rate is 100% and the false positive rate is 0%; the true positive and false negative rates are unknown because this subsample lacks concussed participants.
While data harmonization via the ComBat-GAM pipeline was performed to minimize the effects of different scanners, we appreciate that this confound still exists to a certain degree. However, we expect this confound to have only modest effects on classification accuracy for several reasons. Firstly, the classifier—despite being trained on the discovery sample—performed exceptionally on the validation sample, as evidenced by the latter's near-ideal classification accuracies. The USC and HCP subsamples are independent, and the classifier's classification rates are excellent in each distinct subsample and in the (combined) validation sample, suggesting genuine discriminative power. Secondly, the demonstration of high classification ability despite potential confounds is desirable, providing evidence of model generalizability. Nevertheless, data from other independent samples can further validate our approach and evince its generalizability. Such testing should also appraise how different brain segmentations, tractography, connectomic analyses, etc., affect results. Finally, although classification accuracy is exceptional for both the discovery and validation samples, the trustworthiness of this metric depends on sample size and population variance. Thus, our results require replication in larger samples capturing this variance.
Comparison to clinical and cognitive measures
Routine methods of diagnosing concussion rely on the ability to measure GCS scores, loss of consciousness, and post-traumatic amnesia within 30 min of injury. However, typical delays in clinical assessment or delayed effects of many injuries prevent an estimated 50-90% of concussion cases from being identified early enough to reduce chance of sequelae. 7,78 Further, concussion symptoms are often misattributed to alcohol intoxication, whose relationship to GCS remains unclear. 79 Because 35-50% of suspected patients with concussion may be intoxicated during injury, 80 developing novel diagnostic protocols less vulnerable to intoxication status is crucial. As detailed by Peixoto and colleagues in patients with acute polytrauma, cognitive assessments often lead to missed concussion diagnoses (60.9% of cases) if other injuries accompany symptoms similar to those of concussion. 81
The neuropsychological assessments used in this study to identify sequelae indicative of brain injury are reportedly related to cognitive outcome. 7,13,78 For example, whereas the RAVLT is often used to test verbal memory and learning in patients, 82 Callahan and collegues 83 argued that it also assesses global cognitive functions in the medical rehabilitation setting. On average, in both discovery and validation samples, participants with subacute concussion had significantly poorer verbal memory than HCs, suggesting that tests such as the RAVLT could differentiate between these groups. However, in practice, the RAVLT has substantially lower accuracy (69%) than our classifier (> 99%) when used in the context of concussion diagnosis. 84 Similarly, 93% of concussed patients had normal RAVLT scores. The RAVLT also has low accuracy in predicting recovery for moderate-to-severe TBI patients. 78
The BTACT, designed to assess typical aging, 39 is often used to track cognition after concussion, although it has low criterion validity in sub/acute concussion. 85 These authors contend that the classifier's best utility is detecting TBI sequelae, not differentiating between participants according to diagnostic status. We observed significant deficits in BTACT performance, on average, in participants with subacute concussion compared with MIDUS HCs. However, most concussed patients had BTACT scores within the normal range (ranging from 100% on EVMD, WMS, and IR, to 61% on EVMI; Table 2). Unsurprisingly, the BTACT was insufficient for sensitive and specific differentiation between concussion and HC. These limitations of routine neuropsychological diagnostic assessments for concussion highlight the need for a novel, robust and independent source of clinical and scientific evidence such as ours.
Limitations
In the validation sample, the average age of concussed participants differs significantly from that of HCs (Table 1). This discrepancy was partially mitigated by regressing out age, sex, and their interactions from classifier features. 22 In future studies, the classifier should be tested on additional independent concussion samples with participants matched on age, sex, and other demographic variables (e.g., years of education, socioeconomic status, and race) known to affect functional outcomes after concussion. 86 Further, classifier robustness to age- and sex-related effects should be studied. Classification accuracy should also be investigated in the presence of additional sources of diagnostic information such as the GCS, T2-weighted MRI, CT, and measures of functional disability, cognition, and consciousness level.
Conclusion
We introduced a novel approach for identifying concussion in the absence of neuroradiological findings using ML of connectomic brain features. Our classifier leverages a network of highly salient connectivity features to achieve near-ideal classification. In the discovery sample, our protocol identifies subacute concussion with high sensitivity and specificity even in patients with quasi-normal cognitive scores. The need for methods like ours increases as the incidence of concussion rises within aging populations. These findings could also help to identify novel biomarkers more accurately reflecting subacute concussion's impact on the connectome.
Transparency, Rigor, and Reproducibility Summary
This study was not formally registered because it is a retrospective study of a sample of convenience. The analplan was not formally pre-registered, but the team member with primary responsibility for the analysis certifies that the analysis plan was pre-specified. A sample size of 950 subjects was planned based on: 1) availability of diffusion-weighted imaging in the TRACK-TBI, HCP, and USC subsample repositories; as well as 2) the existence of necessary data to perform UKF tractography. Five subjects' data failed quality controls; therefore, the final sample size was 945 subjects (92 healthy control subjects and 471 adult mTBI subjects for the discovery sample; 256 healthy control subjects and 126 concussion subjects for the validation sample). Imaging quality control decisions and analyses were performed by investigators who were aware of participants' relevant characteristics. Imaging data were collected using multiple scanners according to data collection protocols for the TRACK-TBI and HCP repositories. Imaging data were preprocessed using Freesurfer and all imaging sets were analyzed at the same time. All equipment and software used to perform acquisition and analysis are widely available from open and commercial sources. The key inclusion criteria are established standards. Outliers were defined based on the interquartile range of their mean FAs, and missing data were handled through removal of corresponding connectivity features from consideration by the classifier. Multiple comparisons were accounted for using an FDR correction. This report includes documentation of internal replication. MRI data are publicly available from HCP (https://www.humanconnectome.org) and TRACK-TBI (https://tracktbi.ucsf.edu/transforming-research-and-clinical-knowledge-tbi). Analytic code used to conduct the analyses presented in this study are not available in a public repository. They may be available by emailing the corresponding author as of September 29, 2023. The authors agree to provide the full content of the manuscript on request by contacting the corresponding author.
Footnotes
Acknowledgments
The authors thank Paul Bogdan for useful discussions.
Authors' Contributions
Authors' contributions include conceptualization and design (AI), data curation (BJH, PEI, AMD, JZ, NFC, NNC), formal analysis (BJH, AMD, JZ, NFC, NNC), funding acquisition (AI), investigation (BJH, PEI, AMD, JZ), methodology (BJH, AMD, NFC, NNC, AI), project administration (AI), resources (AI), software (BJH, AMD, NFC, NNC), supervision (AI), validation (BJH), visualization (BJH, PEI, NFC), writing of the original draft (BJH, PEI, AMD, JZ) and writing review and editing (BJH, PEI, AMD, JZ, NNC, AI).
Data Availability
MRI data are publicly available from HCP (https://www.humanconnectome.org) and TRACK-TBI ( ).
).
Funding Information
A.I. gratefully acknowledges the support from the National Institutes of Health under grants R01 NS 100973, R01 AG 082201, and R01 AG 079957, from the US Department of Defense (DoD) under award W81-XWH-1810413, from the Leonard Davis School of Gerontology under a Hanson-Thorell Research Scholarship, from an anonymous donor family, from the Undergraduate Research Associate Program (URAP), the Provost's Undergrad Research Fellowship (PURF), and the Center for Undergraduate Research in Viterbi Engineering (CURVE) at the University of Southern California.
Author Disclosure Statement
No competing financial interests exist.
Supplementary Material
Supplementary Figure S1
Supplementary Figure S2
Supplementary Figure S3
Supplementary Figure S4
Supplementary Figure S5
References
Supplementary Material
Please find the following supplemental material available below.
For Open Access articles published under a Creative Commons License, all supplemental material carries the same license as the article it is associated with.
For non-Open Access articles published, all supplemental material carries a non-exclusive license, and permission requests for re-use of supplemental material or any part of supplemental material shall be sent directly to the copyright owner as specified in the copyright notice associated with the article.
