




Abstract
Autonomic dysreflexia (AD) is a common autonomic complication of spinal cord injury (SCI) characterized by a sudden increase is blood pressure triggered by peripheral stimulation, such as bladder distention. Iatrogenic AD events often occur during various medical procedures including urodynamic assessments (UDSs) used to evaluate lower urinary tract (LUT) function in individuals with SCI. To date, there are no established clinical practices that would allow early detection of the development of episodes of AD. Heart rate variability (HRV) is a reliable and non-invasive metric for evaluating autonomic regulation of the cardiovascular system, with demonstrated utility in people with SCI during UDSs. We aim to provide a comprehensive evaluation of cardiovascular function during UDS-induced AD using ultra-short-term HRV analysis and identify changes in cardiovascular dynamics to predict the onset of AD. We assessed cardiovascular data in a total of 24 participants with sensorimotor complete SCI above T6 (17 males, 7 females, median age = 43 [36–50] years) who experienced AD during UDS. We used continuous electrocardiographic recordings to evaluate HRV in 60 sec overlapping windows during filling cystometry. The mean of “normal-to-normal” heartbeats (meanNN), its standard deviation (SDNN), and the root mean square of successive differences (RMSSD) were calculated and used in all subsequent analyses. We found that SDNN and RMSSD diminished during the early phase of bladder filling and sharply increased during AD. Using the lowest point of statistical variability in heart rate (i.e., SDNN), we were able to predict AD events within 240 sec (percentile 25–percentile 75: 172–339 sec) before the first systolic blood pressure peak after AD onset (sensitivity = 0.667; specificity = 0.875). Our results indicated a temporary increase in sympathetic activity during the early phase of bladder filling, which is followed by an increase in parasympathetic outflow to the heart when AD occurs. These findings have significant clinical implications that extend beyond the context of UDS and demonstrate the importance of identifying early changes in HRV in order to accurately predict AD episodes in people living with SCI.
Introduction
Spinal cord injury (SCI) results in autonomic dysfunctions, such as impaired blood pressure control. 1,2 The majority of individuals living with SCI at or above the sixth thoracic spinal cord segment (T6) experience autonomic dysreflexia (AD), recurring on a daily basis. 3,4 AD is a life-threatening complication characterized by paroxysmal episodes of hypertension, clinically defined as a sudden increase of ≥20 mm Hg from baseline in systolic blood pressure (SBP). 5 On average, individuals with upper thoracic and cervical SCI experience AD 11 times per day. 4
The change in blood pressure during AD occurs within the scale of seconds or minutes. 6 AD is triggered by noxious and non-noxious stimuli arising from below the level of injury, of which 80% are attributed to the lower urinary tract (LUT), such as bladder distention. 7 Such stimuli are followed by a massive sympathetic response that causes vasoconstriction and hypertension, which in turn provokes bradycardia. 8 Symptoms of AD are complex and variable and typically present following the hypertension onset, although AD can be asymptomatic. 8 Symptoms of AD include severe headache, anxiety, profuse sweating, flushing and piloerection above the level of injury, dry and/or pale skin caused by vasoconstriction below the level of injury, blurred vision, nasal congestion, and bradycardia. 9 This is concerning, as exaggerated and uncontrolled bouts of elevated blood pressure during AD can lead to severe health complications, such as intracerebral hemorrhage, seizures, retinal detachment, myocardial infarction, and even death. 8 –11
Individuals with SCI undergo periodic urodynamics assessments (UDS) to assess LUT function. 12 Up to 68% of individuals with SCI undergoing UDS present with AD during these assessments. 13 AD events may be asymptomatic, especially in those with a higher cervical level of SCI; 14 therefore, blood pressure monitoring every 1–2 min during UDS is crucial to identify AD events and manage them accordingly. 15 Although automatic AD detection approaches have been proposed in other experiments, 16,17 there are no clinical factors that enable accurate AD prediction prior to onset in humans. Previous research has shown that cardiovascular autonomic regulation can be assessed by heart rate variability (HRV) analysis. 18 HRV represents instantaneous changes in heart rate; that is, the oscillation in the interval between consecutive heartbeats. 19 HRV has proved to be useful in the identification of short-term changes in blood pressure in animal SCI models 17 and other clinical scenarios. 20,21
The autonomic response to UDS evaluation in able-bodied individuals using windowed-HRV evaluation showed that sympathetic outflow to the heart increases as the bladder is filled. 22 However, according to 4–5-min HRV evaluations, people with SCI undergoing UDS exhibit increased parasympathetic activity, during which, AD may occur. 18 Moreover, people with SCI exhibit a decreased sympathetic resting tone compared with able-bodied individuals. 23
Ultra-short-term (UST) HRV analysis is an established method for assessing cardiovascular regulation and vagally mediated activity on the heart. 24 Time domain metrics based on the statistical variation in HRV time series can be used to capture swift and transitory autonomic events, 24 such as AD. In this work, we aimed to (1) comprehensively evaluate autonomic regulation of the cardiovascular system during UDS, and (2) identify the changes in HRV preceding AD in order to predict episodes across a cohort of individuals with SCI.
Methods
Study participants
This observational study is a secondary analysis of baseline data collected from two prospective clinical studies (identifiers NCT02298660 and NCT04604951), approved by the Clinical Research Ethics Board or The University of British Columbia and the Vancouver Coastal Health Research Institute. Details regarding the aims of the two studies are described in detail in previous publications. 25,26 The first clinical trial aimed to investigate the impact of intradetrusor onabotulinumtoxinA injections on AD, and the second clinical trial aimed to investigate the effects of transcutaneous spinal cord stimulation on pelvic organ functions. In summary, participants in the two clinical studies underwent a pre-treatment and post-treatment UDS with cardiovascular monitoring. Only pre-treatment data were included for analysis in our current study. As such, data used for this study's analysis were collected from participants before they were exposed to any treatment interventions in the two clinical trials. They were asked to refrain from caffeine, alcohol, cigarettes, and strenuous exercise 12 h prior to the study. We included all participants with uninterrupted and legible electrocardiographic (ECG) recordings. We analyzed the data from 24 adult participants (≥ 19 years old) with chronic SCI (≥ 1 year post-injury) at or above T6. Participant demographics and injury characteristics are summarized in Table 1. All procedures were conducted in accordance with the Declaration of Helsinki for human studies, and all participants provided written informed consent prior to data collection.
Participant Characteristics
Values are reported as median (percentile 25–percentile 75), or absolute frequency (relative frequency %)
AIS, American Spinal Injury Association Impairment Scale; C, Cervical, T, Thoracic.
Urodynamics and cardiovascular signals acquisition
Participants underwent standard cystometry to assess LUT function between November 2014 and June 2023. All UDS sessions were performed with an Aquarius TT (Laborie Model 94-RT03-BT, Quebec, Canada) in accordance with the international Continence Society's “Good Urodynamics Practices.” 27 UDS sessions were performed with the subject in a supine lying or reclining position with a fixed bladder filling rate for all participants (30 mL/min) according to an established protocol. 18 Filling ceased when participants reported a sensation of fullness, at the moment of urine leakage, if the intravesical pressure exceeded 40 cm H2O, or upon request. Following any of the aforementioned, the bladder was subsequently drained and the UDS session concluded.
Prior to UDS, continuous one-lead ECG and finger-photoplethysmography (PPG) baseline recordings were acquired for 1 min using a Finapres Nova system (Finapres Medical Systems, Amsterdam, The Netherlands). PPG was corrected to brachial blood pressure measures to estimate beat-to-beat blood pressure. During baseline recordings and throughout the UDS procedure, both ECG and PPG signals were acquired at a sampling frequency of 1000 samples per second.
ECG processing
ECG pre-processing is shown in Figure 1. R wave identification and visual inspection were performed with Kubios HRV Premium software (Kubios Oy, Kuopio, Finland). 28 Visual inspection was conducted by a trained physician (M.C.-J.) to identify arrhythmias and artifacts and to correct erroneously detected heartbeats. RR intervals derived from signals contaminated by ectopic beats were replaced with interpolated RR intervals (<1% in all recordings) based on an algorithm described by Lipponen and coworkers. 29 Resulting RR intervals were further referred to as NN intervals in allusion to “normal-to-normal” heartbeats, in accordance with international HRV reporting standards. 19 Time domain metrics based on the statistical variation in HRV time series can be used to capture swift and transitory autonomic events. 24
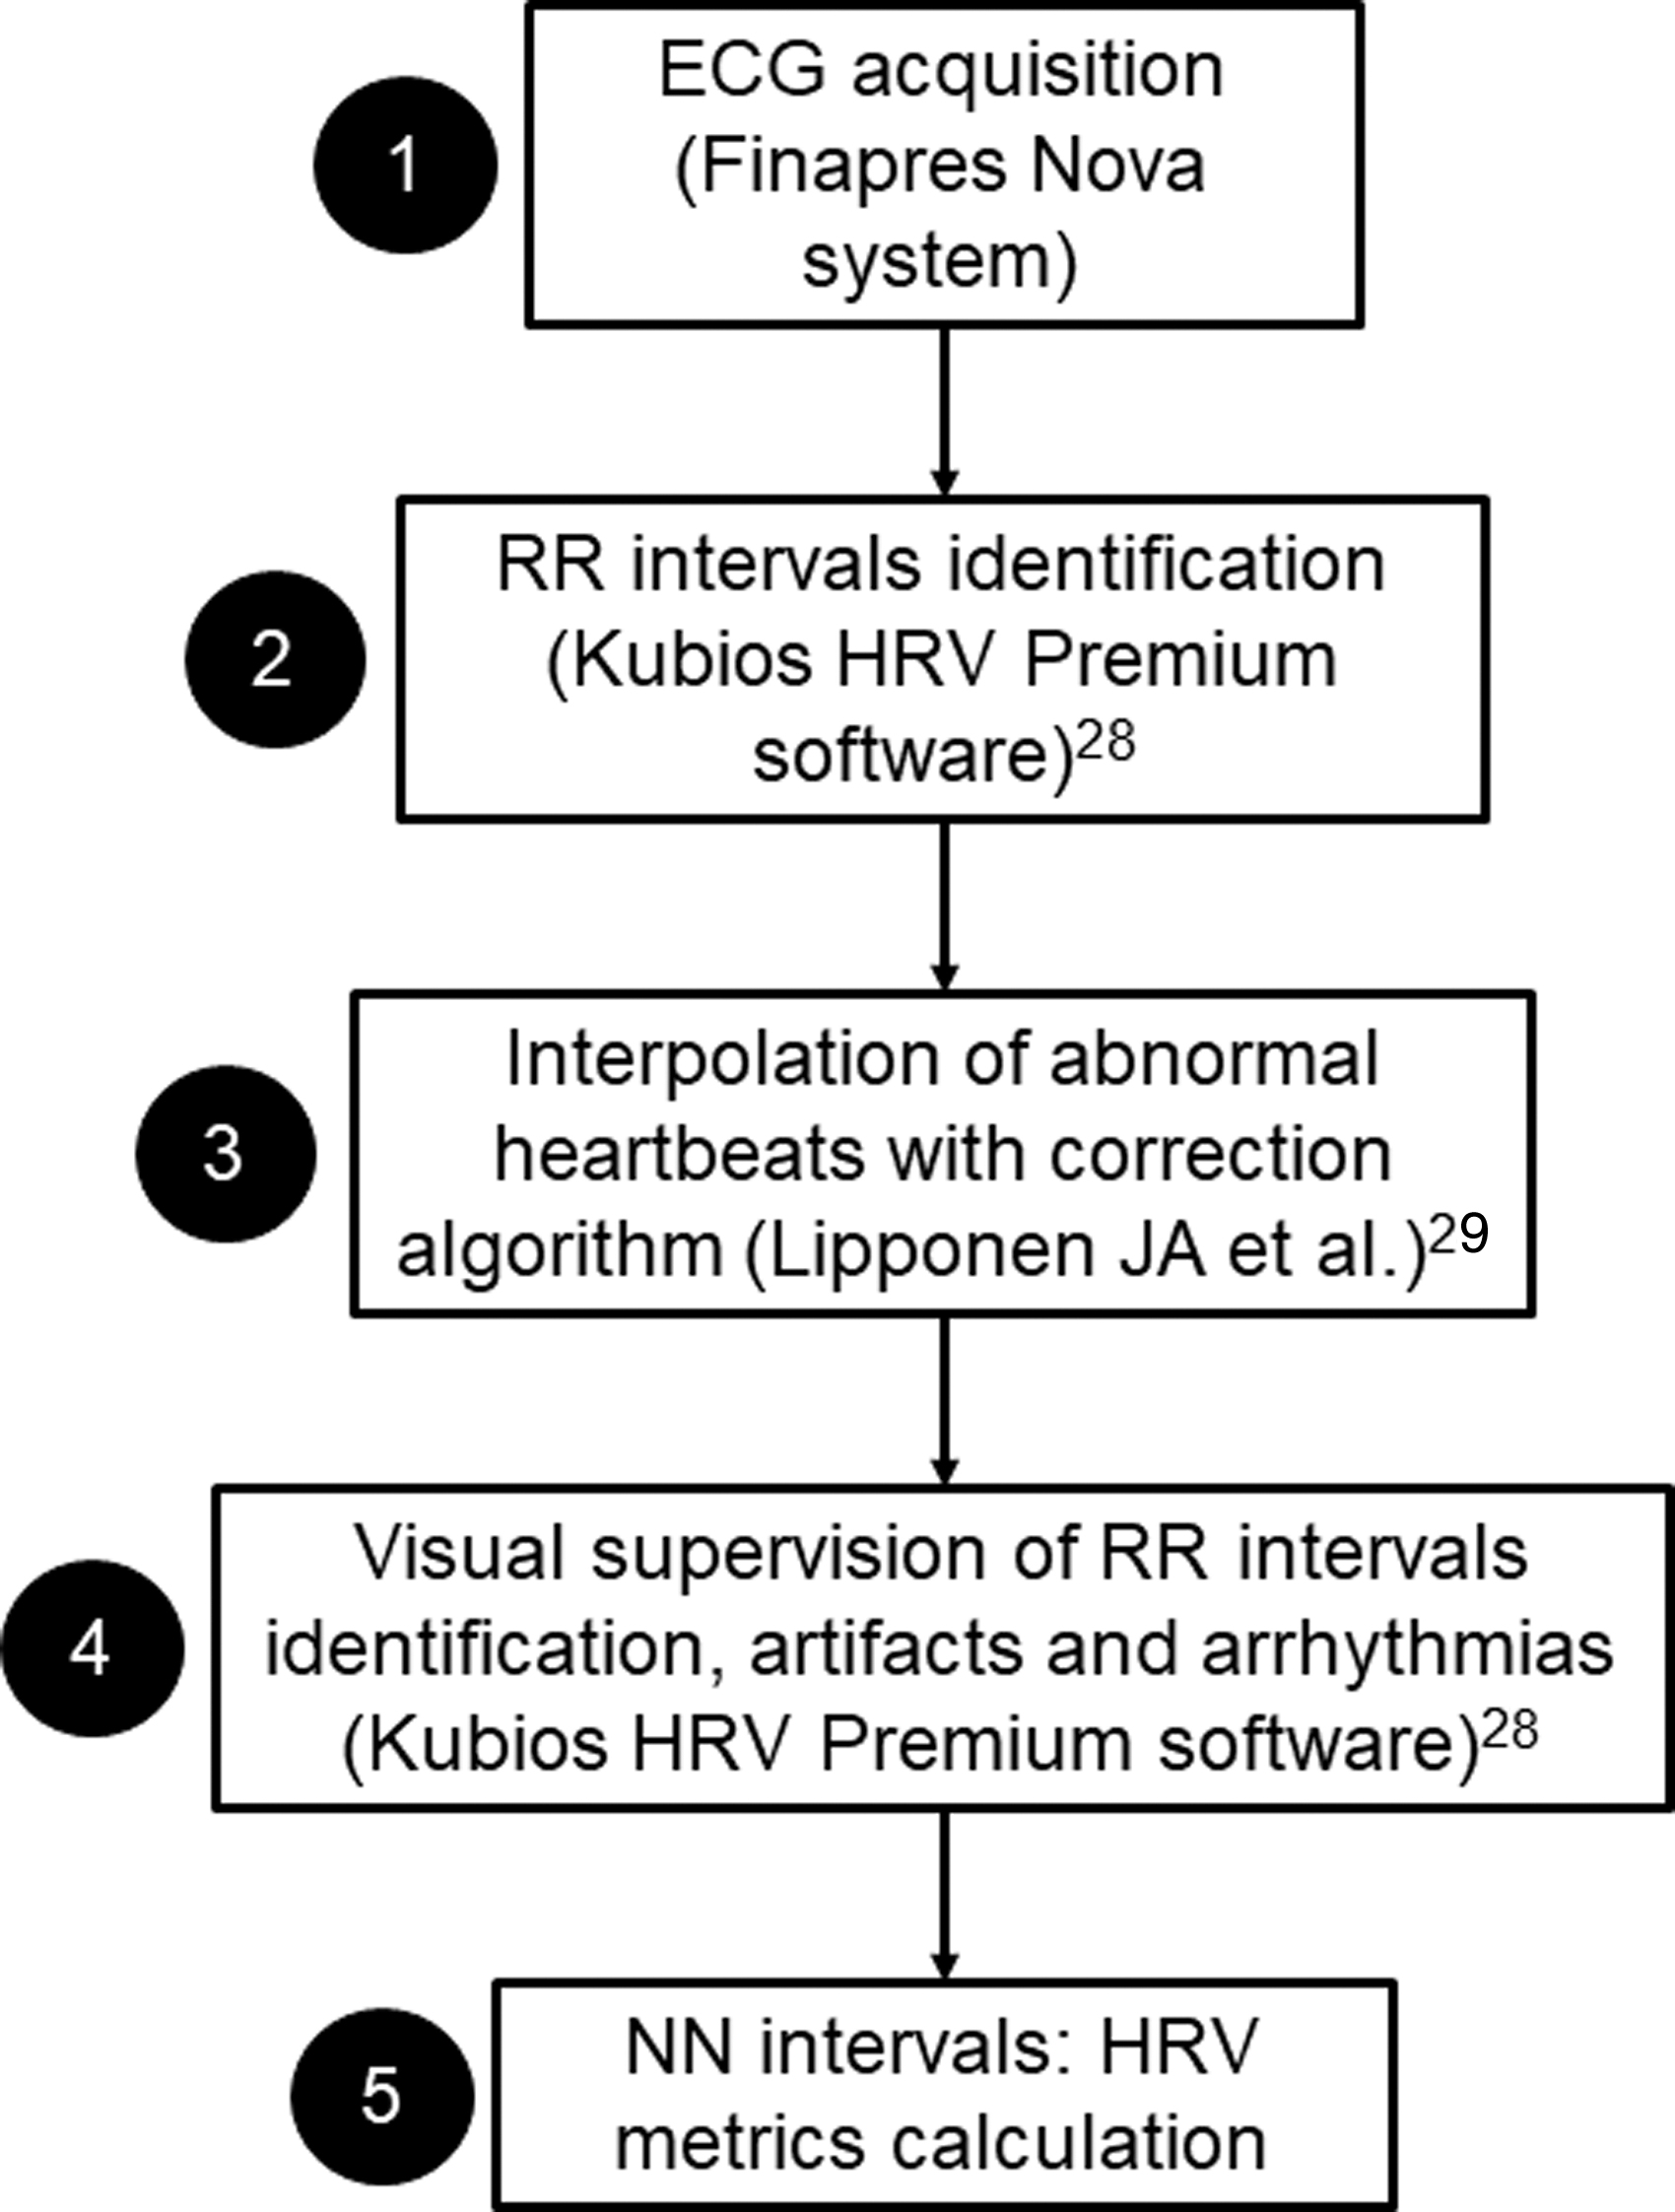
Electrocardiographic (ECG) processing to obtain normal-to-normal (NN) intervals.
HRV
Given the rapid changes in cardiovascular dynamics during AD events (i.e., within a few seconds), 6 we used ultra-short term (UST) HRV analysis using MATLAB R2022b (MathWorks, Natick, Massachusetts, USA). UST HRV is an established method for assessing cardiovascular regulation and vagally mediated activity on the heart. 24 The minimum time period required to estimate standard 5-min HRV for the time-domain metrics (i.e., statistical metrics) is 60 sec. 24 We computed the mean of NN intervals (meanNN), their standard deviations (SDNN) and the square root of the mean of the sum of squared differences (RMSSD) between adjacent NN intervals. 19 Higher meanNN (i.e., slower heart rate) and broader SDNN are reflective of increased parasympathetic outflow to the heart. 30 Conversely, lower meanNN (i.e., faster heart rate) and narrower SDNN reflect increased sympathetic activity. 19 Larger RMSSD reflect rapid changes between consecutive heartbeats, and, therefore, provide an estimate of high frequency variations in heart rate. 19 RMSSD derived from 1-min recordings has demonstrated a strong correlation with parasympathetic activity. 30 The percentage of pairs of adjacent NN intervals differing by >50 ms (pNN50) is tightly correlated, as both are measurements of short-term variation; 19 therefore, we show pNN50 results in the Supplementary Material (Table S1 and Fig. S1).
We measured UST HRV from the start of UDS (i.e., bladder filling) to its end (i.e., complete bladder drainage) using moving windows to obtain HRV metrics updated every second after the start of UDS (i.e., HRV windows have a 98.3% overlap). The first second in which HRV metrics are displayed was obtained with the previous 60 sec of recording. The HRV measurement protocol is showed in Figure 2. A second order autoregressive process was used in Figure 2 to imitate instantaneous heart rate changes to illustrate the protocol. In this work, we compare blood pressure and HRV in four moments during UDS: (1) UDS start (i.e., bladder filling), (2) the lowest point of SDNN (min SDNN) prior to elevation in blood pressure, (3) the first SBP peak (max SBP) after AD onset, and (4) 1 min after max SBP (max SBP +60 sec). SDNN is the simplest HRV metric, and reflects all cyclic components responsible for variability in a given measurement period. 19 Therefore, we chose the moment with the lowest SDNN value before AD to model peak cardiac sympathetic predominance. Here, we investigated the period of time between min SDNN and max SBP after AD onset and explored its potential utility for predicting AD events. However, we also show the min RMSSD point performance to predict AD.
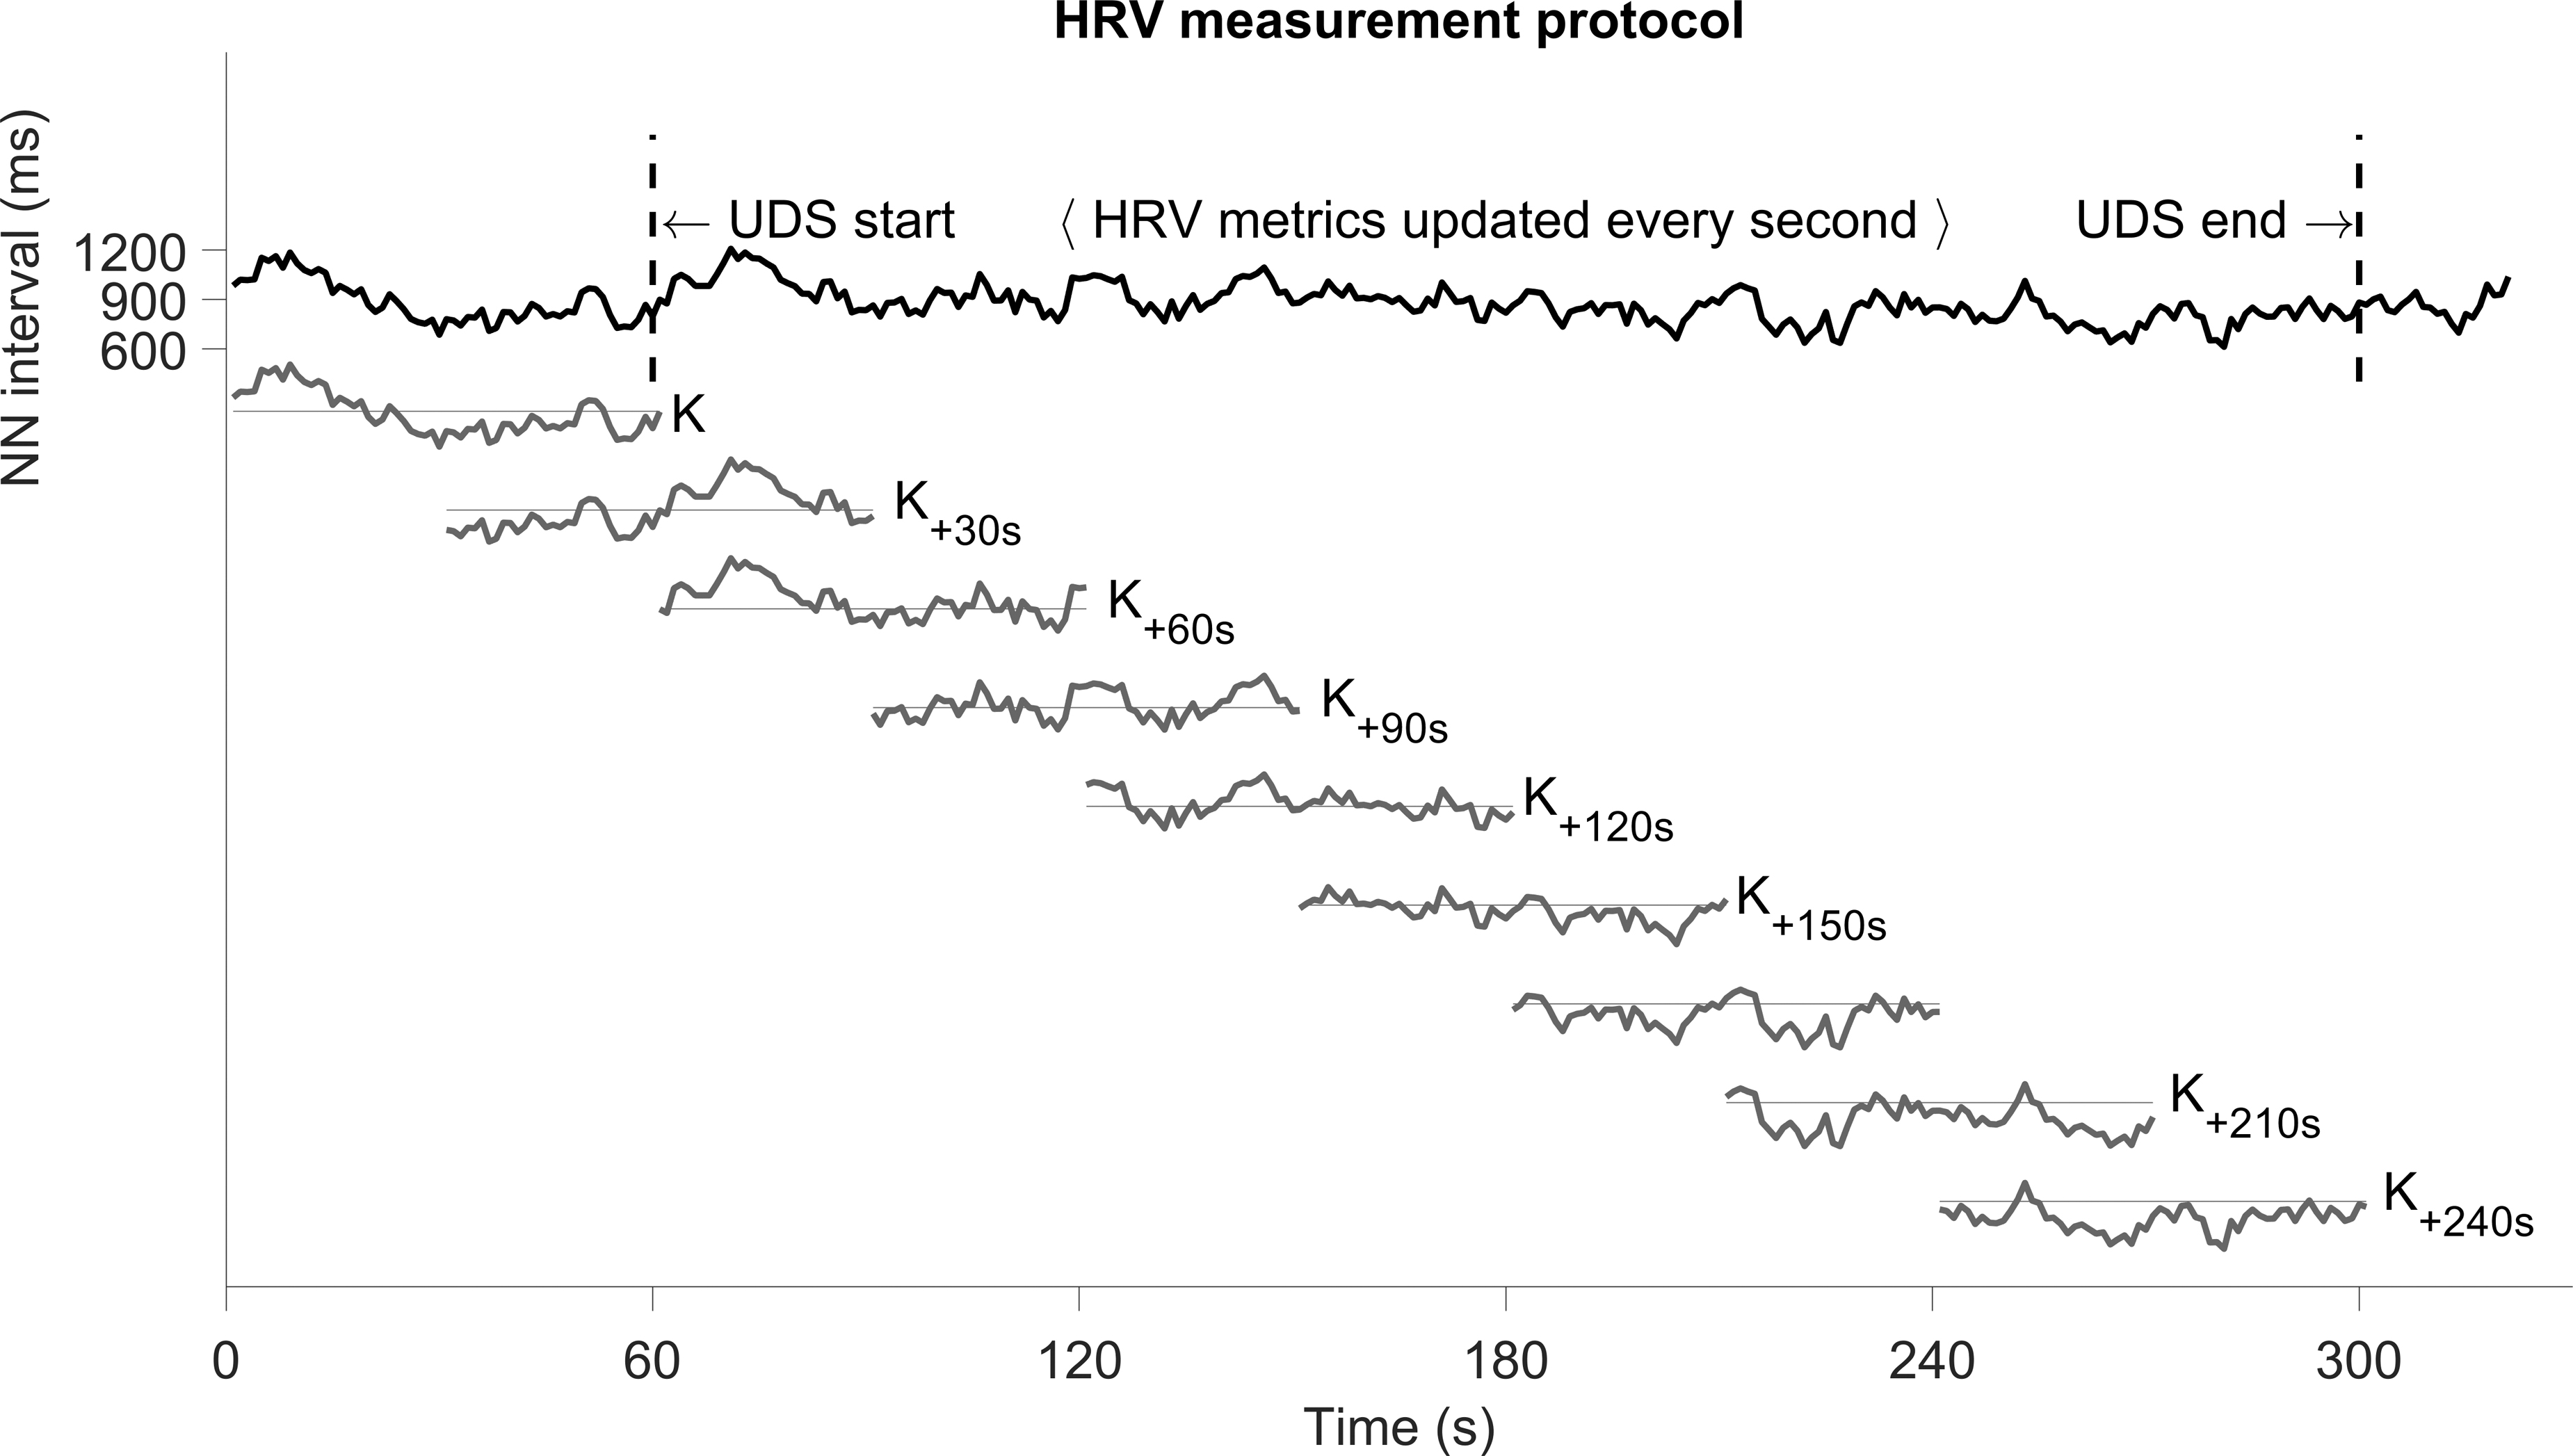
Protocol for heart rate variability (HRV) measurement. The top row shows normal-to-normal (NN) intervals during urodynamic assessments (UDS). The K 60 sec windows for HRV measurements are updated every second to obtain the new value. Here we illustrate the K windows shift every 30 sec (dark gray segments). HRV metrics such as meanNN, standard deviation (SDNN), and root mean square of successive differences (RMSSD), were calculated in every KN window.
Statistical analysis
According to Kolmogorov–Smirnov tests, continuous data did not show a normal distribution and were reported as median and interquartile range (percentile 25–percentile 75). Kruskal–Wallis tests were used to determine differences in median SBP and HRV metrics between four moments during UDS ([1] UDS start, [2] min SDNN, [3] max SBP, and [4] max SBP +60 sec). Wilcoxon signed ranks tests with Bonferroni correction were then used to compare differences between individual moments. Based on the comparison between SBP and HRV parameters, we assessed a prediction performance of selected parameters (SDNN and RMSSD) using receiver operating characteristic (ROC) curve analyses, which were performed using HRV values at UDS start and at min SDNN for all participants. The SDNN cutoff value was determined by the shortest orthogonal distance to the optimal point (0,1) from all ROC curve points. Area under the curve (AUC) values ≤0.55, 0.56–0.63, 0.64–0.70, and ≥0.71) demonstrated very weak, weak, moderate, and strong accuracy of SDNN for predicting AD events, respectively. 31 Sensitivity and specificity were estimated for SDNN and RMSSD. Statistical analyses were performed using MATLAB R2022b (MathWorks, Natick, Massachusetts, USA). Statistical significance was set at an alpha threshold of <0.05.
Results
Figure 3 illustrates the behavior of blood pressure and dynamic changes in heart rate and HRV metrics (meanNN, SDNN, and RMSSD) during an UDS session. In this example, we observed that the lowest SDNN point (i.e., overall statistical variation in the HRV time series) occurred a few seconds before the first SBP peak after AD onset. Also, the RMSSD peak occurred after the SBP zenith.
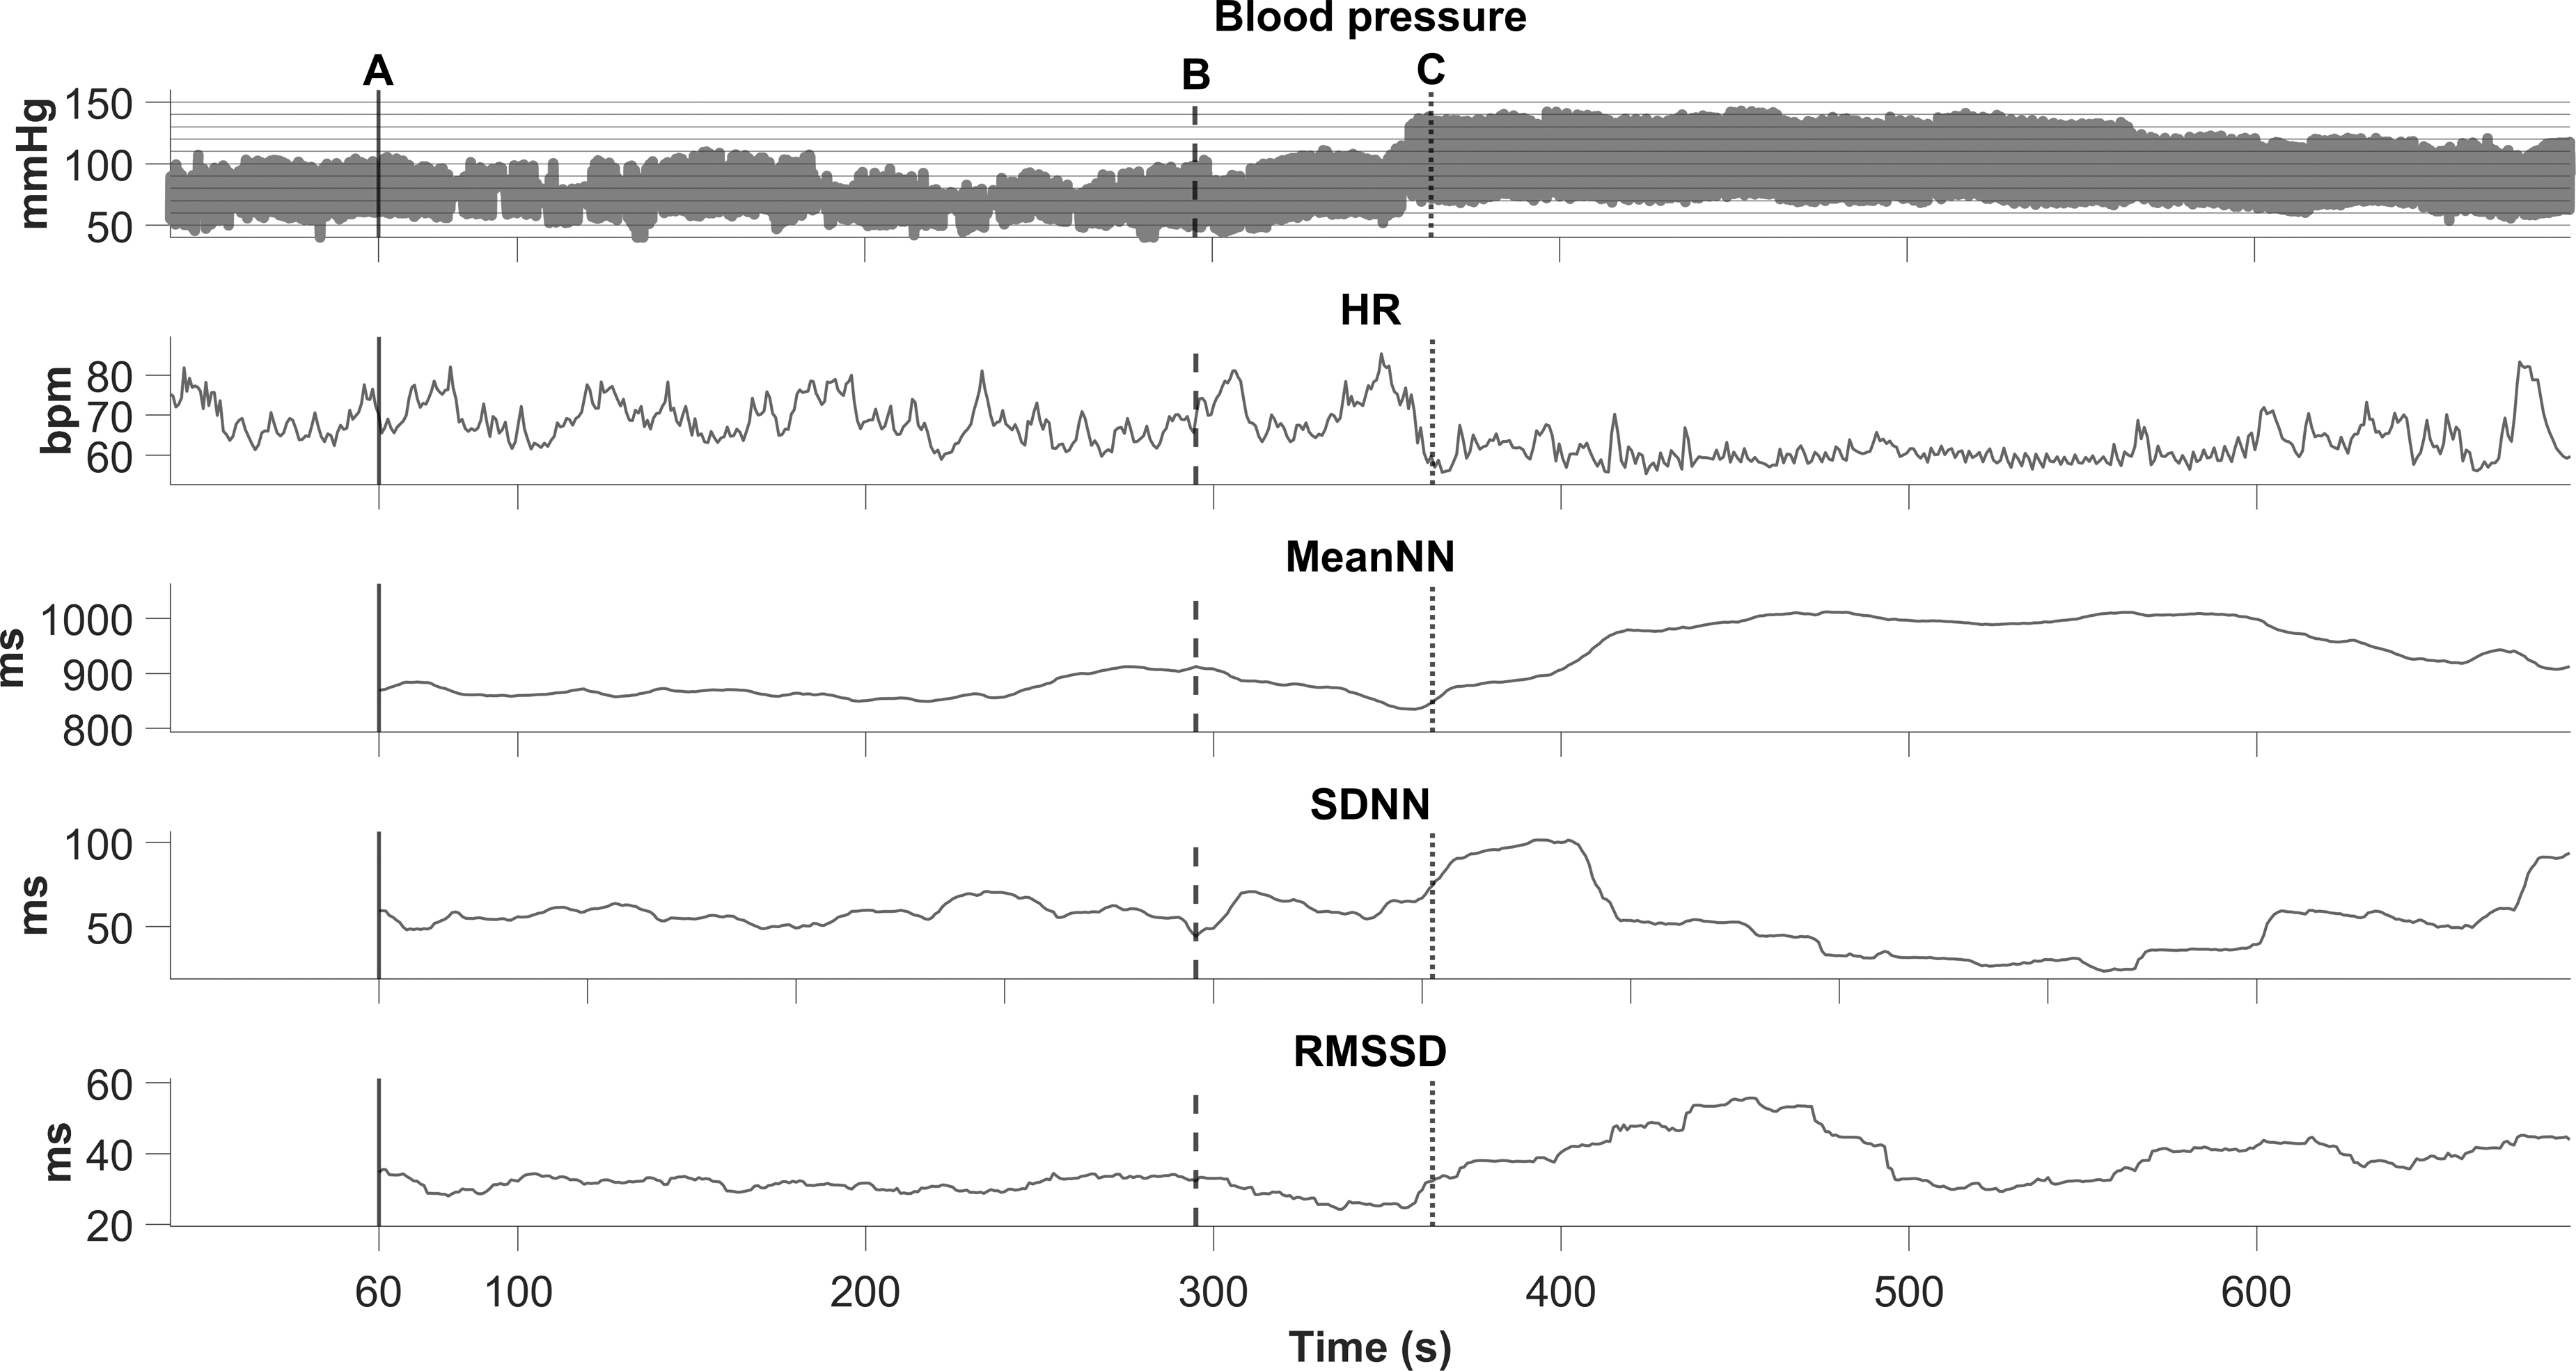
Blood pressure, heart rate (HR) and heart rate variability (HRV) (mean normal-to-normal [meanNN], standard deviation [SDNN] and root mean square of successive differences [RMSSD]) behavior during urodynamic assessments (UDS) in one participant. Example of a 47-year-old female participant (C4, American Spinal Injury Association [ASIA] Impairment Scale [AIS] A, 13 years post-injury).
We further quantified the changes in SBP, meanNN, SDNN, and RMSSD at (1) UDS start, (2) min SDNN, (3) max SBP, and (4) max SBP +60 sec. Figure 4 shows that SBP increases as the UDS session progresses. The largest meanNN value was reached 60 sec after max SBP. SDNN was also higher during max SBP. Additionally, SDNN at max SBP and max SBP +60 sec were significantly higher than the min SDNN moment. RMSSD also decreased at min SDNN and then increased consistently, reaching its highest value at max SBP +60 sec.

Systolic blood pressure (SBP) and heart rate variability (HRV) metrics during urodynamic assessments (UDS) in all subjects.
The point of min SDNN occurred at 240 sec (172–339 sec) before the max SBP point, serving as the time point for early prediction of AD. Given that the bladder filling rate was 30 mL/min and the point of min SDNN occurred 209 sec (124–373 sec) after the bladder filling started, the bladder contained ∼105 mL. When using min SDNN values and SDNN values at UDS start (Fig. 5), it was possible to classify the moment of minimal variability in heart rate, and thus identify distinct physiological changes preceding an AD event. Based on the results of the ROC curve analyses, we were able to anticipate when an AD event was likely to occur with a sensitivity = 0.667 and specificity = 0.875 (SDNN cutoff ≤39.46 ms, p < 0.001). The AUC was also significant, indicating that the accuracy of the SDNN threshold for predicting episodic AD was strong (AUC = 0.811, 95% confidence interval [CI] = 0.688 – 0.934, p < 0.001). Moreover, the min RMSSD point occurred 192 sec (95–287 sec) before the max SBP point, and AUC for AD prediction was 0.668 (95% CI 0.512–824, p = 0.034), sensitivity = 0.625, specificity = 0.708, and RMSSD cutoff value was ≤20.03 ms.
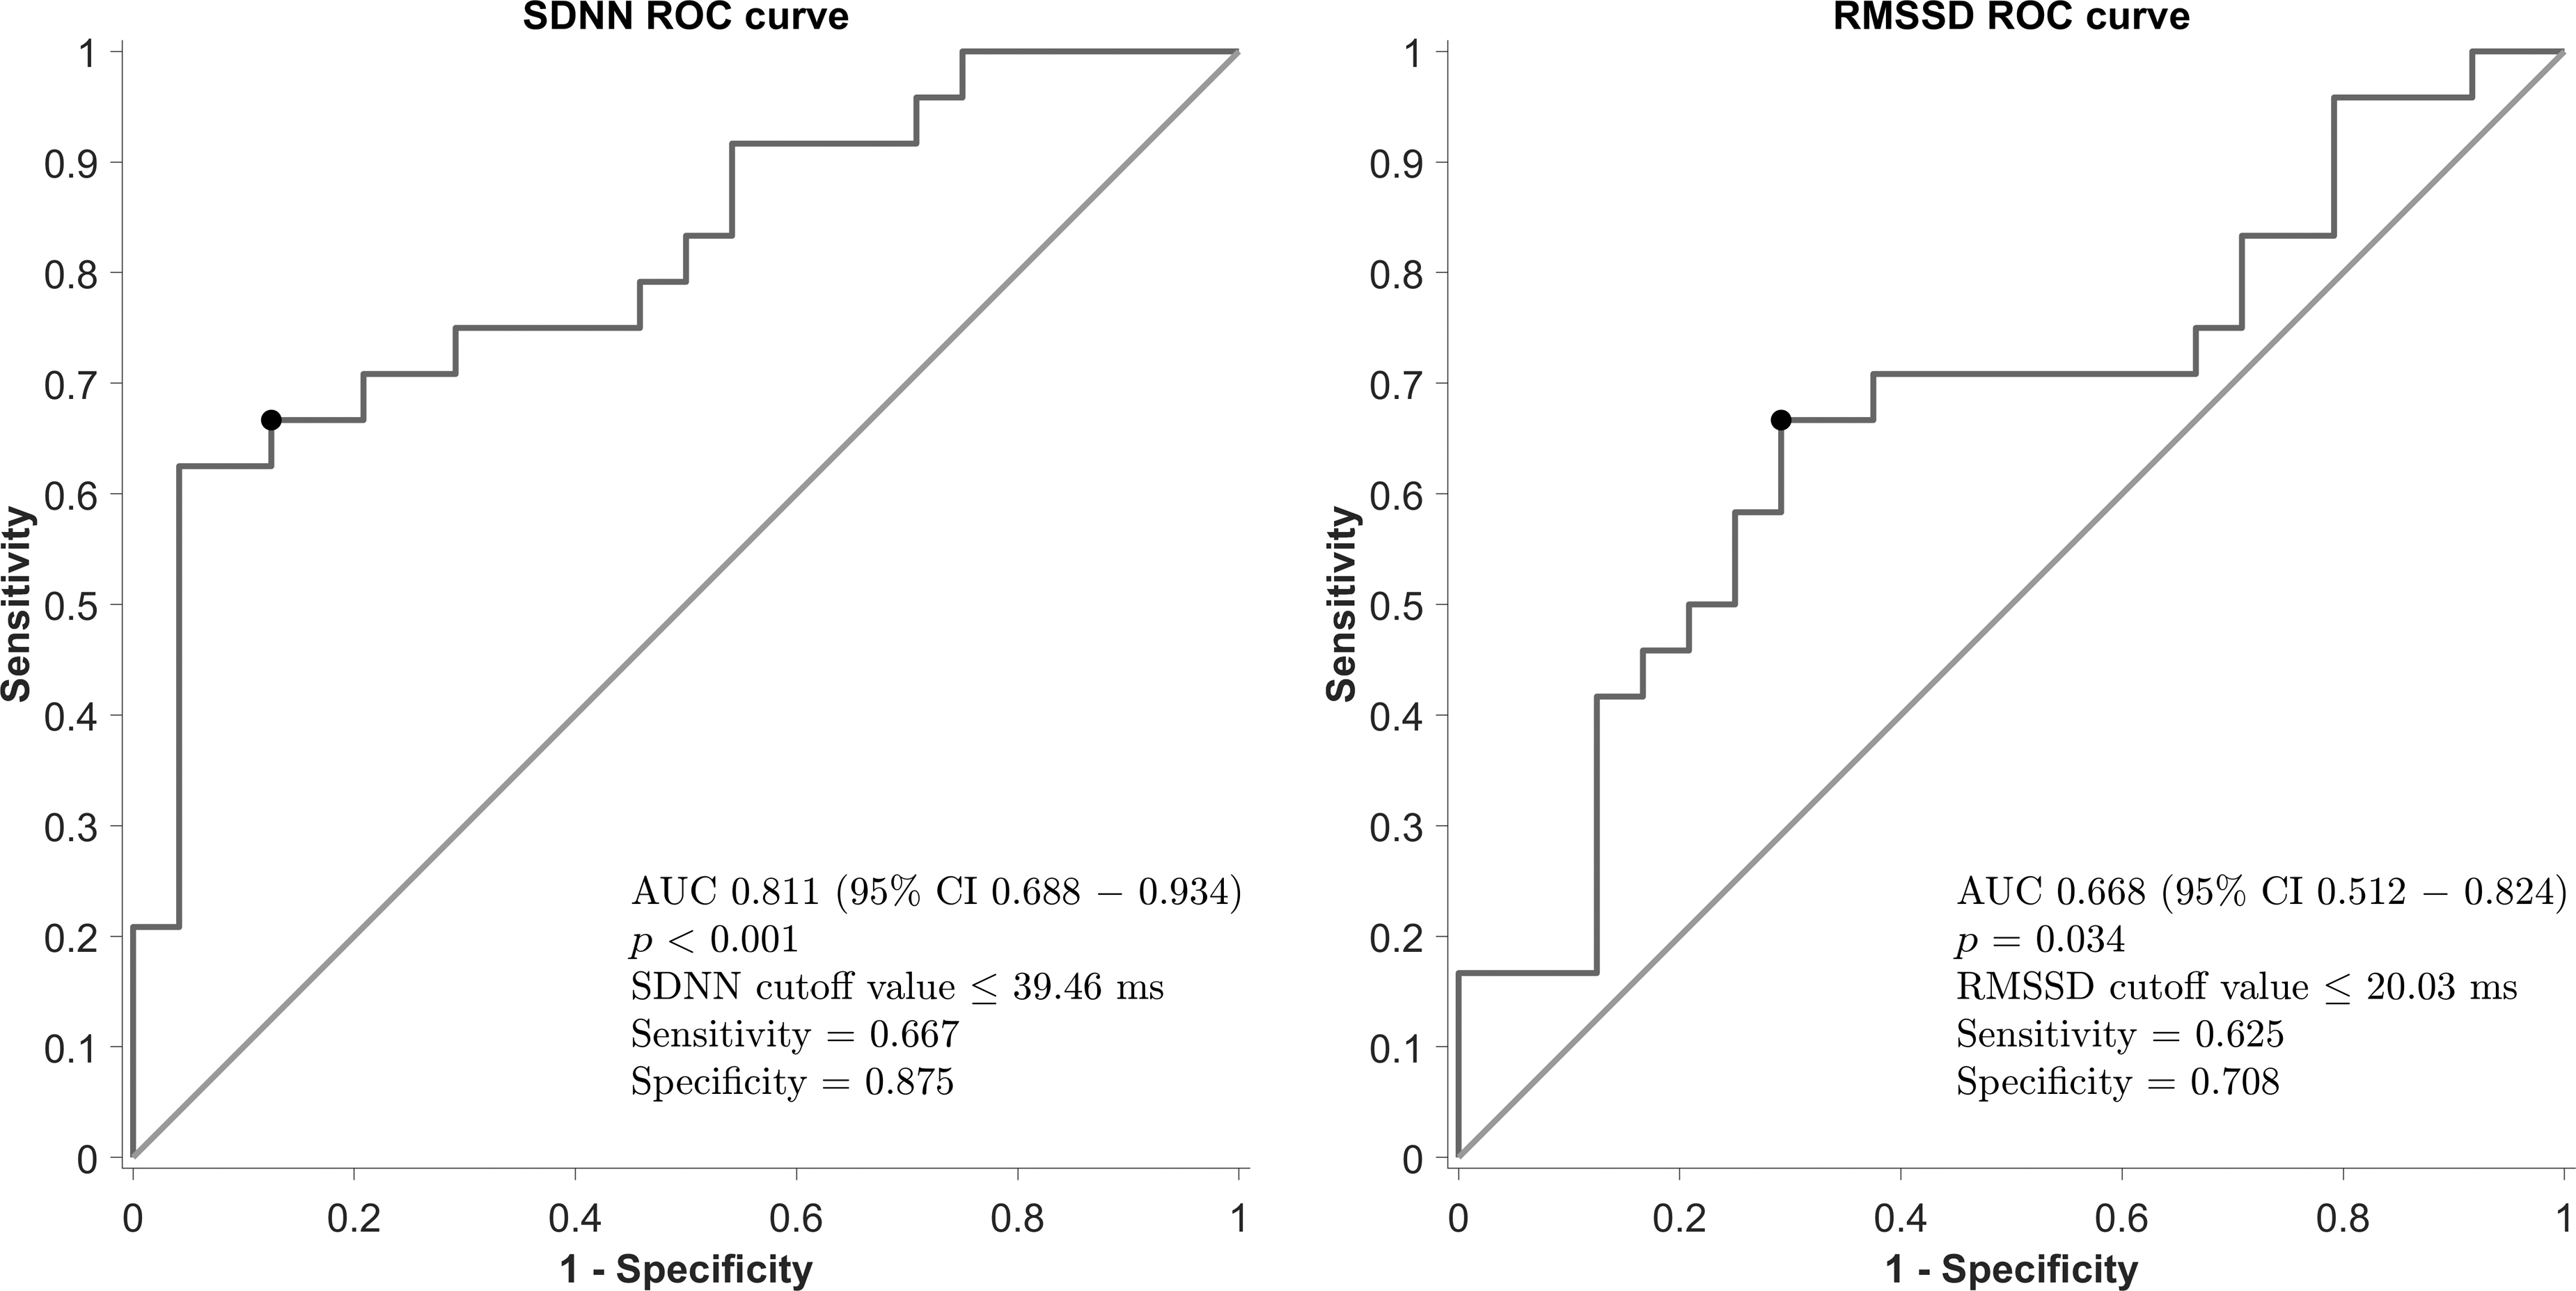
Receiver operating characteristic (ROC) curve analysis and standard deviation of normal-to-normal (SDNN) cutoff identification. The lowest point of variability in heart rate (SDNN), corresponds to the strongest cardiovascular sympathetic outflow. Black point: cutoff values for SDNN and root mean square of successive differences (RMSS).
Discussion
We provide a comprehensive evaluation of UST HRV during UDS in people living with chronic SCI. We showed that SDNN and RMSSD became narrower during the filling phase of UDS, despite the absence of a clinically significant rise in blood pressure (i.e., increase in SBP >20 mm Hg from baseline). Although the meanNN was only significantly larger at max SBP +60 sec, SDNN increased during AD events. Interestingly, RMSSD increased during all UDS sessions, reaching its peak at max SBP +60 sec, indicating an increase in parasympathetic output to the heart. 24 However, after reaching its sympathetic peak at the min SDNN time point, the parasympathetic branch of the autonomic nervous system becomes predominant during AD events. Furthermore, we demonstrated how sympathetic overstimulation precedes AD events (SDNN ≤36.46 ms), similar to cardiovascular stress during hemodialysis 21 and myocardial ischemia-reperfusion injury. 32 According to our results, SDNN may be of clinical utility in predicting AD events with high prognostic accuracy (AUC >0.71). 31
Several factors may influence human HRV, such as body position, pathological conditions (e.g., inflammation), environmental factors (e.g., noise and social stress), and psychological and genetic contributions, 33 as well as the measurement conditions (controlled scenarios vs. ambulatory measurements). 34 A study comparing short-term HRV (5 min) over 24 h in SCI and able-bodied individuals during ambulatory conditions showed that individuals with SCI had a decreased meanNN and SDNN. However, they also showed an increase in RMSSD values. 35 Another study involving HRV assessment in individuals with SCI in the supine position 23 showed a larger meanNN compared with that in able-bodied individuals. In the same work, the spectral analysis of HRV also indicated parasympathetic predominance in SCI, with greater parasympathetic activity observed among individuals with higher injury levels (i.e., cervical versus thoracic SCI). 23 Interestingly, a previous study including only participants with SCI below T5 in the supine position 36 also found that meanNN and SDNN were higher when compared with the control group. This suggests that even subjects with lower-level injuries show sympathetic downregulation during resting conditions. 36 Further, a work comparing individuals with cervical injury and those with injury below T1, showed no significant difference in RMSSD between these groups. 37 RMSSD was found to be lower in individuals with SCI in a seated position than in able-bodied individuals. 37 In the same study, SDNN was also lower in individuals with SCI. These studies suggest that postural changes may influence this metric in other contexts outside of UDS.
A study evaluating HRV during UDS in able-bodied individuals found that frequency domain metrics such as low-frequency to high-frequency ratio increased throughout the UDS procedure and were related to the first sensation of filling, first sensation to void and strong urge to void. 22 This suggests that sympathetic tone of the cardiovascular system increases as the bladder fills. However, previous research in SCI has shown that meanNN, SDNN, and RMSSD (over 5 min) increased during the filling phase of UDS (i.e., when AD events are likely to occur) in comparison with baseline conditions in individuals with SCI at or above T6. 18
In the present study, the temporary decrease in SDNN and RMSSD that we observed may be indicative of increased sympathetic tone. However, changes in HRV metrics at later stages (when AD occurs) also indicate an increase in parasympathetic activity on the heart during AD events that overshadow the sympathetic stimulation. Initially, the filling of the bladder represents a noxious stimulus that triggers a sympathetic response below the level of injury (point of min SDNN). This response causes an uncontrolled vasoconstriction in the splanchnic and lower limb vasculature. 38 As sympathetic innervation of the heart and upper limb vasculature has its origin in the T1–T5 spinal cord segments; 39 injuries above T6 result in an unregulated sympathetic response causing a narrower HRV. 15 The increase in blood pressure provokes the activation of baroreceptors in the aortic arch and carotid sinuses. 40 This baroreflex increases parasympathetic output to the heart (broader HRV) via the vagus nerve, 40 which remains intact following SCI. In parallel, there is a reduced excitation of sympathetic neurons above the level of injury. 5 According to our results, maximal sympathetic outflow to the heart corresponded with narrowest point of SDNN during UDS. Consequently, the peak in parasympathetic outflow to heart during AD was consistent with the increase in parasympathetic HRV markers (i.e., high RMSSD and SDNN).
Limitations and perspectives
The generalizability of our results may be limited by the small sample size and the intrinsic biological variability among people with SCI. 41 Given the focus of UST HRV in this work, it is not suitable to obtain HRV metrics based on the frequency domain, as these require longer periods of time to be robustly assessed. However, the methods proposed in the current study may not only be useful for enhancing AD prediction during UDS procedures, but may have applicability in everyday scenarios that potentially trigger episodic AD in people with SCI (e.g., bladder management routines). Additionally, the predictive model employed here can be implemented in tandem with complementary therapeutic strategies for preventing AD, such as spinal cord stimulation (SCS). Recent reports from our group have shown that epidural and transcutaneous SCS were able to prevent AD triggered by visceral stimulation. 6,42 Further, SCS may improve detrusor overactivity during UDS in people with SCI. 43 When applied concomitantly, these tools may help to prevent AD during UDS and daily bladder management, whereas SCS may impact parameters of UDS in individuals with SCI. Nonetheless, further research is needed to explore the application of our predictive model and SCS to prevent AD.
Conclusion
UST HRV dynamics assessed in this study show that in the early phase of bladder filling, there is a sympathetic predominance in autonomic cardiac control in people with SCI during bladder filling. Later, when AD is present, a marked parasympathetic outflow to the heart is observed. Here, we show that these distinct changes in UST HRV can be used to predict AD caused by bladder distension in people living with SCI. The approach presented in this work might be helpful for applying targeted interventions to prevent AD before its onset.
Transparency, Rigor, and Reproducibility Summary
The studies from where the present data were obtained were pre-registered at https://clinicaltrials.gov, identifiers NCT02298660 and NCT04604951. A sample size of 20 subjects was planned based on ROC, curve analysis, with type I error 0.5, power 0.8, ROC curve of ≥0.8, and an allocation ratio of 1. Twenty-four participants with a full electrocardiographic continuous recording were available and included in this study. The data sets used and/or analyzed during the current study are available from the corresponding author on request.
Footnotes
Authors' Contributions
M.C.-J. was responsible for conceptualization, methodology, software, formal analysis, investigation, data curation, writing – original draft, writing – review and editing, and visualization. T.M. was responsible for conceptualization, methodology, investigation, data curation, writing – original draft, and writing – review and editing. S.S. was responsible for conceptualization, methodology, investigation, writing – original draft, and writing – review & editing. C.S. was responsible for conceptualization, methodology, investigation, writing – original draft, and writing – review and editing. R.N.M. was responsible for conceptualization, methodology, investigation, writing – original draft, and writing – review and editing. R.S. was responsible for conceptualization, methodology, writing – review and editing, and funding acquisition. T.W.D. was responsible for conceptualization, methodology, writing – original draft, and writing – review and editing. A.V.K. was responsible for conceptualization, methodology, writing – review and editing, supervision, project administration, and funding acquisition.
Funding Information
All equipment used for this study was funded via grant support by the Canadian Foundation for Innovation/BC Knowledge Development Fund (CFI/ BCKDF) (35869). Principal investigator was A.V.K. A.V.K. holds an endowed chair in rehabilitation medicine, University of British Columbia, and his laboratory is supported by funds from the Canadian Institute for Health Research (PJT-156033), Rick Hansen Foundation (35869 IOF), Praxis Spinal Cord Institute (#G2021-30), United States Department of Defense (W81XWH-22-1-0929), International Spinal Research Trust (#GR019728), and the Wings for Life Spinal Cord Research Foundation (WFL-CA-20/21). M.C.-J. is supported by the Paralyzed Veterans of America Fellowship (#3202). T.M. is supported by a Michael Smith Foundation for Health Research post-doctoral fellowship award (#RT-2022-2752) and the Rick Hansen Foundation (#2007-21). S.S. is supported by a Paralyzed Veterans of America post-doctoral fellowship award (#3190), the Rick Hansen Foundation (#2007-21), and the Wings for Life Spinal Cord Research Foundation (#2020_097). C.S. is supported by Paralyzed Veterans of America (#3189), the Rick Hansen Foundation (#2007-21), and the Canadian Institute for Health Research (#489969). R.N.M. is supported by the Paralyzed Veterans of America Fellowship (#3196). R.S. is supported by Wings for Life Spinal Cord Research Foundation (Proj. 260) and the United States Department of Defense (SC21007). The authors acknowledge the support of the Praxis Spinal Cord Institute (G2021-34) for the research planning and the International Spinal Research Trust (BBS 004) as the major funder of this study. The sponsors of the study had no role in study design, data collection, data analysis, data interpretation, or writing of the report.
Author Disclosure Statement
No competing financial interests exist.
Supplementary Material
Supplementary Figure S1
Supplementary Table S1
References
Supplementary Material
Please find the following supplemental material available below.
For Open Access articles published under a Creative Commons License, all supplemental material carries the same license as the article it is associated with.
For non-Open Access articles published, all supplemental material carries a non-exclusive license, and permission requests for re-use of supplemental material or any part of supplemental material shall be sent directly to the copyright owner as specified in the copyright notice associated with the article.
