




Abstract
Progression of intracranial hemorrhage is a common, potentially devastating complication after moderate/severe traumatic brain injury (TBI). Clinicians have few tools to predict which patients with traumatic intracranial hemorrhage on their initial head computed tomography (hCT) scan will progress. The objective of this investigation was to identify clinical, imaging, and/or protein biomarkers associated with progression of intracranial hemorrhage (PICH) after moderate/severe TBI and to create an accurate predictive model of PICH based on clinical features available at presentation. We analyzed a subset of subjects from the phase II double-blind, multi-center, randomized “Prehospital Tranexamic Acid Use for TBI” trial. This subset was limited to the placebo arm of the parent trial with evidence of hemorrhage on the initial hCT and a follow-up hCT 6 h after. PICH was defined as an increase in hemorrhage size by 30% or more, or the development of new hemorrhage in the intra- and extra-axial intracranial vault between the initial and the follow-up hCT. Two independent radiologists evaluated each hCT, and conflicts were adjudicated by a third. Clinical and radiographic characteristics were collected, along with plasma protein biomarkers at admission. Principal component analysis (PCA) was performed, and each principal component (PC) was interrogated for its association with PICH. Finally, expert opinion and recursive feature extraction (RFE) were used to select input features for the construction of several supervised classification models. Their ability to predict PICH was quantified and compared. In this subset of subjects (n = 104), 46% (n = 48) demonstrated PICH. Univariate analyses showed no association between PICH and age, sex, admission Glasgow Coma Scale (GCS), GCS motor subscore, presence of midline shift, admission platelet count or admission INR. Radiographic severity scores (Marshall score [p = 0.007], Rotterdam score [p = 0.004]), and initial hematoma volume [p = 0.005] were associated with PICH. Higher levels of admission glial fibrillary acidic protein (p < 0.001) and MAP (p = 0.011) were also associated with PICH. Of the PCs, PC1 was significantly associated with PICH (p = 0.0125). Using multimodal data input, machine learning classifiers successfully discriminated patients with or without PICH. Models composed of machine-selected features performed better than models composed of expert-selected variables (reaching an average of 77% accuracy, AUC = 0.78 versus AUC = 0.68 for the expert-selected variables). Predictive models utilizing variables measured at admission can accurately predict PICH, confirmed by the 6-hour follow-up hCT. Our best-performing models must now be externally validated in a separate cohort of TBI patients with low GCS and initial hCT positive for hemorrhage.
Introduction
Traumatic brain injury (TBI) is one of the most common causes of acquired brain injury in the United States—there are more than 600 hospitalizations and 190 deaths each day from TBI in this country alone. 1 For patients with head computed tomography (hCT) positive for TBI, progression of intracranial hemorrhage (PICH) is a frequent and potentially devastating source of secondary brain injury. It is associated with longer ICU stays and poorer neurological outcomes, including mortality. 2 − 3 PICH occurs in about 50% of patients with hemorrhage on the initial CT scan, and of those with PICH about 40% required decompressive surgery in one study. 4 PICH usually occurs in the first 36 h after injury, 3 especially during the first 6 h, which has motivated many trauma centers to perform a subsequent 6-h follow-up hCT.
Even though PICH may be a modifiable source of secondary brain injury after TBI, clinicians currently are reliant on serial hCT scans and clinical exams for its detection. However, once PICH has manifested radiographically or clinically, it may be too late to ameliorate the damage PICH has caused. Thus, there is an urgent need for identifying early warning signs of PICH, which might allow timely medical interventions. Previously, our group created linear regression models using pre-hospital variables of age, sex, and Glasgow Coma Scale (GCS) score in the field to predict PICH. We observed mixed results on prediction accuracy when adding blood-based biomarker levels to the model. 5 However, this work was limited by a small repertoire of clinical features and biomarkers, as well as the sole consideration of linear modeling methods.
The objective of this investigation was to identify a clinical, imaging, and/or protein biomarkers associated with PICH after moderate/severe TBI (GCS 3–12) from a more comprehensive set of features, and to create an accurate predictive model of PICH based on clinical features available at presentation. We also sought to examine a subgroup of subjects with PICH whose expansion occurred in the brain parenchyma, or “intraparenchymal progression of intracranial hemorrhage” (IPPICH), as the mechanism is likely distinct from other types of hemorrhage progression (e.g., epidural or subdural hematoma expansion, etc.).
Methods
Subjects
A subset of subjects from the phase II double-blind, multi-center randomized controlled trial, “Prehospital Tranexamic Acid Use for Traumatic Brain Injury” (TXA for TBI) were examined. We limited our investigation to the subjects in the placebo arm of the parent trial with any hemorrhage in the intracranial vault on the initial CT scan (“CT positive”) who also had a follow-up CT scan performed between 3 and 18 h after the initial CT. Patients with no evidence of injury on the initial scan were excluded. Methods of the parent trial have been published elsewhere, 6 but, in brief, the parent trial enrolled adult patients with moderate/severe TBI defined as a GCS score of 3–12 who were not in shock (systolic blood pressure ≥90 mm Hg) to compare the efficacy and safety of early prehospital TXA versus placebo. Additional criteria for enrollment in the parent study can be found in the U.S. National Institutes of Health database (ClinicalTrials.gov NCT01990768). Subjects were recruited by 20 trauma centers at 12 regional sites in the United States and Canada between May 2015 and March 2017. Subjects with an estimated time from injury to hospital arrival of less than 2 h were enrolled in the pre-hospital setting. Upon hospital arrival and before any surgical procedures, blood samples were collected, centrifuged, aliquoted, and stored at −80°C for batch analysis. An hCT scan was performed to evaluate for ICH. Conventional coagulation studies [platelet count, international normalized ratio (INR)] were performed per standard of care and abstracted from the medical record.
Radiographical techniques
For the purposes of this investigation, PICH was defined as an increase in hematoma size by 30% or more, or the development of new hemorrhage in the intra-axial and/or extra-axial intracranial vault between the admission/baseline and follow-up hCT.
This definition is in line with previous studies of PICH, 3 − 4 as well as being consistent with our previous work. 5 Two independent neuroradiology fellows (PL, TF) evaluated each hCT for PICH, and conflicts were adjudicated by a third board-certified neuroradiologist (JP). Interrater reliability was assessed between raters 1 and 2 with a kappa statistic using GraphPad QuickCalcs website: http://www.graphpad.com/quickcalcs/kappa2 (accessed August 2023). We pre-specified a subgroup within PICH of subjects with progression of intra-axial hemorrhage (e.g., intraparenchymal hematoma expansion or “IPPICH”) excluding subarachnoid hemorrhage. Patients that underwent craniectomy or craniotomy were not excluded from the analysis. If a hemorrhage present on the initial scan was evacuated before the subsequent scan, this was not considered progression unless an expanded or new hemorrhage not clearly attributable to surgery was visible on the follow-up scan.
Biomarker analysis
Glial fibrillary acidic protein (GFAP) and ubiquitin C-terminal hydrolase L1 (UCH-L1) levels were measured in duplicate for each sample using a validated enzyme-linked immunosorbent assay (ELISA) platform (Banyan Biomarkers Inc. San Diego CA) as described previously. 7 As previously reported, microtubule-associated protein-2 (MAP-2) levels were measured using an ELISA assay. 8 Plasma concentrations of markers of endothelial function angiopoietin-1 (ang-1), angiopoietin-2 (ang-2), syndecan-1, thrombospondin-2 (TSP-2), thrombomodulin, intercellular adhesion molecule 1 (ICAM-1), vascular adhesion molecule 1 (VCAM-1), markers of inflammation interleukin-6 (IL-6), and tumor necrosis factor alpha (TNF-a) were determined by multiplex immunoassay analysis (R&D Systems, Minneapolis, Minnesota) using the Luminex xMAP analytical system (xMAP technology, Austin, Texas). Any samples registering a signal over the upper limit of quantification were diluted and reassayed.
Data reporting and pre-processing
Descriptive statistics with means (± SD) for continuous parametric variables, medians [min–max] for non-parametric variables, and percentages of categorical variables, as appropriate, are reported. Protein biomarker levels were log-transformed for analysis, as below. Group comparisons between those subjects with and without PICH or IPPICH were examined with t-tests for continuous parametric data, chi-squared tests for categorical data, and rank-sum tests for ordinal and continuous non-parametric data, as appropriate, and p values are reported. Associations between PICH or IPPICH, and outcomes were assessed with linear and logistic regression models and β coefficients or x, and p values are reported, as appropriate.
There were no missing demographic data (e.g., age, sex, etc.) or missing initial CT characteristics (e.g., presence of subarachnoid hemorrhage, skull fracture, etc.). Laboratory values ranged from low rates of missingness (e.g., platelet count 0% missing) to higher rates. The damage-associated protein biomarkers (e.g., GFAP, UCH-L1, and MAP) were missing in <1% of subjects. The endothelial function/inflammatory panel (e.g., ang-1, ang-2, syndecan-1, TSP-2, thrombomodulin, ICAM-1, VCAM-1, IL-6, and TNF-a) were run separately and were missing in 12.5% of subjects. Coagulation studies were missing the most frequently; INR 18% missingness, fibrinogen 75% missingness. Fibrinogen was excluded from this analysis. Missing predictor values in numeric columns were addressed using the IterativeImputer (version 1.3.2) from the scikit-learn library. 9 This method employs a multiple imputation by chained equation method to model each feature with missing values as a function of other features and uses that estimate for imputation. For variables with greater than 20% missing, both a complete case analysis and an imputed analysis were conducted with similar results, thus the imputed results are presented and the complete case analysis is included in the supplementary materials (Supplementary Fig. S1 and S2). Missing outcomes (GOSE at 6 months) were imputed with multiple imputations for the primary analysis as detailed in the original article, and those same imputed values were used for analysis in this study.
Principal component analysis
The experimental workflow is summarized in Figure 1. To address the high dimensionality of the dataset and to identify the underlying structure, Principal Component Analysis (PCA) was employed. Using PCA, the original features were transformed into a new set of orthogonal components that captured the maximum variance in the data. We standardized our dataset to have a mean of zero and a standard deviation of one for each feature. We applied logarithmic transformations to ensure that the features did not deviate significantly from normality to assist in the visualization of results. The resulting principal components (PCs) represent the directions of maximum variance. This method enabled a significant reduction in dimensionality while retaining the majority of the data’s original variance. To visually assess the separation between PICH presence, group identity was overlaid on the PCA score plots and Student’s t-test was used to provide insight into the degree of differentiation and potential clustering patterns inherent in the transformed data space. The same workflow was applied using IPPICH as the binary outcome variable.

Summary of experimental workflow.
Feature selection: expert informed
The expert-informed list was selected based on traditional statistical methods and contained variables that reached or trended toward significance (p < 0.05) in a group comparison.
Feature selection: machine determined
Recursive Feature Elimination with Cross-Validation (RFECV) was applied to identify an optimal set of features for the defined outcome variable (PICH or IPPICH). This was executed for three distinct estimators: Decision Tree Classifier, Logistic Regression, and Random Forest Classifier, all from Scikit-learn (version 1.3.2). The RFECV algorithm allows flexibility in the estimator used to determine the optimal list of variables. In our study, we used random forest, decision tree, and logistic regression as estimators and selected the “optimal” list of variables based on stability of the lists generated across multiple trials and subsequent model performance. The number of features selected by RFECV was visualized against the cross-validation score, and feature importance metrics were extracted and plotted for each classifier.
The RFECV estimator with the best cross-validation score was used to determine feature list for subsequent analysis. 10
Supervised classification
Five supervised classifiers were utilized for the analysis: support vector machine (SVM), decision tree, random forest, linear discriminant analysis (LDA), and multi-layer perceptron (MLP). For each classifier, a 10-fold cross-validation was performed on the dataset with one of two input lists, 1) expert-selected variables or 2) variables identified by RFECV. Model performance was quantified by accuracy (±95% confidence interval [CI]), true-positive rate (TPR), and false-positive rate (FPR). Receiver operating characteristic (ROC) curves were then constructed and visualized for each classifier, and the area under the curve (AUC) was computed. Performance metrics of models trained using the expert-selected variables was compared with models trained using RFECV-selected variables.
Plots were generated using the Matplotlib (version 3.4.2) and Seaborn (version 0.11.1) libraries. 11 This includes RFECV feature importance plots, cross-validation score plots, classifier accuracy bar plots, and ROC curves. Code will be made available through Github repository upon publication.
Results
Progression of intracranial hemorrhage (PICH) and intraparenchymal hematoma expansion (IPPICH)
Of the 309 patients randomized to placebo that were included in the primary analysis, 171 had ICH on the initial hCT. Of these patients, 41 had a baseline scan only, 21 had a follow-up scan outside the 18-h time window, and 5 patients had imaging that was of too poor quality to interpret or was missing. Of the 41 subjects with only baseline imaging, 24 (59%) died during the hospitalization compared with 16 (15%) of those patients with follow-up imaging. The median admission GCS for this group was 5 [3–7].
As a result, 104 subjects were included for this analysis (Placebo “subset”). Blood samples were drawn an average of 47 ± 37 min after injury. Follow-up CTs occurred a mean of 6.25 (±1.77) h from the initial CT. Nearly half of the subjects analyzed (46%, n = 48) demonstrated PICH. A little more than half of those subjects who progressed were driven by intraparenchymal hematoma expansion or IPPICH (28% overall, n = 29). We observed only fair agreement between Readers 1 and 2 on the presence of PICH (kappa = 0.301, SE = 0.094, 95% CI: 0.117–0.485). Features by PICH status are listed in Table 1, and features by IPPICH status are shown in Table 2. Eighteen patients had a craniectomy, craniotomy, or both during their hospitalization.
Features by PICH Status
SD, standard deviation; IQR, interquartile range; GCS, Glasgow Coma Scale; ISS, injury severity score; SAH, subarachnoid hemorrhage; EDH, epidural hematoma; CT, computed tomography; INR, international normalized ratio.
Features by IPPICH Status
SD, standard deviation; IQR, interquartile range; GCS, Glasgow Coma Scale; ISS, injury severity score; SAH, subarachnoid hemorrhage; EDH, epidural hematoma; CT, computed tomography; INR, international normalized ratio.
With regard to outcome, median 6-month Glasgow Outcome Score (GOSE) was 6 [1–8, 15% (n = 16) of subjects were dead at 6 months], and the median 6-month disability rating scale score was 2 [0–30]. PICH was not associated with 6-month GOSE (β = −0.835, p = 0.11), mortality (β = −0.723, p = 0.20), or 6-month disability rating scale (DRS) (F 1–99 = 1.642, p = 0.20). In contrast, IPPICH was associated with mortality (p = 0.05) and worse DRS at 6 months (F 1–99 = 5.267, p = 0.02), but not 6-month GOSE (β = −1.086, p = 0.06).
Principal component analysis
The expert-selected list of variables consisted of GCS motor subscore, presence of subarachnoid hemorrhage (SAH), presence of epidural hemorrhage (EDH), Marshall score, angio-2, GFAP, and MAP. PCA was used to describe the maximum amount of variance in the dataset. Two PCs were found to be informative based on scree criterion describing variance of 48% and 9%, respectively (Fig. 2a–b). PC1 scores were found to be significantly different between PICH and non-PICH patients (t 1-103 = −2.39, p = 0.0187; Fig. 2c). PC1 captured a pattern of worsening clinical presentation with lower GCS scores moving opposite increasing markers of cell damage and dysfunction (i.e., GFAP and MAP).
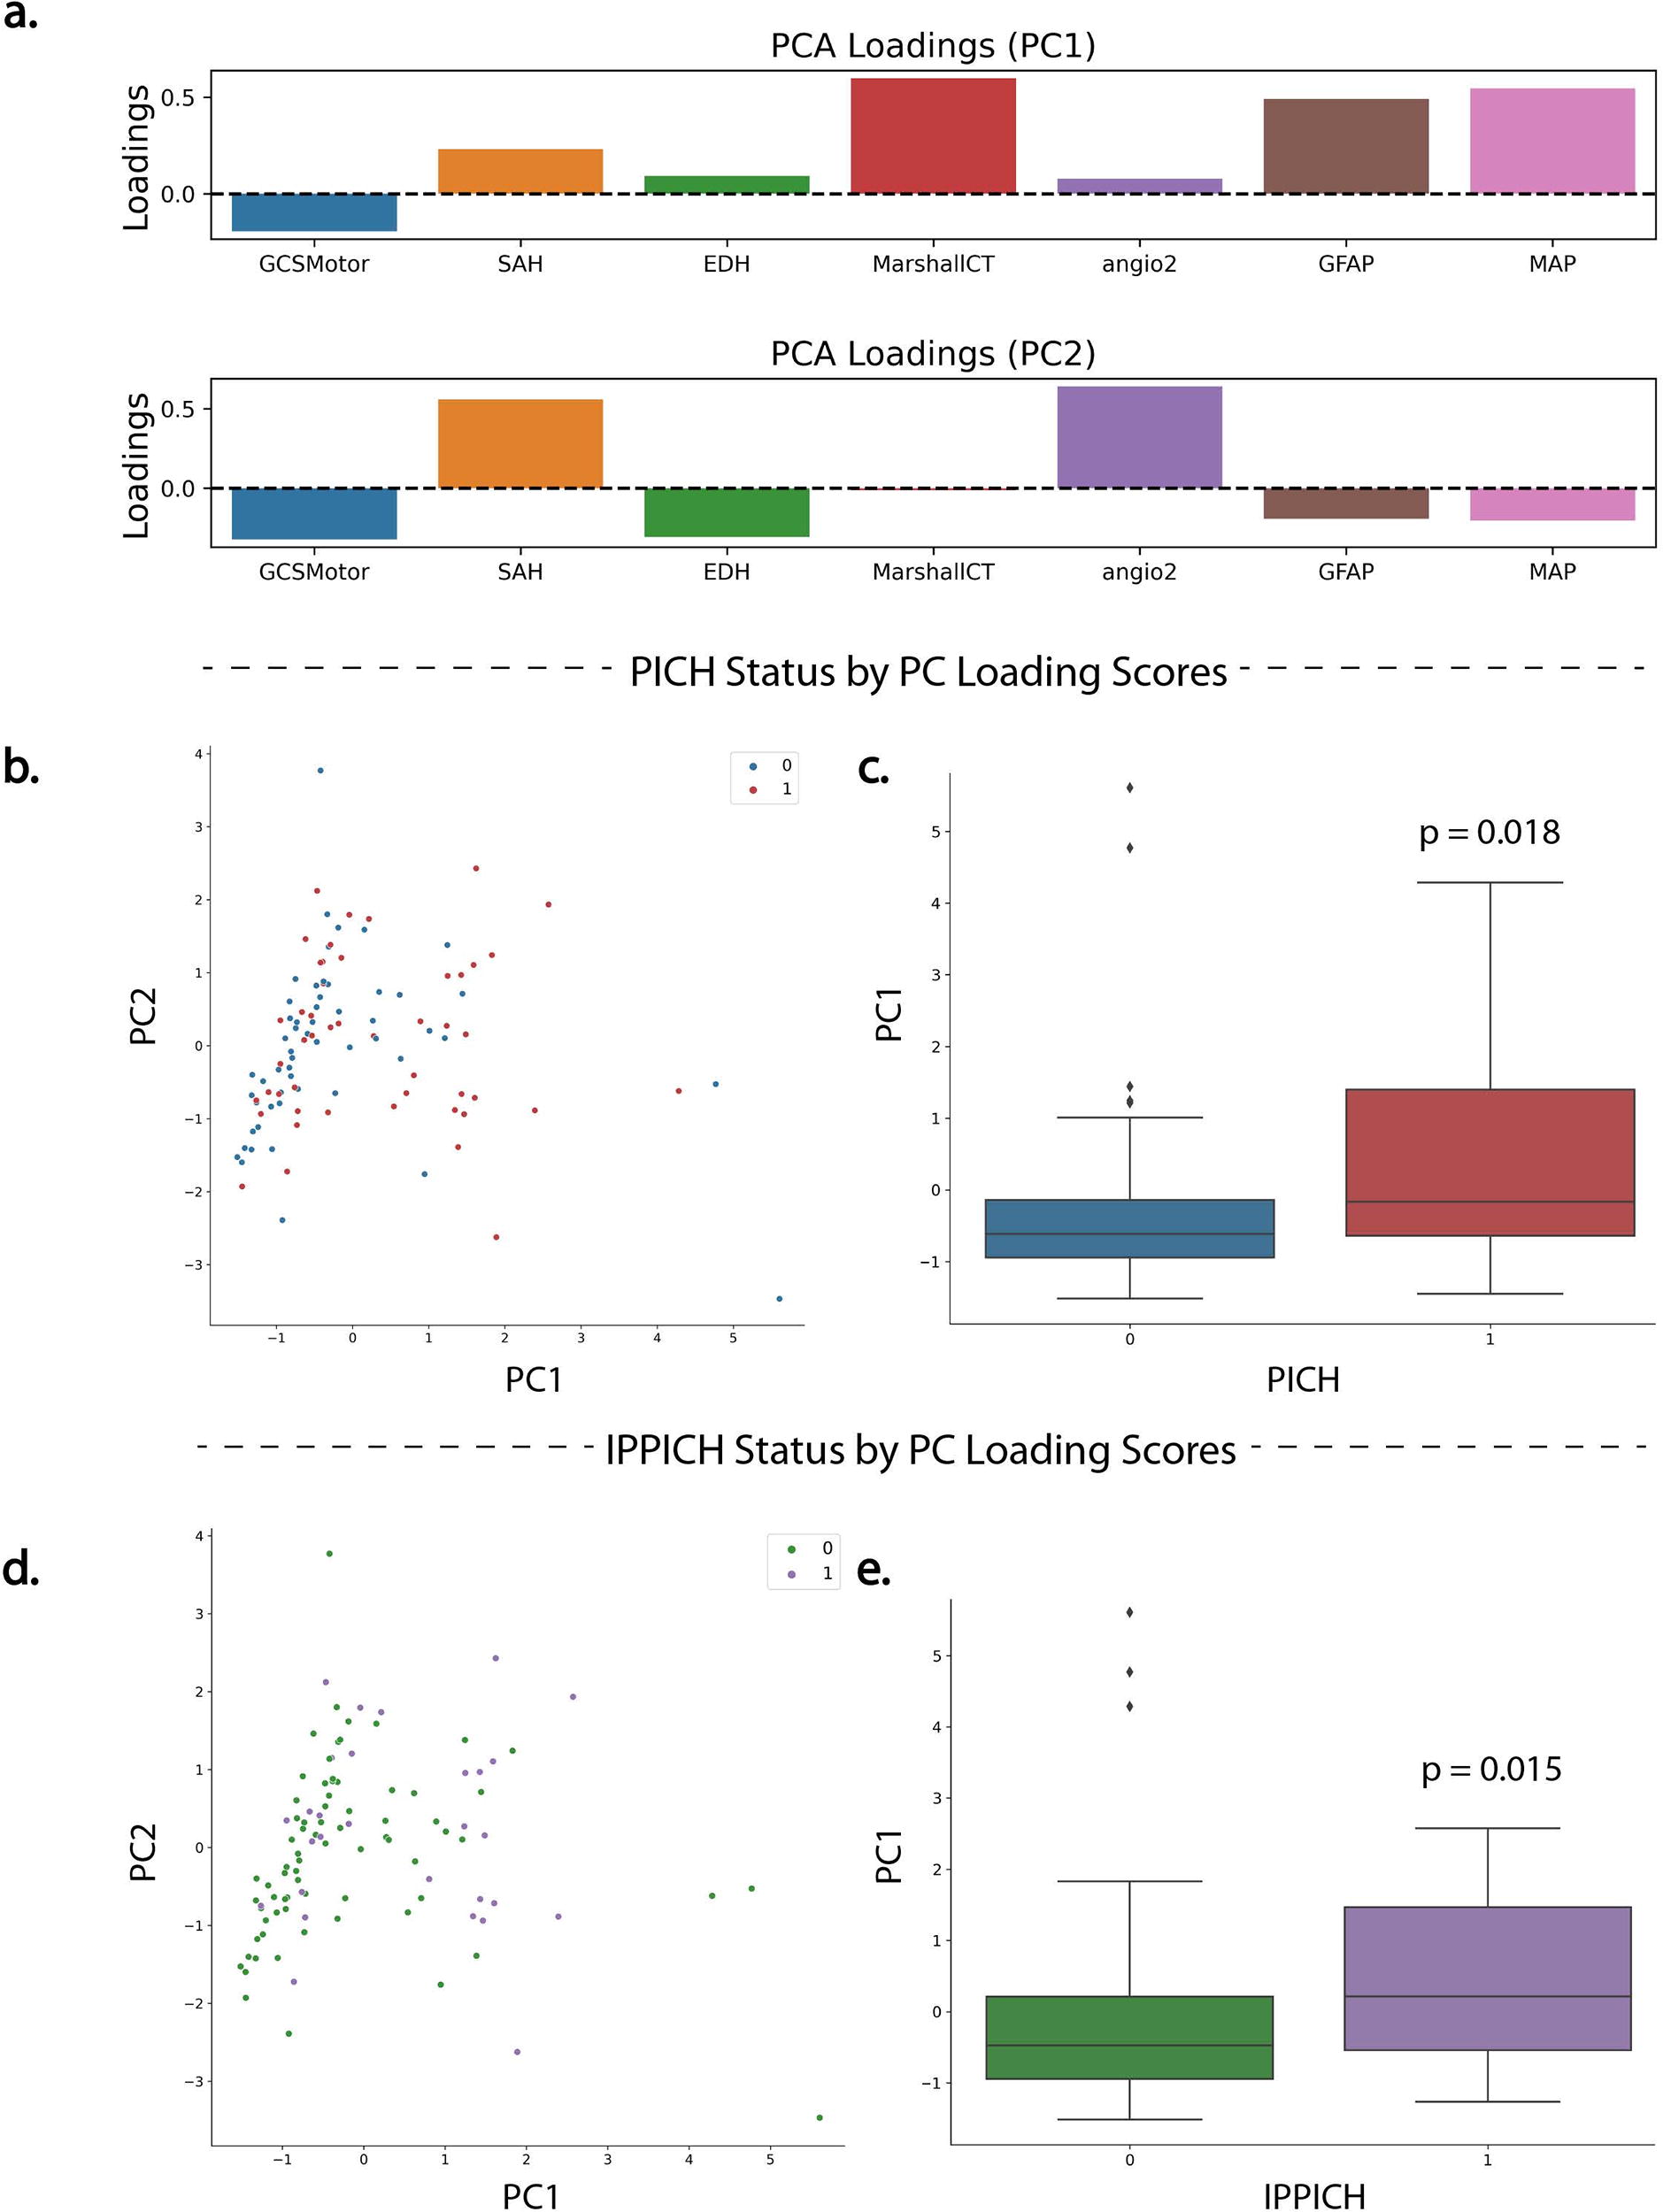
Principal component analysis (PCA).
This approach was repeated using IPPICH as the outcome variable. In this experiment, four PCs were found to be informative describing variance of 23.5%, 19.8%, 17.0%, and 12.9%. Similar to the PICH models, PC1 scores were found to be significantly different across groups of IPPICH and non-IPPICH cases (t 1-103 = −2.49, p = 0.0145; Fig. 2c–d).
Again, PC1 captured a similar pattern of worsening clinical variables (Fig. 2a).
Features associated with PICH and IPPICH
Upon univariate analysis, there were no associations between PICH or IPPICH and age, sex, admission GCS, GCS motor subscore, injury severity score (ISS), initial hematoma volume, presence of midline shift, admission platelet count, or admission INR value. However, radiographical severity was associated with both PICH and IPPICH. Higher Marshall score was associated with both PICH (β = 0.317, p = 0.017) and IPPICH (β = 0.341, p = 0.009). Likewise, a higher Rotterdam score was associated with both PICH (β = 0.869, p = 0.006) and IPPICH (β = 0.598, p = 0.040). The presence of SAH was associated with PICH (β = 0.943, p = 0.05), but not IPPICH (β = 0.689, p = 0.213). A similar pattern was observed with the presence of EDH, which was associated with PICH (β = 1.405, p = 0.045) but not IPPICH (β = 0.293, p = 0.655). With regard to the blood-based protein biomarkers, each of the 12 proteins demonstrated a rightward skew, as is typical of protein biomarker data, with skewness ranging from 0.90 to 4.83. For this reason, we log-transformed values for further analysis. A Pearson correlation matrix plot is shown with the relationships among PICH, IPPICH, and the biomarkers themselves (Fig. 3). Of the biomarkers, higher levels of GFAP were associated with both PICH (β = 0.374, p = 0.003) and IPPICH (β = 0.465, p = 0.002). Higher levels of MAP were also associated with both PICH (β = 0.293, p = 0.013) and IPPICH (β = 0.375, p = 0.005). Levels of UCHL-1, VCAM-1, ICAM-1, Angio-1, Angio-2, Thrombomodulin, Syndyecan-1, Thrombospondin, TNF-a, and IL-6 were not associated with either PICH or IPPICH.
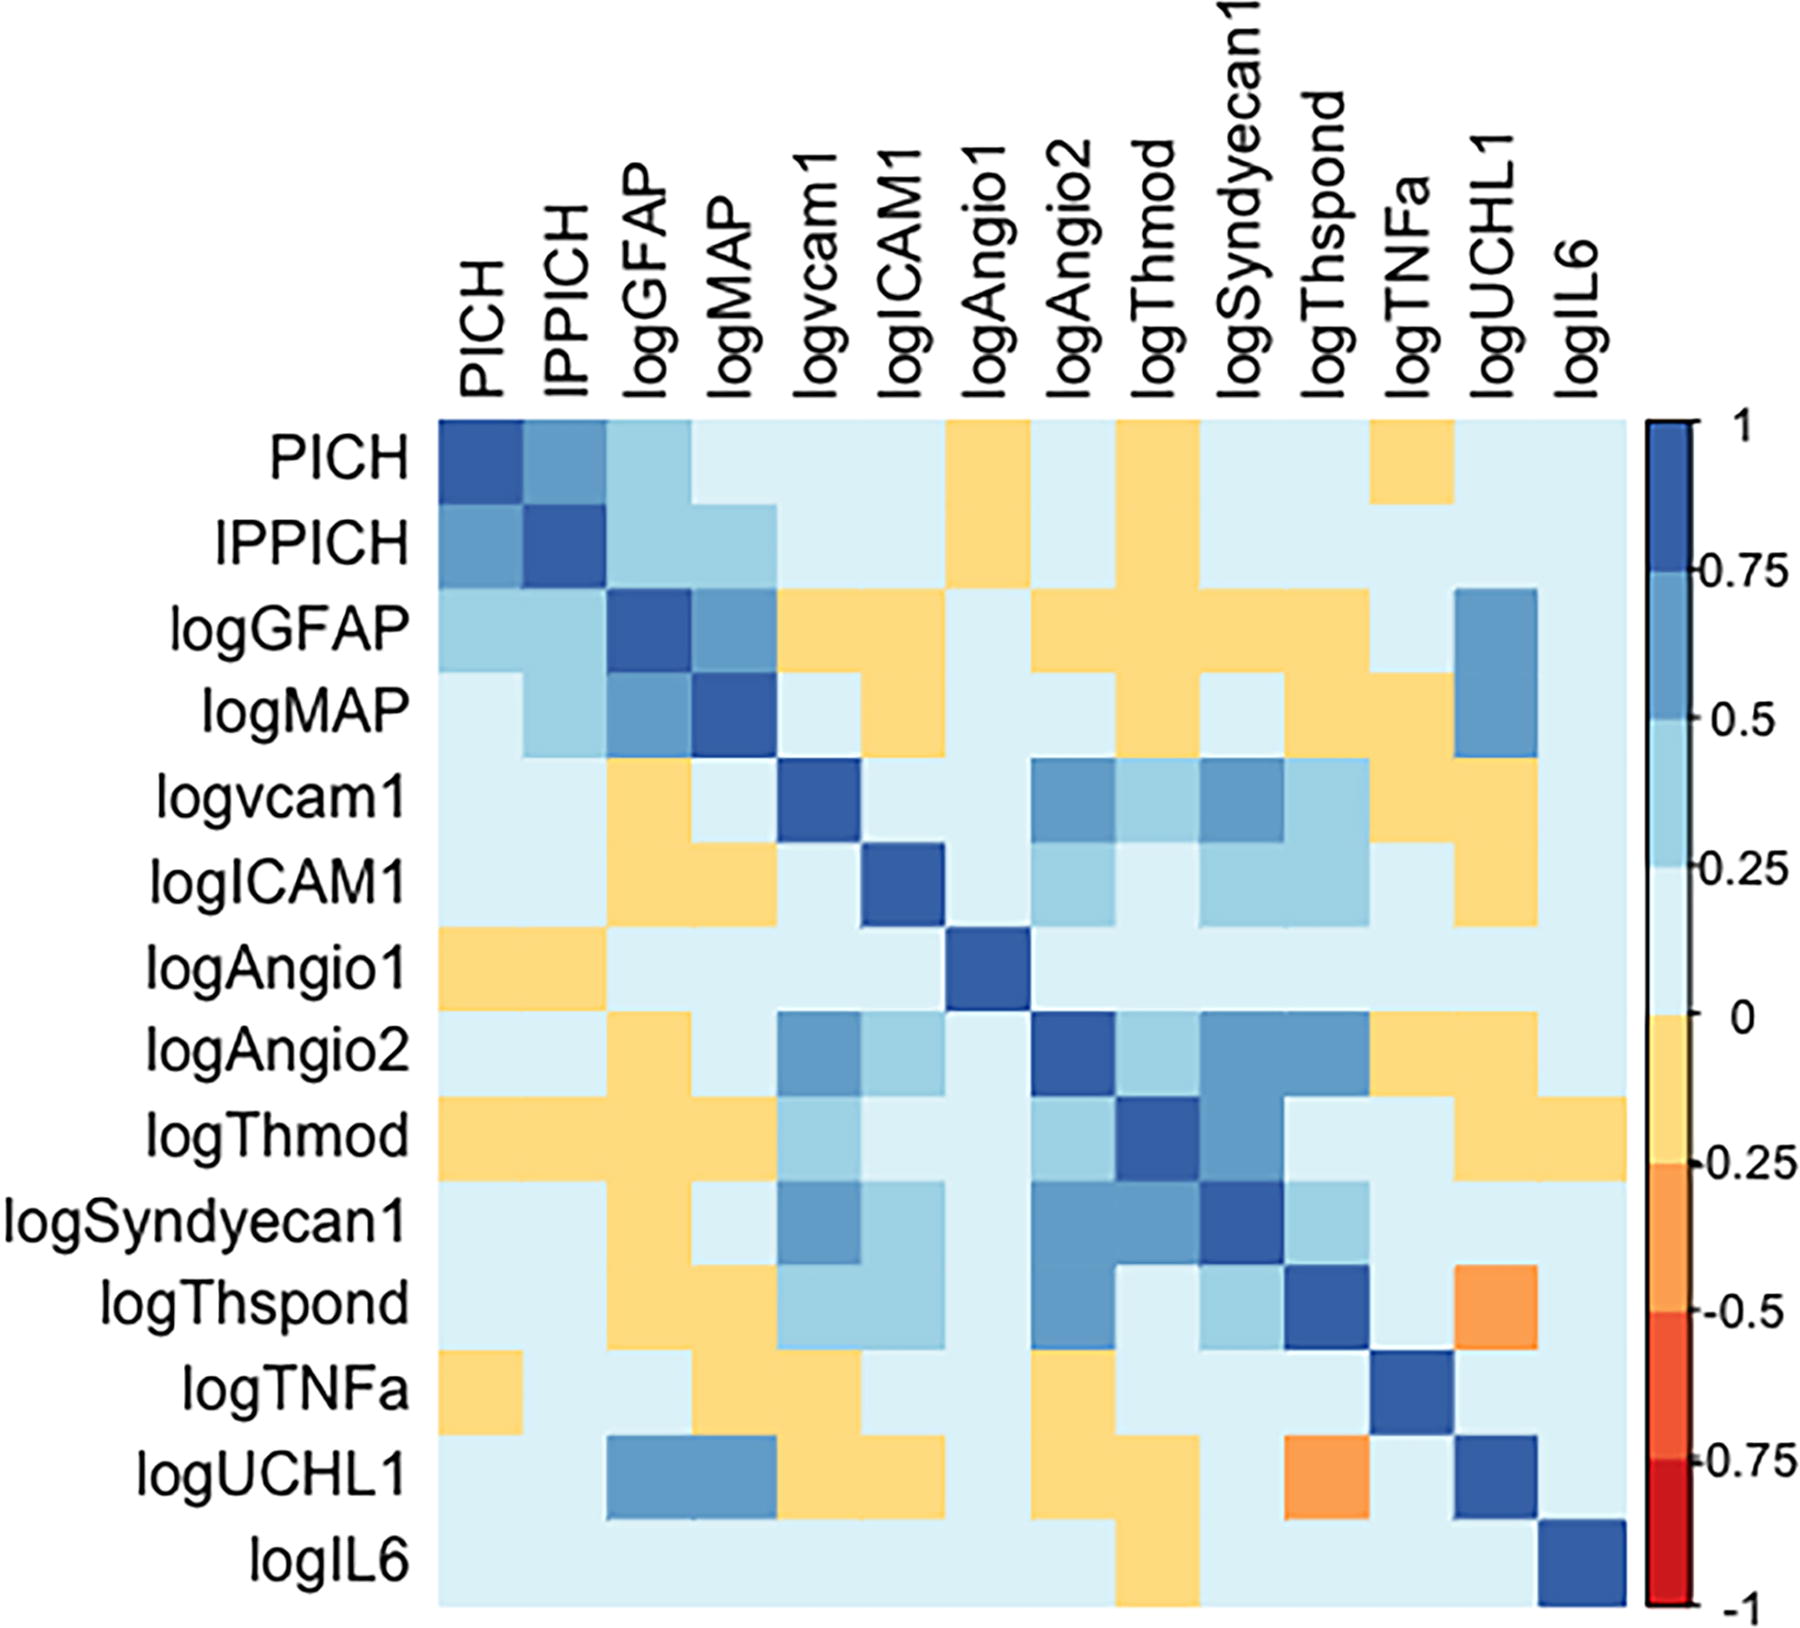
Pearson correlation matrix of blood-based biomarkers.
The expert-selected features for the model of PICH included features associated with PICH on univariate analysis (Marshall Score, SAH, EDH, GFAP, MAP), and features that did not meet statistical significance, but were felt to be potentially informative as they reflected clinical status (GCS motor score, pupil reactivity), coagulopathy (platelet count), or vascular integrity (Ang-2). We retained this same list for the IPPICH expert-selected models.

For the machine-selected features, RFECV was applied as an agnostic approach to determining the optimal, reduced set of variables for distinguishing between outcome variable of interest (PICH or IPPICH). In the case of PICH, RFECV using a random forest estimator determined the optimal list of variables to be GFAP, IL-6, and TNF-a (Fig. 5a). When IPPICH was used as the outcome variable, RFECV using a random forest estimator determined the optimal list of variables to be GFAP, MAP, time between CTs, IL-6, thrombomodulin, syndecan-1, angio-2, initial hematoma volume, thrombospondin, and vcam-1 (Fig. 6a). These lists were used as input in the subsequent model training where explicitly noted.

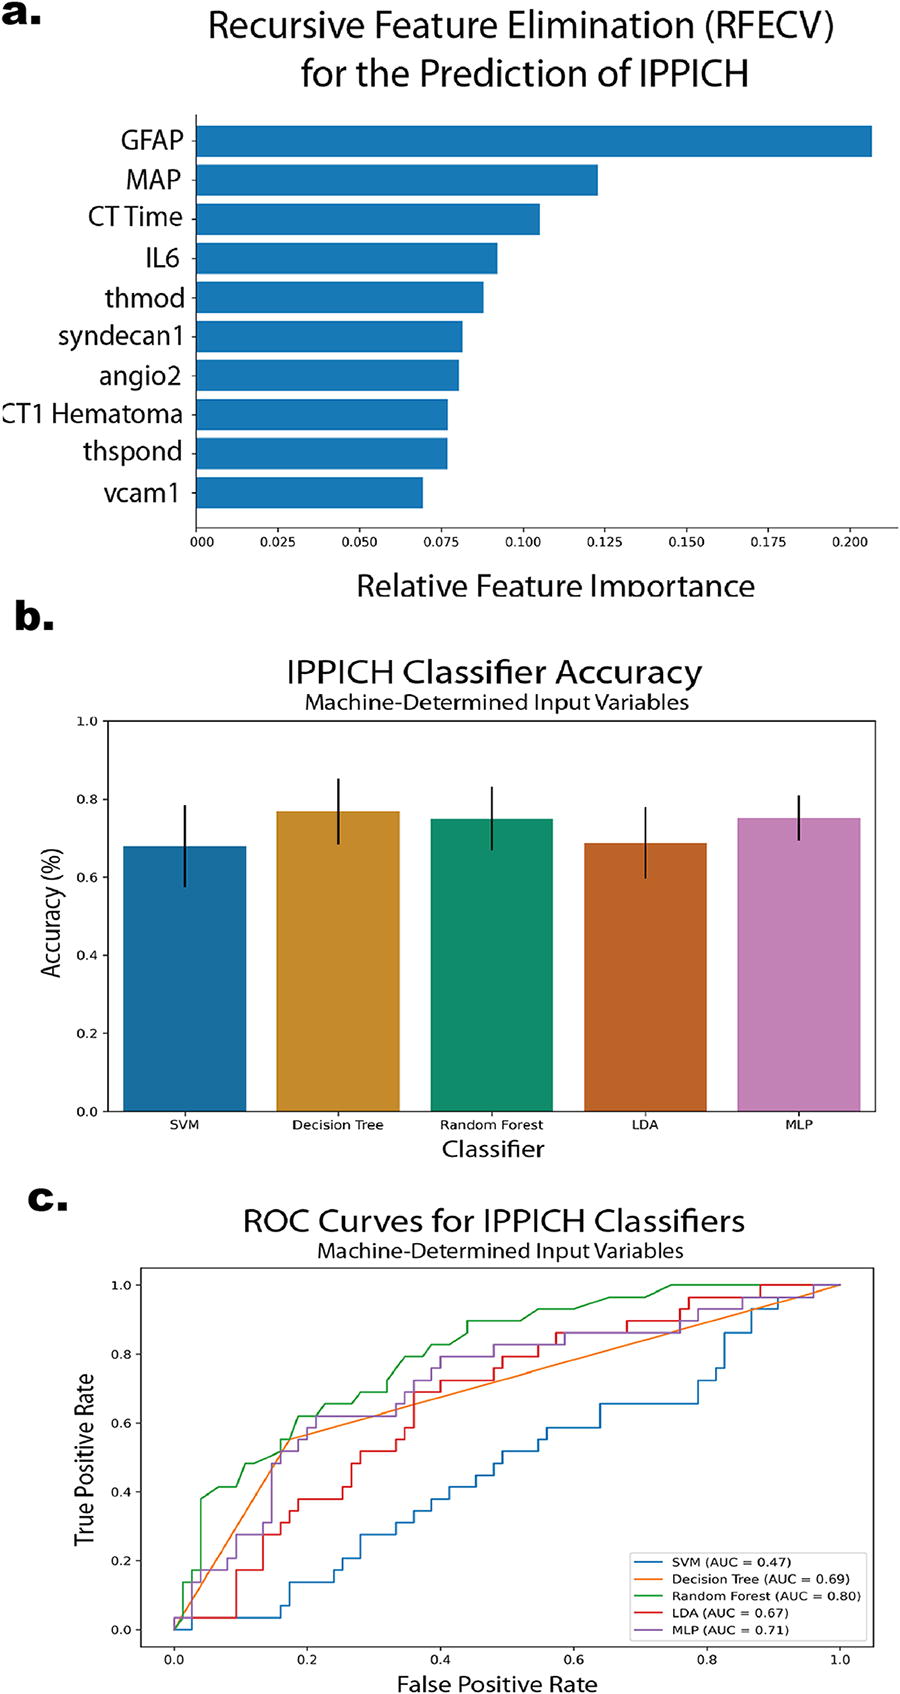
Models of PICH
The expert-selected list of variables was used to train a series of five supervised machine learning classifiers. The SVM algorithm performed best in terms of accuracy reaching and average of 62.0% across k-folds (Fig. 4a). However, no models outperformed chance in all folds. When interrogating true and false-positive rates, the SVM algorithm again outperformed all others with an AUC = 0.68 (Fig. 4b).
The training and assessment of each classifier was then repeated using the RFECV determined list for PICH differentiation. In these runs, the RFECV list convincingly outperformed both chance and the expert-selected list reaching an average of 77% accuracy (decision tree) and AUC = 0.78 (MLP) (Fig. 5).
Models of IPPICH
The expert-selected list of variables was used to train the classifiers for their ability to distinguish IPPICH vs non-IPPICH. The SVM algorithm performed best in terms of accuracy reaching and average of 69.9% across k-folds (Fig. 4c). This was the only model to outperform binary chance in all folds. When interrogating true and false-positive rates, the LDA algorithm outperformed all others with an AUC = 0.65 (Fig. 4d).
The training and assessment of each classifier was then repeated using the RFECV determined list for IPPICH differentiation. In these runs, the RFECV list convincingly out-performed both chance- and the expert-selected list reaching an average of 77% accuracy (decision tree) and AUC = 0.80 (random forest) (Fig. 6).
Discussion
We found that PICH was common in CT-positive subjects with moderate/severe TBI, and that features measured at admission can be used to predict PICH and IPPICH on the 6-h follow-up hCT. We also observed that models composed of machine-selected features performed better than models composed of expert-selected variables. Strengths of our investigation include multi-center design, rigorous review of hCT s by three independent radiologists, a common time point for follow-up imaging, relatively extensive access to candidate blood-based biomarker levels available for model inclusion, internal validation of the models, and comparison of expert-based versus machine-based variable selection to optimize model performance.
We observed a higher rate of progression (46% v. 23%) than in some investigations, 12 but similar to others 4 , 13 (46% v. 45–49%). Our higher rate of progression is likely related to our cohort being more severely injured than other investigations where PICH was less frequent. For example, the Yuan et.al. study included the full spectrum of admission GCS (3–15) and focused on isolated TBI, whereas our investigation was limited to GCS 3–12 and included patients with other injuries plus TBI. Our concept of PICH as specified in the parent trial 6 is similar to other investigators’ definitions requiring notable expansion (30%) of pre-existing hemorrhage or the advent of new hemorrhagic lesions. 12 − 13 However, our time window was shorter than in some previous studies, which extended the monitoring window out 48–72 h. 13 We limited our investigation to subjects with hemorrhage on the initial CT scan as the advent of new hemorrhage after a negative initial hCT is rare—estimates place this event at about 1% in older adults 14 and as low as 0.25% (95% CI: 0.06–0.60%) in a study of all comers, and rarely requires intervention. 15 We chose the 3- to 18-h time window to capture the common practice of obtaining a 6-h follow-up scan, allowing for delays that often occur in the provision of critical care in the hospital setting (e.g. patient stabilization, procedures, radiology scheduling, etc.). We did not include follow-up CTs performed immediately after the initial scan (<3 h) or those far removed from the initial scan in recognition of the relationship between time and hemorrhage progression. Earlier follow-up scans might miss hemorrhagic progression, while later scans might reflect events in the hospital course rather than progression of the initial injury. We did not observe some of the same associations between PICH and patient characteristics, such as age, seen in other studies, which is likely due to some of the differences in patient population and PICH definitions, as noted above. In contrast to prior studies, 2 − 3 we did not observe a relationship between PICH and 6-month outcome measures (6-month GOSE, mortality, or DRS), but we did find an association between IPPICH and mortality and worse DRS. While extra-axial PICH (e.g. SDH) might be amenable to straightforward surgical decompression, intra-axial hemorrhages may be less readily treated. Thus, IPPICH might result in more morbidity (especially in the cognitive and psychosocial domains captured by the DRS 16 ) and mortality than the broadly defined PICH.
The cause of hemorrhagic progression is multifactorial but can be divided into three major drivers: (1) acute traumatic coagulopathy, (2) Mechanical shearing causing vascular injury, and (3) central nervous system (CNS) cellular injury/death (producing cytotoxic and vasogenic edema). Acute traumatic coagulopathy occurs in approximately 1/3 of patients with TBI, and is associated with higher mortality, 17 as well as with progression of hemorrhagic injury (odds ratio = 2.4 in one study 18 ) Coagulopathy likely contributes to PICH in both intra- and extra-axial compartments. To capture this, we included conventional coagulation studies (platelets, INR). Mechanical shearing is likely the dominant mechanism for extra-axial hemorrhage expansion, such as EDH and SDH expansion. Finally, CNS cellular injury likely contributes most to IPPICH, which is why we elected to consider IPPICH as a separate outcome to model.
Blood-based biomarkers hold great promise in TBI; one such panel has already been FDA approved for the detection of CT-positive lesions in patients after concussion. 7 We included a large ensemble of blood-based protein biomarkers reflecting CNS cellular injury markers (GFAP, UCHL-1, MAP), inflammation (IL-6, TNF-a), vascular integrity (ICAM-1, VCAM-1, Angio-1, Angio-2), and glycocalyx integrity (Thrombomodulin, Syndyecan-1, Thrombospondin). The intent was to capture the multifaceted mechanisms that contribute to PICH and IPPICH. However, we also acknowledge that participation in the pathophysiology of a disease process is not necessary for a variable to be informative in a predictive model of that pathophysiology. While only GFAP and MAP were associated with PICH and IPPICH in the univariate analysis, several other markers served to be informative features of the models we generated (e.g., IL-6). While variables like biomarkers might have a strong association with the outcome of interest, they may not be useful for prediction of the outcome of interest, and vice versa. This is a limitation of prior work building scoring systems from variables associated with the outcome of interest, 12 or relying on expert-selected features to compose predictive models—limitations that might be overcome by employing machine-selected features.
Prediction aided by machine learning in TBI has largely focused on diagnosis (classifying injured from uninjured subjects, 19 detecting lesions on imaging 20 − 21 ) and prognosis 22 − 23 (mortality, Glasgow Outcome Scale at 6 months). Recently, investigators have begun to examine events during the acute hospital course, such as elevated intracranial pressure 24 and disease trajectories in the ICU. In one study, investigators used clustering methods to examine critically ill patients in the CENTER-TBI cohort, identifying that glucose variation and levels of CNS cellular injury markers best distinguished disparate trajectories in the cohort. 25 A unique aspect of our investigation is that we focused on a specific pathophysiological process (e.g., PICH), which is potentially modifiable. The goal of neurocritical care is to quickly identify and reduce or eliminate sources of secondary brain injury. An ideal future state would be the combination of automated hemorrhage detection, precise quantification, and accurate prediction of clinically meaningful PICH, which might facilitate more rapid treatment. Machine learning approaches may help us better harness complex ICU data to promote the goal of arresting secondary brain injury.
Limitations
Our study has several notable limitations. First, the features of our models were limited to characteristics recorded and sample sizes of the parent trial. Some potentially informative features may have been missed. For example, our group showed in previous work that fibrinogen (specifically d-dimer) levels are associated with PICH, 26 but only 25 subjects (25%) in this cohort had fibrinogen levels, making fibrinogen value imputation too unstable for interpretation. Unfortunately, thromboelastogram values were not available for the subjects. Other unmeasured confounders might be informative features in future models such as pre-morbid coagulopathies and medication use (such as antithrombotics or anticoagulants). Although we had a low rate of missingness in the included variables overall, and we performed multiple imputation as our missing data strategy, it is possible that this did not fully account for unmeasured factors driving the missingness of the data. While in line with other studies, our definition of PICH that excluded surgically evacuated hematomas may have misclassified subjects. While surgery impacted few of our subjects, it is impossible to know if these evacuated hemorrhages would have progressed using our definition, thus we erred on the side of categorizing these hemorrhages as non-progressors. Our inter-rater reliability was poorer than we anticipated despite rater training and written reference criteria, although it is in keeping with modest inter-rater reliability reported in other studies. 27 The impact of this disagreement was mitigated by adjudication but highlights the need for more objective methods or tools for calculated hemorrhage volume in TBI. The development of automated tools for hemorrhage quantification after trauma, especially with machine learning, will likely improve the rigor and reproducibility of these measurements. 20,21,28 While our cohort was small in comparison to other applications of machine learning, it should be noted that there are no well-established rules of thumb for assessing sufficiency of sample size and statistical power in the context of machine learning. The standard approach is to use bootstrapped resampling and cross-validation to empirically demonstrate stability. Our analysis, which is focused on prediction, was different than a typical analysis in the biomedical literature aimed at explanation or causation. 29 In this study, our goal was to create internally valid prediction models that will perform well on novel datasets. The cross-validation we performed demonstrated stability, indicating that our sample size was sufficient. Our results may have been impacted by a selection bias toward patients likely to survive the immediate injury period. Those subjects that were excluded from our analysis due to lack of follow-up imaging were sicker (lower admission GCS) and had higher mortality than the included subjects. It is possible that many of these subjects died or transitioned to comfort measures only before follow-up imaging being obtained, which may bias our results toward less morbid subjects. Importantly, our results must be externally validated in a separate cohort before being trialed clinically. We hope that our multi-center design will improve the chances of generalizability. Finally, the integration of biomarkers may introduce some challenges in replication until clinically standard methods of measure are widely available. If/when our models are externally validated, measurements of the biomarkers included in the models must be standardized in certified laboratories (Clinical Laboratory Improvement Amendments or CLIA-certified) and resulted in a timely fashion to be useful clinically. At present, only GFAP and UCHL-1 are commercially available on a limited basis. In contrast, the current turnaround time for other blood-based biomarkers (e.g., IL-6, TNF-a, etc.) is on the order of 2–4 days, which is less useful for acute prediction. However, point-of-care devices to detect cytokines in the blood are imminent (e.g., using aptamer-based diode sensors to measure TNF-a at the bedside 30 ) We are hopeful that technology will continue to evolve in parallel our external validation efforts to facilitate clinical application/implementation.
Conclusions
Utilizing variables measured at admission, we have created predictive models accurately predicting PICH and IPPICH on the 6-h follow-up hCT. Our best performing models must now be externally validated in a separate cohort of TBI patients presenting with low GCS and a positive hCT. Once properly validated and clinically implemented, an accurate prediction model of PICH might facilitate timely intervention to minimize secondary brain injury.
Transparency, Rigor, and Reproducibility Summary
The parent trial was pre-registered at ClinicalTrials.gov (NCT01990768). The analysis plan of this substudy was not formally pre-registered. A sample size of 104 subjects was based on availability of subjects that met criteria for inclusion (hemorrhage on initial CT) and availability of a second CT scan within the 18-h window to assess for the primary outcome of progression of intracranial hemorrhage (PICH). Please refer to the CONSORT diagram for participant accounting (Supplementary Fig. S3). Human participants were blinded to results of the fluid biomarker measurements. Handling of biofluid samples was performed by team members blinded to relevant characteristics of the participants (e.g., PICH, etc.) Fluid biomarker measurements were performed by investigators blinded to relevant characteristics of the participants. Please refer to the Methods section for details on each biomarker assay used in the investigation. Any samples registering a signal over the upper limit of quantification were diluted and reassayed. Missing data for predictor variables were handled using multiple imputation, as reported in the text. Statistical analysis/machine learning was performed by HLR with qualifications, including a PhD dissertation focused on designing machine learning workflows specifically able to handle the unique difficulties of analyzing TBI data, with additional analysis by HEH with the qualification of a masters in clinical research, and overseen by ARF with the qualification of PhD training in statistics. A limited deidentified dataset confined to the variables used in this analysis will be made available in a protected data archive in odc-tbi.org, access available by reasonable request. Code from the statistical analysis will be made publicly available in github.com. No future use of these biofluid samples is possible because insufficient quantities remain. The authors agree to provide the full content of the article on PubMed in compliance with the NIH Public Access policy.
Footnotes
Acknowledgments
The authors wish to thank Lex Maliga for assistance in submission of this article. An abstract detailing a portion of this work was previously published in Annals of Neurology, Volume94, IssueS30. Supplement: 148th Annual Meeting American Neurological Association, September 2023, Pages S1-S303.
Authors’ Contributions
H.E. Hinson: conceptualization, methodology, formal analysis, data curation, writing, visualization, and funding acquisition. Hannah L. Radabaugh: formal analysis, software, validation, writing, and visualization. Nincheng Li: investigation, and writing. Toshinori Fukuda: investigation. Jeffrey Pollock: investigation, and writing. Martin Schreiber: funding acquisition, and writing. Susan Rowell: funding acquisition, and writing. Adam R. Ferguson: resources, writing, and supervision.
Author Disclosure Statement
No competing financial interests exist.
Funding Information
Research reported in this publication was supported by the National Institute Of Neurological Disorders And Stroke of the National Institutes of Health under Award Number K23NS110828. The content is solely the responsibility of the authors and does not necessarily represent the official views of the National Institutes of Health.
Supplementary Material
Supplemental Figure S1
Supplemental Figure S2
Supplemental Figure S3
References
Supplementary Material
Please find the following supplemental material available below.
For Open Access articles published under a Creative Commons License, all supplemental material carries the same license as the article it is associated with.
For non-Open Access articles published, all supplemental material carries a non-exclusive license, and permission requests for re-use of supplemental material or any part of supplemental material shall be sent directly to the copyright owner as specified in the copyright notice associated with the article.
