




Abstract
Traumatic brain injury (TBI), a risk factor for later-life dementia, leads to salient brain atrophy, particularly in the white matter. It is not clear how white matter atrophy progresses or why some brain regions are damaged while others are spared. We hypothesized that spatial variations of cell-specific gene expression contributed to the selective white matter loss vulnerability following mild TBI (mTBI). Gene expression data were sourced from the publicly available Allen Human Brain Atlas, which comprises microarray data spanning nearly the entire brain, derived from six neurologically normal adult donors. A total of 100 patients with acute stage (within 7 days post-injury) mTBI were enrolled. Of these, 60 patients were followed up at 3 months post-injury and 37 were followed up at 6–12 months post-injury. In addition, 59 healthy controls (HCs), matched for age, gender, and education, were included for comparative analysis. White matter volume changes were analyzed at both the acute stage, 3 months, and 6–12 months follow-up in mTBI patients compared with HCs. Patients with mTBI exhibited significant white matter atrophy in the frontal, parietal, and temporal cortices at 3 months post-injury, which even persisted at 6–12 months follow-up. In addition, mTBI patients with cognitive deficits showed more severe brain atrophy compared with those without cognitive deficits. Crucially, the gene expression marking endothelial cells and S1 pyramidal neurons were associated with increased brain atrophy, whereas the gene expression marking microglia and CA1 pyramidal neurons were associated with decreased brain atrophy in mTBI patients at 3 months post-injury. Microglia and endothelial cells can explain 23.6% of regional variations in the white matter atrophy. These findings suggested that modulating cellular activation, especially by promoting microglial activation at 3 months post-injury, might be a promising approach to prevent white matter atrophy, enhance cognitive outcomes, and reduce the risk of later-life dementia.
Introduction
Traumatic brain injury (TBI) is identified as a risk factor for later-life dementia and progressive neurodegenerations. 1 Recently, more than 340,000 participants prospective cohort study shows that among the 210 modifiable risk factors for dementia, TBI has the strongest impact approximately increased 2-fold risk of dementia, while stroke, disability, and depression only contribute to an increased risk of 50%. 2 Brain atrophy, a major hallmark of dementia, 3 persists for decades after TBI, 4 and is also a key characteristic in the greater susceptibility of TBI patients to developing dementia. 5 Importantly, atrophy after TBI is not uniformly diffuse but exhibits substantial selectivity for certain regions, including the parietal, frontal, and temporal cortices. 6,7 Intriguingly, these brain regions also show progressive brain atrophy in patients with typical late-onset Alzheimer’s disease. 5 However, why some brain regions are impaired while others are spared after TBI is still unclear.
The theory of pathoclisis hypothesizes that the selective vulnerability of brain regions to disease risk factors may be explained by variations in the cell types within that area. 8,9 Chronic changes in microglia can be widespread long after TBI and associated with brain structural abnormality over time. 10,11 Although regions with a higher level of microglial activation show greater progressive atrophy in chronic moderate-severe TBI, the inhibition of microglia activation by minocycline intervention is accompanied by the increased levels of plasma neurofilament light, 12 a marker of axonal injury and neurodegeneration. 13 These findings suggest a reparative role for the microglial activation in the chronic TBI. Notably, neurodegenerative abnormalities in TBI are especially present in perivascular locations, 14 indicating that TBI may trigger a neurodegenerative cascade response by affecting the permeability of the blood–brain barrier (BBB). 15,16 The ability to maintain BBB integrity relies on the structural support of endothelial cells by tight junction-associated proteins. 17 Moreover, brain atrophy is recognized following TBI, 18 –20 particularly in the white matter. 5,21 A recent study reports ∼1.5% annual loss of white matter in the chronic phase after moderate to severe TBI. 19 Therefore, the role of different cell types in regulating selective atrophy within the white matter after mild TBI (mTBI) needs to be determined.
The public availability of the Allen Human Brain Atlas (AHBA), 22 and the release of the cell-specific gene sets, 23 have enabled the exploration of the potential impact of cell-specific gene expression on neurodevelopment and neurological disorders. 24 Previous studies has indicated that inter-regional variations in age-related cortical thinning within the adolescent brain correlate with inter-regional variations in the expression levels of genes that are markers for CA1 and S1 pyramidal cells, astrocytes, and microglia. 25 In addition, reduced cortical thickness in Alzheimer’s disease patients compared to healthy individuals is associated with the expression levels of cell-specific genes for CA1 pyramidal cells, astrocytes, and microglia. 26 Thus, the direct linkage of spatial variation in AHBA gene expression to spatial variation in imaging-derived phenotypes has given rise to the emerging field of transcriptome imaging, which is beginning to yield new insights into regional differences in gene expression.
In the present study, we focused on white matter atrophy as the most common neuroimaging neurodegenerative manifestation and information processing speed (IPS) as the most prominently affected cognitive domain in both TBI, 27 –30 and dementia. 31,32 Longitudinal white matter atrophy at the acute stage (within 7 days post-injury), 3 months, and 6–12 months post-injury of mTBI were investigated. The AHBA was then employed to elucidate the underlying cellular mechanisms of selective brain atrophy in these regions. Specifically, the differences in white matter volume between patients and healthy controls (HCs) were correlated with the corresponding spatial gene expression patterns in the AHBA to assess the potential impact of cell-specific gene expression on white matter atrophy in mTBI patients. We hypothesized that: (1) the expression of cell-specific marker genes for microglia and endothelial was associated with the regional selective white matter atrophy after mTBI; (2) patients with impaired IPS cognitive outcome presented more severe white matter atrophy in these selective areas.
Materials and Methods
Participants
We recruited 100 patients with mTBI from the local emergency department (ED) as the initial population. The inclusion criteria of patients with mTBI were based on the World Health Organization’s Collaboration Center for Neurotrauma Task Force. 33 In detail, mTBI had to meet the following criteria: (1) Glasgow Coma Scale (GCS) score of 13–15 on presentation to the ED; (2) one or more of the following: loss of consciousness for less than 30 min, post-traumatic amnesia for 24 h or fewer, and/or other transient neurological abnormalities such as focal signs, seizure, and intracranial lesion not requiring surgery; (3) within 1 week after the onset of mTBI; (4) 18 years or older. These manifestations of mTBI must not be due to alcohol, drugs, medications, caused by other injuries or treatment for other injuries (such as systemic injuries, facial injuries, or intubation), caused by other problems (such as psychological trauma, language barrier, or coexisting medical conditions), or caused by penetrating craniocerebral injury. Of these, 60 patients were followed up at 3 months, and 37 patients were followed up at 6–12 months post-injury. In addition, we recruited 59 age-, gender-, and education level-matched HCs through advertisements in the same hospital. The inclusion criteria of HCs were 18 years or older and free of a history of neurological or psychiatric disorders, substance or alcohol abuse, or any previous head injuries, regardless of cause. All participants provided written informed consent before the experimental procedures. The research procedures were approved by the local Research Ethical Committee and conducted in accordance with the Declaration of Helsinki.
Neuropsychological assessment
Cognitive IPS was rated by the Trail-Making Test Part A (TMA), 34 and the Digit Symbol Coding score (DSC). 35 Then, we classified mTBI patients into two subgroups with and without IPS deficits. Specifically, patients were diagnosed with IPS deficits when either their TMA completion time exceeded the maximum of the normal range for their respective age and education level, 36 or their DSC score was more than 1.5 standard deviations below the mean for their respective age and education level. 37
Besides, the Beck’s Depression Inventory, 38 was used to evaluate depression mood disorder and the Insomnia Severity Index, 39 was used to examine sleep disorder.
Image acquisition and processing
MRI scans were acquired on a 3.0 T MRI scanner (GE 750) with a 32-channel head coil. The scan parameters of the High-resolution T1-weighted 3D Magnetization Prepared Rapid Gradient Echo (MPRAGE) sequence were listed as follows: repetition time = 7.68 ms, echo time = 3.42 ms, flip angle = 9°, field of view = 256 mm × 256 mm, matrix size = 256 × 256, and 188 slices. In addition, data from diffusion tensor imaging, resting-state blood oxygen level-dependent imaging, arterial spin labeling, susceptibility-weighted imaging, T2-weighted imaging, and T2 fluid-attenuated inversion recovery sequences were collected from the participants. However, since this study was focused on brain atrophy analysis using T1-weighted data, the acquisition parameters for the other imaging sequences were not detailed in this article.
The processing of T1 structural images was performed on the open-source software FreeSurfer (version 6.0, http://surfer.nmr.mgh.harvard.edu). Fully automated and validated neuroimaging segmentation algorithms were employed. The white matter volumetric values of the 68 regions based on the Desikan–Killiany atlas were obtained from each participant.
An independent two-sample t-test was used for the group comparison of white matter volumes between patients and HCs, with estimated total intracranial volume (eTIV), age, gender, and education as covariates. The false discovery rate (FDR) was used to correct for multiple comparisons, and significance was set at p < 0.05. In addition, to compare white matter volumes among the two subgroups of mTBI patients (mTBI patients with and without IPS deficits) and HCs, a one-way analysis of covariance (ANCOVA) and Bonferroni’s post-hoc test was performed with eTIV, age, gender, and education as covariates, and significance was set at p < 0.05.
Gene-expression profiles
Gene-expression data were obtained from the publicly available AHBA (http://human.brain-map.org), which provides normalized microarray gene expression data for six normal donors aged between 24 and 57 years. 22 The AHBA includes microarray data from 3,702 spatially distinct brain samples, which are distributed across nearly the entire brain and quantify the expression levels of 20,232 genes. The processing for the AHBA gene expression data followed the recently proposed pipeline of transcription-neuroimaging association study. 40 Briefly, the processing steps were as follows: (1) probe-to-gene re-annotation; (2) data filtering; (3) probe selection; (4) assigning samples to the Desikan–Killiany 68 atlas; (5) data normalization; and (6) gene filtering. Transcription-neuroimaging association analysis in our study only included the gene expression in the left hemisphere, as only two donors in the AHBA dataset had right-hemisphere expression data. Therefore, a mean of all samples in a region was calculated to obtain the matrix (34 regions × 10,027 gene expression levels) of transcriptional level values.
Cell-specific marker genes
The list of genes expressed in specific cell types was obtained from a study by Zeisel et al. 23 which classified 3,005 cells from the cortex and hippocampus of mice aged 21–31 postnatal days into 9 types, each containing over 100 genes. The mouse genes marking the above 9 cell types were converted to human gene symbols using the HomoloGene database, 41 and the homologene R package by Ogan Mancarci (https://github.com/oganm/homologene). Then, we intersected the human marker genes corresponding to the 9 cell types with the 10,027 genes. The resulting number of genes for the 9 cell types was as follows: S1 pyramidal neurons (n = 178), CA1 pyramidal neurons (n = 258), interneurons (n = 230), astrocytes (n = 167), microglia (n = 246), oligodendrocytes (n = 301), ependymal (n = 237), endothelial (n = 218), and mural (n = 86).
Gene enrichment analysis
Enrichment analysis of cell-specific marker gene sets was performed using Metascape (https://metascape/org), an online bioinformatics pipeline for analyzing multiple gene lists that supports effective data-driven gene prioritization decisions. 42 The workflow was as follows: (1) ID conversion; (2) extraction of annotations using Gene Ontology (GO) Biological processes and Kyoto Encyclopedia of Genes and Genomes (KEGG) pathways; and (3) enrichment analysis. The 10,027 genes were used as the background gene set. The microglia, endothelial, CA1 pyramidal neurons, and S1 pyramidal neurons cell-type genes were used as foreground sets separately. The default recommended settings were used for enrichment analysis. Networks of cell-specific marker gene sets were visualized with Cytoscape, 43 with ‘force-directed’ layout, and edges were bundled for clarity. For identifying the enrichment of specific terms of interest, significance was set at p < 0.05 (FDR corrected).
Statistical analysis
Profiles of demographic characteristics
Statistical analysis of demographic, cognitive, and neuropsychological assessment data was conducted using the Statistical Package for the Social Sciences (SPSS) V.26. The Shapiro–Wilk W test was used to test for normal distribution of continuous variables of demographic information and neuropsychological assessment. The independent two-sample t-test and the Mann–Whitney test were performed to compare group differences based on data normality, respectively. Chi-squared was used to compare categorical variables. To evaluate the relationship between white matter atrophy with mood and sleep disorders of patients, the partial correlation between white matter volume in atrophy regions with mood and sleep disorder variables was calculated with eTIV, age, gender, and education as covariates, and significance was set at p < 0.05.
Association between cell type and white matter atrophy
The association between cell type and white matter atrophy was calculated using a resampling-based approach, similar to the previous study. 25 The t-values derived from group comparisons between patient and HC groups characterized white matter atrophy, with smaller t-values indicating more severe atrophy. For the test statistic, we selected to use the average expression-atrophy correlation for each panel of genes. We reasoned that if a certain cell type underlies white matter atrophy, then the mean of expression-atrophy correlation coefficients for the genes in the cell type panel should be different from the mean of the random gene set. For each cell type panel, we acquired the empirical null distribution of the test statistic as follows: (i) We randomly selected the same number of genes as the cell type panel genes from all 10,027 genes in the reference panel. (ii) For these selected genes, we calculated their expression-atrophy correlation coefficients and derived their mean value. We repeated steps (i) and (ii) 10,000 times and used the distribution of the resulting test statistic values to estimate the null distribution. Based on the empirical null distribution, we obtained a two-sided p-value by calculating the proportion of mean values exceeding the mean value observed in the original cell-type panel. The Bonferroni procedure was employed to correct for multiple testing of 9 cell type panels. Thus, the significance was set at p < 0.05/9 = 0.0056. In addition, we also calculated the 2.5% and 97.5% critical values by accounting for the 2.5th and 97.5th %, respectively, in terms of empirical null distributions and used them to visualize whether the observed mean correlation coefficient exceeded the critical values.
Variation of inter-regional white matter atrophy profiles explained by cell types
The percentage of variation of white matter atrophy profiles explained by cell types was estimated by the R-squared values derived from fitting linear regression models. Specifically, the ‘overall’ mean expression profiles of statistically significant cell types were introduced stepwise into the model as the independent variables, with brain atrophy profile as the dependent variable. The overall mean expression profile, for a specific cell type, was derived by averaging the expression levels across the 34 white matter regions over all the genes labeling a specific cell type. The criteria of stepwise inclusion were as follows: probability of F to enter ≤0.05 and probability of F to remove ≥0.10.
Results
Demographic and cognitive assessments
There were no significant group differences in the age, gender, or education level between mTBI patients and HCs. The most common cause of injury in mTBI patients was road traffic accident (57/100, 57%), followed by assault (22/100, 22%), ground-level fall (12/100, 12%), fall from height (7/100, 7%), and direct impact blow to head (2/100, 2%). 87% (87/100) of patients had definite or suspected acute loss of consciousness and 12% (12/100) patients were suspected to have post-traumatic amnesia. All mTBI patients had a GCS score of 15. Detailed demographic and clinical information of acute-stage patients and HCs was presented in Table 1, and the information for follow-up patients was shown in Supplementary Table S1.
Demographic and Neuropsychological Characteristics of Participants
Continuous variables were presented as mean ± standard deviation and categorical variables were presented as a frequency (percentage).
mTBI, mild traumatic brain injury; HCs, healthy controls.
White matter volumes
The mTBI patients did not show significant white matter atrophy at the acute phase, compared to HCs (p > 0.05, FDR corrected, Fig. 1A). However, there was extensive and significant white matter atrophy in the bilateral frontal, parietal, and temporal cortex at 3 months post-injury (p < 0.05, FDR corrected, Fig. 1B and Table 2). Persistent white matter atrophy was also found in the right frontal pole at 6–12 months post-injury (p < 0.05, FDR corrected, Fig. 1C and Table 2). No significant association was observed between white matter atrophy and the severity of depression and sleep disorders in mTBI patients.

White matter volume comparison between mild traumatic brain injury (mTBI) patients and healthy controls (HCs).
Group Differences Between mTBI Patients and HCs in White Matter Volume
FDR, false discovery rate; HCs, healthy controls; mTBI, mild traumatic brain injury.
Patients were then divided into two sub-groups (patients with and without impaired cognitive IPS) based on IPS performance. The one-way ANCOVA analysis indicated that group effects were significant among HCs and subgroups of mTBI patients at all stages post-injury. Post hoc analysis further showed that acute mTBI patients with impaired IPS (n = 83) presented significant white matter brain atrophy in the bilateral parietal, frontal, and temporal cortex compared to matched HCs (Fig. 2 and Supplementary Table S2). In contrast, acute mTBI patients without impaired IPS (n = 17) exhibited no significant differences in any white matter brain volumes compared to HCs (Fig. 2 and Supplementary Table S2). For 3 months post-injury, both patients with (n = 35) and without (n = 25) impaired IPS showed significant white matter atrophy in the bilateral parietal, frontal, and temporal cortex compared to HCs, whereas patients with impaired IPS demonstrated a more extensive range of the brain atrophy (Fig. 2 and Supplementary Table S3). For 6–12 months post-injury, only patients with impaired IPS (n = 20) presented significant and persistent white matter atrophy compared to both HCs and patients without impaired IPS (n = 17) (Fig. 2 and Supplementary Table S4).
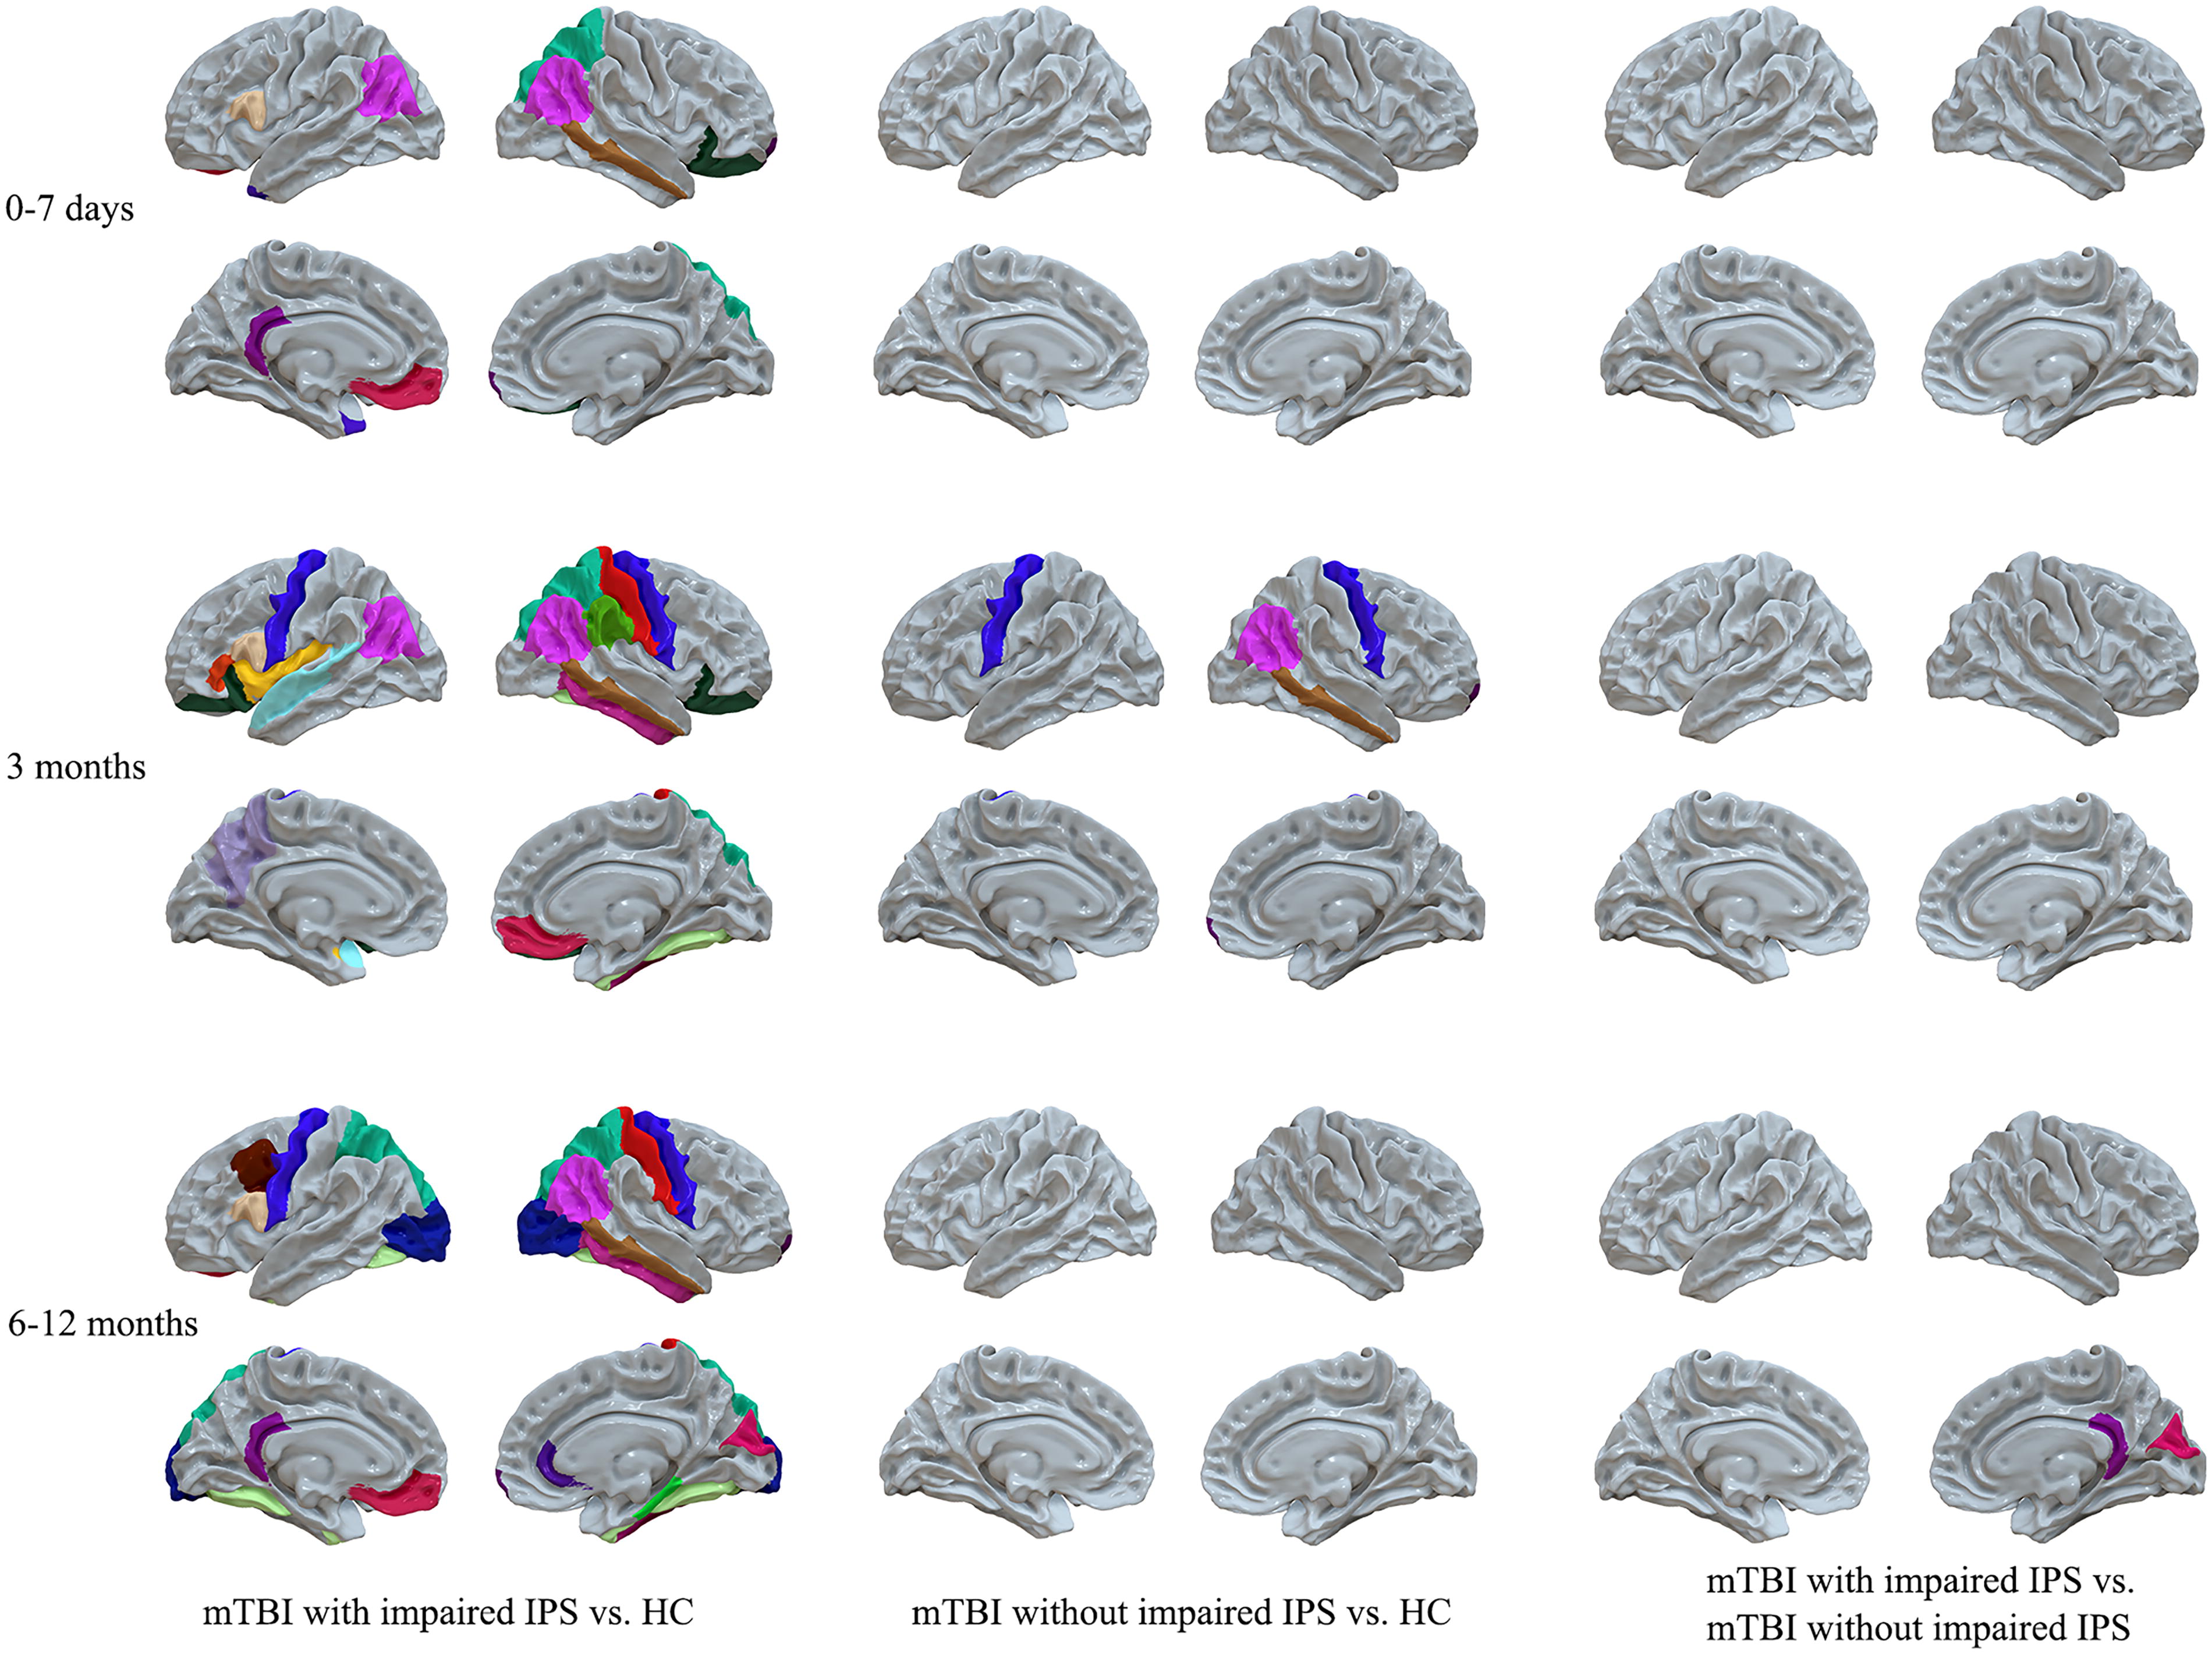
White matter volume comparison among healthy controls (HCs), mild traumatic brain injury (mTBI) patients with impaired information processing speed (IPS), and mTBI patients without impaired IPS. Colored regions in the first column indicated significant white matter atrophy regions in mTBI patients with impaired IPS compared to HCs. The colored regions in the second column indicated significant white matter atrophy regions in mTBI patients without impaired IPS compared to HCs. The colored regions in the third column indicated significant regions of white matter atrophy in mTBI patients with impaired IPS compared to those without impaired IPS. In the acute stage, 83 patients with mTBI were diagnosed with impaired IPS, while 17 mTBI patients did not have impaired IPS. At the 3 months post-injury follow-up, 35 mTBI patients exhibited impaired IPS, and 25 patients did not exhibit impaired IPS. At the 6–12 months post-injury follow-up, 20 patients had impaired IPS, and 17 patients did not have impaired IPS.
Association between cell-specific gene expression and white matter atrophy in mTBI
To explore the contribution of cell-specific gene expression to brain atrophy, we correlated the white matter atrophy at 3 months post-injury with the expression profiles of cell-specific genes in the whole patient group. The detailed inter-regional profile of white matter atrophy across the 34 regions is shown in Figure 3A. Besides, Figure 3B illustrates in detail the analysis steps for the inter-regional correlation between cell-specific gene expression and white matter atrophy, with microglia serving as an example.
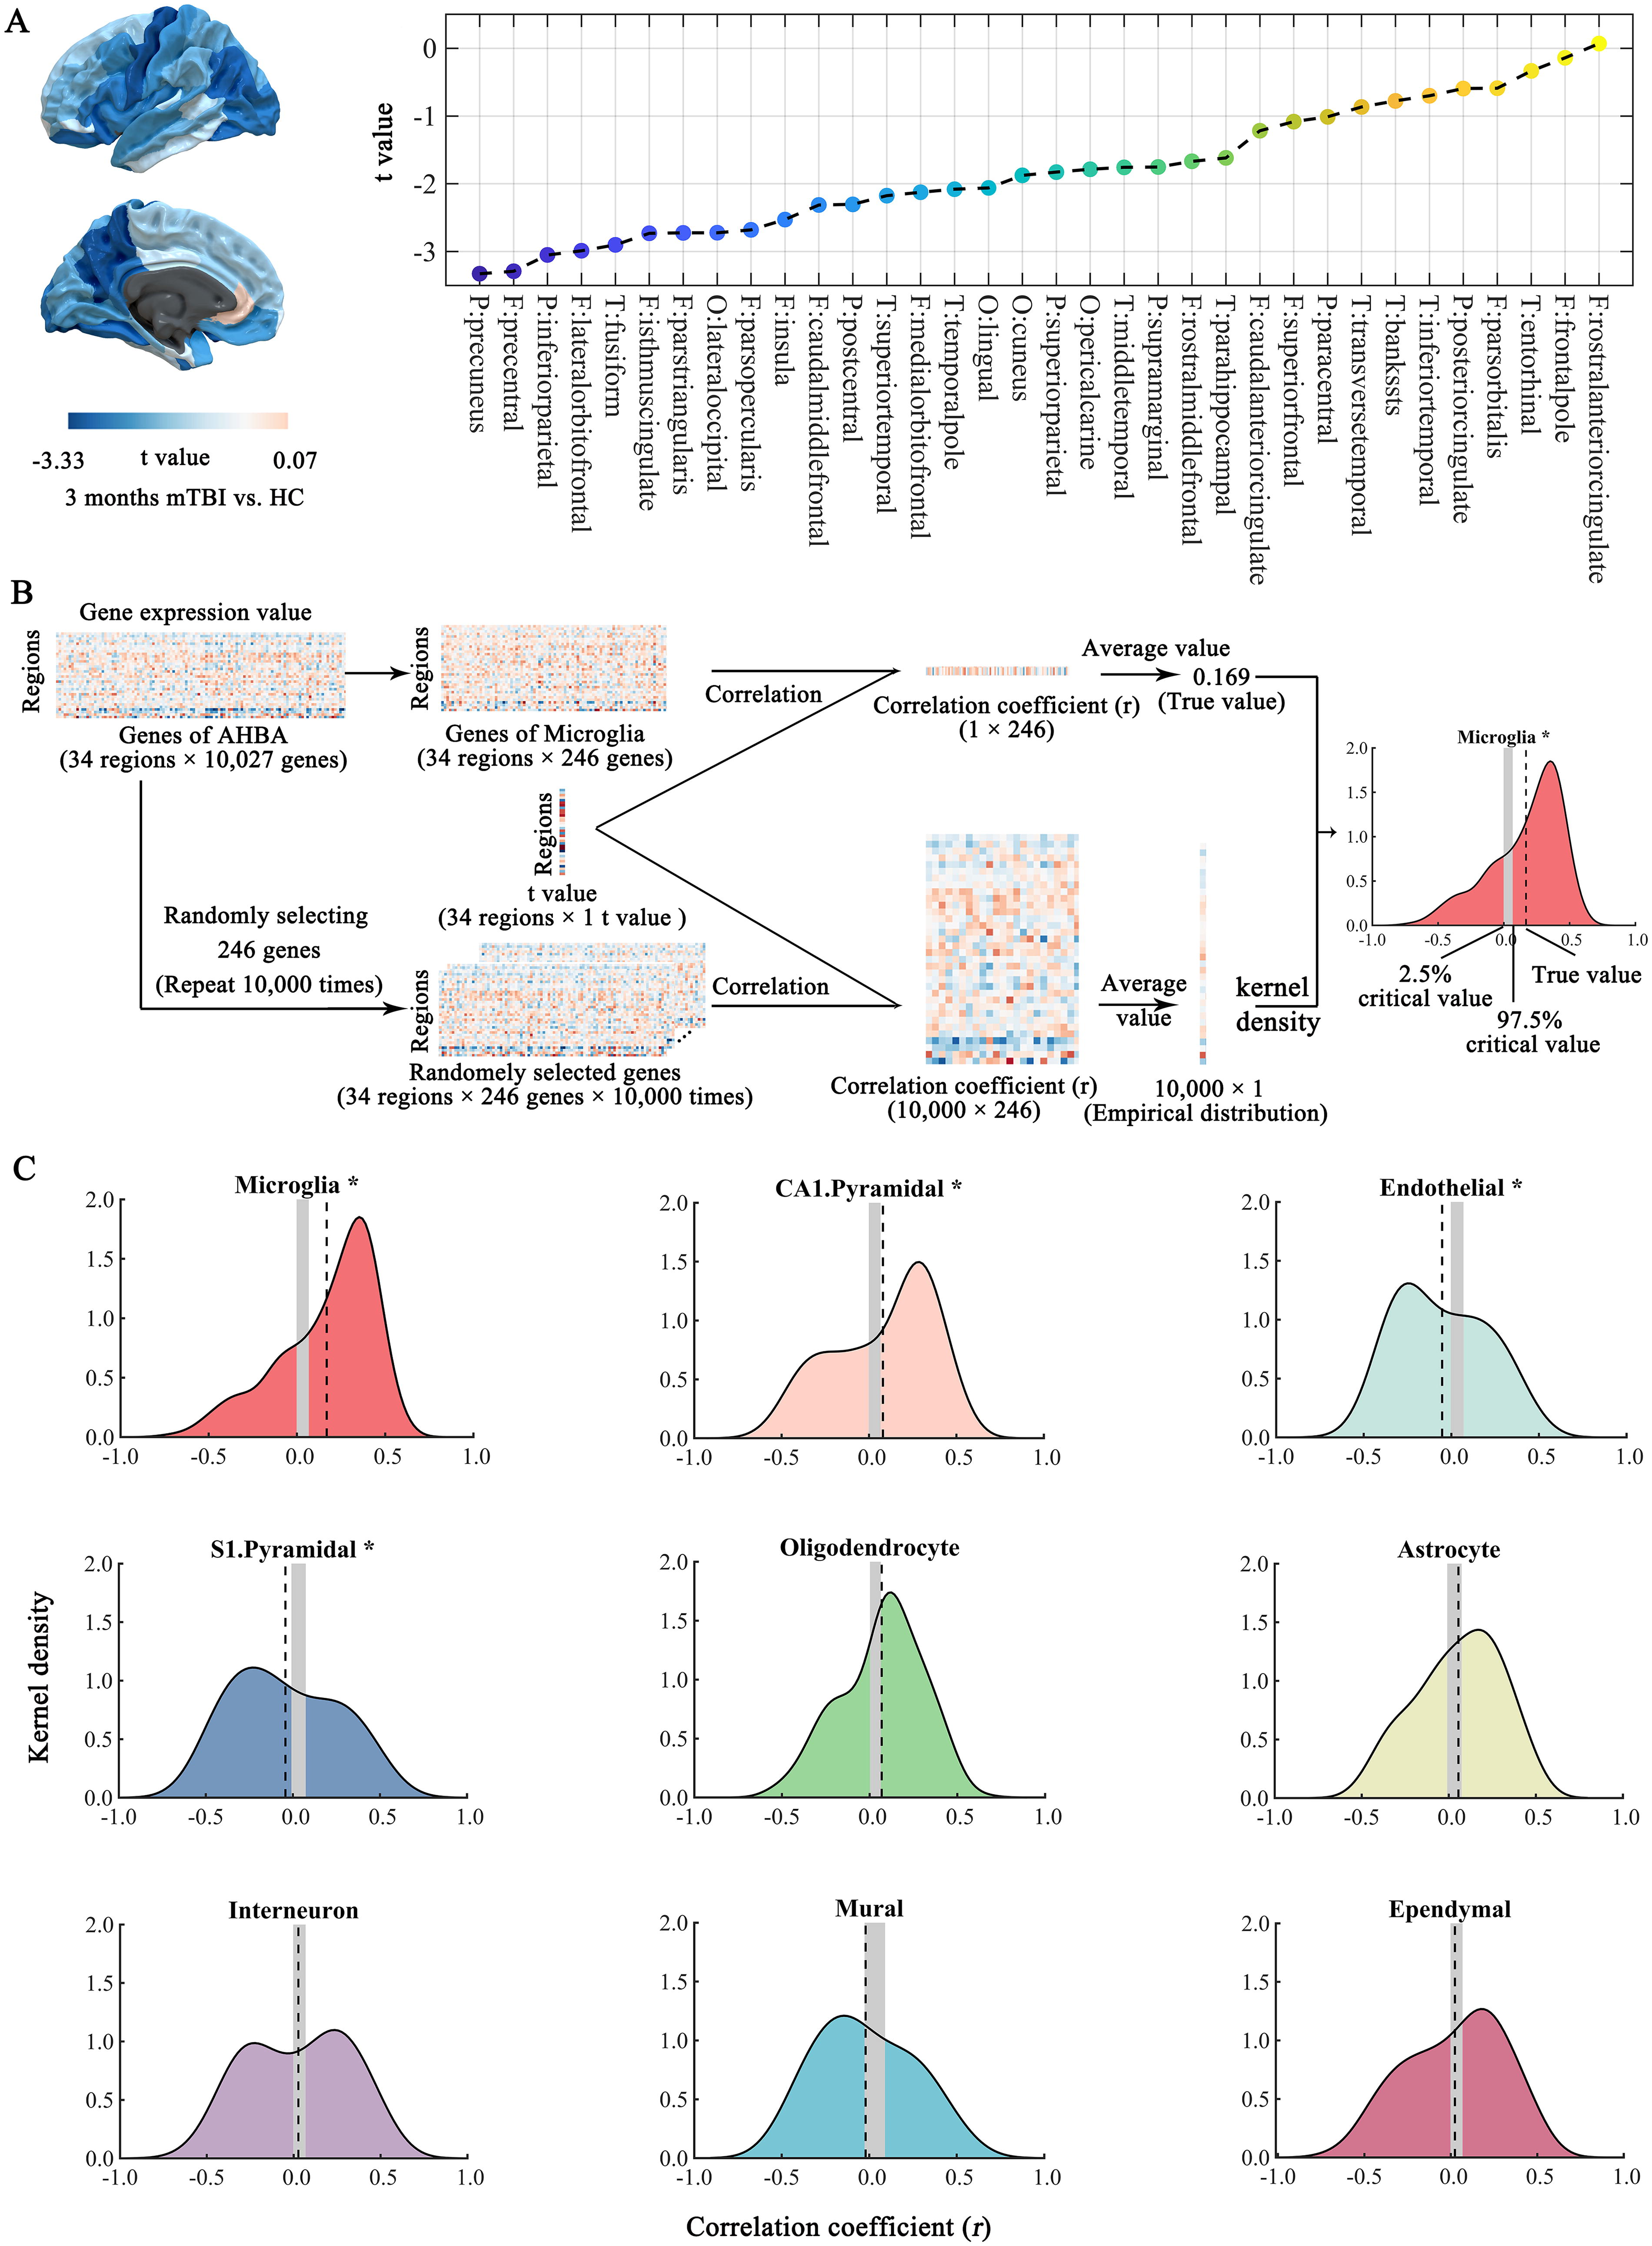
Inter-regional correlation between white matter atrophy in mild traumatic brain injury (mTBI) and cell-specific gene expression.
We observed that the mean correlation coefficients for each of the following cell types differed from the empirical null distribution: microglia (p < 0.001), CA1 pyramidal neurons (p = 0.004), endothelial (p < 0.001), and S1 pyramidal neurons (p < 0.001) (Fig. 3C and Table 3). Note that the distribution of correlation coefficients for microglia and CA1 pyramidal neurons was positively skewed, indicating a higher-than-expected number of positive correlations between white matter atrophy and expression profiles. Higher gene expression levels were associated with weaker brain atrophy. The mean correlation coefficients for the microglia and CA1 pyramidal neurons were 0.169 and 0.080, respectively (Fig. 3C and Table 3). In contrast, the distribution of correlation coefficients for the endothelial and S1 pyramidal neurons was negatively skewed, indicating a higher-than-expected number of negative correlations between white matter atrophy and expression profiles. Higher gene expression levels were associated with greater brain atrophy. The mean correlation coefficients for endothelial and S1 pyramidal neurons were −0.053 and −0.043, respectively (Fig. 3C and Table 3).
Association between Cell-Specific Gene Expression and White Matter Atrophy in mTBI at 3 Months Post-Injury Across 34 Brain Regions
To account for the potential for multiple comparisons, the p values underwent adjustment using the Bonferroni method, with a corrected significance threshold of p < 0.05/9 = 0.0056. Any p values that retained their significance following this correction are highlighted in bold.
mTBI, mild traumatic brain injury.
In addition, the stepwise multiple linear regression analysis of the four significant cell types observed that the microglia and endothelial can explain 23.6% of regional variations of the white matter atrophy in mTBI patients at 3 months post-injury (overall model: F = 6.093, p = 0.006) (Table 4). Specifically, greater microglia gene expression was linked to less severe white matter atrophy (β = 0.521, p = 0.003), whereas higher endothelial gene expression was associated with greater white matter atrophy (β = −0.327, p = 0.048).
Stepwise Multivariate Linear Regression of Atrophy Profiles Variation in mTBI Patients at 3 Months Upon Significant Cell Types
Gene enrichment analysis
As mentioned above, gene markers of pyramidal cells from the two brain regions, namely hippocampus (CA1) and cerebral cortex (S1), showed the inverse relationship between gene expression and white matter atrophy across the 34 regions. Similar opposite relationships were also observed in the microglia and endothelial cells. To understand the mechanism for the relationship between gene expression and brain atrophy, we used gene enrichment analysis based on GO/KEGG enrichment terms to ascertain key differences among the four types of cells. The gene markers of microglia and CA1 pyramidal neurons appeared to be associated with GO terms of inflammation (top GO term: inflammatory response) and neural plasticity (top GO term: regulation of postsynapse organization) respectively (Supplementary Fig. S1A and S1B). Gene marking endothelial and S1 pyramidal neurons were associated with GO terms of the cerebral microvessels (top GO term: blood vessel development) and regulation of membrane potential (top GO term: trans-synaptic signaling) respectively (Supplementary Fig. S1C and S1D).
Discussion
This work sought to better understand the possible cellular mechanisms underlying the selective white matter brain atrophy in patients with mTBI. Significant white matter atrophy was presented in the frontal, parietal, and temporal cortices in mTBI patients at 3 months post-injury, and even persisted at 6–12 months follow-up. Moreover, patients with impaired IPS presented more severe white matter atrophy compared with those without impaired IPS. Crucially, the brain atrophy inter-regional variation was associated with gene expression of the microglia, endothelial cells, CA1 pyramidal cells, and S1 pyramidal cells in mTBI patients at 3 months post-injury. Microglia and endothelial cells can explain 23.6% of the regional variation in the white matter atrophy. This study might provide valuable insight into improving the clinical prognosis of the mTBI by pharmacologically modulating cellular activation.
Diffuse axonal injury is the predominant pathology of TBI and is associated with progressive white matter atrophy. 20 However, most evidence has been documented in moderate to severe TBI years post-injury. 5 Since the majority of the TBIs sustained in civilian and military contexts are within the mild range, 44,45 brain atrophy especially in the white matter requires further study in mTBI patients. Our findings observed significant white matter atrophy in mTBI patients at 3 months post-injury and this atrophy persisted up to 6–12 months. A previous study, 46 supports our findings by indicating longitudinal regional white matter atrophy within the first year post-injury in mTBI patients. In addition, Jarrett et al. 47 have reported brain volume reductions in athletes following mTBI, with measurements taken at 3 days, 2 weeks, and 2 months post-concussion, suggesting that the process of atrophy may manifest within the first few months. The recent study by Goldman-Yassen et al. 48 also supports our results by showing a near-term decrease in brain volume detected by CT after mTBI, implying that neurodegeneration may commence shortly after the injury. Furthermore, MRI evidence confirms these findings, demonstrating volume loss in 21% of mTBI patients within 3–7 months post-injury. 49 Collectively, these studies reinforce the notion of early neurodegenerative changes post-mTBI and emphasize the importance of ongoing surveillance and intervention to address the long-term effects on brain health. Notably, consistent with previous studies, 5 brain atrophy after mTBI did not appear to be positively correlated with time after injury, suggesting atrophy is not merely a manifestation of slow Wallerian degeneration, which might be expected to decay in magnitude predictably over time. These findings were also supported by previous studies that atrophy rates are significantly elevated and change dynamically in the first 3–6 months post-injury. 50,51 Importantly, post-traumatic white matter damage is an essential determinant of cognitive deficits following TBI. 52 IPS deficits have been consistently reported after mTBI, 53 and are considered to be the earliest cognitive deficits presented in the preclinical phase of dementia. 54 Our previous study employs diffusion metrics in white matter tracts at the acute phase to successfully identify mTBI patients developing IPS deficits at 6–12 months follow-up. 27 Here, we observed that only mTBI patients with IPS deficits exhibited persistent white matter atrophy throughout the acute stage, 3 months, and 6–12 months post-injury. This may provide a neuroimaging biomarker to identify mTBI patients with cognitive deficits.
The regions of white matter atrophy were primarily located in the frontal, parietal, and temporal cortices. These regions are more susceptible to injury, possibly because they experience greater strain and deformation during TBI. 55 Our study, for the first time, provided evidence that the selective white matter atrophy might be partly attributed to gene expression in microglia, endothelial cells, CA1 pyramidal neurons, and S1 pyramidal neurons. More interestingly, distinct cell types showed differentiation in the contribution to brain atrophy in mTBI patients. Specifically, the expression patterns of endothelial cells and S1 pyramidal neurons were associated with more severe atrophy, while the expression of microglia and CA1 pyramidal neurons correlated with less severe atrophy in mTBI patients at 3 months post-injury. Enrichment analysis offers an opportunity to explain the biological role of cell-specific marker gene sets. As shown in Supplementary Figure S1, the enrichment analysis of the microglia-specific gene set revealed that the most significant GO term was inflammatory response, which supported the crucial role of microglia in regulating the inflammatory process. Similarly, the enrichment analysis of the CA1 pyramidal neuron-specific gene set identified regulation of postsynapse organization as the top GO term. This result profoundly revealed the association between this gene set and neural plasticity, further emphasizing the key role of these genes in the reshaping of neuronal connections. In addition, the enrichment analysis of endothelial cell-specific gene set uncovered blood vessel development as its core GO term, directly indicating the essential role of endothelial cells in the construction and development of the cerebral microvascular network. Lastly, the enrichment analysis of the S1 pyramidal neuron-specific gene set discovered trans-synaptic signaling as its top GO term, which not only revealed the central role of these genes in inter-neuronal signaling but also implied their tight relationship with membrane potential regulation and neuronal excitability regulation.
Microglial activation has commonly been reported in various white matter-related diseases. 56 Traditionally, microglia serve as a powerful source of pro-inflammatory molecules and thus contribute to the onset and progression of neurodegenerative diseases. 57,58 Contrary to previous studies that have implicated activated microglia in detrimental effects, our findings indicated a positive association between increased microglia-specific gene expression and reduced white matter atrophy in mTBI patients at 3 months post-injury. The complex dualistic role of microglia, as highlighted in a recent review, 56 supports the concept that microglia can manifest both harmful and beneficial phenotypes depending on the stage of CNS injury. Although they might exacerbate damage in the acute stage, they have the potential to facilitate repair and remyelination in subsequent stages. Moreover, our findings aligned with a recent study that indicates inhibiting microglial activation with minocycline in patients with moderate-severe TBI is associated with increased levels of neurodegeneration markers, suggesting a possible reparative role for microglial activation in the chronic phase of TBI. 12 These insights imply that microglial activation might be essential for the brain’s healing processes post-injury, and its suppression might inadvertently exacerbate neurodegeneration. Furthermore, the majority of preclinical studies have demonstrated that administering the first dose of minocycline within an hour after TBI improves multiple outcomes, but delayed administration rarely yields similar benefits. 59 In summary, our findings, supported by recent literature, call for a re-evaluation of the pivotal role of microglia in mTBI recovery. Future studies should focus on elucidating the dynamics of microglial activation and on developing interventions that can effectively leverage their protective capacities while mitigating their harmful effects. Endothelial cells, supported by tight junction-associated proteins or junction proteins, play an essential role in maintaining BBB integrity. 17 A recent study has indicated that localized BBB breakdown is associated with vascular damage. 60 More importantly, this study has revealed that TBI-caused microbleeds gradually increased over 3 months and that microbleeds are associated with white matter degeneration. Thus, endothelial cell-enriched brain regions are more susceptible to developing brain atrophy at 3 months after mTBI, which may be attributed to neurodegeneration caused by vascular injury in the regions. Moreover, the findings of two pyramidal neurons with opposite effects on white matter atrophy were consistent with a previous study, which has found that S1 pyramidal neurons contribute to promoting cortical thinning, whereas CA1 pyramidal neurons are engaged in keeping a thick cortex. 25 The GO analysis of the two panels of genes revealed that S1 pyramidal neurons and CA1 pyramidal neurons were associated with the regulation of membrane potential and neural plasticity, respectively. Therefore, we speculated that S1 pyramidal neurons promoting brain atrophy may be implicated in their modulation of intra- and extracellular potassium concentrations and thus affecting apoptosis, 61 whereas CA1 pyramidal neurons inhibiting brain atrophy may be linked to their neural plasticity to dendritic branches or dendritic spines. 25 Critically, a previous study has thoroughly analyzed the intrinsic connection between the dendritic morphology of neurons and the extent of axonal projection, clearly revealing that an increase in dendritic structural complexity is accompanied by a broad expansion of the neuronal axonal projection range. 62 This finding further strengthens the central role of pyramidal neurons in the efficient transmission of axonal nerve signals in the white matter and provides important clues for understanding the information transmission mechanism of brain neural networks.
However, there were also several limitations. Despite the execution of multiple strategies aimed at optimizing participant retention, a notable subset of patients did not return for their follow-up visits. The attrition rate in our study was similar to that of the previously published TBI study. 63 We conducted a comparative analysis of the demographic, clinical, and imaging variables between patients with mTBI who participated and those who did not participate in follow-up assessments at two-time points: 3 months post-injury (Supplementary Table S5) and 6–12 months post-injury (Supplementary Table S6) at the acute stage. The results indicated that while significant inter-group differences were observed in post-traumatic amnesia symptoms and the causes of mTBI between patients who did and did not participate in the 3 months follow-up at the acute stage, no significant differences were found between the two groups in other key demographic, clinical, and imaging variables. Therefore, we considered that the follow-up cohort was, to a certain extent, representative of the initial dataset. The decrease in the proportion of patients with post-traumatic amnesia at the 3 months post-injury follow-up was attributed to the inability to contact patients, their non-attendance, and personal reasons that prevented them from completing the follow-up. Among the patients who participated in the follow-up at 3 months post-injury, a higher proportion of mTBI cases caused by road traffic accidents was noted. This phenomenon may be attributed to economic compensation mechanisms or insurance policy coverage, 64 which effectively reduced the patients’ financial burden and consequently promoted their willingness to participate in the follow-up. In addition, we could only provide indirect evidence of the potential cellar molecular mechanisms underlying selective brain atrophy in white matter regions after mTBI, as causal inferences cannot be drawn from the cross-sectional data. The AHBA data were based on a small sample of healthy adult brains. Therefore, our results might not generalize to all populations. Nevertheless, using neurotypical samples from the AHBA is informative because it allows us to infer molecular mechanisms in mTBI patients. Besides, persistent post-traumatic headache is one of the most common sequelae following TBI. 65 Given that our study did not collect headache assessment parameters from participants, we were unable to investigate the potential association between the severity of headaches and the extent of white matter atrophy in our patient cohort. Future research is encouraged to explore this relationship further.
Conclusions
In conclusion, our work provided evidence of white matter atrophy progression in mTBI patients from the acute stage to the chronic stage and its association with IPS deficits and cell-specific gene expression. mTBI patients with impaired IPS exhibited more severe white matter atrophy compared with those without impaired IPS. Importantly, the selective brain atrophy might be partly attributed to gene expression of specific cell types in mTBI patients, particularly microglia and endothelial cells. This work may shed insights into the possible cellular mechanisms underlying the selective white matter brain atrophy in mTBI patients and provide new clues for making informed medication decisions to decrease later-life dementia risk.
Transparency, Rigor, and Reproducibility Summary
The study was pre-registered at clinicaltrials.gov (NCT02868684). The analysis plan was not formally pre-registered. A sample size of 100 subjects per group was planned on an expected effect size of 0.4 (Cohen’s d) calculated to yield 80% power to detect a significant difference using a 2-tailed Student t-test with a p value <0.05. One hundred patients with mTBI and 59 age-, gender-, and education level-matched healthy controls were enrolled and successfully analyzed. Participants were told the results of the imaging assessments after the final clinical observations had been made. Imaging data were collected in patients with mTBI at the acute stage (0–7 days post-injury), 3 months, and 6–12 months post-injury. All imaging was collected using the same scanner. Imaging acquisition and analyses were performed by team members blinded to relevant characteristics of the participants, and clinical outcomes were assessed by team members blinded to imaging results. All equipment and software used to perform imaging and preprocessing are widely available from commercial sources. The key inclusion criteria and outcome evaluations are established standards. Replication by the study group is ongoing and preregistered at clinicaltrials.gov (NCT05108909). De-identified data from this study are not available archive. There is no analytic code associated with this study. This article will be published under a Creative Commons Open Access license, and upon publication will be freely available at https://www.liebertpub.com/loi/neu.
Footnotes
Acknowledgment
The authors would like to appreciate deeply for the study participants, their families, and the medical staffs who made this study possible.
Authors’ Contributions
X.J. and L.B.: conceptualization. X.J., Y.P., and X.L.: methodology. X.J., W.Z., and H.Z.: software. X.J., X.Z., and Q.J.: validation. X.J., and L.B.: data curation. X.J.: visualization and writing—original draft preparation. X.J., X.J., J.Z., and L.B.: writing—review and editing. L.B.: supervision, project administration, and funding acquisition. All authors have read and agreed to the published version of the article.
Data Availability Statement
Data will be made available on request.
Authors Disclosure Statement
The authors have no competing interest to disclose
Funding Information
This work was supported by the National Key Research and Development Plan of China (2023YFC3503600), the National Natural Science Foundation of China (Grant No. 82071993), and funds for the Natural Science Basic Research Program of Shaanxi (Program No. 2022JC-55).
Supplementary Material
Supplementary Table S1
Supplementary Table S2
Supplementary Table S3
Supplementary Table S4
Supplementary Table S5
Supplementary Table S6
Supplementary Figure S1
References
Supplementary Material
Please find the following supplemental material available below.
For Open Access articles published under a Creative Commons License, all supplemental material carries the same license as the article it is associated with.
For non-Open Access articles published, all supplemental material carries a non-exclusive license, and permission requests for re-use of supplemental material or any part of supplemental material shall be sent directly to the copyright owner as specified in the copyright notice associated with the article.
