




Abstract
Athletes in collision sports frequently sustain repetitive head impacts (RHI), which, while not individually severe enough for a clinical mild traumatic brain injury (mTBI) diagnosis, can compromise neuronal organization by transferring mechanical energy to the brain. Although numerous studies target athletes with mTBI, there is a lack of longitudinal research on young collision sport participants, highlighting an unaddressed concern regarding cumulative RHI effects on brain microstructures. Therefore, this study aimed to investigate the microstructural changes in the brains’ of high school rugby players due to repeated head impacts and to establish a correlation between clinical symptoms, cumulative effects of RHI exposure, and changes in the brain’s microstructure. We conducted a longitudinal magnetic resonance imaging (MRI) study on 36 male high school rugby players across a season using 3D T1-weighted and multi-shell diffusion MRI sequences, comparing them with 20 matched controls. Players with concussions were separately tracked up to 6 weeks post-injury with three-times scans within this period. The Sport Concussion Assessment Tool (SCAT5) symptom scale assessed mTBI symptoms, and mouthguard-embedded kinematic sensors recorded head impacts. No significant volumetric changes in subcortical structures were found post-rugby season. However, there were substantial differences in mean diffusivity (MD) and axial diffusivity (AD) between the rugby players and controls across widespread brain regions. Diffusion metrics, especially AD, MD, and radial diffusivity of certain brain tracts, displayed strong correlations with SCAT5 symptom severity. Repeated head impacts during a rugby season may adversely affect the structural organization of the brain’s white matter. The observed diffusion changes, closely tied to SCAT5 symptom burden, stress the profound effects of seasonal head impacts and highlight individual variability in response to repetitive head impact exposure. To better manage sports-related mTBI and guide return-to-play decisions, comprehensive studies on brain injury mechanisms and recovery post-mTBI/RHI exposure are required.
Introduction
Participating in sports and recreational activities has physical, behavioral, psychological, and social benefits, particularly in adolescents. 1 –3 With these benefits comes the risk of injury, especially in collision sports. In recent years, the short- and long-term consequences of collision sports on brain health have been receiving increasing attention in both academic and public forums.
Compared with college and professional athletes, adolescents’ brains have been shown to be more vulnerable to repetitive head impacts (RHI) and mild traumatic brain injury (mTBI) due to thinner cortical thickness and weaker supportive neck muscles. 4 Experiencing mTBI or RHI during the critical period of neurodevelopment in adolescence may lead to behavioral and cognitive impairment in later life. 5,6 Moreover, collision sport athletes often experience RHI during training and games, which transfers mechanical energy into the brain and has been shown to compromise neuronal integrity; yet, no single impact is severe enough to result in a clinically diagnosed mTBI. 7 According to previous studies, on average, high school American football players experience 600 head impacts across a season 8 with a mean linear acceleration of 24.7 g. 9 Accumulation of RHI may contribute to future neurological impairments; however, the magnitude of the relationship remains unclear. 10
Until recently, there were limited longitudinal studies to investigate the effect of RHI. 10 By collecting kinematic information with head impact telemetry systems or instrumented mouthguards (iMG), researchers have investigated the correlation between the biomechanics of impacts (e.g., frequency, magnitude, acceleration) and subtle microstructural changes in the brains of athletes. However, there is still inconsistency in the results regarding the association between RHI exposure and its effect on brain health. 11 Hence, further longitudinal research is required to characterize the pattern of structural and functional changes in the brain of collision sports players.
Advanced neuroimaging techniques can quantitatively assess the potential damage to players’ brains following concussive or subconcussive injuries. Diffusion magnetic resonance imaging (dMRI) can provide objective biomarkers of the microstructural alterations in white matter fiber tracts of the brain at various timepoints after a brain injury. dMRI has been shown as a sensitive diagnostic method to detect diffuse axonal injury that appears in the brain following traumatic brain injury. 12
Diffusion abnormalities in brain White Mattter (WM) have been reported in a range of mTBI studies; however, inconsistency in the direction of change and the lack of neurobiological specificity have limited the clinical application of dMRI. 13 Additionally, methodological discrepancies (e.g., study design, cross-sectional vs. longitudinal, diffusion sequence, inclusion and exclusion criteria for the study groups, diffusion analysis method, time of imaging) contribute to inconsistent findings across the literature. 14 Most neuroimaging studies on collision sports players have focused on athletes diagnosed with mTBI. However, limited volumetric longitudinal studies have been conducted on adolescents actively participating in collision sports. There remains a gap in knowledge regarding the relationship between accumulated RHI exposure and potential structural alterations in the volume of subcortical structures.
Therefore, the objective of this study was to acquire clinical, kinematic, and imaging data to investigate the relationships between RHI/mTBI exposure and brain health in adolescent athletes participating in a collision sport. The primary research question was: how does one season of RHI exposure or a clinically diagnosed mTBI affect volumetric and microstructural changes in the brain of adolescents? The secondary exploratory research question was: Do changes in brain volume and/or microstructure correlate with mTBI-related symptoms or cumulative RHI exposure?
Methods
Research design
Data presented in the current article are an initial subset from an ongoing prospective longitudinal cohort study taking place in Tairāwhiti-Gisborne, New Zealand, to investigate relationships between multi-modal neuroimaging biomarkers, symptomology, and RHI/mTBI exposure. This work was conducted under ethical approval from the New Zealand Health and Disability Ethics Committee (Ethics Ref: 20/NTB/14/AM09). All participants aged 16 years or older provided written informed consent prior to joining the study. Participants <16 years provided written assent along with parental informed consent.
Participants
All participants were adolescent males (14–18 years old) who were actively participating in sports. Rugby training and gameplay are characterized by collision events such as tackles, rucks, scrums, and mauls, which result in RHI exposure and are common mechanisms of injury for mTBI. 15 Amateur rugby union participation is associated with an incidence of 7.97 mTBIs per 1000 game hours. 16 As such, we partnered with a local high school rugby union program to investigate the effects of RHI/mTBI exposure on neuroimaging metrics of brain health. A total of 50 rugby players from the first and second XV teams were eligible to participate in this study. Players were excluded if they self-reported sustaining an mTBI within 6 months prior to joining the study, if they had a pre-existing neurological/neuropsychiatric condition (self-reported?), and/or if they had braces that would cause imaging artifacts.
iMG (see section “Instrumentation” for details) with embedded kinematic sensors were provided to 36 rugby players to quantify individual differences in RHI exposure accumulated over the course of one season. These 36 players are referred to as the RHI cohort for the remainder of the article. If a player sustained a suspected mTBI during training or gameplay, they were removed from play until they could be assessed by an experienced physician in accordance with New Zealand Rugby policy. 17 mTBI was operationally defined according to the World Health Organization Neurotrauma Task Force definition. 18 In the event an mTBI was confirmed by a physician, players became eligible for the mTBI cohort. Participants already enrolled in the study as part of the RHI cohort at the time of injury were migrated to the mTBI cohort; while players not in the RHI cohort had the option to participate. All participants in the mTBI cohort completed a minimum 23-day standdown and graduated-return-to-play protocol before returning to collision training or games as per New Zealand Rugby policy. Data from two RHI players at early-season, one mid-season, and one post-season were removed because of poor diffusion image quality.
A control group of 20 adolescent males engaged in non-collision sports was recruited to allow comparisons of neuroimaging metrics following RHI or mTBI exposure. Controls actively participated in non-collision sports such as basketball, track and field, rowing, and waka ama (outrigger canoe racing) and were matched for sex, age, and ethnicity. Controls were excluded if they self-reported sustaining an mTBI or participating in a collision/martial sport within 3 years of joining the study, if they had a pre-existing neurological/neuropsychiatric condition, and/or if they had braces that would cause imaging artifacts. We did not recruit football/soccer athletes for the control group due to RHI exposure associated with heading.
Study procedure
Participants in the RHI cohort were assessed at three different timepoints: early-season (baseline), mid-season, and post-season. Note that we specify early-season rather than pre-season because a larger group of players underwent a training camp that involved full collision training to determine the first and second XV squads. Logistical constraints prevented baseline assessments from taking place until after these teams were selected. The early-season assessment occurred before the first competitive pre-season game. At each timepoint, participants underwent a multi-modal MRI scan accompanied with an assessment of symptoms commonly associated with mTBI. Between timepoints, participants in the RHI cohort wore a custom-fit iMG during gameplay and training periods that involved collisions. A researcher was embedded with the team to maximize iMG compliance and to recognize and replace any faulty iMGs as soon as possible. The mTBI cohort was also assessed at three different timepoints: within 1 week post-injury (Timepoint A), 3 weeks post-injury (Timepoint B), and 8 weeks post-injury (Timepoint C). The mTBI cohort completed the same MRI scan protocol and symptoms assessments as the RHI cohort to enable comparison. Finally, the control group was scanned at a single timepoint.
Instrumentation
A bespoke kinematic sensor mouthguard HitIQ® Nexus A9 was molded to fit the oral cavity of each player in the RHI cohort to record the linear and angular acceleration of the head impacts for every participant. The measured impact data from the mouthguard were first processed with HitIQ’s proprietary algorithm to reduce noise and range of individual impacts. We then utilized multiple total force filtering methods to identify areas of strong correlation using a custom filtering threshold. Based on the literature, this has been set to a linear force filter threshold of 59 g and an angular force filter of 2700 rad/s2. 19 These processed kinematic data were then used for further investigation to identify the correlation between these forces and the measured changes in the structure of the rugby players’ brain MRI scans. Head impacts were measured by calculating the cumulative angular and linear acceleration at the end of the season.
Symptom evaluation
Symptoms commonly associated with mTBI were assessed at each timepoint using the Sport Concussion Assessment Tool (SCAT5) symptom scale. 20 Twenty-two symptoms (i.e., headache, difficulty concentrating, and feeling in a fog) were ranked on a Likert scale from 0 to 6, with 0 representing no symptom present and 6 representing a severe symptom. Symptom burden was determined using the total number of symptoms reported (out of 22 possible symptoms) and total symptom severity (out of a maximum severity score of 132).
MRI acquisition
All MR scans were acquired on a 3.0 T MR scanner (GE SIGNA Premier; General Electric, MI, USA) using a 48-channel head coil. A high-resolution 3D T1-weighted (T1-W) inversion recovery (IR)-prep, fast IR RF-Spoiled Gradient echo sequence (repetition time [TR] = 6.6 ms, echo time [TE] = 2.7 ms, flip angle = 12°, inversion time [TI] = 600 ms, matrix size = 512 × 512, FOV = 224 × 224 mm, number of slices = 320, voxel size = 0.4 × 0.4 × 0.5 mm), and a sagittal 3D T2-fluid-attenuated inversion recovery sequence (TR = 6300 ms, TE = 100 ms, flip angle = 90°, TI = 1840 ms, matrix size = 264 × 512, FOV = 163 × 259 mm, number of slices = 512, voxel size = 6 × 5 × 5 mm) were acquired. These anatomical scans were used by a radiologist to assess any evidence of cerebral edema and also for processing subcortical segmentation and cortical analysis. T1-W images were also implemented as a reference for image registration. A multi-shell spin-echo diffusion-weighted MRI was also performed (TR = 4500 ms, TE = 70 ms, flip angle = 90°, matrix size = 128 × 128, FOV = 260 × 260 mm, number of slices = 80, voxel size = 2 × 2 × 2 mm, parallel reduction factor = 2, multiband factor = 3, b-value = 0, 1000, 2000, 3000 s/mm2, 54 gradient directions = 4, 15, 15, 20, respectively) to provide structural connectivity data of the brain. This multi-parametric MRI protocol consisted of more than seven different advanced sequences with a total scan time of around 45 min. However, the current analysis is limited to structural sequences with a total scan time of 10 min.
MR image processing and quality control
Different image processing tools were applied for each part of the MR image analysis. T1-W and T2-W images were used to segment the subcortical structures of the brain of each participant (Fig. 1). To segment and measure the volume of subcortical structures, AccuBrain® was used, 21,22 which is a clinically applicable artificial intelligence-assisted brain imaging assessment tool, 23 except for the corpus callosum (CC), which AccuBrain does not provide automatic segmentation. Therefore, we first performed non-linear registration 24 of the T1-W brain extracted image on the MNI152_T1_1mm brain atlas. Then the CC mask CC from the John Hopkins University (JHU) ICBM-DTI-81 white matter atlas 25 was warped back into the subject’s native space using the generated transformation matrix. All volumetric data were normalized by dividing the absolute value by the size of the intracranial volume (ICV).
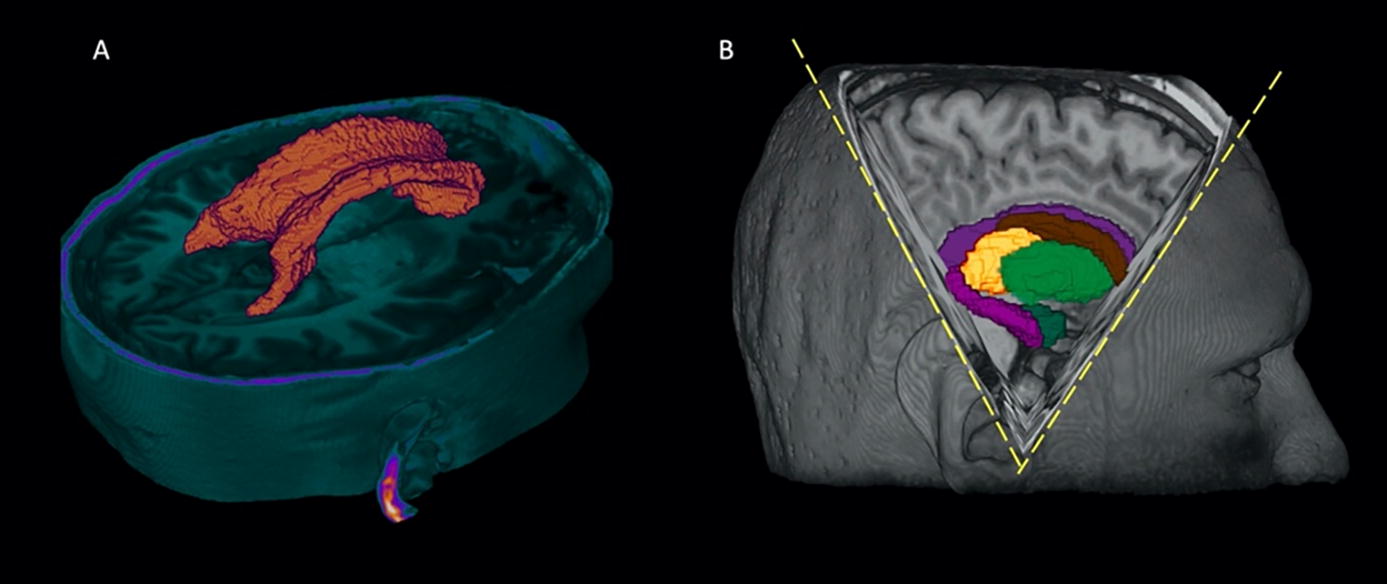
Segmented structures for volumetric analysis.
The diffusion images were mainly processed with utilities from FSL version 6.0. 26,27 First, FSL and MRtrix version 3.0.2 28 were used for pre-processing to remove noise 29 and Gibbs’ ringing artifacts 28 as well as eddy current-induced distortion and rigid body motion artifact using the eddy tool in FSL. 30 The slice-to-volume motion correction was also applied using the mporder 31 option to remove the movements that occurred within the volumes. The residual map was also generated for each scan to see the difference between observation and prediction for further quality checks. After eddy, all outputs underwent automated quality control steps using the eddy_quad command, 32 which provides good indicators for detecting outliers.
These pre-processed diffusion images first passed the brain extraction step to remove the non-brain voxels. For this purpose, a T1-W image was used as a reference, and the brain was extracted from the whole head using HD Brain Extraction Tool (HD-BET)—an open-source brain extraction tool. 33 The brain mask generated from T1-W was then rigidly registered to the diffusion image and used to mask out non-brain voxels. To run microstructural analysis, FSL dtifit 34 was used to fit a diffusion tensor model and estimate the diffusion metrics, including fractional anisotropy (FA), MD, AD, and RD. These diffusion metrics were then used by the tract-based spatial statistics (TBSS) tool, 27,34 which generates the skeletonized white matter fiber tracts for all derived scalars diffusion measures.
For further tract analysis, we used TractSeg, an openly available automated tract segmentation tool. 35 This tool is a novel, fully convolutional neural network-based approach that is fast and highly accurate, and which does not need additional registration or parcellation techniques. In order to estimate the fiber orientation distribution (FOD), the multi-shell multi-tissue constrained spherical deconvolution technique from MRtrix 36 was used. The principal directions were then extracted from the fields of fiber orientation distribution function (FODF) peaks with a maximum number of three peaks per voxel. The result is segmenting 72 tracts that were used for tract analysis. 25,37
Statistical analysis
To investigate group differences in the brain white matter tracts, the TBSS tool was applied using the general linear model test on skeletonized diffusion maps. 38 Randomise 38,39 in FSL is a command that was used to run the non-parametric evaluation using a large number of random permutations among the study population to detect statistically significant effects. 40 The number of permutations was set at 5000, corrected for multiple comparisons using a family-wise error rate with p < 0.05 as a threshold for significant results. Threshold-free cluster enhancement option was included when running the randomise function. 41
Two different approaches were carried out for the regions that showed significant differences from TBSS analysis. The first method was to create a mask from those voxels with a threshold of p < 0.05 as the main cluster. This mask was made on each diffusion metric showing significant differences between groups. The second approach was to extract the tracts from this significant cluster. For this purpose, after making a skeletonized binary mask from each WM tract provided by the “JHU White-Matter Tractography” atlas, 25,37 this mask was used as a reference to extract different tracts from the big cluster (Fig. 2). The mean values corresponding to the diffusion metrics from each WM tract were calculated and used for further analysis. Additionally, the total number of voxels (p < 0.05) in the big cluster and each tract was measured. The proportion of that to the total number of voxels in these areas was reported as a percentage value. The segmented tracts include minor forceps, major forceps, body of corpus collosum, inferior longitudinal fasciculus (ILF), inferior fronto-occipital fasciculus (IFOF), anterior thalamic radiation (ATR), corticospinal tract (CST), cingulum, superior longitudinal fasciculus (SLF), and uncinate fasciculus (UF).
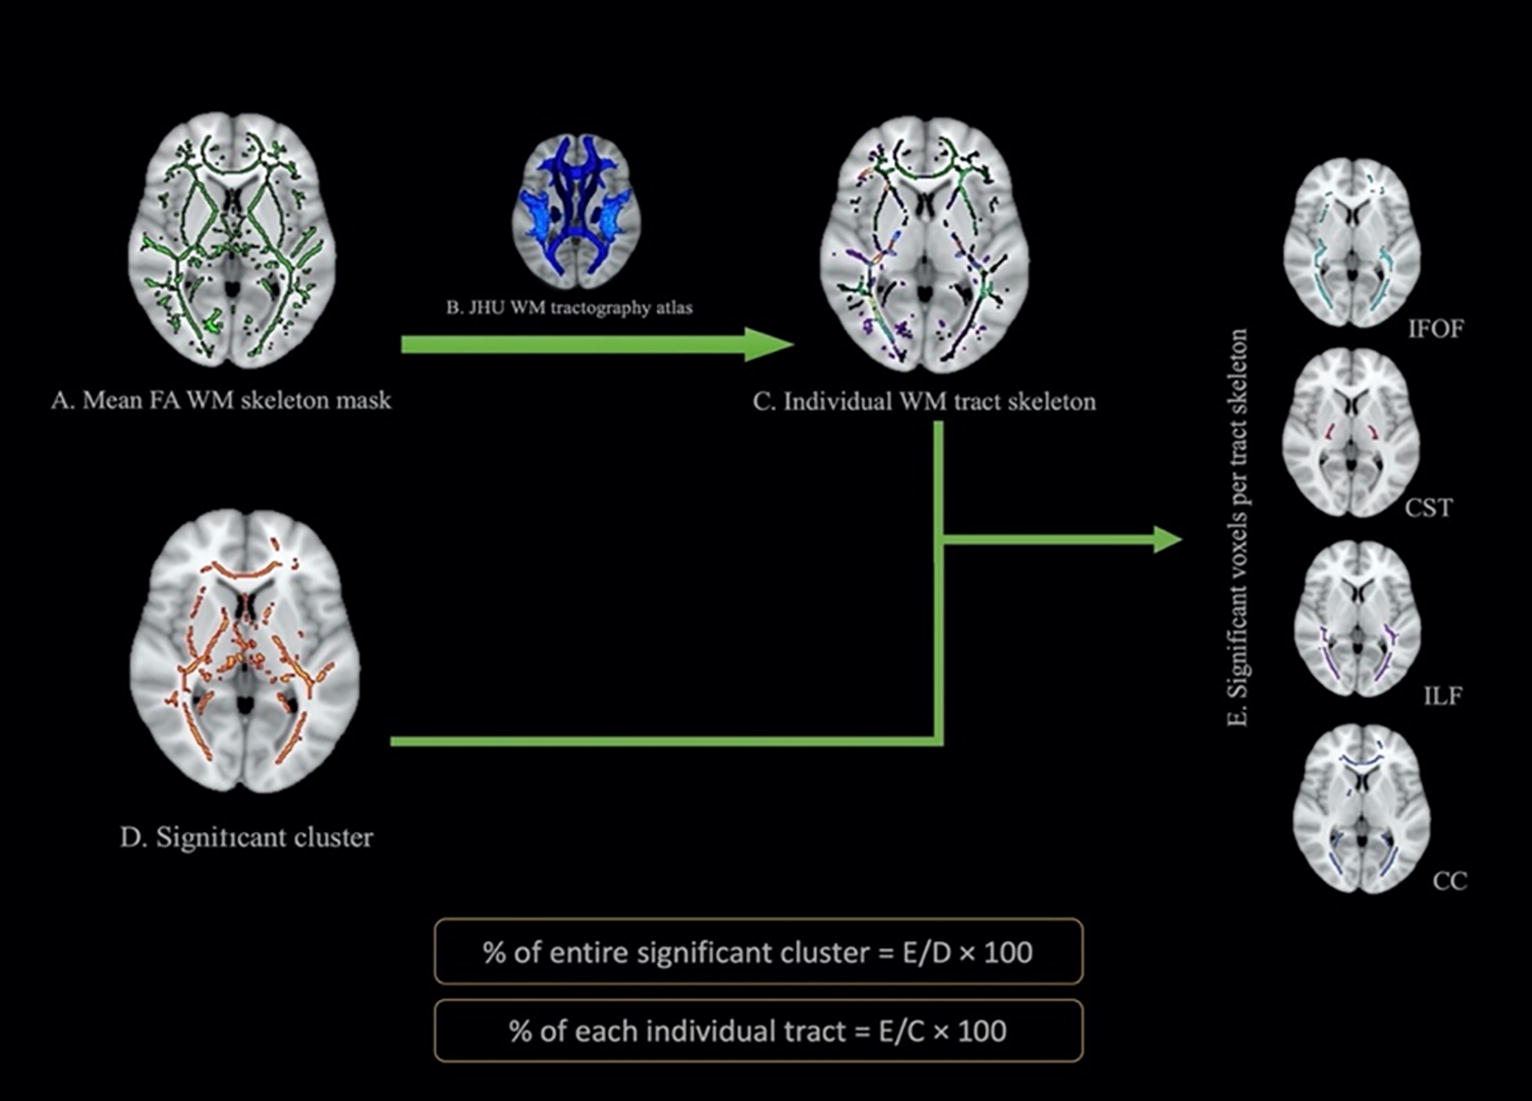
Pipeline for ROI analysis for TBSS results. CC, corpus callosum; CST, corticospinal tract; FA, fractional anisotropy; IFOF, inferior fronto-occipital fasciculus; ILF, inferior longitudinal fasciculus; JHU, John Hopkins University; TBSS, tract-based spatial statistics.
To assess the effect size between the rugby and control groups, Cohen’s d was calculated using the means and standard deviations (SDs) of the AD and MD values from regions that showed significant differences. The pooled SD was computed by combining the variances of the two groups, weighted by their sample sizes. Cohen’s d was then obtained by dividing the difference in means by this pooled SD. Additionally, a 95% confidence interval (CI) for Cohen’s d was calculated to provide a measure of precision for the effect size estimate.
Group differences in demographic, SCAT5, and kinematic data were tested using SPSS software (version 28.0). Chi-square tests were used to test categorical data while independent Student’s t-tests were used for normally distributed continuous variables. Due to the ordinal nature of SCAT5 symptom data, Mann–Whitney U and Wilcoxon tests were used for between- and within-group comparisons, respectively. To investigate the effect of time on the volume of the subcortical structure, a multivariate analysis of variance was utilized to account for age as a covariate. All testing was two-tailed with a prior α set to 0.05. Post hoc comparisons were conducted using Bonferroni correction to control for multiple comparisons. The Pearson correlation test was used to determine the association between the clinical/kinematic data and change in diffusion metrics within one season of playing rugby. For this purpose, the difference in the average of diffusion metrics (ΔFA, ΔMD, ΔAD, ΔRD) of the main WM tracts from the pre- to the post-season scan was calculated.
Results
Demographics
Descriptive statistics for the three groups included in this study are presented in Table 1. Briefly, the mean overall age of participants was 16.2 ± 0.97 years, and no significant difference in age was found between the three groups (p > 0.05). The majority of the participants were New Zealand Māori (67.4%). The rest were New Zealand European (21.0%) and Pasifika (11.6%). A chi-square test demonstrated no significant difference in ethnicity between groups (p = 0.175). Likewise, an independent t-test did not show any significant age difference between ethnicities. Among participants in the RHI cohort, 49% had a history of one or more mTBIs before joining the study. In the mTBI cohort, one-third of participants self-reported a previous mTBI. The initial RHI cohort consisted of 36 rugby players who completed their early-season assessments. Twenty-one players returned for the mid-season examination, and the last scan was conducted on 23 players. In total, the mTBI cohort comprised 10 players who were assessed within 4 ± 4.4 days post-injury. Six of them returned at 19.3 ± 2.4 days and 54.4 ± 15.2 days post-injury. The control group had 20 subjects (Fig. 3).
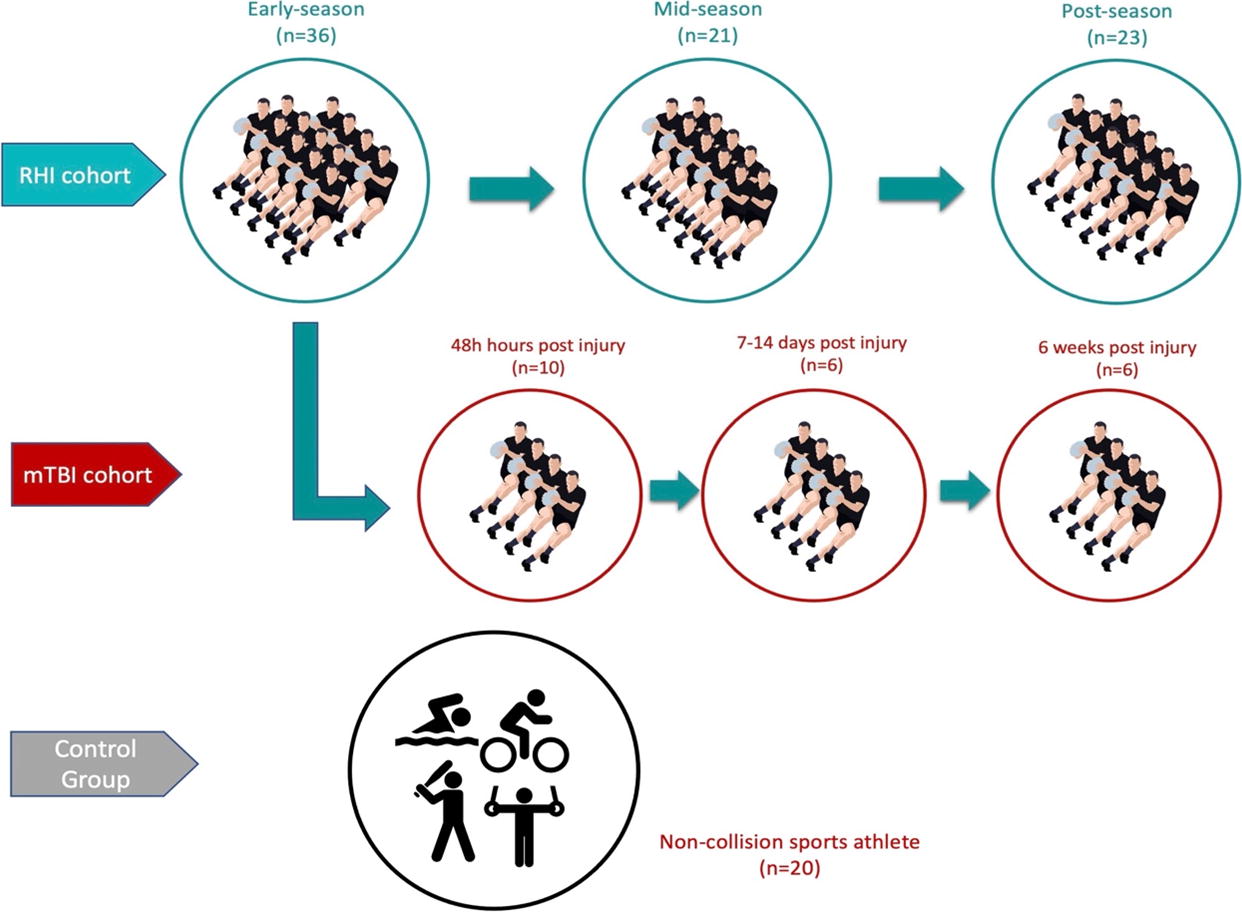
Summary of sample sizes for each cohort at different timepoints. mTBI, mild traumatic brain injury; RHI, repetitive head impacts.
Descriptive Statistics for Demographics and Symptom Evaluation Across Groups
Data are presented as mean ± SD.
Data are presented as frequency (%).
RHI cohort early-season.
mTBI cohort Timepoint A.
RHI cohort mid-season.
mTBI cohort Timepoint B.
mTBI cohort Timepoint A.
RHI cohort post-season.
Data are presented as median [25th percentile; 75th percentile].
mTBI, mild traumatic brain injury; RHI, repetitive head impacts; SCAT5, Sport Concussion Assessment Tool; SD, standard deviation.
Symptom evaluation
Results for SCAT5 symptom evaluations across timepoints for the RHI and mTBI Wilcoxon testing did not indicate any group differences in the number of symptoms or the severity of symptoms in the RHI cohort from the early- to post-season timepoint. Due to low and varying sample sizes across timepoints, we did not perform Wilcoxon testing on repeated symptom measures in the mTBI cohort. However, the highest number of symptoms was observed at Timepoint A (11.0 [8.25–17]) and trended downward at Timepoint B (6 [5.0–6.0]) and Timepoint C (3.0 [1.5–3.75]). The same trend was observed with the greatest severity of symptoms at Timepoint A (21 [13.0–44.0]) and reduced symptoms at Timepoint B (8 [6.0–10.0]) and Timepoint C (3.5 [1.5–5.5]). Pairwise Mann–Whitney U comparisons were performed to evaluate group differences in symptom reporting across timepoints between the RHI and mTBI cohorts. The mTBI cohort reported significantly more symptoms at Timepoint A (11.0 [8.25–17]) compared with the RHI cohort at both early-season (5.0 [2.0–9.5]; p = 0.032) and mid-season (3.0 [1.0–7.25]; 0.013). Similarly, at Timepoint A (21.0 [13.0–44.0]), the mTBI cohort reported significantly greater symptom severity than the RHI cohort at early-season (7.5 [2.0–15.25]; p = 0.036), mid-season (5.0 [1.75–12.0]; p = 0.013), and post-season (5.0 [1.5–12.25]; p = 0.040). No differences in symptom reports between the mTBI cohort at Timepoint B or C were observed compared with the RHI cohort.
MRI volumetric analysis of subcortical structures
To investigate whether the volume of subcortical structures changes following a rugby season’s worth of RHI exposure, we analyzed subcortical structures in the so-called “cone of vulnerability” 42 (Fig. 1), namely caudate, putamen, thalamus, midbrain, hippocampus, and amygdala as well as CC. No significant difference in the volume of these structures was observed across timepoints within the RHI cohort, nor between the RHI cohort and the control group (Table 2).
Results of Between-Groups Multivariate Analysis (MANOVA) from the Normalized Volume of Subcortical Structures
Age was considered as a covariate.
MANOVA, multivariate analysis of variance; mTBI, mild traumatic brain injury; RHI, repetitive head impacts.
Similarly, no significant differences were found in the mean normalized volumes of subcortical structures within the mTBI cohort across post-injury timepoints. Multivariate analysis showed no significant difference in the mean volume for any subcortical structures, between the mTBI cohort at any timepoint (Timepoint A: within 1 week; Timepoint B: 3 weeks post-injury; Timepoint C: 8 weeks post-injury) after the injury and the RHI cohort early-season (Table 2).
Diffusion MRI analysis—TBSS findings
Subjects in our study were grouped into different categories: (1) RHI cohort at three different timepoints (early-, mid-, and post-season); (2) mTBI cohort at different timepoints (A, B, and C); (3) control group. TBSS cross-subject analysis was then applied between these groups (equal number of subjects per group, age and ethnicity matched) (Table 3). We ensured an equal number of participants in each comparison group as long as it did not compromise the sample size. For the RHI cohort, individuals were incorporated who took part in scans for both comparison timepoints. In the RHI versus control comparison, players were chosen who were present at all three timepoints, and these players were age-matched with the control group. In mTBI versus early-season, we selected those early-season players who were the best match with the mTBI subjects.
Types of Group Comparisons Selected for Tract-Based Spatial Statistics Analysis and the Corresponding Number of Participants for Each Test
mTBI, mild traumatic brain injury; RHI, repetitive head impacts.
Among all TBSS groups analysis, significant differences were found only between early-season scans of RHI cohort versus the control group, mid-season scans of RHI cohort versus the control group, and post-season scans of the RHI cohort versus the control group.
Significant differences were detected in the early-season scan when comparing the RHI cohort with the controls (p < 0.05), with family-wise error correction applied and the threshold-free cluster enhancement option enabled. These differences were evident in the AD measures, where the clusters indicated lower AD values in the RHI cohort compared with the control group, even before the start of the competitive season (Fig. 4A). The JHU ICBM-DTI-81 WM and JHU-WM tractography atlases were used to identify the names of the anatomical regions and white matter tracts. 25 Figure 4D represents the percentage of voxels related to each tract that showed significant differences between groups. The most dominant tracts that showed significant differences at early-season were the CC (major forceps), right IFOF and ILF, and bilateral ATR and CST (Fig. 4D).
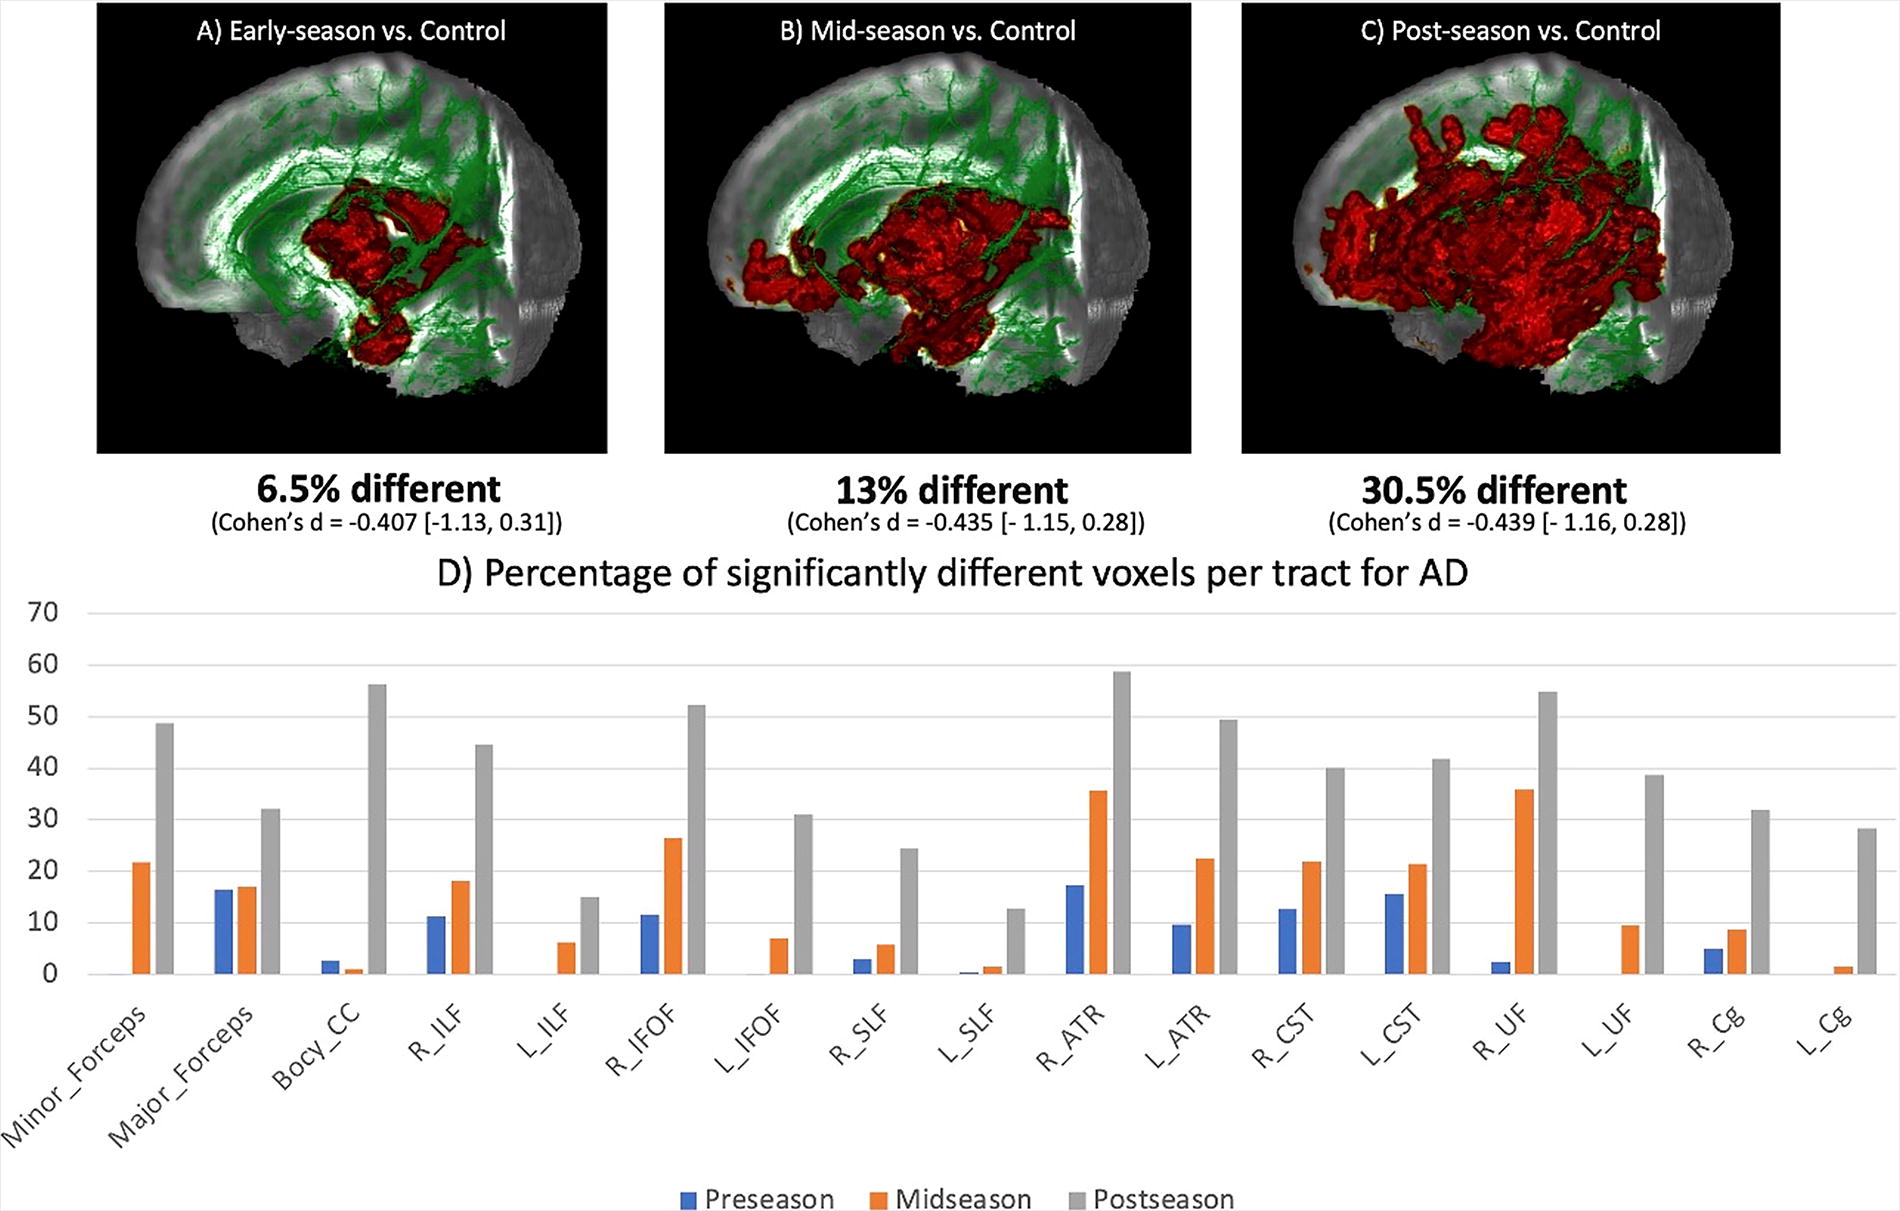
Results of TBSS analysis comparing AD value changes from pre- to post-season. The red color represents cluster that shows significant differences between groups corrected for family-wise error at p < 0.05. Results are overlaid on the MNI152-T1-1mm standard image and the entire brain WM skeleton (green).
The data showed a trend of greater differences between the RHI cohort and controls at mid-season and post-season compared with early-season. TBSS results showed lower values of AD (Fig. 5) (Fig. 6) and MD (Fig. 6) (Fig. 7) in the mid-season and post-season scans of the RHI cohort compared with age and ethnicity matched controls. Figures 4 and 5 represent the significant clusters for AD and MD separately. Notably, voxels with significant differences in AD and MD cover 30.5% (Cohen’s d = −0.439 [−1.164, 0.284]) (Fig. 4D) and 28.6% (Cohen’s d = −0.623 [−1.351, 0.103]) (Fig. 5C) of the entire white matter skeleton, respectively. This represents an approximate two-fold increase in coverage compared with what was observed in the RHI cohort at mid-season. Specifically, the CC (minor forceps, major forceps, and body of CC), right ILF and IFOF, and bilateral ATR, CST, and UF constitute the majority of the significant areas of MD at post-season (Fig. 5D).
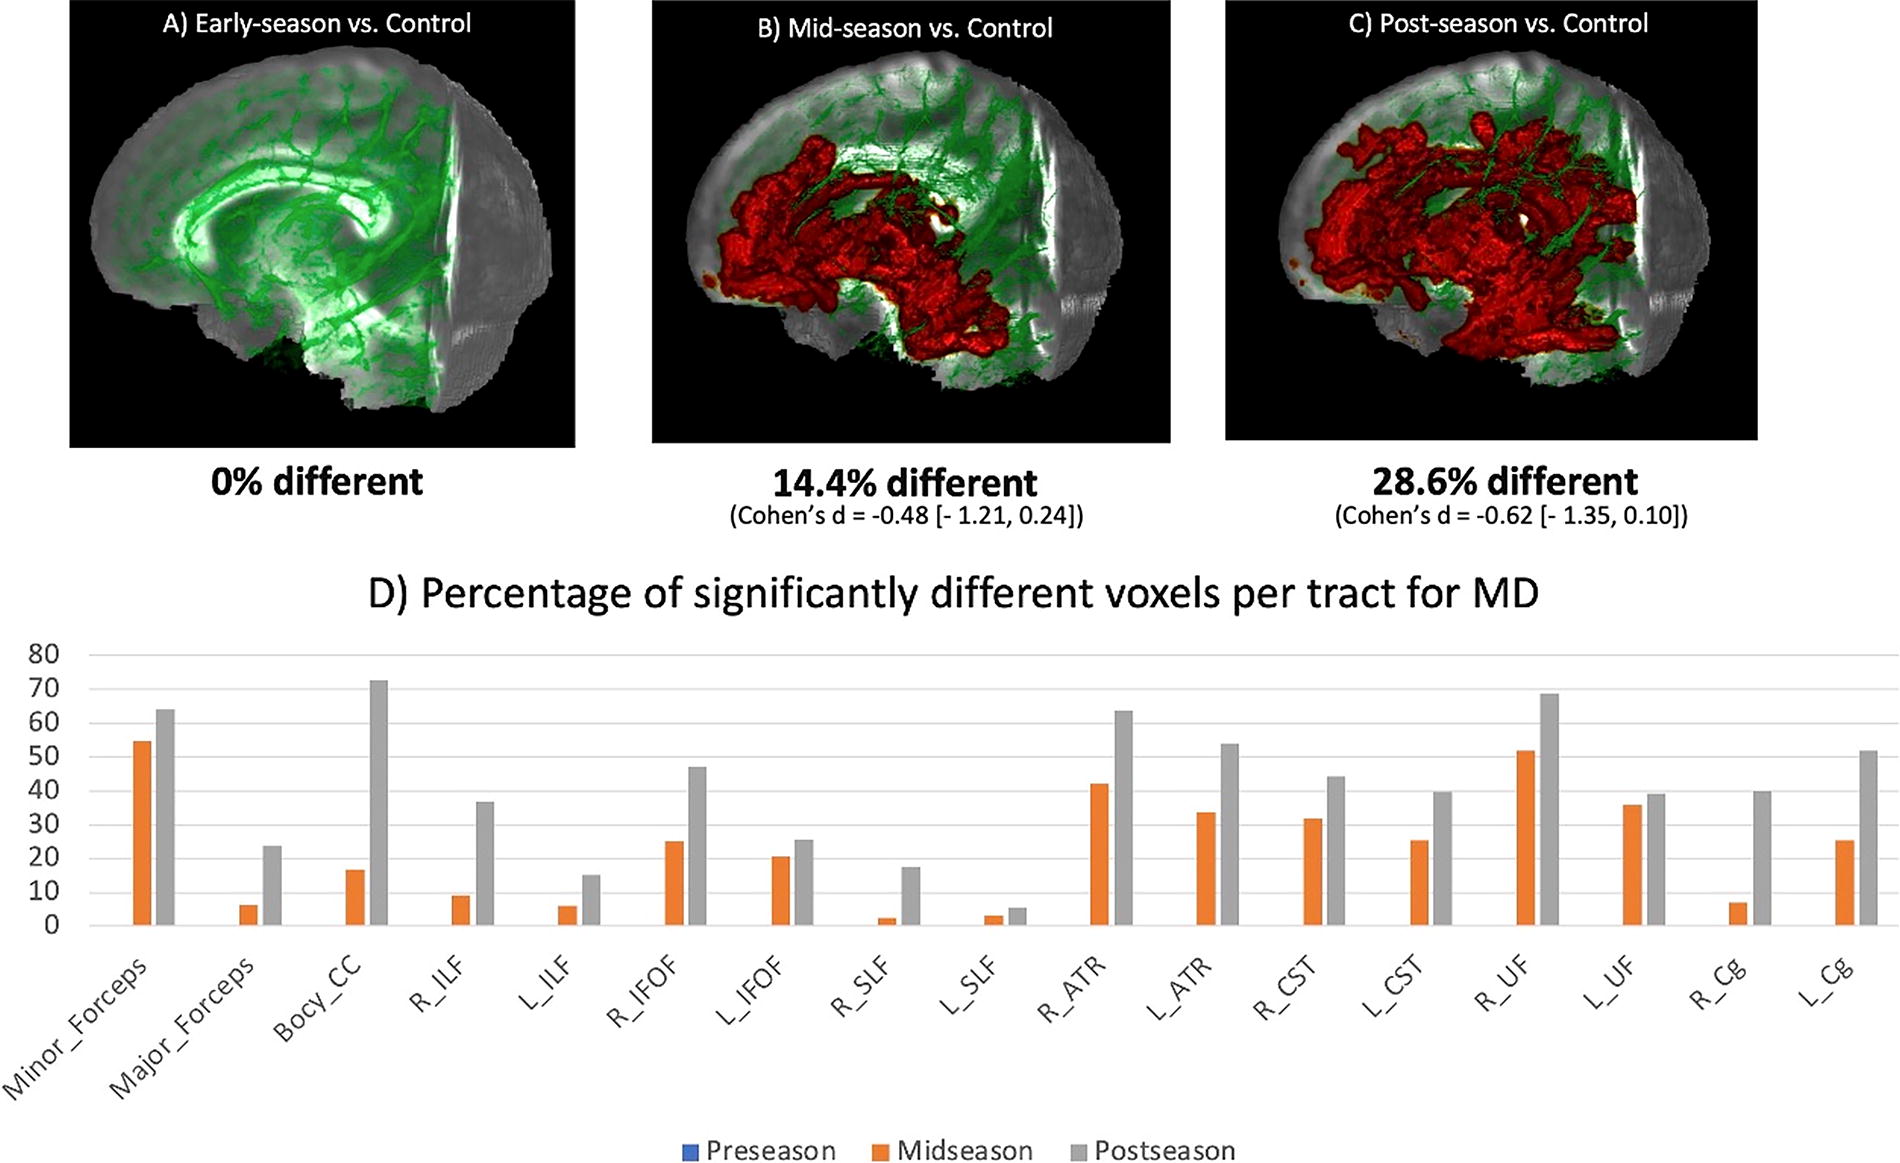
Results of TBSS analysis comparing MD value changes from pre- to post-season. The red color represents cluster that shows significant differences between groups corrected for family-wise error at p < 0.05. Results are overlaid on the MNI152-T1-1mm standard image and the entire brain WM skeleton (green). MD, mean diffusivity.
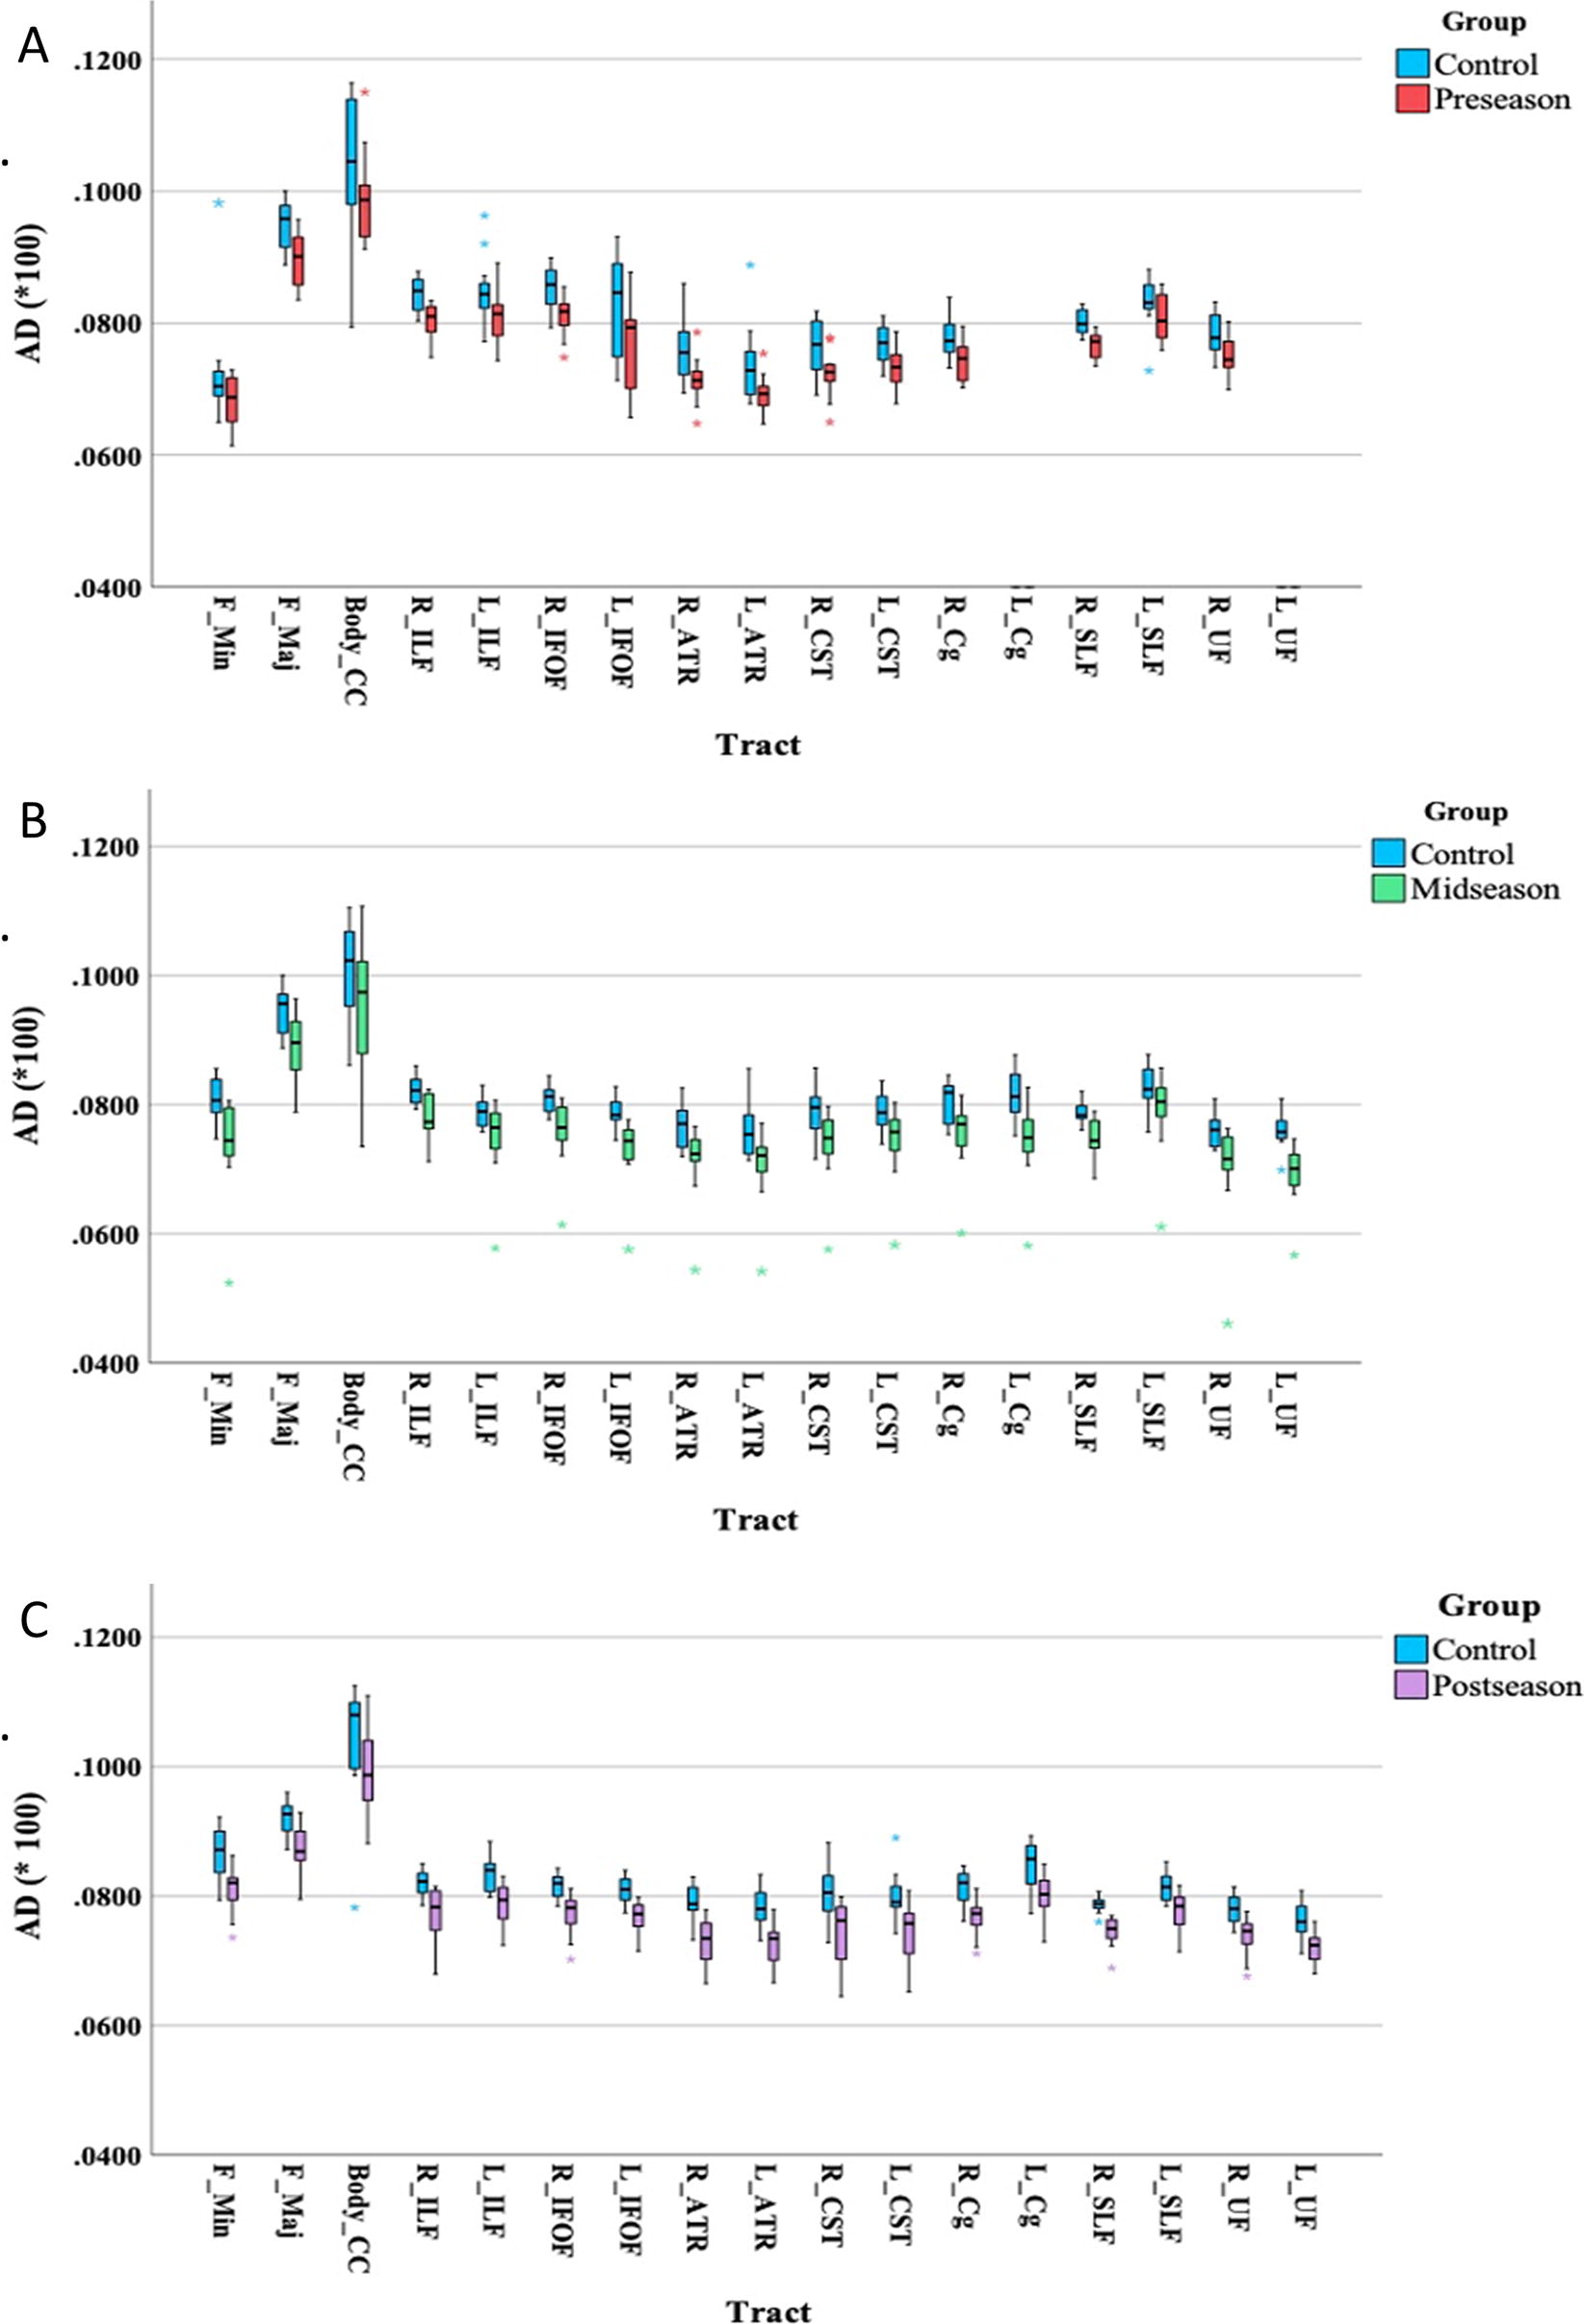
AD values of fiber tracts segmented using JHU-WM tractography atlas for the RHI and control cohorts that showed significant differences after TBSS analysis. AD, axial diffusivity; JHU, John Hopkins University; TBSS, tract-based spatial statistics.
The average involvement of tracts in the RHI cohort was initially observed to be only around 6.5% of the entire brain’s white matter tracts during the early-season, which significantly increased to approximately (what is the exact number?) 30% in the post-season. This upward trend was consistent across all tracts (Figs. 4 and 5). Notably, the CC, ATR, and UF were the primary tracts that exhibited the highest coverage of significant clusters and experienced the most substantial growth from pre- to post-season group comparisons.
Correlation results
To explore the correlation between diffusion metrics, symptomology, and kinematic variables, a within-group analysis was conducted on the players within the RHI cohort who completed both pre- and post-season assessments. Using automated tractography (TractSeg), 15 individual tracts were extracted from the brain scans of each player. We then correlated the differences in diffusion metrics between the early-season to post-season scans with the difference in SCAT5 symptom total, symptom severity, and cumulative peak angular/linear accelerations for each player.
The strongest correlations were found between AD, MD, and RD of various tracts and the number of symptoms and severity of symptoms from the SCAT5 symptom evaluation (Table 4). The AD of CC (r = 0.608), bilateral CST (right: r = 0.748, left: r = 0.68), ATR (right: r = 0.705, left: r = 0.755), IFOF (right: r = 0.668, left: r = 0.833), ILF (right: r = 0.566, left: r = 0.646, UF (right: r = 0.522, left: r = 0.681), CG (right: r = 0.702, left: r = 0.75), and left SLF (r = 0.588) was positively correlated with the symptom severity score from the SCAT5. For some tracts, including CC (r = 0.626), bilateral ATR (right: r = 0.672, left: r = 0.803), CG (right: r = 0.7, left: r = 0.665), IFOF (right: r = 0.694, left: r = 0.817), UF (right: r = 0.514, left: r = 0.695), and left ILF (r = 0.582), MD was also moderately correlated with the number of symptoms on SCAT5. The number of tracts that showed a significant correlation with RD was lower than AD and MD (Table 4). Apart from the correlation between the right ILF and SCAT5 severity score (r = 0.563, p = 0.029), the FA of the remaining fiber tracts showed no correlation with SCAT5 variables.
Correlation Between the Subtraction of Average Diffusion Metrics Before and After the Season (ΔFA, ΔMD, ΔAD, ΔRD) of 19 Tracts and SCAT5 Measures in the RHI Cohort
Only relationships >r = 0.5 are reported.
AD, axial diffusivity; FA, fractional anisotropy; MD, mean diffusivity; RD, radial diffusivity; RHI, repetitive head impacts; SCAT5, Sport Concussion Assessment Tool.
The correlations between diffusion metrics and cumulative kinematic data were weaker than the clinical scores. The only significant negative correlation was found between FA of the left UF and cumulative peak angular (r = −0.501) and linear (r = −0.508) acceleration.
Discussion
Volumetric assessment of subcortical structures
Given the angular acceleration/deceleration of impacts experienced during TBI, Ropper and Gorson showed that the structures of the brain located within a “cone of vulnerability” are more affected by the shear-strain injury. 42 These structures include the thalamus, basal ganglia, hippocampus, and amygdala. Additionally, the deep central WM tracts, such as the CC, have shown increased susceptibility to the stretch-tensile biomechanical strain deformation. 43 In our study, these specific regions, identified as candidate regions of interest, were examined volumetrically in the brains of both collision sport and non-collision sport athletes.
Among high school rugby players who experienced a diagnosed mTBI, no significant difference was found in the volume of any structure located in the cone of vulnerability at different timepoints after the injury (acute to subacute). In line with our findings, a study from Bobholz et al. (2020) also found no volumetric changes in subcortical areas (thalamus, hippocampus, striatum, amygdala) both 24–48 h and 6 months post-injury. 44 To the best of our knowledge, this is the only longitudinal study that has investigated the volumetric changes in the brain structures of athletes at acute and subacute levels. Most studies focused on comparing the brains of contact-sport players with non-athletes or non-contact sports athletes. Hence, a comprehensive longitudinal assessment of the volumetric brain changes is needed with a larger sample size within a single group of players before and after mTBI.
When comparing the volumes of the structures in the cone of vulnerability in RHI rugby players with the non-contact sports players, no significant differences were observed between the two groups. However, upon closer examination of the average values, a slightly higher volume was noted in the CC, caudate, and hippocampus in the control group. Experiencing RHI has been shown to play a role in altering the volume and shape of some of the subcortical structures. In a study by Parivash et al., no significant difference in the total volume of the hippocampus was found in collegiate football players compared with volleyball players. 45 However, longitudinal changes were evident by segmenting the hippocampus into subfields. Following a mTBI, the hippocampus might not fully recover, referred to as “incomplete hippocampal rebound,” 46 leading to changes in its shape, even if its volume remains unchanged. For instance, due to a contra-coup effect, the hippocampus might become compressed, making it appear shorter but broader in dimension. Thus, shape variations could be more critical than volume changes. 47 Moreover, a larger size doesn’t necessarily equate to better functionality. 48
Diffusion analysis
For the mTBI cohort, no significant difference was detected in any diffusion indices from the acute (within 1 week post-injury) to subacute stage (3 and 8 weeks post-injury). Comparing the pre-season scans with multiple scans taken at acute and subacute timepoints following the injury revealed no significant differences between the groups. Since only two of the participants in the mTBI cohort had baseline scans, we selected baseline scans from uninjured players who were matched in age and ethnicity with the injured participants.
Consistent with our results, several longitudinal studies also showed no significant changes in FA, 49,50 AD, 51 and RD 49,51 in the brain of athletes exposed to mTBI from the baseline scan to acute (48–72 h), subacute (1–12 weeks), and chronic (6 months) timepoints. However, different results have also been reported by Murugavel et al. (2014) in a longitudinal study (2 days, 2 weeks, and 2 months) on 16 participants exposed to mTBI from various contact sports, 52 where they showed significant temporal alterations in FA and RD values. Such changes have also been observed in animal models within 6 h following the head impact. 53 Decreases in FA at the subacute stage have also been reported by other groups. 54,55 Heterogeneity in the analysis methods is likely one of the main reasons for diverse findings from the studies in this field.
The RHI cohort was examined separately at early-, mid-, and post-season. Pairwise group comparison between timepoints showed no significant difference. This result is consistent with other longitudinal studies that found no change in FA 56 or any other diffusion indices 57 in contact-sport players.
While discrepancies have been found in the studies with the RHI cohort—ranging from elevated FA, 58,59 reduced MD, 58,60 and no significant difference between AD and RD 57,61 —our result showed a significant difference in the diffusion properties of the WM tissue. Compared with the control group, decreased AD was evident in widespread areas in the brain of rugby players even at the pre-season scan. The significant changes were seen mainly in the center of the brain, where long projection and association fiber bundles are located, including the CC, IFOF, and ATR. When the post-season scans were compared with the same control group, the areas of significant changes were observed for both MD and AD with a larger extent of significant voxels.
In line with our results, McAllister et al. (2014) also reported lower MD in the CC of contact-sport athletes versus non-contact controls in both pre- and post-season scans. 61 In the other longitudinal study based on the TBSS technique, Gajawelli et al. (2013) demonstrated significantly different FA and MD values in the brain of contact athletes compared with non-contact players, mainly in the CC, external capsule, and IFOF. 62 Consistent with our results, they reported more significant voxels in the CC at post-season scans. A decrease in the MD and an increase in FA have also been reported in prior studies on athletes who historically sustained sports-related mTBI without significant cognitive and clinical symptoms. 63 –65
Given the findings mentioned above, the direction of changes in MD is more consistent than other diffusion indices. Compared with acute and subacute mTBI, long-term effects of mTBI have been reported to have different effects on the microstructure of the brain, where MD has been shown as a more sensitive parameter to injury than FA. 66 Alteration in MD has been shown as an indicator of axonal or myelin degeneration. 67 RD is sensitive to demyelination; an increase in this value could represent myelin loss. However, a decrease in AD might reflect axonal injury or less coherent orientation of axons. 68 Hence, diffusivity values can be used to help interpretation of underlying pathology in WM microstructural changes.
WM tract-wise correlation with clinical symptoms
When comparing the difference between early- and post-season assessment scores of SCAT5 with the changes in the diffusion properties of the brain white matter tissue, we found a moderate-high positive correlation between the number and severity of symptoms and diffusivity values (MD, AD, and RD) of most of the WM tracts. Apart from one tract (right ILF), no correlation has been observed between clinical symptoms and FA values in the current study. This indicates that higher scores in the number/severity of symptoms after the season were positively associated with higher AD and MD values at post-season scans. A higher correlation was seen between AD/MD and the SCAT5 severity of symptoms. Among studies conducted on athletes exposed to mTBI, a positive correlation has been reported between SCAT2 scores and AD, such that athletes with higher AD suffered more severe symptoms. 69,70 An increase in AD might reflect microstructural changes within the axons, which might affect the overall symptom burden. At a group level, we did not observe any significant changes for diffusion indices or symptom burden in the RHI cohort after the season. The relationship we observed in the RHI cohort indicates individual differences contribute to subtle changes in white matter and how these changes correspond to mTBI-related symptomology, even in the absence of a clinically diagnosed mTBI. To better understand these changes in diffusion indices, we explored how these changes relate to individual differences in RHI exposure.
Correlation between kinematic data and diffusion metrics
In the current study, the cumulative linear and angular acceleration over the season was used to find the correlation between the kinematic data and changes in the DTI-derived indices in the RHI cohort. Using a similar approach as Broglio et al., 71 we did not observe a systematic correlation between cumulative RHI exposure—both in linear and angular accelerations—and changes in diffusion values over the course of the season in the RHI cohort. Interestingly, similar to our results, Bahrami et al. showed a relationship between the decrease in FA with respect to an increasing head impacts in a different tract (left IFOF). 72 Susceptibility of this tract has also been reported in several previous studies in mTBI. 62,73,74 Therefore, considering both variables and their combination for future research could provide better insight into the major contributor of RHI exposure to the brain’s subtle microstructural alterations.
Limitations
Our current research has several limitations. First, our sample size was relatively small and did not include female athletes. Second, cross-sectional comparisons between the RHI cohort at early-, mid-, and post-season versus control demonstrated increased changes in white matter at later stages of the season. Given all participants were adolescents, some of the longitudinal changes in the RHI cohort may be due to normal brain maturation. To better understand the potential effects of aging on our findings, our future work will scan controls at two timepoints spaced at similar intervals to the duration of a school rugby season. Another limitation was the use of simple metrics when analyzing kinematic data, such as the summation of all linear and angular accelerations. Nevertheless, in our ongoing work, we are enhancing our approach by implementing more comprehensive metrics, including risk-weighted cumulative exposure for kinematic datasets. Lastly, in this study, we focused solely on the entire hippocampal volumes. Examining only the whole volume of the hippocampus overlooks the nuanced changes within its distinct subfields, potentially missing localized vulnerabilities, and functional impairments. Future research must delve into subfield investigations.
Conclusion
In conclusion, we did not find systematic within-group structural changes in the brains of high school collision sport athletes after one rugby season. Specifically, we did not observe consistent within-group changes in the brains in response to RHI exposure over the course of the season, nor following clinically diagnosed mTBI. However, when compared with age-matched non-collision sports athletes, we observed structural differences between the two groups. Moreover, the number of white matter voxels that showed significant differences between RHI and non-collision sport controls increased over the course of the season and was highest at post-season. This increase suggests that sustaining repetitive impacts during a season might have altered the brain’s white matter structures. Greater amounts of early- to post-season change in diffusion indices were correlated with greater SCAT5 symptom burden, highlighting individual responses to RHI exposure. This study adds to the growing body of evidence that RHI exposure over a single season of a collision sport (in this case rugby) may contribute to microstructural white matter changes and development of mTBI-related symptomology—even in the absence of clinically diagnosed mTBI. Further longitudinal studies are required to better understand the mechanism of brain injury and the recovery process to decrease the risks of returning to play following mTBI/RHI exposure.
Footnotes
Acknowledgments
The authors acknowledge the participants, their whānau (family), Gisborne Boys High School, Poverty Bay Rugby Football Union, Ngā Mangai Māori, Turanga Health, and the wider Gisborne-Tairāwhiti community for their support and partnership toward this ongoing initiative. The authors thank the team at GE Healthcare for their technical support.
Authors’ Contributions
M.T.: Conduct the research, image analysis, data analysis, write the article. E.K.: Conduct the research, data collection, data analysis, revise the article. J. McGeown: Conduct the research, data collection, data analysis, revise the article. L.P.: Conduct the research, data collection, revise the article. D.T.: Conduct the research, data collection. P.C.: Conduct the research, acquire MR scan. M.Q.: Secures funding, revise the article. P.M.: Conduct the research, data collection. J. Maller: Image analysis, revise the article. A.W.: Revise the article. J.F.: Revise the article. M.S.: Revise the article. V.S.: Research idea, study design, secure funding, revise the article. S.H.: Research idea, study design, secure funding, revise the article.
Rugby Transparency,Rigor,and Reproducibility Summary
All these procedures were conducted in accordance with the ethics approval from the New Zealand Health and Disability Ethics Committees (HDEC approval number 20/NTB/14). All participants involved provided written informed consent prior to study participation.
Thirty male rugby players (rugby cohort) within 16–18 years of age participated in this study (mean age = 16.2, SD = 0.97). To be included in the study, participants were required to be at least 16 years of age, speak English, and have no contraindications to MRI. Excluded players included those with a history of concussion within the last 6 months prior to the study; a severe brain injury history in life; or other neurological deficits or pathology. Twelve age-matched (age range 14–18, mean age = 16.5, SD = 1.8), non-contact sports, and male athletes (control cohort) were also recruited for the control group. The same inclusion/exclusion criteria were applied for the control cohort.
Both the rugby and the control cohort underwent MRI brain scans. The rugby cohort was imaged at two timepoints: before starting the rugby season and after the season. The control cohort was recruited for a single timepoint. The MRI scans consisted of both standard and advanced research sequences, including T1-W and multi-shell spin-echo diffusion-weighted MRI sequences. More detailed parameters of the MRI scans are available within the article.
The primary outcome of the study was to measure changes in MR imaging over a season of contact sports, and all other outcomes were secondary. As there was no prior study investigating imaging outcomes of rugby players 16–18 years of age over a season of rugby, no power calculation was performed, and this study was conducted as a pilot.
Author Disclosure Statement
The authors have no competing interests to disclose.
Funding Information
The authors would like to thank their funders for their support including Kānoa New Zealand, NZ-Singapore Data Science Research Programme UOAX2001, the Catalyst: Strategic Fund from Government Funding, administrated by MBIE, the Hugh Green Foundation, Mangatawa Beale Williams Memorial Trust, the JN & HB Williams Foundation, an anonymous donor, Trust Tairāwhiti, Neurological Foundation, and the New Zealand Health Research Council Explorer (22-625-A), Te Titoki Mataora Research Acceleration Programme Fund.