




Abstract
Our objective was to test the hypothesis that structure-based identified or designed compounds exhibiting neuroprotective, antioxidant, and anti-inflammatory properties in vitro will mitigate early seizures and neuropathology after traumatic brain injury (TBI) in vivo. The neuroprotective and anti-inflammatory effects of 11 compounds identified by computer-assisted approximations were tested in vitro in neuronal microglial co-cultures. Among these, compound FBA exhibited the best neuroprotective (MAP-2, microtubule-associated-protein 2, a neuronal damage biomarker), antioxidative (nitrite production), and anti-inflammatory effects in vitro (all p < 0.01). Consequently, its neuroprotective and antiseizure effects were assessed in vivo in adult male Sprague-Dawley rats exposed to severe lateral fluid-percussion-induced TBI. Rats under continuous video-electroencephalogram monitoring received prophylactic treatment with an intraperitoneal (i.p.) injection of FBA (FBApro, 30 mg/kg) or vehicle (VEH, 48% PEG in 0.9% saline, 3 mL/kg) at 2 and 24 h post-TBI. Rats that developed status epilepticus received 1–2 additional on-demand FBA doses (FBApro+, 100 mg/kg, i.p.) to stop epileptiform activity. FBApro treatment reduced the cortical lesion area (18.9 ± 4.1 mm2, n = 7) compared with VEH treatment (24.8 ± 5.7 mm2, n = 10, p < 0.05). FBApro treatment also showed a favorable effect on the white matter by reducing plasma levels of pNF-H, a biomarker of axonal injury, compared with VEH treatment (Cohen’s delta 0.657). Both FBApro (368 ± 407 s) and FBApro+ (256 ± 327 s) treatments reduced the average cumulative seizure duration compared with VEH (896 ± 703 s, both p < 0.05). The FBApro+ treatment regimen also reduced the mean relative theta and alpha power and increased the mean relative gamma power in the electroencephalogram (p < 0.05). Our data identified FBA as a novel structure-based discovered compound with promising favorable effects on structural and functional recovery after TBI.
Introduction
Annually, ∼69 million individuals suffer from traumatic brain injury (TBI) worldwide, and TBI is a prominent cause of injury-related death globally. 1,2 As the primary injury cannot be reversed, therapeutic interventions target the secondary brain damage that occurs within minutes after the primary impact, including neurotoxicity, oxidative stress-related alterations, and neuroinflammation, which progress in a parallel and/or sequential manner. 3 –5 Importantly, the secondary damage occurs over hours to days to weeks postinjury, providing a window of opportunity for therapeutic interventions to prevent the development of functional impairments such as acute seizures or post-traumatic epilepsy (PTE). 6 –8
Up to 30% of adults with severe TBI develop acute seizures. 9 –13 Our recent pre-clinical study showed that 70–80% of rats with severe TBI induced by lateral fluid-percussion (LFP) injury, a model of human closed head injury, developed seizures and status epilepticus (SE) during the first-week postinjury. 14 Although the long-term consequences of post-TBI acute seizures and SE are incompletely understood, previous epidemiological and observational studies suggest that acute post-TBI seizures are associated with a greater probability of mortality and development of PTE. 8,12,15,16
Despite a large number of hypothesis-driven drug-discovery studies, the treatment of TBI remains a major unmet medical need. 17 –19 Computer-aided drug discovery, including virtual screening and structure-based drug design, involves the use of information technologies to identify and/or modify, on a rational basis, active scaffolds with the desired bioactivity profiles. 20 Computer-aided drug discovery has been successfully applied to identify treatments for hypertension Parkinson’s disease, neuropathic pain, and HIV (Human immunodeficiency virus), 21 –23 among other conditions. Currently, more than 20 artificial intelligence-derived drug candidates are undergoing clinical trials related to a diversity of disorders, such as cancer, Alzheimer’s disease, and diabetes. 24
Here, we screened a series of computationally identified repurposed drugs and drug candidates to investigate their potential to mitigate TBI-induced brain damage, acute seizures, and epileptiform activity. We hypothesized that compounds with an ability to reduce neuronal death, oxidative stress, and neuroinflammation in vitro could alleviate acute post-TBI pathology and promote post-TBI structural and functional recovery in vivo. The compounds identified using computational approaches were acquired or synthesized and tested in vitro in neuronal microglial co-cultures. The most promising compound, FBA, was then investigated in vivo in the LFP injury model to assess whether it would suppress the occurrence of acute postimpact electrographic seizures, reduce the extent of cortical lesion area, and lower the plasma levels of axonal injury marker, pNF-H. Our proof-of-concept data demonstrate that structure-based compound discovery is a promising approach to discovering novel treatments for TBI.
Materials and Methods
The study designs are summarized in Figures 1 (in vitro) and 2 (in vivo). Table 1 summarizes the compounds investigated in this study and their presumed mechanisms of action and antiseizure effects. Figure 3 displays the randomization of rats into different treatment groups, reasons for exclusions, and study flow. Figure 4 shows the electrode montage used. Detailed descriptions of the research methods used to perform the in vitro and in vivo experiments, including ethics and statistics are provided in Supplementary Data.

In vitro study design. On day 0, E18 mouse brains were dissected, and cortical neuronal cells were plated. On day 5, BV2 microglial cells were added on top of the neurons. After 1 h, the co-cultures were pretreated with the test compounds for 60 min. Then, LPS and IFNγ were added to the cell culture medium to induce neuroinflammation. On day 7 (i.e., after a 48-h exposure to neuroinflammation), the cell culture medium was collected for analysis of secreted TNFα and nitrite levels in the medium. Co-culture cells were fixed for analysis of neuronal viability using a MAP-2 immunoassay. IFNγ, interferon gamma; LPS, lipopolysaccharides; MAP-2, microtubule-associated-protein 2; TNFα, tumor necrosis factor alpha.
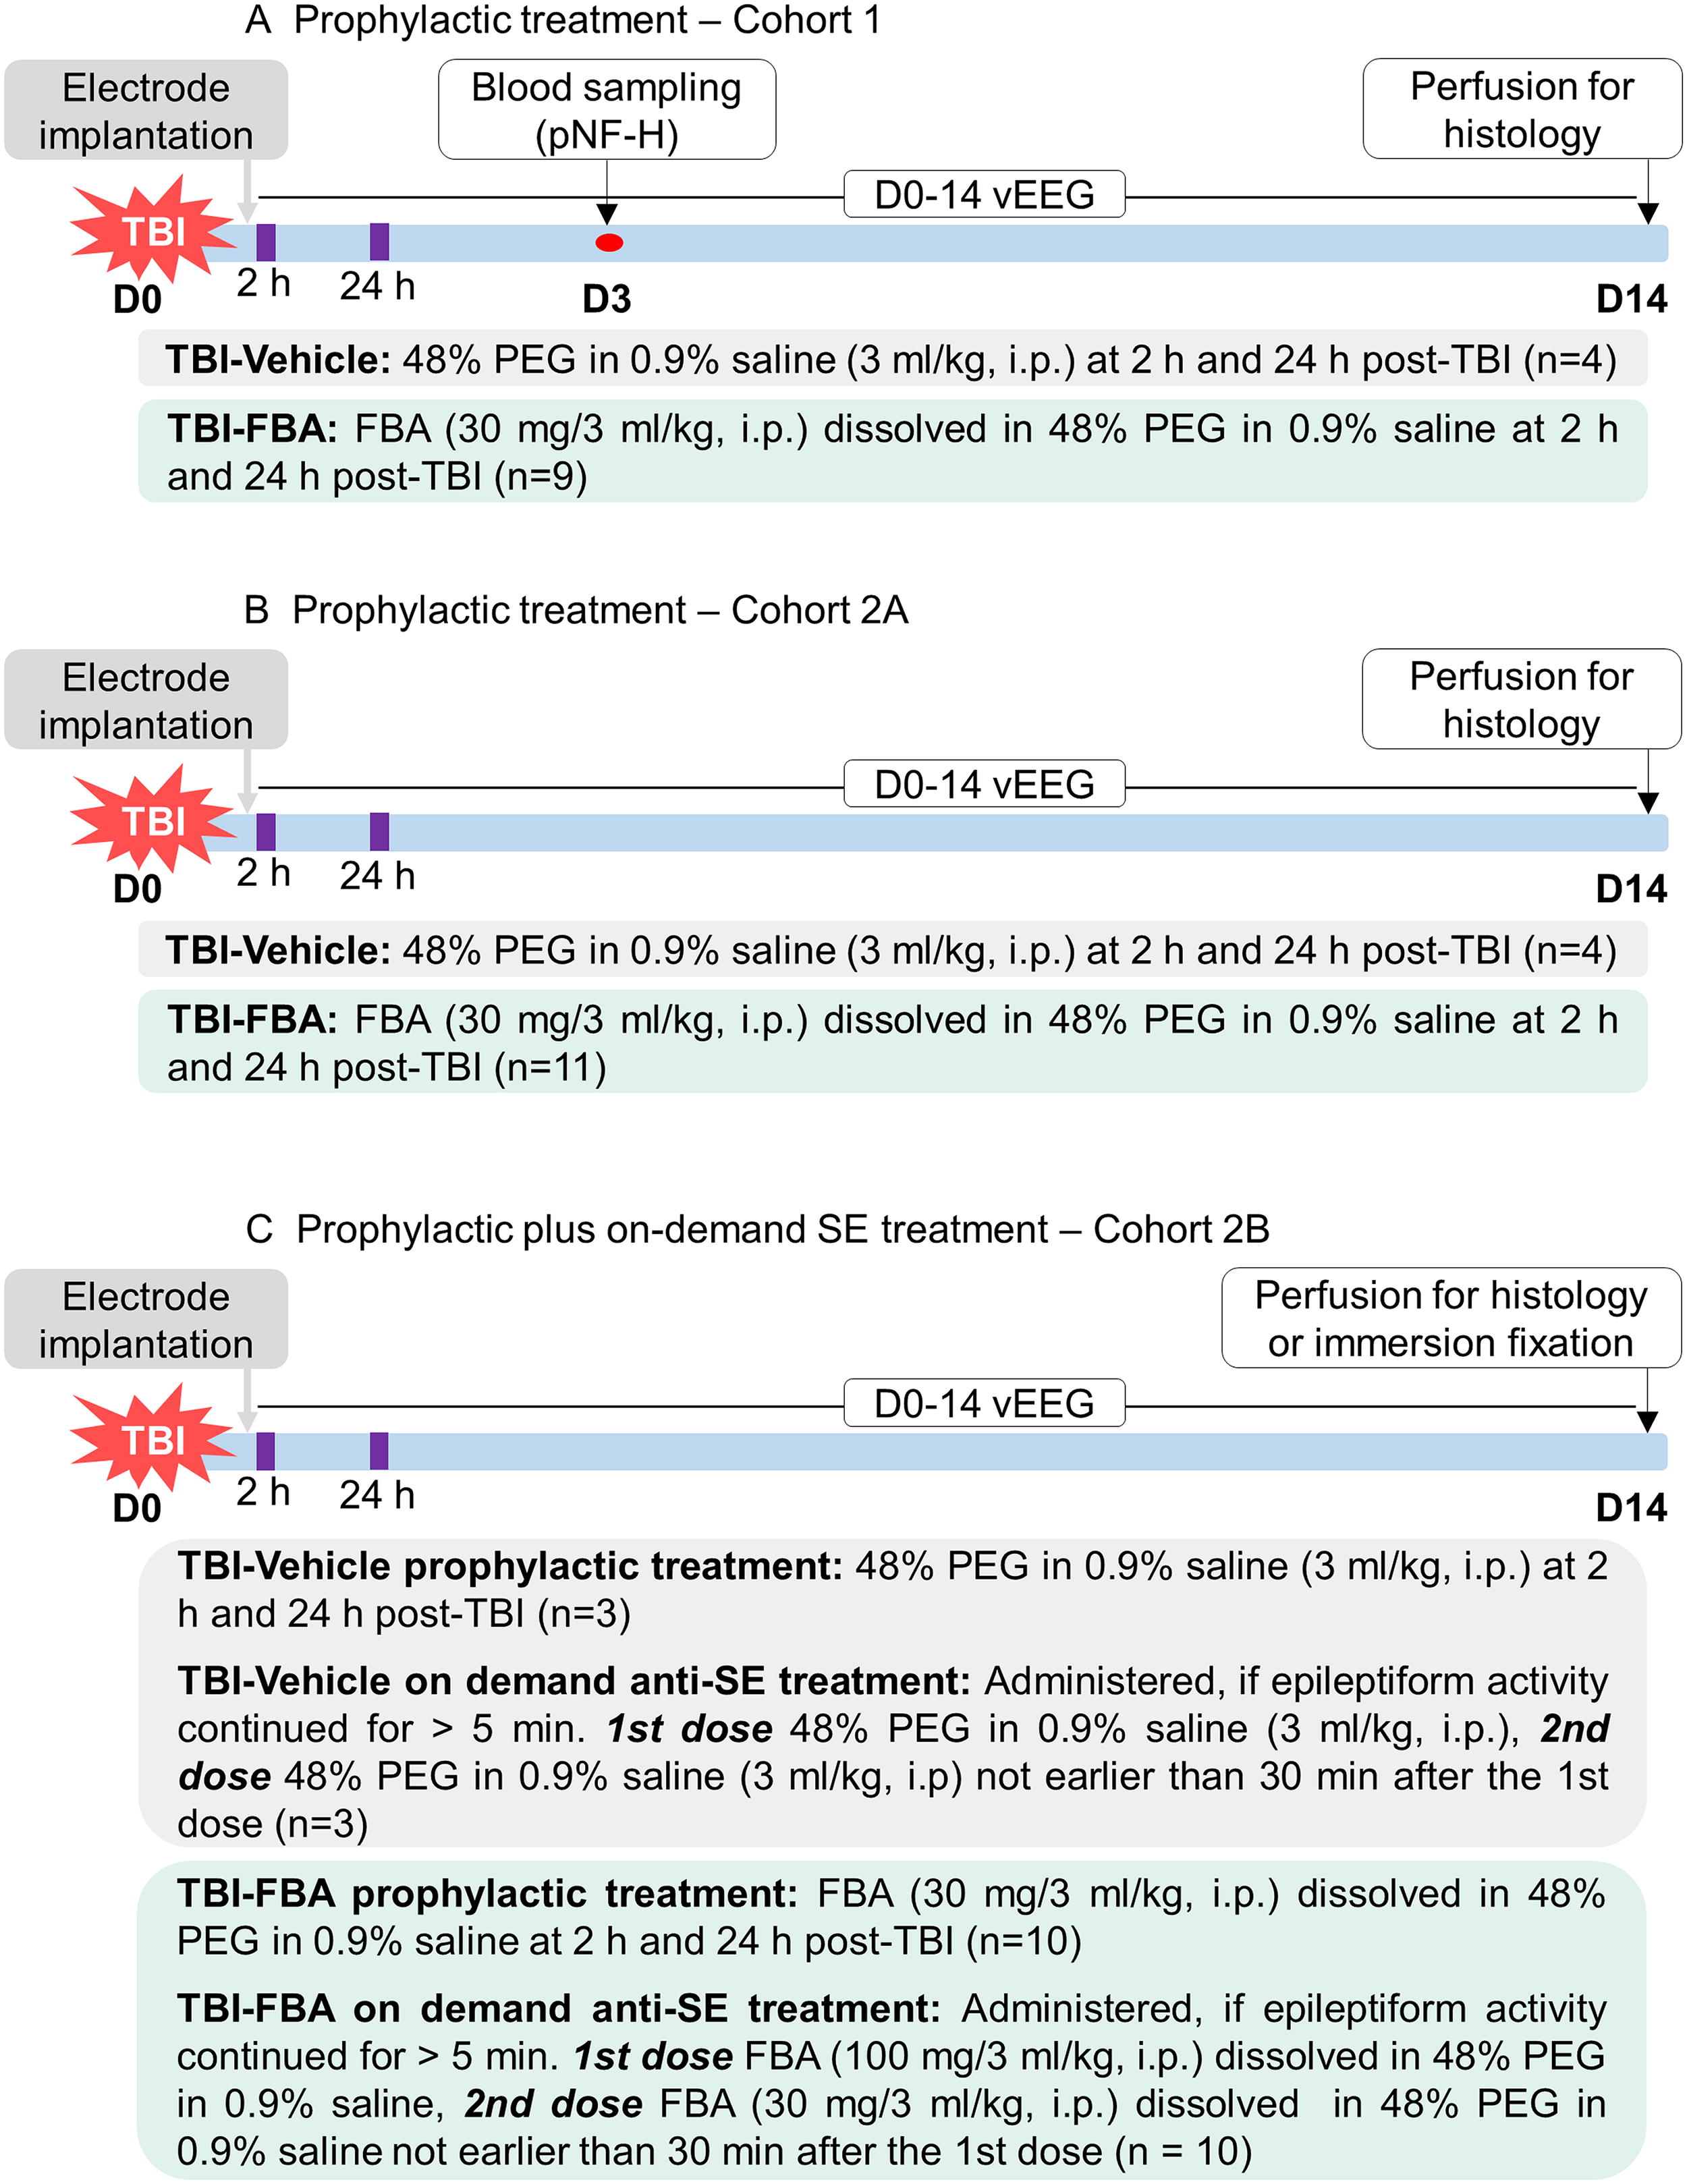
In vivo study design. The neuroprotective and antiseizure effects of FBA were investigated in a rat TBI model induced by LFP injury. EEG-recording electrodes were implanted during the same surgery. Recording of vEEG was started immediately and continued for 14 days.
Compounds Investigated in the Present Study, Their Abbreviations, Presumed Mechanisms of Action, Antiseizure Efficacy, and Adverse Events
+, reduced seizure activity. Data were obtained from references cited in the rightmost column.
GABA, gamma-aminobutyric acid; mGluR, metabotropic glutamate receptor; Nav1.2, sodium channel 1.2 isoform; PTZ, pentylenetetrazol; SE, status epilepticus; TRPV1, transient receptor potential vanilloid.
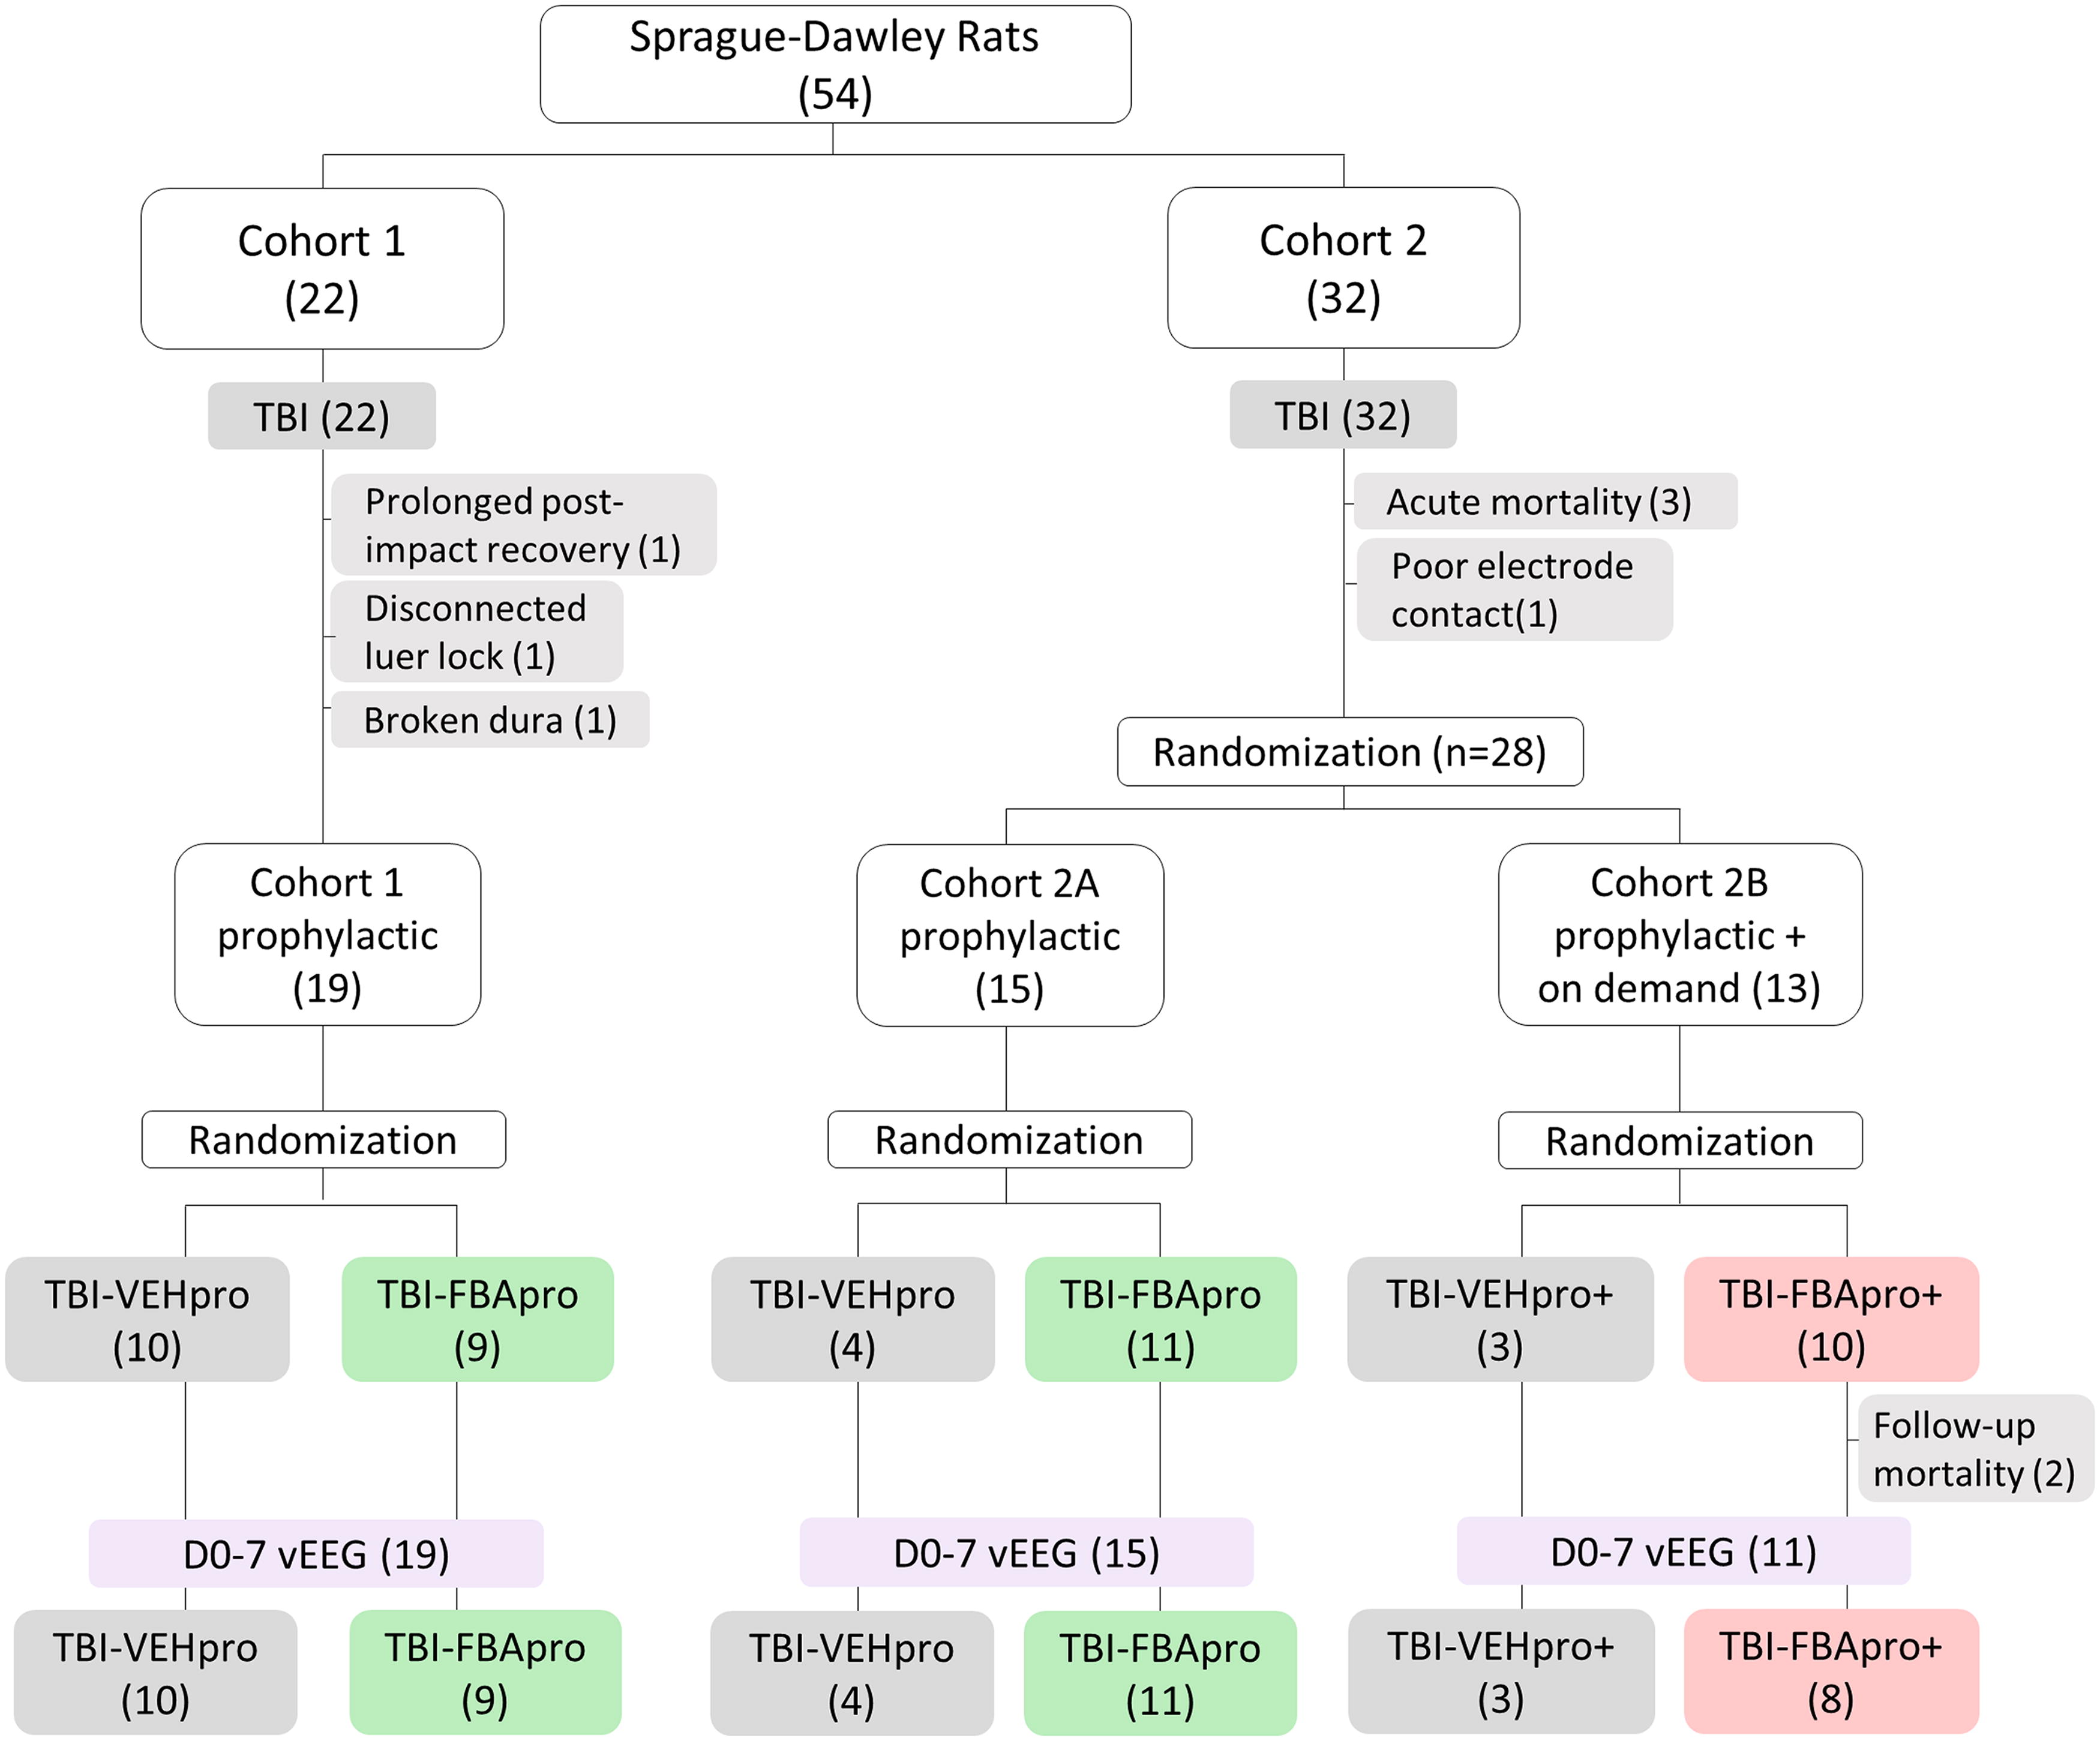
Randomization and study flow. A total of 54 rats experienced lateral fluid-percussion-induced traumatic brain injury (TBI). Of the 54 rats, 22 were included in Cohort 1 (preliminary study). After acute exclusion of 3 rats, the remaining 19 animals were randomized to either prophylactic treatment with vehicle (TBI-VEHpro, n = 10) or FBA (TBI-FBApro, n = 9). All 19 rats completed the day (D) 0-D7 video-electroencephalogram (vEEG) monitoring. Of the 54 rats, 32 were included in Cohort 2. After acute exclusions of 4 animals, the remaining 28 rats were divided into Cohorts 2A and 2B. Animals in Cohort 2A (n = 15) were randomized (as in Cohort 1) to vehicle (TBI-VEHpro, n = 4) or FBA (TBI-FBApro, n = 11) treatments to increase the statistical power of data obtained in Cohort 1. All 15 rats in Cohort 2A completed the D0-D7 vEEG monitoring. Rats in Cohort 2B (n = 13) received the prophylactic treatment (as Cohorts 1 and 2A) supplemented with an on-demand administration of vehicle (TBI-VEHpro+, n = 3) or (TBI-FBApro+, n = 10) to stop status epilepticus (or ictal-interictal continuum) when diagnosed during the online vEEG. Rats were allocated to the TBI-VEHpro+ or TBI-FBApro+ group if the online EEG analysis indicated an ongoing status epilepticus (>5 min). After 2 exclusions, 11 rats in Cohort 2B completed the D0-D7 vEEG monitoring. Reasons for exclusions at each follow-up stage are shown in gray shading (number of animals is in parenthesis).

Electrode montage.
Results
In vitro validation of the effects of the compounds on neuronal viability, oxidative stress, and neuroinflammation
Neuronal viability
To determine the effects of the compounds on neuronal survival, a neuronal viability immunoassay was performed. The percentage of neuronal viability in neuronal-BV2 microglial co-cultures exposed to neuroinflammatory mediators LPS and interferon gamma (IFNγ) only (LPS/IFNγ+) was set to 0%. In co-cultures treated also with positive control (iNOS inhibitor 1400W), the percentage of neuronal viability was set to 100%. The neuroprotective effect of each test compound was compared with that in co-cultures treated with LPS/IFNγ+ only. Data are summarized in Figure 5A, Supplementary Figures S1A, B and S2.

Validation of the neuroprotective, antioxidant, and anti-inflammatory effects of compounds discovered through structure-based design.
Controls
Neuronal survival in wells with neuronal cells only (BV2−) was greater than in LPS/IFNγ+ co-cultures (198% vs. 0%, p < 0.001). Also, neuronal survival in co-cultures that were not exposed to neuroinflammation (LPS/IFNγ−) was greater than in LPS/IFNγ+ exposed co-cultures (52% vs. 0%, p < 0.001). The anti-inflammatory cytokine IL10 did not improve neuronal survival (9% vs. 0%, p > 0.05 compared with LPS/IFNγ+ cultures).
Test compounds
Of the 11 test compounds, 4 (DP1 > FBS > FBA > SA1) showed neuroprotective effects at one or more of the concentrations tested.
At the 100-µM concentration, DP1 increased neuronal survival from 0% to 90% (p < 0.001 compared with LPS/IFNγ+). Neuronal viability was comparable to that of the positive control 1400W (90% vs. 100%, p > 0.05). Neuronal survival was higher than in wells not treated with LPS/IFNγ (LPS/IFNγ−; 90% vs. 52%, p < 0.01). Analysis of microscope images of cultured cells, however, revealed the presence of some degenerating neurons among the surviving neurons (Supplementary Fig. S2G). Lower concentrations of DP1 also promoted neuronal survival (30 µM, 72%, p < 0.001; 10 µM, 51%, p < 0.001; 1 µM, 38%, p < 0.01 compared with LPS/IFNγ+).
At the 100-µM concentration, FBS increased neuronal survival from 0% to 79% (p < 0.001 compared with LPS/IFNγ+). Neuronal survival was comparable to that of positive control 1400W (79% vs. 100%, p > 0.05). Neuronal survival was higher than in wells not treated with LPS/IFNγ (LPS/IFNγ−; 79% vs. 52%, p < 0.05). Also, at the 30-µM concentration, FBS slightly improved neuronal survival (29%, p < 0.05 compared with LPS/IFNγ+).
At the 100-µM concentration, FBA increased neuronal survival from 0% to 51% (p < 0.001 compared with LPS/IFNγ+). Neuronal survival, however, was lower than in wells treated with positive control 1400W (51% vs. 100%, p < 0.001) but comparable to that in wells not treated with LPS/IFNγ (LPS/IFNγ−; 51% vs. 52%, p > 0.05). Lower concentrations of FBA had no favorable effects on neuronal viability (p > 0.05).
At the 100-µM concentration, SA1 improved neuronal survival from 0% to 33% (p < 0.05 compared with LPS/IFNγ+). The neuroprotective effect of SA1, however, was lower than that of positive control 1400 W (33% vs. 100%, p < 0.001). Neuronal survival was comparable to that in wells not treated with LPS/IFNγ (LPS/IFNγ−; 33% vs. 52%, p > 0.05). Lower concentrations of SA1 had no favorable effects on neuronal viability (p > 0.05)
None of the BP1 concentrations investigated promoted neuronal survival (p > 0.05 compared with LPS/IFNγ+). Also, none of the concentrations of 3-((N-(2-propylpentyl)sulfamoyl)amino)propanoic acid (MLV7), MLV12, sodium cyclamate (CA1), montelukast (MTK), novobiocin (NVB), and SCH had any effect on neuronal survival (p > 0.05, Supplementary Fig. S1A, B).
Nitrite levels
The levels of nitrite released into the cell culture medium were investigated to assess the antioxidant capacity of the test compounds. The percentage of nitrite in neuronal-BV2 microglial co-cultures exposed to neuroinflammatory mediators LPS and IFNγ only (LPS/IFNγ+) was set to 100%. In co-cultures treated with the positive control (iNOS inhibitor 1400W), the percentage of nitrite was set to 0%. The antioxidant effect of each test compound was compared with that in co-cultures treated with LPS/IFNγ+ only. Data are summarized in Figure 5B and Supplementary Figure S1C, D.
Control wells
Nitrite levels in wells with neuronal cells only (BV2−) were lower than those in LPS/IFNγ+ co-cultures (−20% vs. 100%, p < 0.001). Also, nitrite levels in cultures that were not exposed to neuroinflammation (LPS/IFNγ-) were lower than those in cultures exposed (LPS/IFNγ+; −21% vs. 100%, p < 0.001). The anti-inflammatory cytokine IL10 did not reduce nitrite levels (102% vs. 100%, p > 0.05 compared with LPS/IFNγ+ cultures).
Test compounds
Of the 11 test compounds, 9 (DP1 > BP1 > FBS > FBA > SA1 as well as MLV7, MLV12, MTK, and NVB) reduced nitrite levels at one or more of the concentrations tested.
At the 100-µM concentration, DP1 reduced nitrite concentrations from 100% to 3% (p < 0.001 compared with LPS/IFNγ+). Nitrite levels were comparable with those of positive control, 1400W (3% vs. 0%, p > 0.05). Nitrite levels, however, were higher than in wells with neuronal cells only (BV2−; 3% vs. −20%, p < 0.01) or wells not treated with LPS/IFNγ (LPS/IFNγ-; 3% vs. −21%, p < 0.001). Lower concentrations of DP1 had no favorable effects on nitrite concentrations.
At the 100-µM concentration, BP1 reduced nitrite concentrations from 100% to 28% (p < 0.001 compared with LPS/IFNγ+). This reduction was associated with cell death, however, as demonstrated by both the neuronal viability assay (Fig. 5A) and microscope images captured from cultured cells (Supplementary Fig. S2F).
At the 100-µM concentration, FBS reduced nitrite concentrations from 100% to 38% (p < 0.001 compared with LPS/IFNγ+). Nitrite levels remained higher than those in wells treated with positive control, 1400 W (38% vs. 0%, p < 0.001). Nitrite levels were also higher than those in wells with neuronal cells only (BV2−; 38% vs. −20%, p < 0.001) or wells not treated with LPS/IFNγ (LPS/IFNγ−; 33% vs. −21%, p < 0.001). Lower concentrations of FBS had no favorable effects on nitrite concentrations.
At the 100-µM concentration, FBA reduced nitrite concentrations from 100% to 47% (p < 0.001 compared with LPS/IFNγ+). Nitrite levels remained higher than in wells treated with positive control, 1400W (47% vs. 0%, p < 0.001). Nitrite levels were also higher than those in wells with neuronal cells only (BV2−; 47% vs. −20%, p < 0.001) or wells not treated with LPS/IFNγ (LPS/IFNγ−; 47% vs. −21%, p < 0.001). Lower concentrations of FBA had no favorable effects on nitrite concentrations.
At the 100-µM concentration, SA1 reduced nitrite concentrations from 100% to 64% (p < 0.001 compared with LPS/IFNγ+). Nitrite levels remained higher than those in wells treated with positive control, 1400W (64% vs. 0%, p < 0.001). Nitrite levels were also higher than in wells with neuronal cells only (BV2−; 64% vs. −20%, p < 0.001) or wells not treated with LPS/IFNγ (LPS/IFNγ−; 64% vs. −21%, p < 0.001). Lower concentrations of SA1 had no favorable effects on nitrite concentrations.
The reduction in nitrite concentrations by CA1, MLV7, MLV12, MTK, or NVB was associated with reduced cell viability as observed in the neuronal survival immunoassay and in microscope images captured from cultured cells (Supplementary Figs. S1A–Dand S2K–O). SCH had no effect on nitrate levels (p > 0.05) (Supplementary Fig. S1D).
TNFα levels
The levels of tumor necrosis factor alpha (TNFα) released into the cell culture medium were investigated to assess the anti-inflammatory capacity of the test compounds. The percentage of TNFα in neuronal-BV2 microglial co-cultures exposed to neuroinflammatory mediators LPS and IFNγ (LPS/IFNγ+) was set to 100%. In co-cultures treated with the positive control, anti-inflammatory cytokine IL10, the percentage of TNFα was set to 0%. The anti-inflammatory effect of each test compound was compared with that in co-cultures treated with LPS/IFNγ+ only. Data are summarized in Figure 5C and Supplementary Figure S1E.
Control wells
The TNFα levels in wells with neuronal cells only (BV2−) were lower than those in LPS/IFNγ+ co-cultures (−531% vs. 100%, p < 0.001). Also, TNFα levels in cultures that were not exposed to neuroinflammation (LPS/IFNγ−) were lower than in cultures exposed to LPS/IFNγ+ (−492% vs. 100%, p < 0.001). Neuroprotectant 1400 W also reduced TNFα levels (−342% vs. 100%, p < 0.001) compared with LPS/IFNγ+ cultures).
Test compounds
Of the 11 test compounds, 7 (DP1 > BP1 > FBS > FBA > SA1 as well as MLV7 and MLV12) reduced TNFα levels at one or more of the concentrations tested.
At the 100-µM concentration, DP1 reduced TNFα levels from 100% to −158% (p < 0.001 compared with LPS/IFNγ+). TNFα levels were even lower than in wells treated with positive control IL10 (−158% vs. 0%, p < 0.001). TNFα levels remained higher than those in wells with neuronal cells only (BV2−; −158% vs. −531%, p < 0.001) or wells not treated with LPS/IFNγ (LPS/IFNγ-)(−158% vs. −492%, p < 0.001). Also, a lower concentration of DP1 reduced neuroinflammation (30 µM, −22%, p < 0.01 compared with LPS/IFNγ+).
At the 100-µM concentration, BP1 reduced TNFα levels from 100% to −125%, (p < 0.001 compared with LPS/IFNγ+). The reduced release of TNFα into the culture medium, however, was associated with cell death as demonstrated by both the neuronal viability assay (Fig. 5A) and microscope images captured from cultured cells (Supplementary Fig. S2F). Lower concentrations of BP1 had no favorable effects on nitrite concentrations.
At the 100-µM concentration, FBS reduced TNFα levels from 100% to −158% (p < 0.001 compared with LPS/IFNγ+). TNFα levels were even lower than those in wells treated with positive control, IL10 (−158% vs. 0%, p < 0.001). TNFα levels remained higher than those in wells with neuronal cells only (BV2−; −158% vs. −531%, p < 0.05) or wells not treated with LPS/IFNγ (LPS/IFNγ−; −158% vs. −492%, p < 0.05). A lower concentration of FBS also reduced neuroinflammation (30 µM, 9%, p < 0.05 compared with LPS/IFNγ+).
At the 100-µM concentration, FBA reduced TNFα levels from 100% to −23% (p < 0.01 compared with LPS/IFNγ+). TNFα levels were comparable to those in wells treated with positive control, IL10 (−23% vs. 0%, p > 0.05). TNFα levels remained higher than in wells with neuronal cells only (BV2−; −23% vs. −531%, p < 0.001) or wells not treated with LPS/IFNγ (LPS/IFNγ−; −23% vs. −492%, p < 0.05). Lower concentrations of FBA had no favorable effects on TNFα levels.
At the 100-µM concentration, SA1 reduced TNFα from 100% to −1% (p < 0.05 compared with LPS/IFNγ+). TNFα levels were comparable to those in wells treated with positive control IL10 (−1% vs. 0%, p > 0.05). TNFα levels remained higher than those in wells with neuronal cells only (BV2−; −1% vs. −531% p < 0.05) or wells not treated with LPS/IFNγ (LPS/IFNγ−; −1% vs. −492 −%, p < 0.05). Lower concentrations of SA1 had no favorable effects on TNFα levels.
Co-cultures treated with MLV7 and MLV12 showed a mild favorable effect on TNFα levels (Supplementary Fig. S1E). The reduced TNFα levels, however, were associated with cell death as demonstrated by both the neuronal viability assay and microscope images captured from cultured cells (Supplementary Figs. S1A and S2K, L).
CA1, MTK, NVB, and SCH exposed cultures had low neuronal viability (see representative images in Supplementary Fig. S2), and TNFα levels were therefore not assessed.
Selection of a compound for in vivo validation
The selection of a compound for in vivo validation was primarily based on scoring of the neuroprotective, antioxidant, and anti-inflammatory effects (Table 2, and Supplementary Table S1). 46,47 We also considered the compound toxicity on neuronal and microglial cells by reviewing the microscope images (Supplementary Fig. S2). In addition, we reviewed the available in vitro and in vivo literature on antiseizure effects and toxicity of different compounds (Table 1).
Scoring of the Test Compounds Based on Their In Vitro Effects on Neuronal Viability, Nitrite Production, and TNFα Levels
Scoring Criteria Are Summarized in Supplementary Table S1.
TNFα, tumor necrosis factor alpha.
Based on in vitro scoring criteria, DP1 (score 2.65 at 100 µM) and FBS (score 2.35 at 100 µM) were the most promising compounds. Visualization of microscope images, however, revealed that FBA-treated cultures (score 1.90) contained a “healthy” cellular profile (Supplementary Fig. S2H) compared with DP1- or FBS-treated cultures (Supplementary Fig. S2G, I). Moreover, available in vivo antiseizure and toxicity data favored FBA over the other compounds. 35
Consequently, FBA was selected for in vivo validation to assess whether it would promote structural and functional recovery after LFP-induced TBI in rats.
Effect of FBA on in vivo outcome measures
Impact pressure, apnea time, time to righting, exclusions, and mortality
Table 3 summarizes the impact pressure, apnea time, and time to the righting. The Kruskal–Wallis test revealed a longer apnea time in the TBI-FBApro+ than the TBI-FBApro group (p < 0.05).
Impact Pressure, Postinjury Apnea, and Righting Reflex per Treatment Group
Data are shown as the mean ± standard deviation of the mean. The number of animals in the given treatment group is in parentheses. Median and range are shown in brackets.
Statistical analysis: *p < 0.05 versus TBI-FBApro.
FBApro, FBA prophylactic treatment; FBApro+, FBA prophylactic treatment plus on-demand doses; TBI, traumatic brain injury; VEH, vehicle treatment.
Acute and follow-up mortality and exclusions are summarized in Figure 2.
Exclusions and acute (<48 h) mortality
In Cohort 1, three rats were excluded (one broken dura, one disconnection of injury cap, and one long [58 min] righting reflex time). There was no acute mortality (0%).
In Cohort 2, one rat was excluded due to a malfunctioning electrode headset. Acute mortality was 9% (3/32).
Follow-up exclusions and mortality
In Cohort 1 and Cohort 2A, there was no follow-up mortality or exclusions for other reasons. In Cohort 2B, follow-up mortality was 15% (2/13); 0% in the TBI-VEHpro+ group and 20% (2/10) in the TBI-FBApro+ group. There were no other follow-up exclusions.
Effect of FBA on the cortical lesion area and plasma pNF-H
Data are summarized in Figure 6.
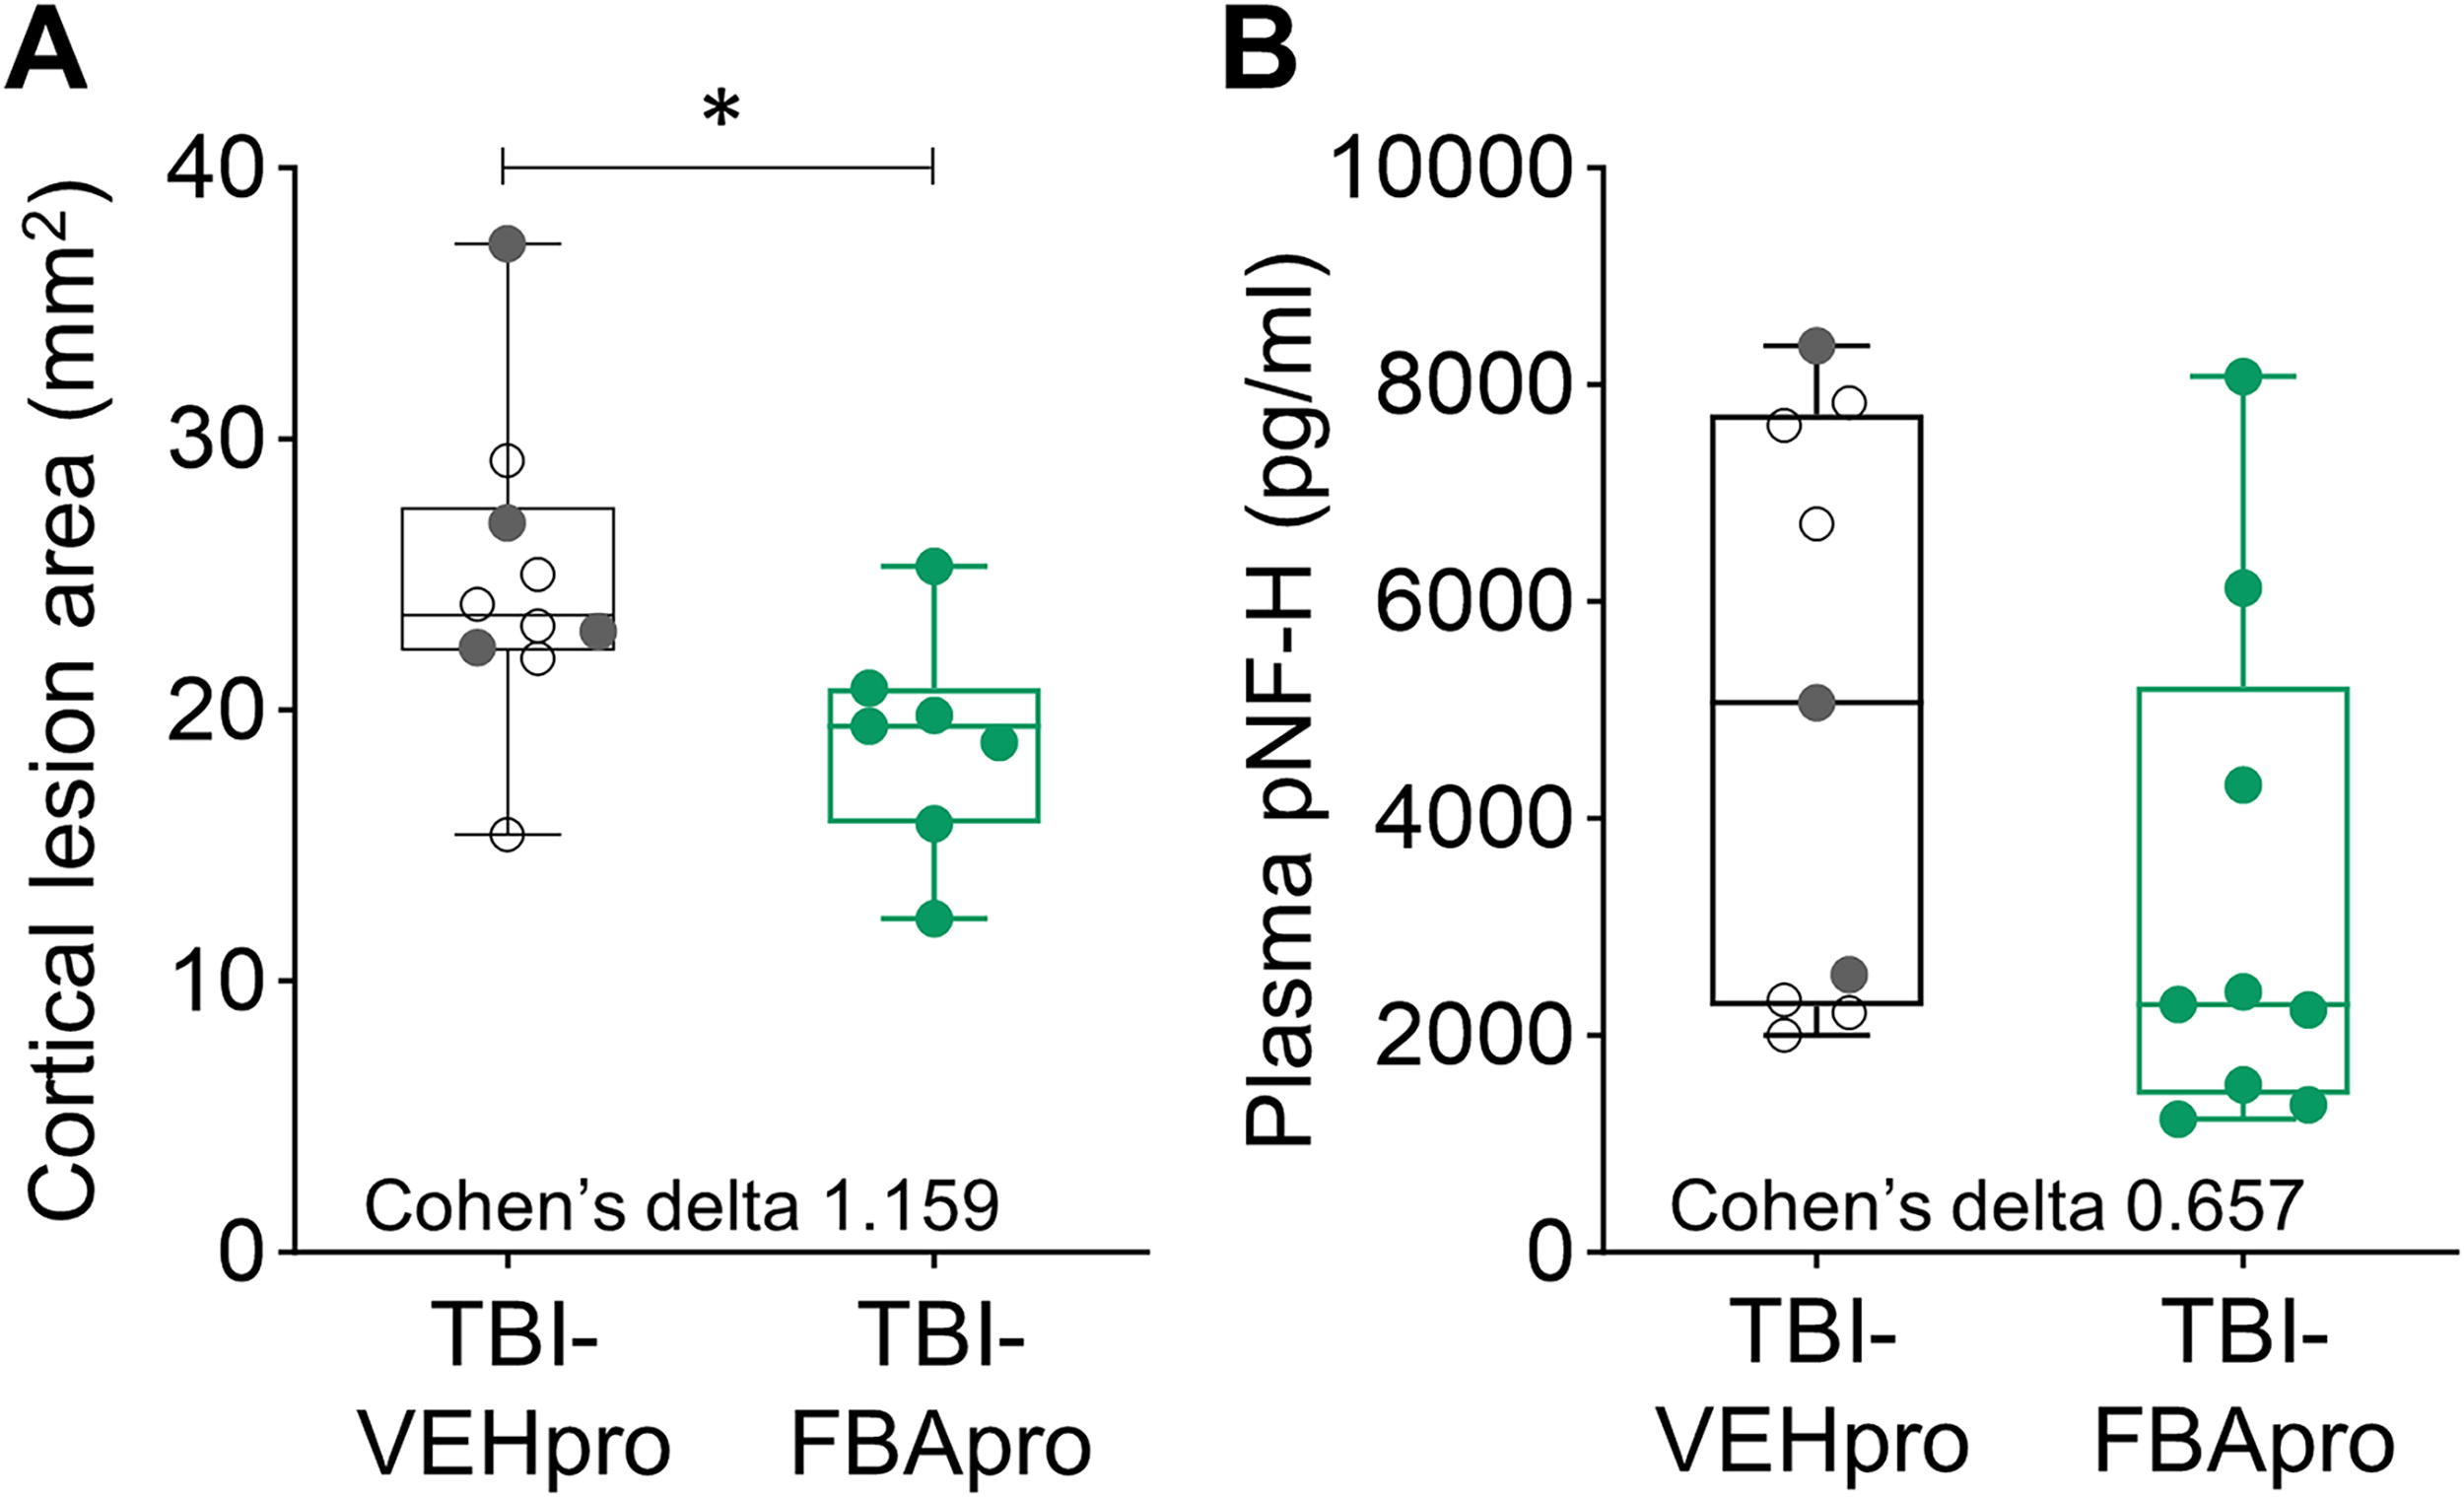
Effect of FBA on the cortical lesion area and plasma pNF-H levels (Cohort 1).
Cortical lesion area
Unfolded cortical maps were prepared to determine the treatment effect on cortical lesion area. 48 On D14 post-TBI, the average cortical lesion area in the TBI-VEH group was 24.8 ± 5.7 mm2 (median 23.5 mm2, range 15.4–37.2 mm2, and n = 10). In the TBI-FBA group, the cortical lesion area was smaller, 18.9 ± 4.1 mm2 (median 19.4 mm2, range 12.3–25.3 mm2, n = 7, p < 0.05) (Fig. 6A). Cohen’s delta also indicated a strong favorable effect size (1.159).
Plasma levels of pNF-H
The average plasma pNF-H levels at 72 h post-TBI were comparable between the TBI-VEH (4970 ± 2716 pg/mL, median 5073 pg/mL, range 2005–8363 pg/mL, n = 9) and TBI-FBA (3288 ± 2396 pg/mL, median 2290 pg/mL, range 1230–8080 pg/mL, n = 9) groups (p > 0.05) (Fig. 6B). However, Cohen’s delta indicated a moderate favorable effect size of FBA treatment (0.657).
Effect of FBA on acute electrographic seizures during 0–72 h postinjury
As 98% of the acute seizures occur during the 0–72 h postimpact, 14 we focused the analysis on that time period. The occurrence of acute electrographic seizures was comparable between the TBI-VEH groups in Cohorts 1 and 2. Consequently, the data were combined for subsequent analysis.
The occurrence of acute seizures in the TBI-VEH, TBI-FBApro, and TBI-FBApro+ groups is summarized in Figure 7A–D , Figures 8 and 9, and Supplementary Tables S2, S3 and S4.

Effect of FBA on acute electrographic seizures.
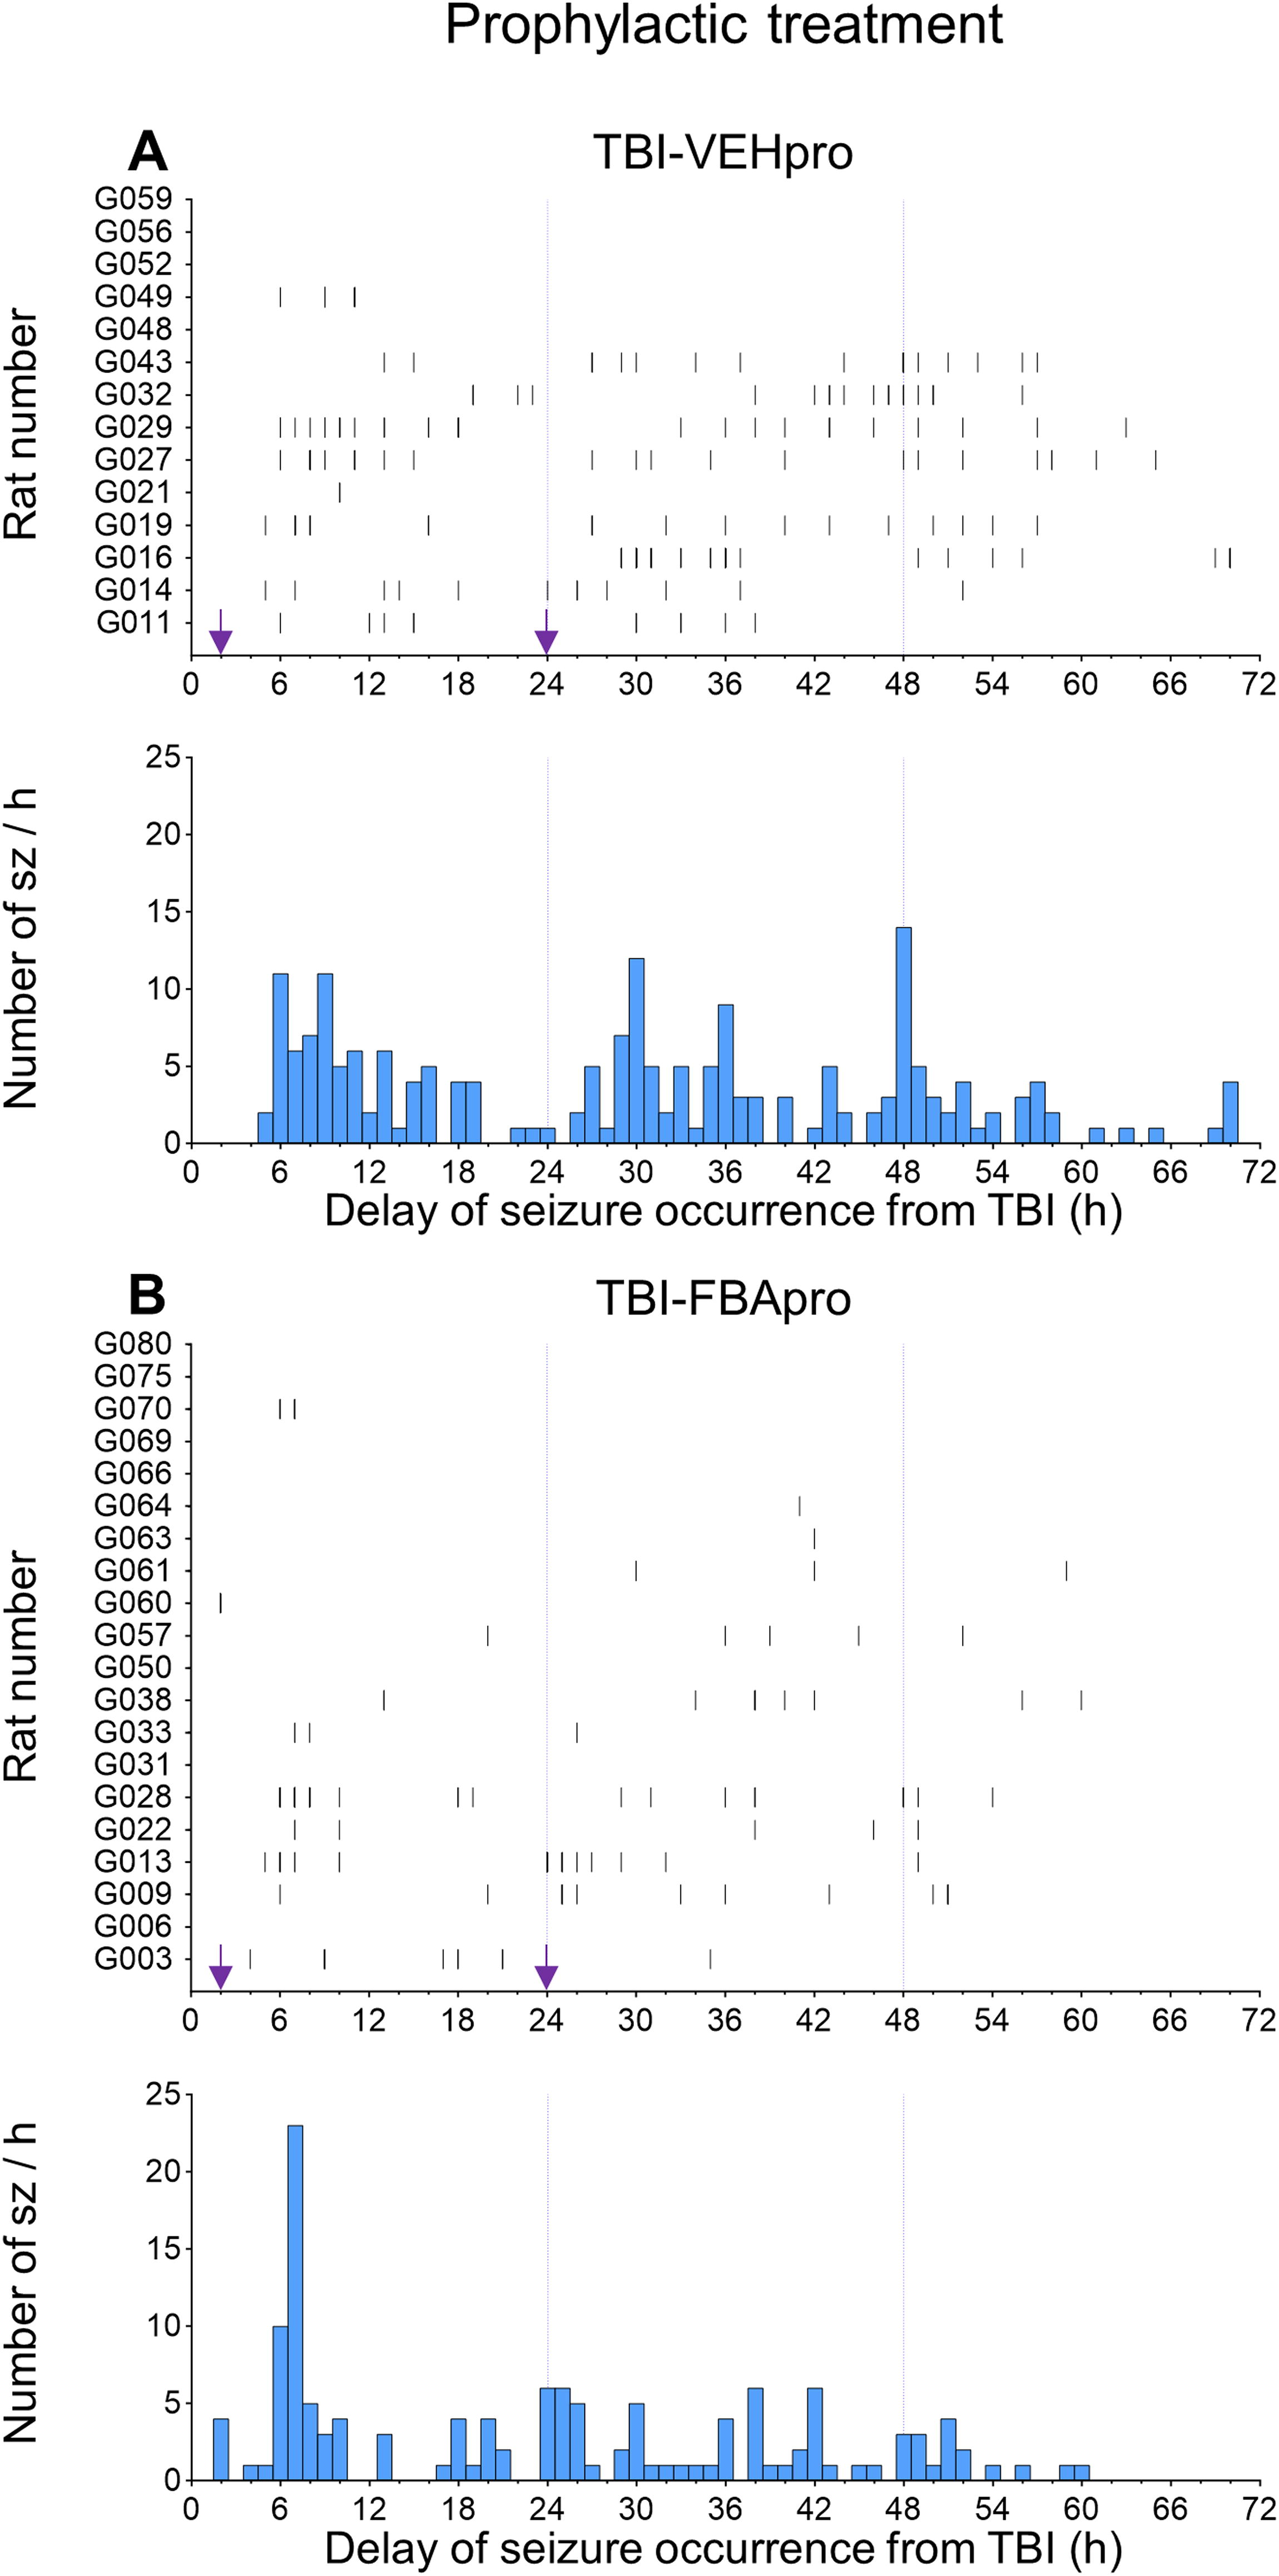
Occurrence of acute seizures during the first 0–72 h post-TBI—prophylactic treatment group.
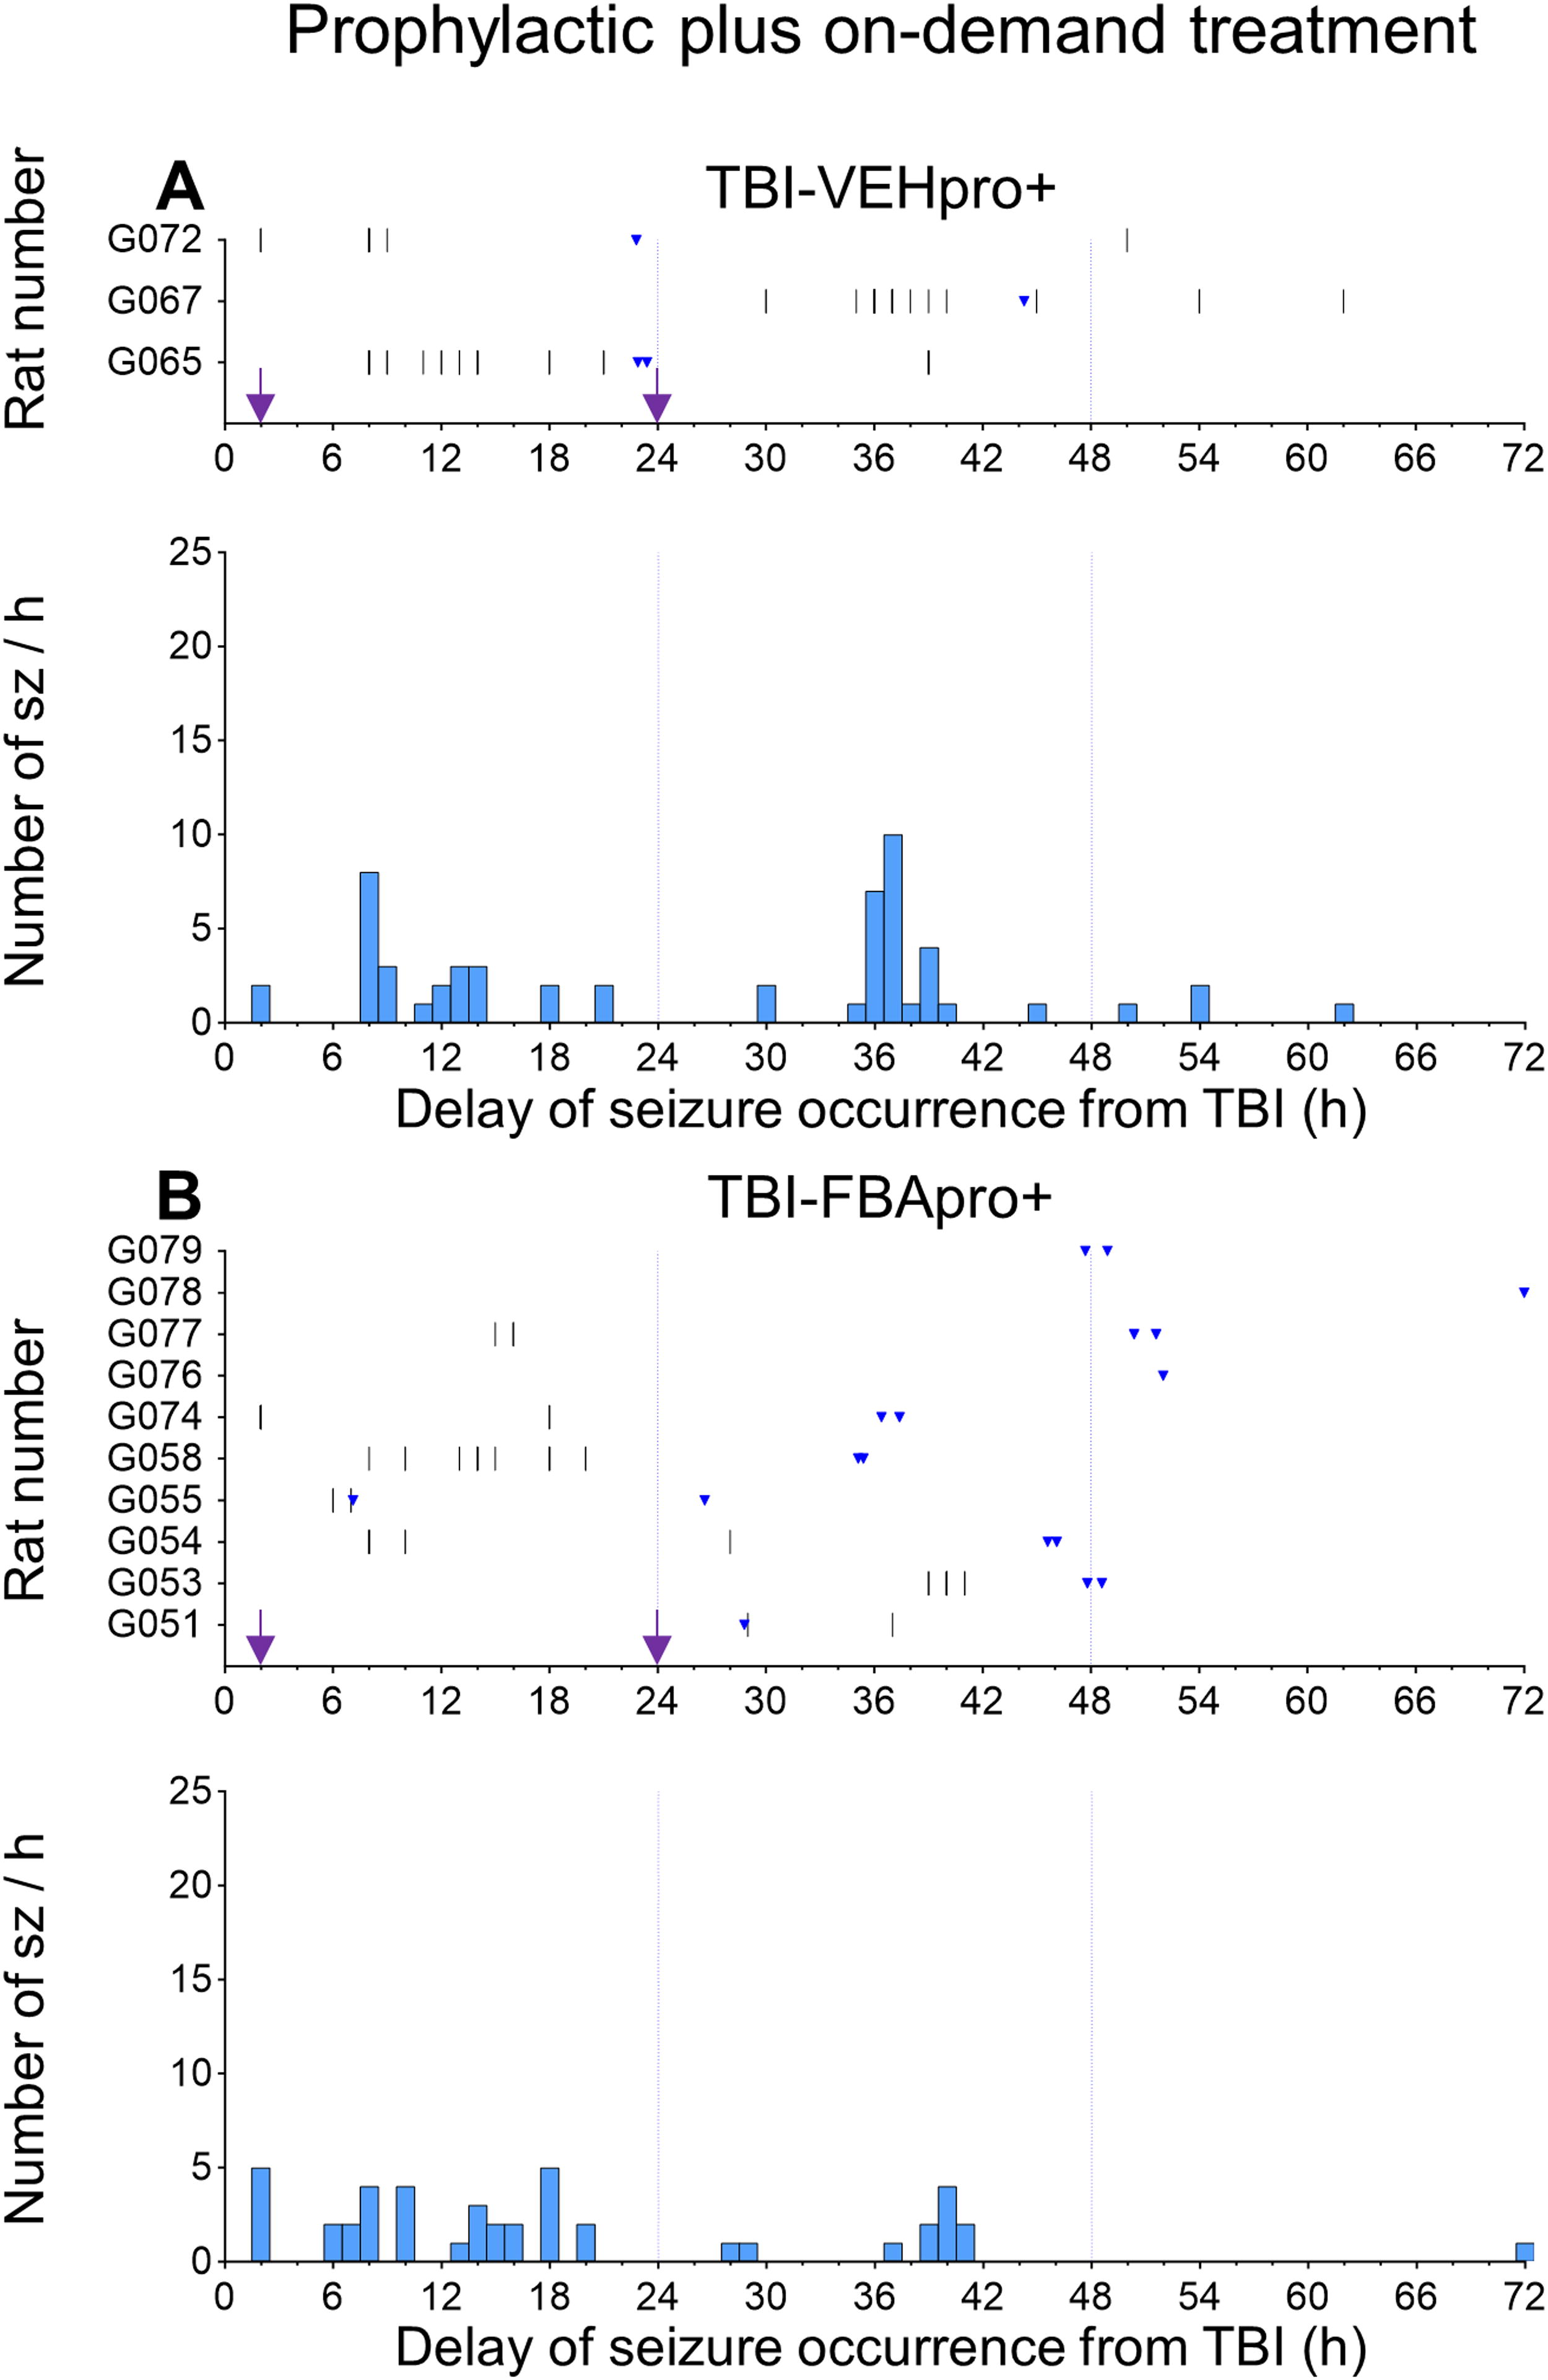
Occurrence of acute seizures during the first 0–72 h post-TBI — prophylactic treatment group supplemented with on-demand treatment.
Seizure occurrence
Fisher’s exact test revealed that the percentage of rats with acute seizures was comparable between the TBI-VEH (76%, 13/17), TBI-FBApro (65%, 13/20), and TBI-FBApro+ (70%, 7/10) groups (p > 0.05) (Fig. 7A).
Latency to the appearance of the first electrographic seizure
In the TBI-VEH group, average latency to the first electrographic seizure was 11 ± 9 h (median 6 h, range 2–30 h). The average latency to the first seizure in the TBI-FBApro (15 ± 14 h, median 7 h, range 2–42 h) and TBI-FBApro+ (19 ± 16 h, median 8 h, range 2–39 h) groups did not differ from that in the TBI-VEH group (both p > 0.05). Also, average latency to the first seizure did not differ between the 2 TBI-FBA treatment groups (p > 0.05) (Fig. 7B).
Number of acute electrographic seizures
Data are summarized in Figure 7C and Supplementary Table S2A, B. In the entire TBI-VEH group, the average seizure number was 15.2 ± 12.4 (median 15.0, range 0.0–40.0). The average seizure number was 6.8 ± 8.6 (median 5.0, range 0.0–33.0) in the TBI-FBApro group and 4.3 ± 4.2 (median 3.5, range 0.0–13.0) in the TBI-FBApro+ group (all comparisons p > 0.05). Cohen’s delta, however, indicated a moderate favorable effect size (0.795) in the TBI-FBApro group and a large favorable effect size (1.058) in the TBI-FBApro+ group compared with vehicle treatment. The number of seizures did not differ between the TBI-FBApro and TBI-FBApro+ groups (p > 0.05). Cohen’s delta showed a small (0.334) favorable treatment effect of the TBI-FBApro+ treatment compared with TBI-FBApro treatment.
When only the rats with seizures were included in the analysis, the Kruskal–Wallis test revealed differences between the treatment groups in the average number of seizures (p < 0.01). The average number of seizures in the TBI-VEH group (n = 13) was 19.9 ± 10.3. The TBI-FBApro (10.5 ± 8.7, n = 13) and TBI-FBApro+ (6.1 ± 3.7, n = 7) groups had a lower average number of seizures than the TBI-VEH group (p < 0.05 and p < 0.01, respectively) (Supplementary Table S2B).
Number of seizures over the 0–72 h follow-up
The evolution of the average number of seizures during the 0–24 h, 25–48 h, and 49–72 h intervals is summarized in Supplementary Table S2A-B. As shown previously, seizure occurrence decayed spontaneously over time (Fig. 8-9) (see TBI-VEH group, Supplementary Table S2A, B). 14,47
On-demand treatment was administered to 1/10 rats between 0–24 h, 7/10 rats between 25–48 h, and 5/10 rats between 49–72 h. Of these animals, 7/10 had seizures during the 0–72 h interval. In the whole animal cohort, analysis of each time interval separately revealed no differences between the TBI-FBApro and TBI-VEH groups (all time intervals p > 0.05). Interestingly, between 49 and 72 h, the TBI-FBApro+ group (i.e., having received additional doses of FBA) had fewer seizures than vehicle-treated animals (0 vs. 2.2 ± 2.8, p < 0.05). Moreover, Cohen’s delta revealed a moderate (0.674) favorable treatment effect between 49 and 72 h by the TBI-FBApro+ treatment over TBI-FBApro treatment (Supplementary Table S2A).
If only the rats with seizures were included in the analysis, average seizure number did not differ between the TBI-FBApro and TBI-VEH groups (all time intervals p > 0.05). Also, the average seizure number did not differ between the TBI-FBApro and TBI-FBApro+ groups (all time intervals p > 0.05). However, Cohen’s delta revealed a moderate favorable effect (0.605) during the 25–48 h interval and a large favorable effect (0.915) during the 49–72 h interval by the TBI-FBApro+ treatment over TBI-FBApro treatment (Supplementary Table S2B).
Average duration of acute electrographic seizures
Data are summarized in Supplementary Table S3A, B. In the whole animal group, the average duration of early seizures occurring during the 0–72 h interval was comparable between the TBI-VEH (46 ± 29 s, median 56 s, range 0–83 s), TBI-FBApro (37 ± 30 s, median 46 s, range 0–82 s), and TBI-FBApro+ (43 ± 41 s, median 42 s, range 0–128 s) groups (p > 0.05). Cohen’s delta revealed a small effect size for the TBI-FBApro group (0.307) and no effect for the TBI-FBApro+ group (0.080) compared with the TBI-VEH group (Supplementary Table S3A). Note that animals in the TBI-FBApro+ group exhibited no seizures during the 49–72 h period.
If only the rats with seizures were included in the analysis, average seizure duration did not differ between the TBI-FBApro, TBI-FBApro+, and TBI-VEH groups (all time intervals p > 0.05). However, Cohen’s delta revealed a small favorable effect (0.418) during the 25–48 h interval and a large favorable effect (1.422) during the 49–72 h interval by the TBI-FBApro+ treatment over the TBI-VEH treatment (Supplementary Table S3B).
Friedman’s 2-way analysis of variance indicated that seizure duration was comparable across all intervals (0–24 h, 25–48 h, and 49–72 h) in the three treatment groups (p > 0.05).
Cumulative duration of acute electrographic seizures
Data are summarized in Figure 7D and Supplementary Table S4A, B. The Kruskal–Wallis test detected differences in the cumulative duration of electrographic seizures among the treatment groups (p < 0.05). In the TBI-VEH group, the average cumulative duration of acute seizures was 896 ± 703 s (median 1145 s, range 0–1833 s). In the TBI-FBApro group, the average cumulative seizure duration was reduced to 368 ± 407 s (median 329 s, range 0–1237 s)(p < 0.05 compared with the TBI-VEH group). In the TBI-FBApro+ group, the cumulative duration of seizures was reduced to 256 ± 327 s (median 218 s, range 0–1108 s; p < 0.05). Cohen’s delta suggested a large favorable treatment effect size in both the TBI-FBApro (0.941) and TBI-FBApro+ (1.076) treatment groups compared with the TBI-VEH treatment group.
When only the rats with seizures were included in the analysis, the Kruskal–Wallis test detected differences in the cumulative duration of electrographic seizures among the treatment groups (p < 0.01) (Supplementary Table S4B). In the TBI-VEH group (n = 13), the average cumulative seizure duration was 1 172 ± 556 s. In the TBI-FBApro (566 ± 376 s, n = 13) and TBI-FBApro+ (365 ± 337 s, n = 7; p < 0.01) groups, the average cumulative seizure duration was reduced compared with that in the TBI-VEH group (both p < 0.01). Cohen’s delta suggested a large favorable treatment effect size in both the TBI-FBApro (1.279) and TBI-FBApro+ (1.635) treatment groups compared with the TBI-VEH treatment group. Also, Cohen’s delta indicated a moderate effect of FBApro+ treatment compared with FBApro treatment (0.551). Cohen’s delta indicated moderate to strong effect of TBI-FBA treatment over TBI-VEH treatment at all time intervals. Moreover, during the 25–48 h interval, Cohen’s delta revealed a large favorable effect (0.836) by TBI-FBApro treatment over TBI-VEH treatment.
Effect of on-demand FBA administration on relative EEG power
Next, we assessed the electrographic signature of FBA treatment on the relative power of the delta, theta, alpha, beta, and gamma bands in EEG. Data are summarized in Supplementary Figure S3. The EEG epochs were sampled 60 min before and 60 min after the first dose of FBA on-demand treatment and compared, matching the expected increase of FBA brain concentration after the on-demand administration.
In the TBI-VEHpro+ group, average relative power of all EEG bands before and after vehicle administration was comparable in all brain regions (C3, C4, O1, and O2; p > 0.05 Wilcoxon’s test).
In the TBI-FBApro+ group, the first dose of on-demand treatment (100 mg/kg, i.p.) reduced average relative theta power in the ipsilateral frontal area (C3; 22% vs. 20%, p < 0.05). In parallel, average alpha power decreased ipsilaterally in both C3 (7% vs. 5%, p < 0.01) and O1 (6% vs. 5%, p < 0.05) as well as contralaterally in both C4 (10% vs. 7%, p < 0.01) and O2 (9% vs. 7%, p < 0.01). The average gamma power increased in the occipital area in both O1 (6% vs. 11%, p < 0.01) and O2 (12% vs. 16%, p < 0.05). No effects on average delta or beta power were detected.
Discussion
The present study investigated whether antiseizure compounds discovered through structure-based designing could be repurposed to mitigate brain damage and alleviate early seizures after TBI. We hypothesized that a compound capable of promoting neuronal viability, reducing neuroinflammation and nitrite-induced oxidative stress in vitro, would have a favorable disease-modifying effect in a rat model of TBI. Based on a previously defined pipeline, 46 we tested the effects of the compounds in vitro prior to validating the most promising compounds in vivo. We had four major findings: (i) Of the 11 computer-aided identified compounds, 3 compounds, DP1, FBA, and FBS, exhibited a promising in vitro therapeutic effect. The remaining compounds either exhibited some toxicity (BP1, MTK, and SA1) or had no effect in promoting neuronal survival CA1, MLV7, MLV12, NVB, or SCH. (ii) FBA, a compound with a promising in vitro therapeutic effect, reduced the cortical lesion area at 2 weeks post-TBI. (iii) FBA also had a promising antiseizure effect during the acute post-TBI phase. (iv) Administration of an additional dose of FBA on-demand if epileptiform activity emerged showed additive antiseizure effects.
DP1, FBS, and FBA had the most promising in vitro therapeutic profile
Existing evidence indicates that TBI results in neuronal cell death and a cascade of molecular changes, including neuroinflammation and oxidative stress. 5,6,49 Several studies report that treatments enhancing neuronal survival and alleviating neuroinflammation and oxidative stress could promote recovery following TBI. 5,19 Consequently, the ability of structure-based design compounds to enhance neuronal viability and reduce neuroinflammation and oxidative stress was tested in vitro before proceeding to in vivo validation. A score of in vitro outcome measures 46,47 was used to determine the compound with the most promising treatment effects. In addition, visualization of microscope images enabled us to perform a qualitative analysis of the cell cultures to avoid false-positive results based on in vitro tests only. Further, preliminary in vivo data on antiseizure efficacy in mouse electroshock model 35 were considered before selecting the compound for in vivo testing.
Compound DP1 (donepezil) is an acetylcholinesterase inhibitor used to treat mild and moderate Alzheimer’s disease. 50 Previous data revealed that 0.1–10 µM DP1 confers neuroprotection against oxygen–glucose deprivation and NMDA excitotoxicity in cortical neurons, as well as protection against amyloid-β toxicity in septal neurons. 32 In another study, 1–50 µM of DP1 reduced proinflammatory mRNA levels in BV2 microglial cells. In the same study, 1 mg/kg of DP1 reduced: (a) amyloid-β-induced inflammation in a mouse model of Alzheimer’s disease and (b) LPS-induced COX2 and IL6 levels in wild-type mice. 51 In addition, DP1 had an antiseizure effect in a mouse model of Dravet syndrome. 52 Together, these studies provided evidence of the neuroprotective and antiseizure effects of DP1, and thus we tested the effects of DP1 in our neuronal-BV2 microglial co-culture model. In our study, quantitative analysis using a MAP2-immunoassay showed that 1–100 µM of DP1 had a neuroprotective effect in co-cultures. Some cellular degeneration was observed in co-cultures treated with 100 µM of DP1, however, suggesting that higher doses of DP1 could be cytotoxic. Overall, our in vitro data are consistent with previous data showing that DP1 has neuroprotective properties at lower concentrations.
The FBS compound (3-p-fluorbenzyl-5,5-dimethyl-1,2,3-oxathiazolidine-4-one-2,2-dioxide) was designed to block sodium 1.2 voltage-gated channels (Nav1.2). 35 FBS demonstrated potent Nav1.2 blocking capacity in docking simulations. Also, 100 µM of FBS inhibited Nav1.2 currents in HEK 293 cell patch clamp experiments. FBS had only a weak antiseizure effect, however, in a mouse maximal electroshock model. 35 In previous reports, sodium channel blockers demonstrated neuroprotective effects both in vitro and in vivo. 53,54 Sodium channel blockers prevent the propagation of action potentials, thus mitigating excitotoxicity, which could account for their neuroprotective capacity. 55 Therefore, we tested the neuroprotective effects of FBS in our co-culture model. In our in vitro investigations, a MAP2-immunoassay showed that treatment with FBS at 30 µM and 100 µM has promising neuroprotective effects. Some cellular degeneration was observed in co-cultures treated with 100 µM FBS, however, suggesting that higher doses of FBS could be cytotoxic.
Further analysis involving the allocation of a score based on the effect of a compound on in vitro outcome measures revealed that DP1 and FBS had the highest overall scores. Because some cellular degeneration was observed in co-cultures treated with the highest concentration (100 µM) of DP1 or FBS, these compounds were excluded from further in vivo analysis. Whether this mild discrepancy between the data obtained in the immunoassay and microscopy related to different assay sensitivities remains to be studied. Nevertheless, this observation highlights the importance of microscope imaging as an additional investigation to assess the in vitro effect or toxicity of experimental compounds. We attributed the low nitrite and TNFα levels observed in co-cultures treated with 100 µM of DP1 or FBS to the reduced survival of both neuronal and microglial cells observed in the microscope images. Overall, as both DP1 and FBS demonstrated some degree of cytotoxicity, they were not selected for further in vivo testing.
The compound FBA (N-[p-fluoro] benzyl-2-hydroxy isobutylamide) was designed and synthesized as an antiseizure drug. 35 In both docking simulations and in HEK 293 cell culture investigations, FBA did not demonstrate an ability to block Nav1.2 channels. In vivo assays in a mouse maximal electroshock model, however, showed that FBA has potent antiseizure activity. 35 The mechanism underlying the antiseizure activity of FBA is still under investigation. The present analysis of data from the MAP2-immunoassay and microscope images revealed that treatment with 100 µM of FBA had the most promising neuroprotective effect. Moreover, 100 µM of FBA had promising antioxidant (low nitrite levels) and anti-inflammatory (low TNFα levels) effects. The promising treatment effect of FBA in our in vitro study and in the mouse maximal electroshock model 35 prompted us to select FBA for further in vivo testing in the LFP-induced TBI model used in our laboratory. The in vitro validation experiment was conducted by an individual blinded to the antiseizure effects exhibited by FBA.
FBA mitigated brain damage by reducing the cortical lesion area
Within seconds to minutes following TBI, a myriad of secondary molecular modifications occur, resulting in cellular and axonal damage. 5,7,56 Our previous magnetic resonance imaging follow-up study showed that the cortical lesion area expands rapidly during the first 3 weeks post-TBI. 56 Data from many other laboratories indicate that early treatment with neuroprotective compounds reduces the post-TBI lesion size. 57 –59 In our study, cortical lesion area was assessed on D14 post-TBI. FBA treatment administered at 2 and 24 h postimpact reduced the cortical lesion area by 24%. Although the neuroprotective mechanism targeted by FBA and the duration of the postinjury expression remain to be investigated, our data suggest a relatively wide therapeutic time window (hours rather than minutes) for treatment initiation. Moreover, we found a moderate favorable FBA treatment effect on the axonal injury marker pNF-H, supporting the in vitro-predicted neuroprotective effect of FBA in vivo.
FBA had a promising effect on acute post-TBI seizures
Previous reports indicate the importance and efficacy of antiseizure prophylaxis for the treatment of acute seizures post-TBI in humans and rodents. 60 –62 In electrical stimulation or chemoconvulsant models of SE, prevention or reduction of early seizures mitigated secondary brain damage and epileptogenesis. 63 Although the long-term benefits of antiseizure prophylaxis after TBI are still unclear, 64,65 evidence suggests that patients with immediate or early seizures have a higher risk of developing PTE, poor cognitive recovery, and an elevated risk of death. 8,12
To prevent acute seizures post-TBI, FBA was administered at 2 and 24 h after impact as a prophylactic treatment. Moreover, to mimic the clinical treatment of SE, one subcohort of animals received additional doses of FBA on-demand if epileptiform activity lasting at least 5 min emerged during the online follow-up despite prophylactic treatment. 66,67 Although prophylactic FBA treatment alone or FBA treatment complemented with on-demand administration exhibited no statistically significant reduction in the average seizure number, Cohen’s delta suggested a large favorable treatment effect in this relatively small cohort size. The effect was even clearer when the analysis was performed on rats with seizures only. The reduction in the seizure number by prophylactic FBA was augmented by administering additional on-demand FBA treatment. As expected, the reduction in the seizure number was associated with a remarkable reduction (∼60%) in cumulative seizure duration.
Previous investigations indicate that FBA has a peak effect in mice at 30 min after administration. 35 Based on this preliminary data, the acute doses of FBA were separated by at least 30 min to allow the compound to reach its maximum brain concentration before administering a second dose. As FBA has a short half-life, it might be necessary to administer more than two acute doses of FBA to achieve its full antiseizure potential. These additional doses could confer some toxicity, however, as suggested by a 20% follow-up mortality in the subgroup of animals that received additional doses of FBA. Future studies are warranted to investigate the full spectrum of adverse effects of FBA.
Relative power analysis revealed an increase in relative gamma power bilaterally in the occipital areas. Previous studies revealed that increased gamma power indicates the activation of parvalbumin-positive inhibitory GABAergic neurons. 68 –70 Functionally, increased gamma power is associated with improved attention, cognition, and working memory. 70 –72 It is also possible that the increased gamma power is related to increased awareness and attention triggered by the intraperitoneal injection, even though the rats were undergoing electrographic SE. The increase in the relative gamma power was more prominent after FBA injection than after vehicle injection, however, favoring a drug effect rather than an injection effect. We also found that FBA reduced relative theta power in the ipsilateral frontal area. The significance of the relative theta power is still under investigation, but some reports suggest that reduced theta power correlates with improved cognition. 73,74 FBA also induced a reduction in relative alpha power at all recording sites. Previous studies on the functional significance of low alpha power are inconclusive. 75 One clinical study suggests that low alpha power could indicate the presence of axonal injury and loss of white matter. 76 In the present study, however, FBA treatment was associated with reduced, rather than increased, levels of the axonal injury marker pNF-H. Other studies in humans report that reduced alpha rhythm is associated with cognitive impairment and poor quality of the N1 and N2 stages of sleep. 77,78 The functional significance of a drug-induced reduction in relative alpha power in rats remains to be further explored.
Taken together, these data suggest that FBA is a promising compound for the treatment of early seizures, both as a prophylactic treatment started soon after TBI diagnosis and as an on-demand treatment to be administered when epileptiform activity emerges. Further studies are needed to maximize the antiseizure efficacy and tolerability of FBA.
Caveats
Only FBA was tested in vivo, even though also DP1 and FBS were promising based on in vitro testing of neuroprotection and measurement of levels of anti-inflammatory and antioxidant markers. Our final decision to proceed to proof-of-concept in vivo trial took into account also the qualitative analysis of cell death detected on microscope images. As the microscopic analysis was performed at 24 h posttreatment timepoint only, further safety studies are warranted to explore the safety profile of all top-scoring compounds in detail to consider their evaluation in vivo.
FBA on-demand treatment (FBApro+) was only given to non-responding rats in the FBApro group, that is, to rats that showed seizures despite prophylactic FBA treatment. As controls, we investigated vehicle-treated rats that had been pretreated with vehicle to control the possible injection/stress effect on epileptiform activity. It remains to be explored in a larger animal cohort (including both males and females), whether the administration of FBA will show antiseizure efficacy as an on-demand administration to subjects undergoing SE with or without prior clinically used antiseizure treatments.
Conclusion
Our data demonstrate that computer-guided identification of antiseizure compounds is a viable approach for compound discovery to treat post-TBI epileptiform activity. FBA, a computer-aided designed compound with preliminary evidence of antiseizure activity in a mouse model exhibited antiseizure and neuroprotective efficacy after TBI. Further studies in larger animal cohorts with both sexes and multiple dosing are needed to reveal the full potential of FBA as an antiseizure treatment.
Transparency, Rigor, and Reproducibility Statement
The study designs and analytic plan were not formally preregistered on any repository. Computer-assisted drug discovery approaches were used to identify and select 11 antiseizure compounds based on their molecular structure. The neuroprotective potential of the test compounds was investigated in vitro in neuronal-BV2 microglial co-cultures. After a 48-h exposure to test compounds, neuronal viability (MAP2 immunoassay), nitrite, and TNFα assays were performed. FBA, a compound which exhibited strong antiseizure efficacy in a mouse maximal electroshock model, had the most promising therapeutic profile in vitro and was selected for validation in a rat model of LFP-induced TBI. In total, 54 rats were injured using LFP, 4 were excluded (1 for prolonged recovery post-TBI, 1 for disconnected injury cap, 1 for broken dura, and 1 for problem with headset connection). Acute mortality was 6% (3/54). Using excel, the remaining 47 rats were randomly assigned to the following treatment groups: TBI-vehicle (TBI-VEH, n = 17 [TBI-VEHpro, n = 14 and TBI-VEHpro+, n = 3]), TBI-FBA prophylactic (TBI-FBApro, n = 20), and TBI-FBA prophylactic, plus additional FBA on-demand treatment (TBI-FBApro+, n = 13). Follow-up mortality was 4% (2/54). Prophylactic treatment was administered at 2 and 24 h after injury. In addition to the prophylactic treatment rats in the TBI-VEHpro+ or TBI-FBApro+ group received up to two doses of on-demand treatment if we observed any SE-related epileptiform activity. The experiment was replicated in two separate cohorts. The effect of FBA on in vivo outcome was assessed through the analysis of seizure occurrence and EEG power spectrum, extent of cortical lesion area, and plasma levels of pNF-H. The in vitro study was performed by an individual blinded to the antiseizure of FBA. In vivo data analysis was conducted in a blinded manner. As the occurrence of seizures between the TBI-VEH group in Cohort 1 was comparable to that in Cohort 2, we concluded that there was consistency between the cohorts. The normality of the data was assessed using the Shapiro-Wilkinson test. A p value <0.05 was considered as significant. All equipment and analytical reagents used to perform experiments or data analysis are available from the sources indicated in the article.
Footnotes
Acknowledgments
The authors thank Jarmo Hartikainen, Merja Lukkari, and Petra Mäkinen for their excellent technical assistance.
Data Availability Statement
The datasets generated during and/or analyzed during the current study are not publicly available but could be acquired from the corresponding author on reasonable request.
Authors’ Contributions
Conception and design: N.K., I.B., P.A., A.L., A.T., and A.P. Methodology and investigation: N.K., I.B., P.A., A.L., L.S., M.L.V., M.C., T.N., and E.H. Data analysis: N.K., I.B., P.A., A.L., and A.P. Article writing with input from all authors: N.K., I.B., P.A., A.L., N.P., L.G., A.T., and A.P. Funding acquisition: N.K., M.H., L.G., A.T., and A.P.
Author Disclosure Statement
The authors have no competing interest to disclose.
Funding Information
This study was supported by the GenomMed Horizon 2020 Framework Programme of the European Union (Marie Sklodowska-Curie grant agreement no. 740264), the Medical Research Council of the Academy of Finland (Grant nos. 272249, 273909, 317203, and 338182), the Sigrid Juselius Foundation and the Strategic Neuroscience Funding of the University of Eastern Finland, and the ApoyoDravet and the Agencia Nacional de Promoción de la Investigación, el Desarrollo Tecnológico y la Innovación (Agencia I + D+i, grants PICT 2019-1075, PICT-2020-02077) and the Universidad Nacional de La Plata, Argentina (Project no. x-883).
Supplementary Material
Supplementary Data
Supplementary Figure S1
Supplementary Figure S2
Supplementary Figure S3
Supplementary Table S1
Supplementary Table S2
Supplementary Table S3
Supplementary Table S4
References
Supplementary Material
Please find the following supplemental material available below.
For Open Access articles published under a Creative Commons License, all supplemental material carries the same license as the article it is associated with.
For non-Open Access articles published, all supplemental material carries a non-exclusive license, and permission requests for re-use of supplemental material or any part of supplemental material shall be sent directly to the copyright owner as specified in the copyright notice associated with the article.
