




Abstract
Traumatic brain injury (TBI) and subsequent post-traumatic epilepsy (PTE) often impair daily activities and mental health (MH), which contribute to long-term TBI-related disability. PTE also affects driving capacity, which impacts functional independence, community participation, and satisfaction with life (SWL). However, studies evaluating the collective impact of PTE on multidimensional outcomes are lacking. Thus, we generated a model to investigate how PTE after moderate-to-severe (ms)TBI affects TBI-associated impairments, limits activities and participation, and influences SWL. Of 5108 participants with msTBI enrolled into the National Institute for Disability, Independent Living, and Rehabilitation Research TBI Model Systems between 2010 and 2018 and with seizure-event data available at year-1 post-TBI, 1214 had complete outcome data and 1003 had complete covariate data used for analysis. We constructed a conceptual framework illustrating hypothesized interrelationships between year-1 PTE, driving status, functional independence measure (FIM), depression and anxiety, as well as year-2 participation, and SWL. We performed univariate and multivariable linear and logistic regressions. A covariate-adjusted structural equation model (SEM), using the lavaan package (R), assessed the conceptual framework’s suitability in establishing PTE links with outcomes 1–2 years post-injury. Multiple parameters were evaluated to assess SEM fit. Year-1 PTE was correlated with year-1 FIM motor (standardized coefficient, βstd = −0.112, p = 0.007) and showed a trend level association with year-1 FIM cognition (βstd = −0.070, p = 0.079). Individuals with year-1 PTE were less likely to drive independently at year 1 (βstd = −0.148, p < 0.001). In addition, FIM motor (βstd = 0.323, p < 0.001), FIM cognition (βstd = 0.181, p = 0.012), and anxiety (βstd = −0.135, p = 0.024) influenced driving status. FIM cognition was associated with year-1 depression (βstd = 0.386, p < 0.001) and year-1 anxiety (βstd = 0.396, p < 0.001), whereas year-1 FIM motor (βstd = 0.186, p = 0.003), depression (βstd = −0.322, p = 0.011), and driving status (βstd = 0.233, p < 0.001) directly affected year-2 objective life participation metrics. Moreover, year-1 depression (βstd = −0.382, p = 0.001) and year-2 participation (βstd = 0.160, p < 0.001) had direct effects on year-2 SWL. SWL was influenced indirectly by year-1 variables, including functional impairment, anxiety, and driving status—factors that impacted year-2 participation directly or indirectly, and consequently year-2 SWL, forming a complex relationship with year-1 PTE. A sensitivity analysis SEM showed that the number of MH disorders was associated with participation and SWL (p < 0.001), and this combined MH variable was directly related to driving status (p < 0.02). Developing PTE during year-1 after msTBI affects multiple aspects of life. PTE effects extend to motor and cognitive abilities, driving capabilities, and indirectly, to life participation and overall SWL. The implications underscore the crucial need for effective PTE management strategies during the first year post-TBI to minimize the adverse impact on factors influencing multidimensional year-2 participation and SWL outcomes. Addressing transportation barriers is warranted to enhance the well-being of those with PTE and msTBI, emphasizing a holistic approach. Further research is recommended for SEM validation studies, including testing causal inference pathways that might inform future prevention and treatment trials.
Introduction
Traumatic brain injuries (TBIs) are a prevalent condition that significantly impacts individuals. 1,2 In the United States, TBI results in approximately 2.8 million visits to emergency departments annually. 3 Of these cases, around 282,000 necessitate hospitalization, and about 56,000 individuals lose their lives due to TBI. 3 Consequently, the societal expense is estimated at $76.5 billion per year. 4 Post-traumatic epilepsy (PTE)—defined as one or more unprovoked seizures occurring more than 1 week after TBI 5 —occurs commonly after moderate-to-severe (ms)TBI. PTE constitutes ∼4% of focal epilepsy cases in the overall population and is the primary cause of epilepsy in young adults aged 15–24 years. 6
The occurrence of PTE following TBI varies based on injury severity, ranging from 4% for moderate injuries to over 16% for severe injuries. 7,8 Severe head trauma with cortical damage and neurological complications, especially if the dura mater is breached, significantly increases the likelihood of PTE. 9 Late seizures can be delayed but typically manifest within the first few years after the initial injury. 10,11 Approximately 40% of late seizures occur within the first 6 months, 50–60% occur within the first year, and 80% appear within 2 years. The risk of delayed seizures decreases over time, returning to baseline risk after 10–15 years. 7,12 About 86% of individuals having a late post-traumatic seizure will experience a second seizure within 2 years, emphasizing the importance of PTE prevention as well as diagnosing PTE after a single late seizure. 13
A seminal PTE study in the prospective, nationwide observational TBI Model Systems (TBIMS) cohort reported a 16.8% cumulative PTE incidence in the first 2 years post-injury, 8 and additional studies demonstrate PTE contributions to long-term mental health (MH) problems and disability. 5,14 –16 Similar to findings in the general population with epilepsy that psychiatric disorders are the most common comorbid conditions, 16 –18 those with PTE can have more frequent and severe displays of emotional dysregulation (e.g., irritability, agitation, aggression), more severe anxiety, and higher rates of comorbid depression and anxiety than TBI survivors without PTE. 5,14,19 PTE may also exacerbate the deleterious effects of TBI on cognition (particularly memory). 20 The impact of PTE extends beyond TBI survivors to their caregivers, who in one study reported higher caregiver burden associated with cognitive decline, apathy, and disinhibition, versus caregivers of veterans without PTE. 21 The role of PTE in affecting cognitive skills suggests the potential utility of the functional independence measure (FIM), although its specific relevance to PTE remains underresearched.
The FIM was designed to evaluate functional independence across 2 primary dimensions as follows: FIM-motor and FIM cognitive (FIM-Cog). The FIM-motor scale assesses physical functions such as self-care, sphincter control, mobility, and locomotion, whereas the FIM-Cog scale assesses cognitive functions, including communication, social interaction, problem-solving, and memory. FIM-motor and FIM-Cog scores are linked to other functional domains such as participation, social integration, and quality of life. 22 –24 Higher FIM-motor scores are associated with greater independence in physical activities, and higher FIM-Cog scores correlate with better social and cognitive engagement, which in turn positively impact quality of life outcomes. 22,25 –28 Despite the well-documented utility of FIM, there is a relative paucity of data specifically examining associations within the context of PTE. Existing literature primarily focuses on general TBI populations, 29 –32 leaving a gap in understanding the unique challenges and recovery trajectories faced by those with PTE.
PTE both directly (as with driving ability) and indirectly (through MH and cognitive changes) may affect functional, participation, and quality of life (satisfaction with life [SWL]) outcomes post-TBI. Those with seizures are less likely to return to driving post-TBI, 33,34 a highly patient-valued functional outcome. A TBIMS study previously evaluated the independent contribution of driving ability after injury to participation in community-based activities (measured using the Participation Assessment with Recombined Tools, or PART). 35 Even after controlling for age, sex, race, education, FIM, depression, and living alone versus living with others, ability to drive accounted for meaningful variance in participation at 5 years post-TBI. 36 PTE may also contribute to MH conditions and participation restrictions that negatively affect SWL following msTBI. 37
Individuals with msTBI often face a significant decline in life roles making them particularly vulnerable to low or decreasing life satisfaction. However, limited information is available evaluating the potential detrimental effects of PTE following msTBI. Studies suggest that PTE is linked to diminished mental well-being following TBI. 14,38 –43 The onset of PTE is linked to worse functional and psychosocial outcomes within the first 5 years post-TBI. 38 In addition, those with epilepsy report lower life satisfaction and self-rated health than expected, indicating the importance of these factors for their well-being. 44 Adults with epilepsy also have greater frustration versus those without epilepsy, particularly with meaningful accomplishments, social relationships, health, and energy levels. 45,46
Thus, quantifying the impact of PTE on driving ability, and its cascading effects on life participation, is essential. Limited research has examined the broader impact of PTE on outcomes after msTBI, and assessing long-term outcomes at 1 and 2 years following msTBI while accounting for confounding factors impacting outcome is crucial for a comprehensive understanding of PTE. Furthermore, elucidating the interplay between PTE and MH conditions may provide insights into their combined influence on SWL post-TBI. Filling these gaps may facilitate the development of targeted interventions and improve patient care for those with PTE.
Thus, the objective of this study was to generate and fit a conceptual model using structural equation model (SEM) that evaluates the multidimensional and temporal impacts that PTE has on 1- and 2-year outcomes after msTBI. We hypothesized that multiple direct and indirect negative associations between PTE and MH, physical and cognitive impairment, and driving status would influence later participation and SWL outcomes.
Methods
Participants
Our study included 5108 individuals enrolled in the National Institute for Disability, Independent Living, and Rehabilitation Research (NIDILRR)-funded TBIMS National Database injured between 2010 and 2018 with seizure-event data available at year-1 post-TBI. Participants, or legal proxies, provided written informed consent to participate. Each center's institutional review board approved data collection and analyses protocols, with data sharing overseen by the TBIMS National Data and Statistical Center (TBIMS NDSC). Data were gathered using standard TBIMS NDSC procedures. 99 Among this cohort, there were N = 1003 subjects with complete data on outcomes and covariates (Fig. 1). Variation in missingness was multifactorial, but largely driven by limitations in when specific tests of depression and anxiety were implemented. Covariate distribution is presented in Supplementary Table S1 as a sensitivity analysis of covariate missingness in the sample. There is a significant difference between the included and not included samples in year-2 participation and year-2 SWL. When evaluating the mean and median values, they are similar between the samples; their standard deviations are also similar. However, due to large class imbalance (N = 1003 included and N = 211 not included), the standard error for the mean differs considerably, indicating that the differences observed are likely due to class imbalance. Supplementary Table S2 presents the comparison of the analytic SEM cohort with N = 1003 subjects with the N = 5108 − 1003 = 4105 cohort that was not included in the analytic SEM due to outcome and covariate missingness. FIM scores, driving status, participation, employability (using the Disability Rating Scale (DRS) subscale), substance misuse, age, and residence had somewhat different distributions between these cohorts.
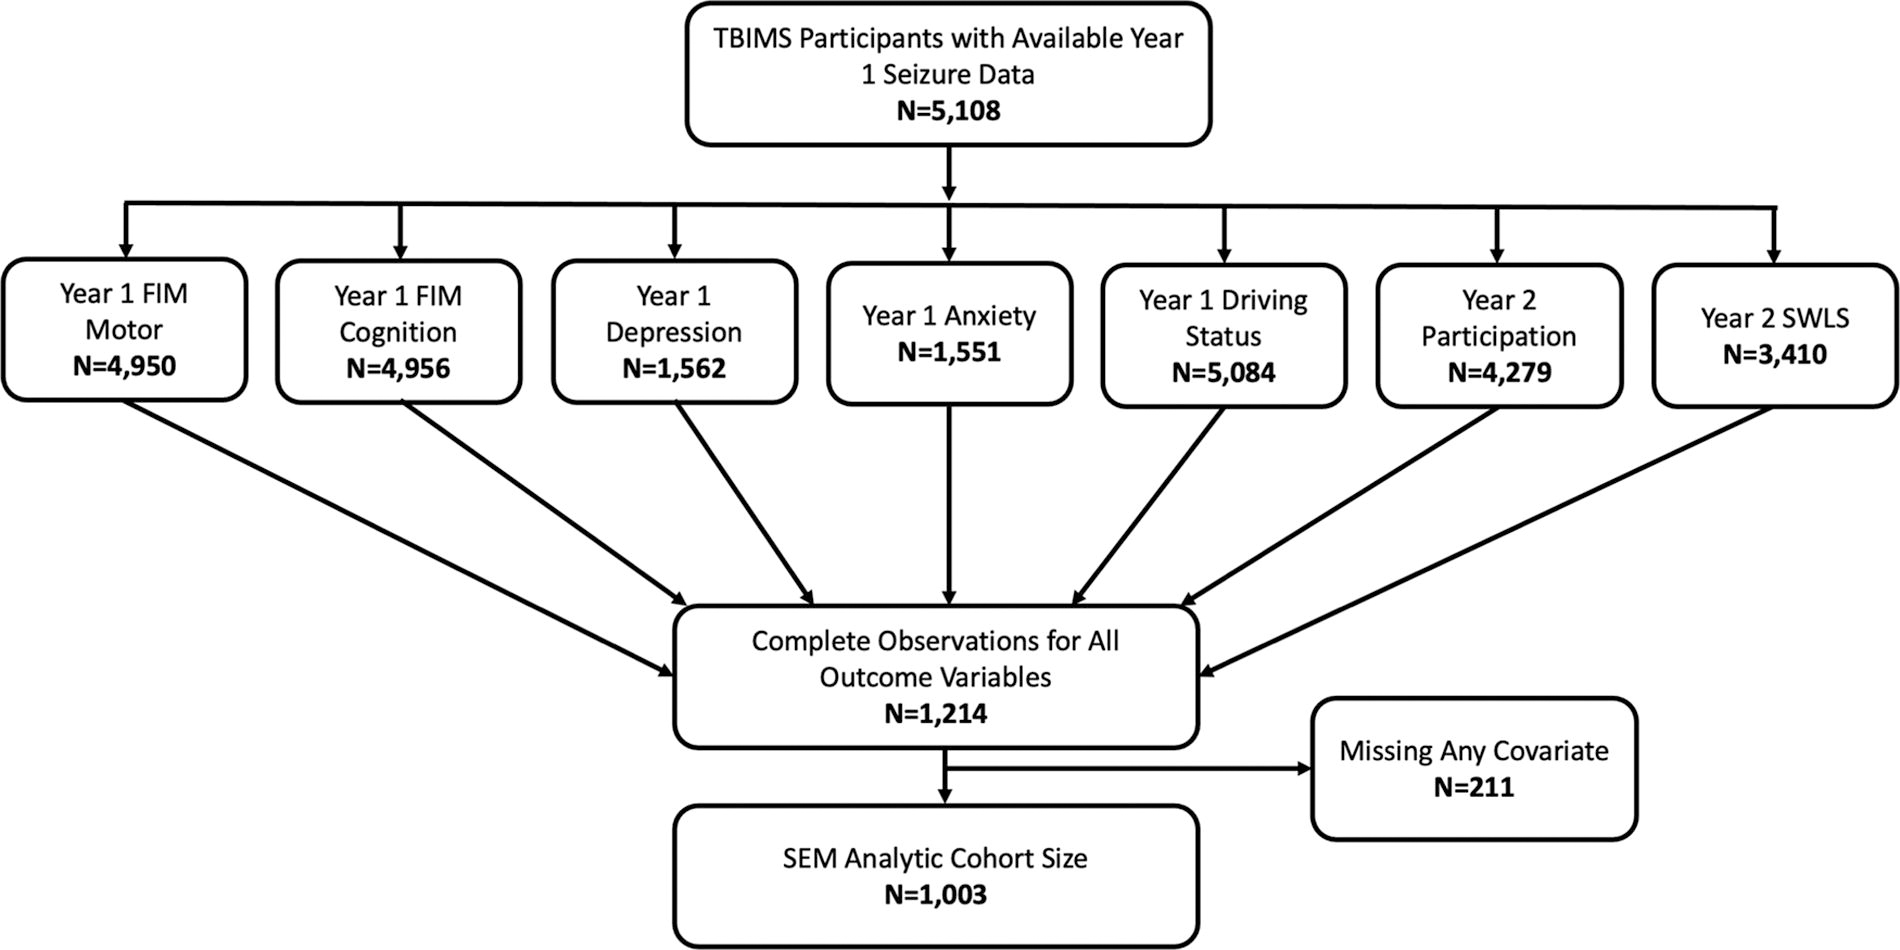
Structural equation model (SEM) cohort derivation diagram.
Each TBIMS center is affiliated with one or more Level 1 trauma centers and gathers data spanning acute hospitalization through inpatient rehabilitation. The TBIMS centers enroll individuals (≥16 years) with msTBI—defined as post-traumatic amnesia (PTA) >24 h, positive computed tomography scan findings, or a Glasgow Coma Scale (GCS) score <13—who present to a TBIMS acute care hospital within 72 h of injury and receive inpatient rehabilitation from a designated TBIMS rehabilitation hospital. Participants are interviewed at years 1, 2, and 5 and every subsequent 5 years post-TBI until death. Data for our main measures were collected during the 1- and 2-year follow-up periods.
Data collection
Data were gathered using standard operating procedures outlined by the TBIMS National Data and Statistical Center. 47,48 Self-reported measures were collected directly from participants or from a designated proxy if participants were unable to participate in an interview. Baseline data (i.e., pre-injury history, injury characteristics, acute care, and rehabilitation hospitalization) were collected through medical record review and participant/proxy interview. Follow-up data were collected via telephone, in-person interview, or mailed questionnaires.
Baseline variables
The following demographic and clinical variables were used as covariates: age, sex (self-reported male or female), years of education, residence (private home vs. health care setting or other), TBI severity (severe for GCS scores <9, PTA >1 week, or inability to follow verbal commands >1 day post-TBI vs. moderate), employability (not restricted/competitive vs. noncompetitive/not employable) as defined by the DRS, 49 and substance misuse (yes vs. no). When adjusting for follow-up variables such as residence, employability, and substance misuse in the SEM, we used the year-specific data as confounders (i.e., year-1 variables while modeling year-1 outcomes and year-2 variable while modeling year-2 outcomes).
Year-1 variables
Data collectors asked participants to self-report, or caregivers to proxy report (as yes/no), whether they had experienced a seizure over the year since rehabilitation discharge. Driving status was categorized as driving independently versus not (if participant had specialized or personal transportation, took public transit, or had no motorized transportation).
The FIM is a tool used in rehabilitation that assesses a patient’s functional independence through the following two components: FIM-motor and FIM-Cog. The FIM-motor component evaluates physical and self-care activities, such as eating, dressing, and mobility, whereas the FIM-Cog component assesses cognitive functions, including communication, social interaction, and memory. The FIM score is derived by summing the scores from the motor and cognitive subscales, yielding a total score that ranges from 18 to 126, with higher scores indicating greater functional independence. 50,51 Together, these scores offer a comprehensive view of a patient’s rehabilitation needs and progress. Ratings were based on the poorest performance over a 72-h assessment period. The distribution of both FIM motor and cognition subscales was left skewed, and Rasch adjustment was not sufficient to meet statistical assumptions for normally distributed data for use with linear regression. 52 –54 Hence, both subscales were categorized as independent versus dependent. Participants were classified as being independent if their FIM scores showed them, on average, to be either independent or modified independent across all items for each subscale. 22
Depression status was calculated using the Patient Health Questionnaire-9 (PHQ-9)—derived from 9 Diagnostic and Statistical Manual-IV (DSM-IV) criteria for major depressive disorder (MDD). 55 The PHQ-9 was not introduced to the TBIMS data collection protocol until October 2017, and the instrument documents multiple self-reported symptoms in the prior 2 weeks as follows: anhedonia, depressed mood, sleep disturbance, fatigue/low energy, appetite changes, worthlessness or guilt, concentration problems, psychomotor changes, and suicide ideation. Each of these are scored as 0 (not at all), 1 (several days), 2 (more than half the days), or 3 (nearly every day). Consistent with DSM-IV criteria for MDD and adapted for TBI participants were considered to have post-traumatic depression if they endorsed at least five symptoms “more than half the days” (suicidal ideation could be “several days”), with at least one endorsed symptom as either anhedonia or depressed mood. 56
Anxiety status was derived from the Generalized Anxiety Disorder-7 (GAD-7) scale and was not introduced to the TBIMS data collection protocol until October 2017. The distribution of the scale was right skewed and hence grouped into four categories in a manner consistent with the literature: 0–4: minimal anxiety, 5–9: mild anxiety, 10–14: moderate anxiety, and 15–21: severe anxiety. 57
The cumulative impact of multiple MH conditions (i.e., depression and anxiety) was evaluated in a sensitivity analysis by creating an ordinal variable differentiating between those with neither condition, those with one of the conditions, or those with both conditions as outlined previously by Juengst et al. 14
Year-2 variables
Participation was measured using the summary statistic of PART-Objective (PART-O), an averaged total score, equating to the sum of the 3 PART subscale scores divided by 3. 58 The PART-O is a measure of societal-level functioning. It is used to evaluate long-term outcomes and assess intervention effectiveness in enhancing social and societal functioning. SWL was quantified using the satisfaction with life scale (SWLS) 59 —a 5-item scale designed to measure the cognitive judgments of the participants’ satisfaction about life. Participants indicated agreement or disagreement with each of the 5 items using a 7-point scale ranging from 7 (strongly agree) to 1 (strongly disagree).
Analysis methods
A temporal SEM was developed to evaluate PTE relationships with long-term (year-2) participation and SWL using year-1 FIM (motor, cognition), MH variables (depression, anxiety), and driving status as possible mediators, while adjusting for age, sex, years of education, employability, residence, substance misuse, and TBI severity using the following conceptual diagram generated by the author team prior to analyses (Fig. 2).
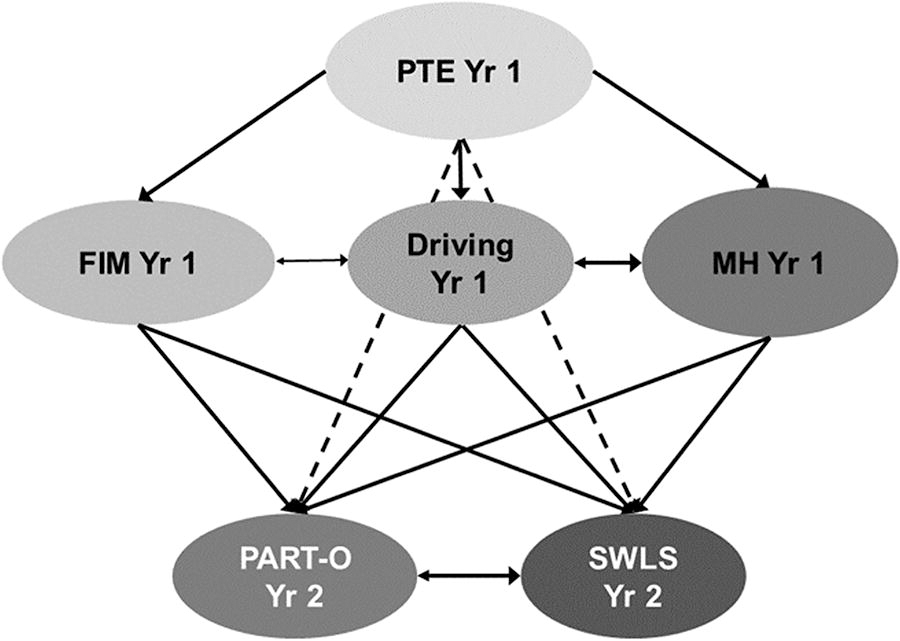
Initial assessment plan conceptualization (before analysis): Temporal relationships with post-traumatic epilepsy (PTE) relevant outcomes. Covariate adjusted: education, age, residential status, injury severity, sex, substance abuse year 1/year 2, and employability. Dotted lines represent indirect effects.
Univariate regressions were initially performed to observe the cross-sectional relationships between each of the variables, and pre-SEM multivariable regressions (adjusting only for the main outcome variables of interest) were completed to determine possible mediation effects and the paths to be tested in the SEM. All pre-SEM regressions utilized the full sample size, including all complete observations for the variables involved, as it is standard practice to test initial relationships using as much data as possible to ensure that those tested in the full-scale SEM are the most promising. Linear regressions were conducted for continuous outcomes (e.g., SWL and PART-O) and binary logistic regression for dichotomous outcomes (e.g., driving status, FIM-motor, FIM-Cog, depression, and anxiety). The regressions presented tested associations for both the concurrent (year-1 outcomes vs. year-1 predictors) and temporal (year-2 SWL and PART-O vs. year-1 predictors) relationships hypothesized.
SEM can simultaneously analyze multiple, temporally dependent relationships while accounting for the residual covariances among the variables of interest, which overcomes the shortcoming of regular regression in the presence of complex correlational structure in the data. 60 In this study, we modeled multiple covariance structures to obtain a more refined relationship of PTE with other outcome variables. As the goal of this study was to understand the effect of PTE on these primary outcome variables, we tested the PTE relationship to each of the outcome variables in the SEM, irrespective of its significance in the multivariable regressions. However, other nonsignificant relationships in multivariate regression were dropped to simplify the model.
Since we had a mix of continuous and categorical variables included in the SEM, we used a diagonally weighted least squares (DWLS) method of estimation with a NLMINB optimizer (NLMINB: nonlinear minimization subject to box constraints). 61 The root mean square error of approximation (RMSEA), standardized root mean square residual (SRMR), comparative fit index (CFI), and Tucker–Lewis index (TLI) were observed to test the SEM fit. The recommended CFI and TLI values are usually ≥0.95, and the suggested values for RMSEA and SRMR are typically ≤0.05. 62 Values of standardized path coefficients (βstd) >0.50 indicate a large effect, 0.30 a medium effect, and 0.10 a small effect. 63 We presented standardized β’s (βstd) in the Results section to compare effect sizes across the relationships tested. We conducted the SEM analyses in R (version 3.2.5), using the lavaan package (version 0.5-23.1097). 64
Results
Univariate regression
The univariate regression results for the main outcome variables of interest (SWLS, PART-O, driving status, FIM-motor, FIM-Cog, depression, anxiety), stratified by PTE, are presented in Table 1. Building a full SEM with all paths can result in unstable coefficients due to limitations stemming from the available degrees of freedom per coefficient and the complex error covariance structure. Univariate regressions demonstrated that almost every variable of interest is related to every other variable, either directly or indirectly, indicating that a complex correlation structure (covariance) is present in the data.
Univariate Regressions of the Main Variables of Interest
FIM, functional independence measure; SWLS, satisfaction with life scale; PART-O, participation assessment with recombined tools-objective; OR, odds ratio; CI, confidence interval; SE, standard error.
To address this correlational structure, and simplify our SEM, we next used multivariate regression to account for possible mediation effects to understand which paths should be tested in the SEM and whether to model the associations as covariances or regressions to appropriately represent the relationships.
Multivariate regression
The multivariable regression results for both concurrent (year-1 outcomes regressed on year-1 predictors) and temporal (year-2 SWLS and PART-O regressed on year-1 predictors) associations are presented in Table 2. This table contains a regression coefficient for each endogenous variable while adjusting for all other main variables of interest (not adjusted for covariates such as age, sex, race, education, and so on). These models are more refined than the univariate models presented in Table 1. The purpose of these models was to understand the paths (indicating both regression and covariance paths) that should be tested in the SEM, where each path of the SEM would be adjusted for all covariates.
Multivariable Regressions of the Main Variables of Interest (pre-SEM Regressions)
SEM, structural equation model; FIM, functional independence measure; SWLS, satisfaction with life scale; PART-O, participation assessment with recombined tools-objective; OR, odds ratio; CI, confidence interval; SE, standard error.
In Table 2, we show that unlike the unadjusted models in Table 1, year-1 PTE is only a significant predictor of year-1 driving status when adjusting for other variables. From Table 2, we also observed that anxiety and depression have no significant relationship to FIM-motor scores; the FIM-motor subscale, in contrast, was not a significant predictor of depression or anxiety when modeled with other variables of interest.
However, FIM scores, depression, and anxiety showed strong relationships with each other, indicating that a covariance should be modeled for each of these relationships in the SEM. Depression and anxiety were significant predictors of FIM-Cog, and FIM-Cog was also a significant predictor of depression and anxiety, suggesting that pairwise covariances exist among these three variables and should be included in the SEM. Anxiety was also associated with driving status independent of other variables, but driving status was not associated with concurrent anxiety status, indicating a unidirectional regression path in the SEM. Conversely, depression was not associated with driving status, and driving also did not explain concurrent depression status, suggesting that these regression paths could be dropped from the SEM.
Relationships to year-2 PART-O and SWLS are also presented in Table 2. Anxiety at year 1 was not a significant predictor of year-2 PART-O, and year-1 FIM-Cog was not a significant predictor of year-2 SWLS. Thus, we also dropped these paths from the planned SEM. Considering the logical flow of these multivariable regressions, we constructed and tested all the paths presented in Figure 3, which we refer to as the SEM path diagram.
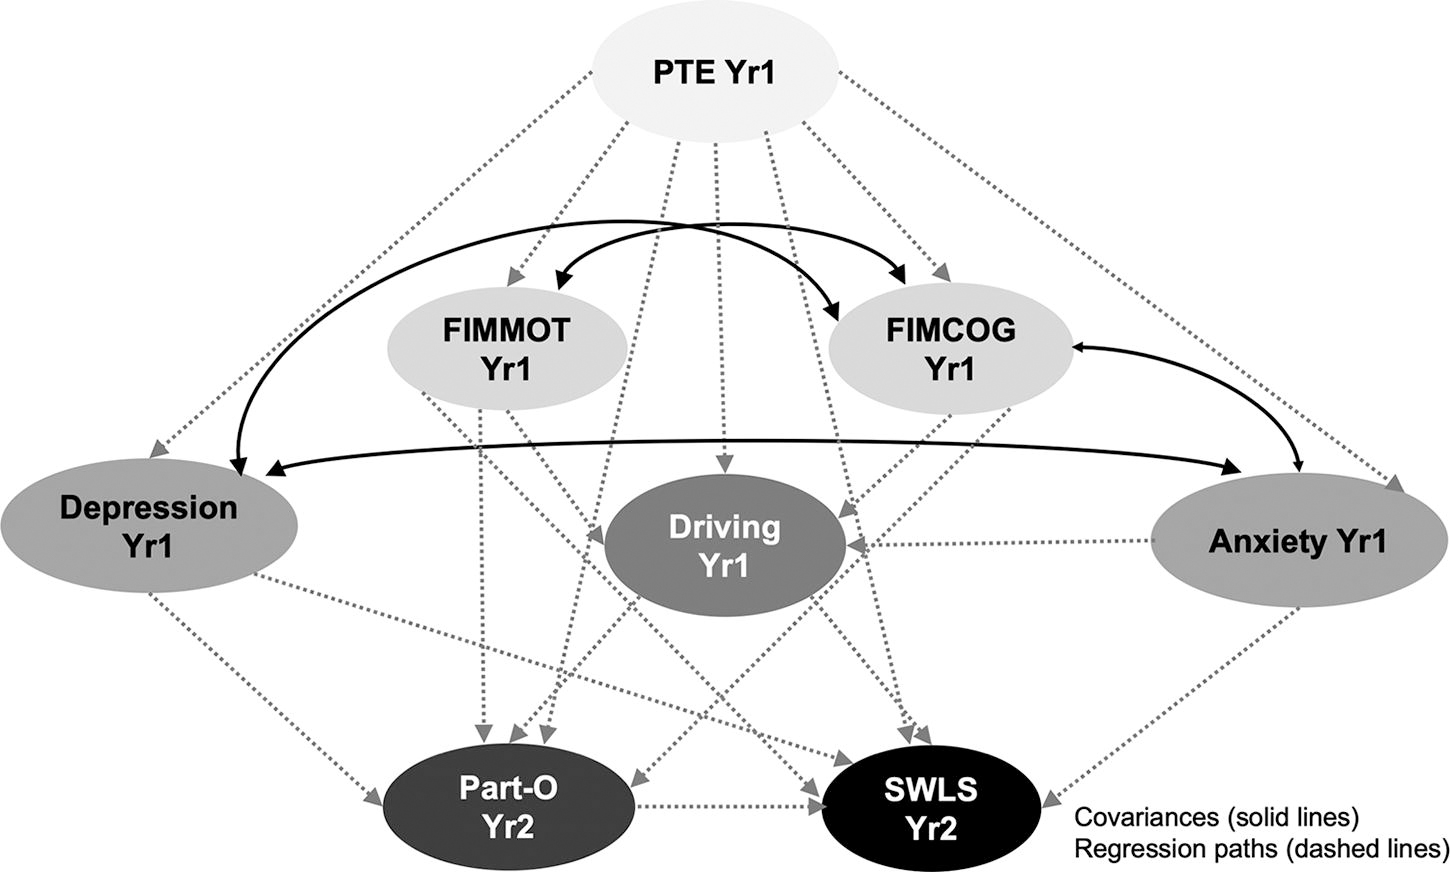
Conceptual path diagram for the proposed structural equation model (SEM) is based on multivariable regressions (solid lines) and hypothesized covariance (dashed lines) relationships. The inclusion of paths and their directional associations were informed by a series of multivariable regressions (Table 2).
SEM development
The SEM formulated from the relationships observed in Table 2 represents a highly complex system represented by the conceptual path diagram (Fig. 3), and the SEM generated with n = 1003 complete observations had overall satisfactory model fits (Fig 4). The CFI and TLI were 0.949 and 0.955, respectively. The RMSEA and SRMR were 0.064 and 0.097, respectively.
The SEM (Fig. 3) was adjusted for age, sex, years of education, residence, TBI severity, employability, and substance misuse. The paths significant at 5% and 10% levels are presented by solid and dotted lines, respectively. Standardized β (βstd) coefficients are presented to compare effect sizes across the various relationships tested with the SEM. Year-1 PTE was associated with year-1 FIM-motor (βstd = −0.112, p = 0.007) and marginally associated with year-1 FIM-Cog (βstd = −0.070, p = 0.079). PTE associations with FIM subscales were more prominent when tested in SEM compared with the multivariable regressions (Table 2), which may be due to covariance adjustment when generating the SEM. Year-1 FIM-motor and -Cog had a highly significant covariance (βstd = 0.406, p < 0.001). The covariance between year-1 depression and anxiety was even stronger (βstd = 0.844, p < 0.001). Year-1 FIM-Cog also had strong covariances with both year-1 depression (βstd = −0.386, p < 0.001) and anxiety (βstd = −0.396, p < 0.001). Those with PTE at year 1 were less likely to drive independently at 1 year (βstd = −0.148, p < 0.001), as were those with higher anxiety levels at 1 year (βstd = −0.135, p = 0.024). Participants with independent or modified-independent motor (βstd = 0.323, p < 0.001) and cognitive (βstd = 0.181, p = 0.012) FIM scores at 1 year were more likely to drive at year 1. PTE was not independently related to year-1 depression, anxiety, PART-O, or SWLS; however, PTE had an indirect link with these variables via its associations with FIM subscales.
The temporal relationships of year-2 PART-O and SWLS with the year-1 variables, when adjusting for covariates, showed that participants with depression at year 1 were also less likely to have higher scores in the year-2 PART-O scale (βstd = −0.322, p = 0.011) and SWLS (βstd = −0.382, p = 0.001). However, participants with independent or modified-independent motor function in year 1 were more likely to have higher scores on the year-2 PART-O scale (βstd = 0.186, p = 0.003) and SWLS (βstd = 0.189, p = 0.003). Participants who drove independently at year 1 had higher PART-O scores in year 2 (βstd = 0.233, p < 0.001), and higher year-2 PART-O scores were associated with higher year-2 SWLS (βstd = 0.160, p < 0.001). Although difficult to quantify given the complexity of SEM, these results indicate that FIM and driving status at year 1 may mediate PTE associations with SWLS. All SEM path coefficients (covariances and regression paths) are presented in Table 3.
Coefficients of the SEM
SEM, structural equation model; TBI, traumatic brain injury; FIM, functional independence measure; SWLS, satisfaction with life scale; PART-O, participation assessment with recombined tools-objective; SE, standard error.
As a sensitivity analysis, we performed an additional SEM analysis combining depression and anxiety into a single variable to capture their shared symptomatology and frequent comorbidity (Fig. 5). Among the SEM analytic cohort of N = 1003, 817 (81.5%) participants had no depression or anxiety, whereas 36 (3.6%) had depression only, 61 (6.1%) had anxiety only, and 89 (8.9%) had both depression and anxiety. The results showed that the associations between this combined MH variable and FIM-Cog had standardized β weights very similar to those observed when depression and anxiety were modeled separately. However, when modeling the associations of the combined MH variable with PART-O and SWLS, the β weights of the combined variable (Fig. 5) were modestly diminished for PART-O and SWLS compared with those of depression alone (Fig. 4). In addition, the distinct effect of anxiety on driving status observed in Figure 4, was not distinguishable in the combined model (Fig. 5), limiting the granularity of interpretation. Notably, with this ordinal MH variable structure, there is a direct relationship between increasing number of MH conditions and reduced likelihood to drive, suggesting a cumulative impact of MH conditions on driving status, which then indirectly impacted participation and life satisfaction. Direct associations between the number of MH conditions and participation, as well as life satisfaction, were also noted.
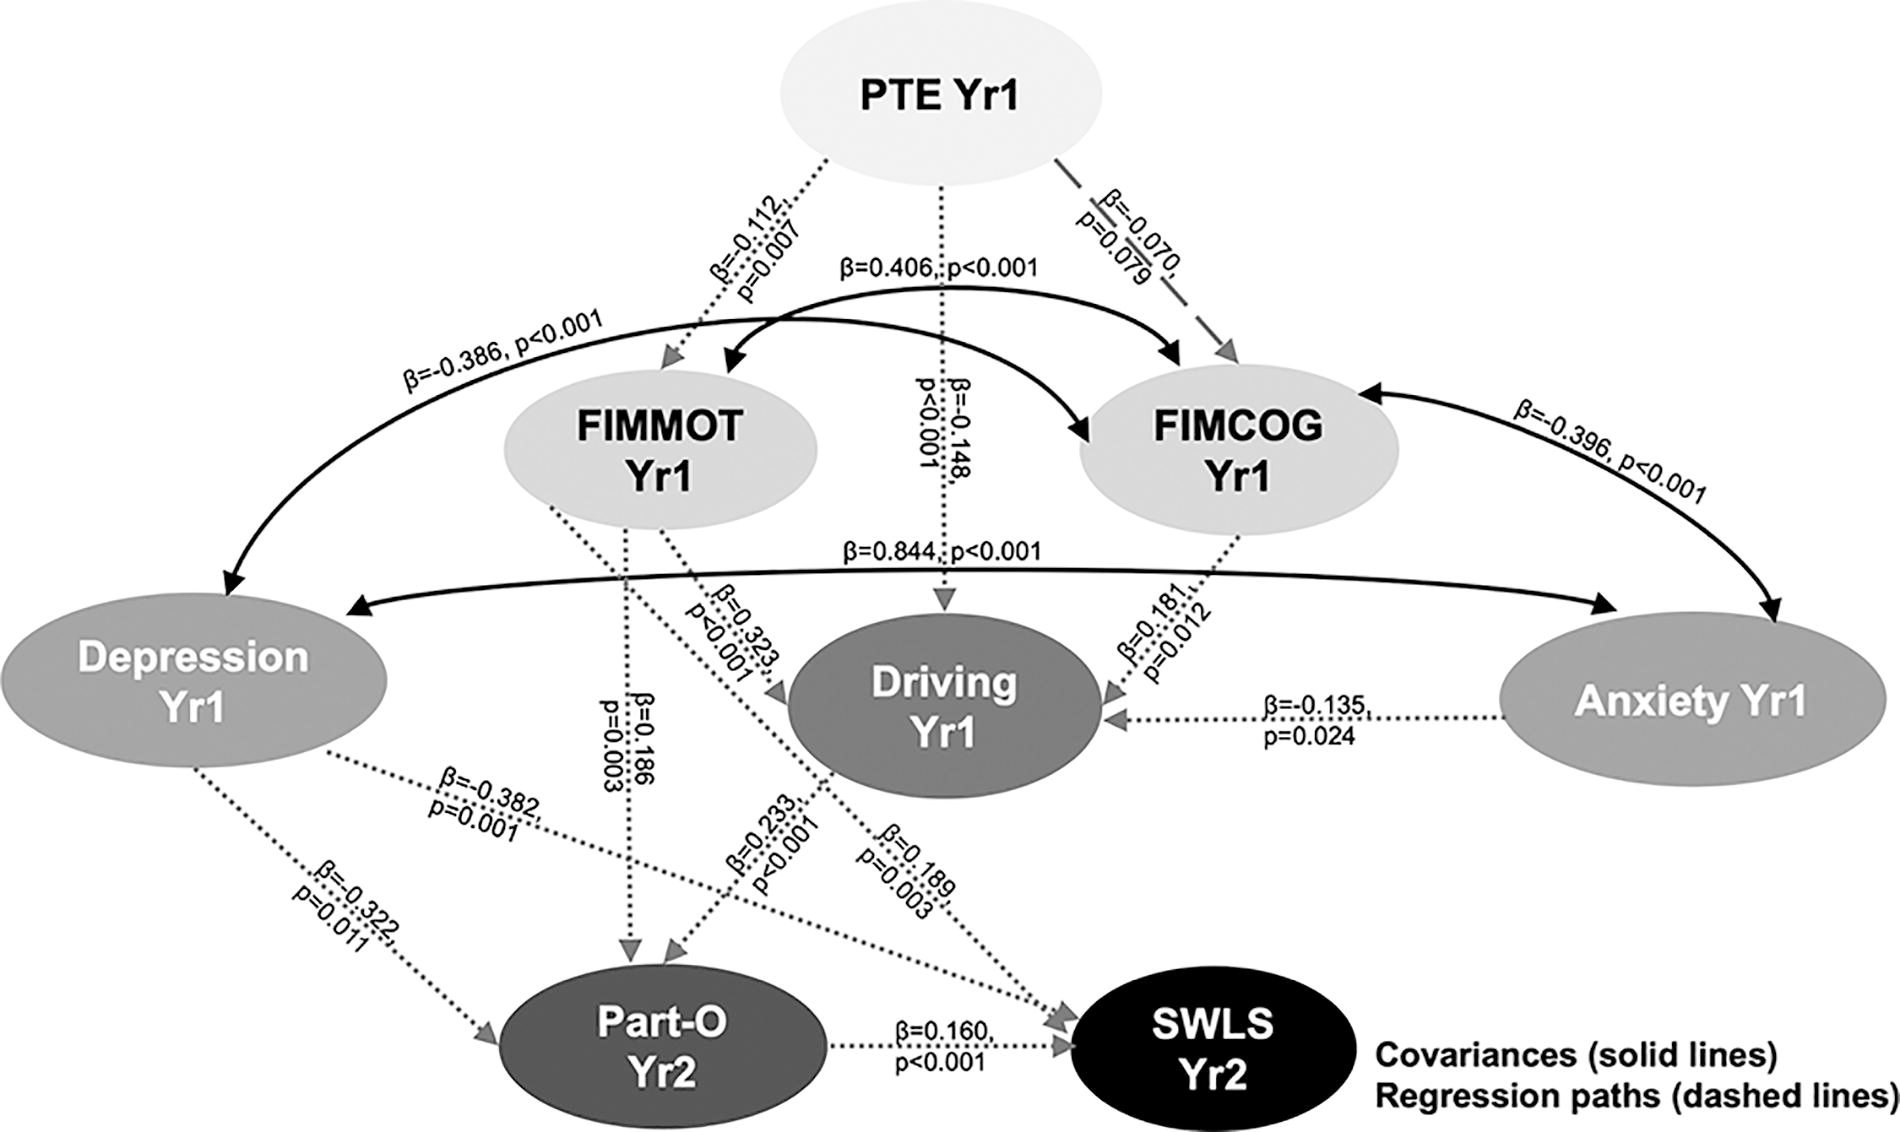
Summary results of the fitted structural equation model (SEM) with depression and anxiety modeled separately. Bidirectional arrows indicate covariance paths (where both variables covary), and unidirectional arrows indicate regression paths (where the outcome changes due to the change in the predictor). Dashed lines indicate at least trend level associations (p < 0.1).

Summary results of the fitted structural equation model (SEM) combining depression and anxiety. Bidirectional arrows indicate covariance paths (where both variables covary), and unidirectional arrows indicate regression paths (where the outcome changes due to the change in the predictor). Dashed lines indicate at least trend level associations (p < 0.1).
Discussion
This study explored the complex pathways by which PTE development within the first year after TBI might impact SWL and social participation while considering motor and cognitive dysfunctions, driving status, and MH disorders such as depression and anxiety. SEM allowed us to analyze multiple relationships simultaneously, addressing the complex interdependencies and temporal aspects in the data. Its suitability for handling diverse variable types was validated using DWLS with a NLMINB optimizer. Together, these findings underscore an intricacy of relationships among injury-related factors, functional abilities, MH, driving status, and subsequent outcomes in participation and SWL over time following msTBI. The CFI and TLI aligned with the typical guidelines regarding goodness of fit, whereas the RMSEA and SRMR slightly exceeded the suggested thresholds. However, when taken together, the fit indices suggest that the SEM constructed was satisfactory in modeling these complex relationships, especially given the simultaneous estimation of numerous paths/coefficients.
Year-1 PTE demonstrated a strong link with year-1 FIM-motor scores, while only demonstrating a marginal association with FIM-Cog. This SEM demonstrated more pronounced relationships between PTE and FIM subscales than what were reported using preliminary multivariable regressions, emphasizing the importance of considering these complex interrelationships together using SEM. Participants with PTE were less likely to drive independently at year 1, whereas those with better FIM scores were more likely to do so. Strong (bidirectional) covariance relationships were evident between FIM-motor and FIM-Cog, as well as between depression and anxiety at year 1. Despite lacking direct links, PTE indirectly influenced anxiety, participation, and SWL through its associations with FIM subscales. Year-1 depression significantly contributed to lower participation and SWL scores in year 2, whereas better motor function at year 1 directly contributed to higher year-2 participation and SWL scores. Furthermore, independent driving at year 1 directly impacted year-2 SWL, as well as indirectly contributed to higher year-2 SWL scores, via associations with year-2 participation.
Findings were generally consistent with the literature to date and suggest that PTE significantly impacts SWL for persons with TBI. Functional deficits, psychological health challenges, and overall diminished well-being is highest among those with treatment-resistant PTE compared with those with idiopathic epilepsy and/or is controlled. 5,14 –16,65 Comorbid PTE following msTBI can be broadly understood by examining its intersections within the International Classification of Functioning, Disability, and Health (ICF) framework. 66,67 Mapping the primary relationships to the ICF framework highlights the multidimensional impact that PTE exerts on an individual’s overall functioning and well-being. The study findings illustrate how PTE affects various components of the ICF as follows: body functions and structures (motor and cognitive abilities), activities (driving independence), participation (life engagement), environmental factors (regulations and restrictions around driving), and personal factors (MH status). Importantly, the correlations between year-1 PTE and diminished functional independence, alongside FIM associations with anxiety, and restricted driving capabilities, demonstrate the interdependence of these ICF domains. These interactions illustrate how PTE permeates multiple layers of functioning and disability to impact an individual’s engagement in daily life and societal roles. After TBI, individuals returning to their communities need to adapt to substantial life alterations and reconstructing their sense of self. PTE exacerbates the already challenging impacts of msTBI and can further impede the process of societal reintegration. 68 –71 PTE onset, often months or years after the initial injury, frequently disrupts earlier progress toward recovery, and PTE presents as a significant obstacle that impacts autonomy, employment prospects, leisure activities, mental well-being, and safety. Thus, PTE management requires a multidimensional approach that considers both medical interventions and environmental modifications, MH support, and strategies to facilitate societal participation, aligning with the holistic tenets of the ICF framework.
In the complex landscape of maximizing clinical outcome post-TBI, identifying effective PTE treatments plays a key role in facilitating seizure management and preventing/mitigating other PTE sequelae. This critical goal affects the broader management goals of preventing cognitive changes, enhancing life participation, and improving overall SWL. PTE associations with patient outcomes may be influenced by the PTE itself, the medications required for its management, or a combination of both. 72,73 Antiseizure medication (ASM) administration for PTE may give rise to adverse effects on cognitive functions, mood, and behavior that influence these broader outcome constructs. 74 –76 Research by Raymont et al. showed this correlation by emphasizing how PTE serves as a predictor for overall cognitive capacity with a decrease in intelligence quotient scores among individuals affected by PTE. 77 In addition, the duration, frequency, and severity of PTE, including the shift from focal unaware seizures to focal to bilateral tonic–clonic seizures, also contributed to substantial cognitive deterioration. 77 In a prospective cohort study of 3044 participants with TBI, a 2.8% incidence of self-reported PTE was independently associated with significantly lower Glasgow Outcome Scale Extended scores, higher Brief Symptom Inventory-18 scores, and elevated Rivermead Cognitive Metric scores at 12 months post-injury. 78 Yet, Haltiner et al. demonstrated no significant differences in 12-month outcomes based on seizure presence when controlling for injury severity. Taken together, these findings may suggest that observed worse outcomes may be attributed to the brain injury effects causing seizures rather than the seizures themselves. 79
PTE was correlated with lower FIM scores. The primary cognitive consequences of ASM use include diminished attention, vigilance, and psychomotor speed. 74,76,80,81 Further, changes in psychomotor speed and motor function 82 can affect FIM-motor scores, potentially impacting the ability to drive even when PTE is otherwise well-controlled. Despite the challenges involved with ASM treatment, effective seizure control can enhance cognitive function and patients’ well-being. 65 Assessing a patient’s cognitive state and psychomotor status before and during treatment initiation may aid in monitoring disease progression, as well as treatment effectiveness, medication side effects, 80,83,84 and effects on participation and SWL. 85 –87
In addition, higher FIM-motor and -Cog scores observed at year 1 were linked to independent driving, fostering positive effects on participation and SWL at year 2. Kolakowsky‐Hayner et al. examined the long-term effects of PTE in individuals 5–13 years post-TBI. 88 About half of 25 participants had suspended licenses, or abstained from driving, whereas some with licenses experienced seizures. Many faced limitations in social activities, particularly with respect to occupation and social integration. 88 Driving restrictions and poor seizure control are likely primary drivers for these findings. 88 Nonetheless, these challenges underscore the importance of comprehensive care and support systems for individuals navigating epilepsy after TBI and barriers to their transportation/driving needs, 89 including potential anxiety that may be keeping people from returning to driving. Anxiety and depression were significantly related to year-1 FIM-Cog, a factor impacting driving in our main model. Our sensitivity analysis suggests a cumulative direct impact of the number of MH conditions on driving. However, the unique contribution of anxiety to driving status was indistinguishable using this combined MH construct.
Anxiety is a common comorbidity affecting individuals with epilepsy, often exacerbating the challenges associated with driving. 90 Anxiety impairs cognitive functions and reaction times, which are critical for safe driving. 91 In addition, the fear of having seizures can further heighten anxiety levels, leading to avoidance behaviors and reduced driving participation. 92 The interplay between anxiety, FIM-Cog, and PTE significantly affects driving ability, thereby impacting overall functional independence, which has downstream impacts on life role participation and satisfaction.
Considering the distinct pathological dynamics between PTE and msTBI and their potential impact on SWL, there is a pressing need for future research priorities to delve into the functional and SWL outcomes observed after PTE. The literature highlights a noticeable correlation at 1-year post-injury, 78,79 indicating a complex interplay between seizure-induced neuronal activity, ongoing damage, ASM side effects, and initial injury burden, which likely exacerbates cognitive and neuropsychological impairments. Thus, future research priorities should investigate causal links between PTE and cognitive decline using blood biomarkers and neuroimaging techniques. The impact of ASMs on cognitive and neuropsychological function may complicate the identification of causal relationships between PTE and other outcomes. 93,94
However, this report increases our understanding of the multidimensional pathways between msTBI and their impact on both secondary conditions like PTE and functional outcomes, which may facilitate the development of effective treatment and prevention strategies. Biomarker-based investigations may inform the interplay between msTBI, PTE, and functional outcomes and may help uncover the biological basis for specific mechanisms and risk factors to support precision medicine treatment and strategies that reduce comorbidity burden and improve function, participation, and life quality. Finally, SEM validation against independent datasets will be important to mitigate model misspecification and quantify causal effects that may inform treatment trial design. Evaluating SEM performance with new independent cohorts that include depression/anxiety data will help refine and validate findings.
Limitations
While this study informs the complex connections between msTBI, PTE, functional outcomes, and MH, we also acknowledge several limitations. Our study focused solely on individuals with msTBI admitted to acute rehabilitation. Although the TBIMS national cohort is reportedly generalizable to the larger population admitted to acute rehabilitation, 95 the findings observed with the cohort may still have restricted applicability to those with PTE who do not meet the admission requirements for inpatient rehabilitation. The temporal nature of the study might not fully capture the dynamic changes in these variables within our 2-year monitoring period and over more extended periods. In addition, the limited sample with complete MH data limited power to detect smaller effect sizes between MH variables and PTE.
Our study is significantly limited by the absence of medication data, which hinders our understanding of how ASMs impact MH, as well as cognitive and motor function, which are key effectors of driving, participation, and SWL. While the SEM demonstrated favorable fit statistics with CFI and TLI, generally meeting the suggested criterion, the RMSEA and SRMR slightly exceeded the recommended 0.05 threshold. These fit indices indicate a generally acceptable model fit, but the slight deviations from the ideal thresholds may highlight potential limitations in the model’s precise representation of the tested relationships. Despite these encouraging fit indices, it is crucial to acknowledge limitations inherent to using an SEM approach. SEM’s sensitivity to sample size, particularly in complex models with mixed continuous-categorical variables, warrants caution in generalizing our findings. This is particularly pertinent given the imbalanced nature of our dataset, with only 12% of the sample having PTE, and the use of binary variables such as depression (yes/no). Binary variables typically require larger sample sizes to achieve stable estimates, adding another layer of complexity. However, this concern is mitigated by the robustness of the model, demonstrated through the analysis of fit indices derived from 1003 complete observations. While our model effectively captures multiple temporally dependent relationships, model complexity, coupled with the sample imbalance of those with versus without PTE, raises concerns about potential model misspecification and emphasizes the need for model validation in future work.
Conclusions
PTE in the first year after msTBI is directly and/or indirectly associated with many aspects of life, including driving ability, MH, and cognitive and motor skills, all influencing overall well-being. Managing PTE effectively during the first year after TBI, but perhaps also if seizures occur later, is crucial to prevent long-term negative effects. SEM revealed the temporal dynamics between PTE, functional outcomes, and SWL, emphasizing the need for integrated treatment approaches targeting epilepsy management alongside rehabilitation efforts. By integrating SEM results with biological data (e.g., neuroimaging or genetic markers) associated with epilepsy and TBI, personalized interventions may optimize long-term outcomes for individuals with PTE. Further research and validation studies are needed to explore these relationships and develop evidence-based interventions. A holistic approach to future work, one that considers medical, societal, and environmental factors that affect function in the setting of PTE, is necessary to improve the lives of individuals with PTE and msTBI.
Transparency, Rigor, and Reproducibility Statement
Study registration
This study is a part of the NIDILRR funded TBI Model Systems (TBIMS) Project and was not formally registered before implementation.
Analytic plan specification
While the analysis plan was not formally preregistered, the team members (A.K.W. and N.A.) with primary responsibility for the analysis certify that the analysis plan was prespecified.
Statistical power and sample size
A sample size of 1003 subjects with complete data was utilized for this study from the NIDILRR TBIMS database. Although determining the required sample size for a complex SEM is difficult, because of its relatedness to mediation models, we based our power analysis on a single mediator model for simplicity. The power of a single mediator model depends on the effect of the independent variable on the mediator (commonly denoted as α) and the effect of the mediator on the dependent variable (β), controlling for the independent variable. Based on preliminary data, we expected α to be medium-to-large and β to be small-to-medium, using Cohen’s criteria. Based on the simulation study by Fritz et al., the minimum sample size needed to detect the mediation effect in this case was 391. 96 Hair et al. provide practical guidelines for SEM, noting that as model complexity increases, the sample size should also increase. They recommend that for complex models a sample size of at least 300 is advisable, with larger samples often needed for more intricate models. 97 Westland provides formulas for determining minimum sample sizes based on model complexity. His work supports the need for larger samples (300–500 or more) for complex SEMs to achieve adequate power and model stability. 98 Based on these criteria for sample size estimation, we had adequate power to conduct these analyses.
Cohort derivation
Participants whose data were collected by the TBIMS network were used for analysis if they: (1) had msTBI, (2) had outcomes data collected between 2010 and 2018, (3) had a seizure event recorded during that time frame, and (4) had complete outcome and covariate data available. Using these inclusion criteria, a total of 5108 patients were screened. A total of 1215 subjects had complete observations for all outcome variables. Subjects totaling to 211 were missing at least one covariate, leaving data for 1003 participants to be used in the cohort.
Investigator blinding
Data collection was performed by research staff who were blinded to participant characteristics relevant to this study. Data analyses were performed by investigators who were aware of relevant participant characteristics; however, data analyses were performed on data without the use of patient identifiers.
Data acquisition, analysis, and assessment tools
The key inclusion criteria (e.g., primary diagnosis or prognostic factor) are established standards in the field. Data were collected using validated clinical tools as follows: FIM, PHQ-9, GAD-7, PART, and SWLS. Data were analyzed using a covariate-adjusted SEM, using the lavaan package (R). Four standard fit indices were used to assess goodness of fit for the SEM generated. All models are reported in the publication text. All equipment and software used to perform acquisition and analysis are widely available from The R Project for Statistical Computing.
Statistical assumptions, analysis, and multiple comparisons
Statistical analyses and review were performed by authors N.A., MS in Biostatistics, and R.G.K., PhD in Neuroepidemiology and MPH in Chronic Disease Epidemiology (respectively), with qualifications including advanced studies in biostatistics, statistical computing, and disease epidemiology. Correction for multiple comparisons was not relevant since SEM accounts for all relationships simultaneously when generating the parameter estimates and statistical significance of each individual relationship within the model.
Study replication/validation, data availability, and analytic code
Study validation by the study group is planned as a future analysis. Data from this study are available in protected repositories as follows: the TBIMS National Data and Statistical Center and Federal Interagency Traumatic Brain Injury Research Informatics System. Analytic code used to conduct the analyses presented in this study is not available in a public repository. However, code may be available by emailing the first primary author (N.A.) as of January 5, 2024.
Open access
The authors agree to provide the full content of the article on request by contacting N.A. or A.K.W.
Footnotes
Acknowledgments
The authors would like to thank Jessa Darwin for article preparation. The authors would like to thank the TBIMS National Data Center for facilitating data access and the TBIMS National Database Research Participants for their participatory contribution to this work.
Authors’ Contributions
Data integrity and access: N.A. and A.K.W. had full access to the study data, and they take responsibility for the integrity of the data and the accuracy of the data analysis. Concept and design: A.K.W. and N.A. Acquisition, analysis, or interpretation of data: A.K.W., N.A., R.G.K., and S.B.J. Drafting of the article: A.K.W., N.A., J.W., and S.B.J. Critical revision of the article for important intellectual content: N.A., J.W., R.G.K., S.B.J., K.D.O.C., M.S., R.D.Z., W.C.W., J.P.S., and A.K.W. Statistical analysis: N.A.
Author Disclosure Statement
No competing financial interests exist.
Funding Information
This article was developed with support from the Department of Defense
Supplementary Material
Supplementary Table S1
Supplementary Table S2
References
Supplementary Material
Please find the following supplemental material available below.
For Open Access articles published under a Creative Commons License, all supplemental material carries the same license as the article it is associated with.
For non-Open Access articles published, all supplemental material carries a non-exclusive license, and permission requests for re-use of supplemental material or any part of supplemental material shall be sent directly to the copyright owner as specified in the copyright notice associated with the article.
