




Abstract
The International Mission on Prognosis and Analysis of Clinical Trials in Traumatic Brain Injury (IMPACT) model is a widely recognized prognostic model applied after traumatic brain injury (TBI). However, it was developed with patient cohorts that may not reflect modern practice patterns in North America. We analyzed data from two sources: the placebo arm of the phase II double-blinded, multicenter, randomized controlled trial Prehospital Tranexamic Acid for TBI (TXA) cohort and an observational cohort with similar inclusion/exclusion criteria (Predictors of Low-risk Phenotypes after Traumatic Brain Injury Incorporating Proteomic Biomarker Signatures [PROTIPS] cohort). All three versions of the IMPACT model—core, extended, and laboratory—were evaluated for 6-month mortality (Glasgow Outcome Scale Extended [GOSE] = 1) and unfavorable outcomes (GOSE = 1–4). Calibration (intercept and slope) and discrimination (area under the receiver operating characteristic curve [ROC-AUC]) were used to assess model performance. We then compared three model updating methods—recalibration in the large, logistic recalibration, and coefficient update—with the best update method determined by likelihood ratio tests. In our calibration analysis, recalibration improved both intercepts and slopes, indicating more accurate predicted probabilities when recalibration was done. Discriminative performance of the IMPACT models, measured by AUC, showed mortality prediction ROCs between 0.61 and 0.82 for the TXA cohort, with the coefficient updated Lab model achieving the highest at 0.84. Unfavorable outcomes had lower AUCs, ranging from 0.60 to 0.79. Similarly, in the PROTIPS cohort, AUCs for mortality ranged from 0.75 to 0.82, with the coefficient updated Lab model also showing superior performance (AUC 0.84). Unfavorable outcomes in this cohort presented AUCs from 0.67 to 0.73, consistently lower than mortality predictions. The closed testing procedure using likelihood ratio tests consistently identified the coefficient update model as superior, outperforming the original and recalibrated models across all cohorts. In our comprehensive evaluation of the IMPACT model, the coefficient updated models were the best performing across all cohorts through a structured closed testing procedure. Thus, standardization of model updating procedures is needed to reproducibly determine the best performing versions of IMPACT that reflect the specific characteristics of a dataset.
Introduction
Traumatic brain injury (TBI) represents a significant global health challenge, frequently leading to structural brain damage and functional impairment. 1,2 The young adult population is disproportionately affected by the resulting pathophysiology, which may lead to fatal or long-term disabling consequences that persist well beyond the initial injury. 1 –3 The repercussions of TBI may extend from the acute phase into a prolonged recovery period, 1 –3 which can be challenging to predict. Clinicians struggle to deliver precise prognostic evaluations to patients and their families, particularly given the limited data typically available for prognostication. There is a pressing need to improve our prognostic tools, making the development and refinement of accurate predictive models for TBI outcomes critically important.
The International Mission on Prognosis and Analysis of Clinical Trials in Traumatic Brain Injury (IMPACT) model, developed in 2008 by Steyerberg et al., arguably stands as the most recognized prognostic model post-TBI. 4 Subsequent extensions and validations (both internal and external) have been applied to the IMPACT model. 4 –15 Although prognostic models, including the IMPACT model, are occasionally utilized as decision support tools in clinical settings, 16 –19 there are various barriers to widespread clinical implementation. 20 –22
One reason for this is the infrequency of external validations. Although the IMPACT model is among models that have been externally validated more extensively compared with others, 4,6 –15,21,22 the frequency of such validations is still quite low when considering the variability of patient populations and clinical settings. In addition, there is a lack of resources and incentives that encourage external validation.
Also, when IMPACT has been externally validated, the performance outcomes have varied considerably by study (e.g., areas under the receiver operating characteristic [ROC] curve [AUCs] from 0.6 to 0.85) 4,6 –15,21,22 and have sometimes been suboptimal (e.g., AUCs of 0.6). 9,11 Even in cases where the model has performed well in external validation (e.g., AUCs of 0.8), 14 there is a lack of consensus on clear criteria for updating and evaluating these models within new cohorts and practical strategies to adapt this model to their own clinical settings. 5,16,20
As an example, these previous external validations have focused on assessing the model’s calibration (intercept and slope) and discrimination (AUC) using the original model coefficients. 4,6 –15,21,22 Less attention has been paid to updating existing prediction models, for example, adjusting the model parameters to a new cohort and validation of the model updates. Furthermore, there are reports that discuss the best practices for model updating 23 but less commonly in neurotrauma. Methods for comparing several updating strategies using likelihood ratio tests have been proposed. 24
To address this gap, we studied three specific methods for model updating, including recalibration in the large (adjustment of the intercept), logistic recalibration (adjustment of both intercept and slope), and coefficient updating (retraining/refitting of coefficients). 24 We utilized two contemporary North American cohorts, and both groups were prospectively enrolled in the last few years and were cared for in university trauma centers with access to modern neurocritical care. We conducted a systematic and comprehensive evaluation of the performance of the original IMPACT model and provide insights into updating methodology as applied to the IMPACT model.
Methods
Study design, participants, and data collection
This study involved detailed analysis of two distinct cohorts:
Cohort 1: The Prehospital Tranexamic Acid for TBI (TXA) cohort consisted of subjects from the placebo arm of the phase II double-blinded, multicenter, randomized controlled trial, Prehospital Tranexamic Acid for TBI. 25 The trial enrolled patients aged 15 years or older with moderate or severe blunt or penetrating TBI, a prehospital Glasgow Coma Scale (GCS) score of 3–12, at least one reactive pupil, and systolic blood pressure of at least 90 mm Hg before randomization. Eligibility was contingent upon the emergency medical services-provided GCS score before intubation. This analysis was limited to 127 subjects with confirmed hemorrhage on initial head computed tomography (CT) scan (“CT positive”) in the placebo arm of the trial. The patients were also enrolled pre-hospital. The parent trial’s ethical protocols were adhered to, details of which have been previously published. 25
Cohort 2: The Predictors of Low-risk Phenotypes after Traumatic Brain Injury Incorporating Proteomic Biomarker Signatures (PROTIPS) cohort derived from the observational PROTIPS study involved subjects prospectively identified and enrolled at the Oregon Health & Science University (OHSU). The inclusion criteria consist of individuals aged 15 years and older who presented to the emergency department (ED) with moderate-to-severe TBI confirmed by positive CT scans, and with a GCS score ranging from 3 to 12. Patients were also enrolled after resuscitation in the ED. This study included a total of 126 patients. Inclusion criteria were age 15 years and older presenting to the ED with CT-positive moderate-to-severe TBI, with a GCS score of 3–12 (126 patients). Approval was obtained from the Institutional Review Board (IRB) at OHSU, and the trial required patient consent.
The IMPACT model
Our analysis for both cohorts included all three versions of the IMPACT model—core, extended, and lab—evaluating their performance against 6-month post-injury outcomes. These outcomes encompassed mortality (Glasgow Outcome Scale Extended [GOSE] = 1) and unfavorable neurological outcome, as determined by the GOSE scores ranging from 1 to 4.
Statistical analyses
Data obtained from the TXA cohort had previously been subjected to multiple imputation as detailed in a prior publication. 25 For the PROTIPS cohort, the analysis was conducted on datasets that underwent multiple imputation to address missing values. The variables used in the analyses were age, GCS motor, pupillary reactivity, hypoxia, hypotension, glucose, hemoglobin, Marshall CT classification, 26 subarachnoid hemorrhage (SAH), and epidural hematoma (EDH), with the target outcome being the 6-month GOSE. To calculate the odds ratios for the 6-month GOSE outcome for each variable, proportional odds logistic regression analysis was performed with the 6-month GOSE as an ordinal outcome. 27 The p-values were calculated by dividing the model coefficients by their standard errors and using the absolute value for a two-tailed test, with MASS module in R. This result was compared with the outcomes from the original article on the IMPACT model. 4 Next, we evaluated the performance of the IMPACT original model (Core, CT, Lab model with original coefficient), 5,16,20,23,24 in each cohort with calibration and discrimination, leveraging the calibration plot and the AUCs. Subsequently, we applied three model updates to the IMPACT model: recalibration in the large (re-estimation of model intercept), recalibration (re-estimation of intercept and slope), and coefficient update (re-estimation of all coefficients by fitting the model with our study cohorts). 24 To elaborate on recalibration, it generally involves adjusting the output of a classification model, which is originally expressed in the form of {logit * (linear predictor)} for a logistic regression, such that the probabilities of prediction can be directly interpreted as the confidence on the prediction. For model adjustment by recalibration, it is reformulated as {logit * (a * linear predictor + b)}, where the linear predictor uses the same coefficients as the original model. “Recalibration in the large” refers to adjusting only the intercept “b” using the dataset, while “Logistic recalibration” involves adjusting both the intercept “b” and the scale “a.” 24,28,29 Then, we evaluated the update methods using likelihood ratio tests, 24 comparing two models’ likelihood ratios and determining p-values with the chi-squared distribution, considering degrees of freedom. The selection process began with comparing the coefficient-updated model against the original (test 1), moving to recalibration in the large (re-estimation of model intercept) if p < 0.05 (test 2), and finally to logistic recalibration if needed (test 3), following a stepwise decision based on p-value thresholds to choose the most appropriate update method.
Statistical analyses were performed using R version 4.3.1 (R Foundation for Statistical Computing) and the R packages MASS version 7.3.60, stats version 4.3.1 (inference with fixed-coefficient models, model calibration, and execution of closed tests), and Python version 3.10, scikit-learn version 1.4.0 (data preprocessing [including missing value imputation], retraining of logistic regression models). Significance was considered for p-values <0.05.
Results
Demographics and clinical characteristics
Demographic and clinical characteristics of the TXA and PROTIPS cohorts are detailed in Table 1. These cohorts were evaluated with similar inclusion and exclusion criteria, resulting in comparable demographics and clinical profiles between the two groups. Observations include a median age of 33 years in the TXA cohort and 42.5 years in the PROTIPS cohort. The mortality rates were 24% and 20%, respectively, with the PROTIPS cohort experiencing a higher rate of unfavorable outcomes. A significant proportion of the TXA cohort (72.43%) exhibited poor motor responses (motor score of <3), a condition more prevalent than in the PROTIPS cohort (22.2%). Pupil reactivity and the incidence of hypoxia varied slightly between cohorts, with the TXA cohort recording higher pupil reactivity (71.65%) and lower hypoxia (6.3%). Both cohorts showed a majority of patients with a Marshall CT class of 2 and a notably high prevalence of SAH in the PROTIPS cohort (95.24%). The presence of EDH was low in both cohorts (11% and 13%).
Patient Characteristics of the TXA and PROTIPS Cohorts
Odds ratios
To evaluate whether the predictors used in the IMPACT model could be informative for our two cohorts, we first performed a proportional odds logistic regression analysis with 6-month GOSE categories as the outcome (Figs. 1, 2). 26 Odds ratios >1 indicate a direction toward a more favorable outcome within the category under consideration compared with the reference category, whereas lower odds suggest a stronger association with a poor outcome.
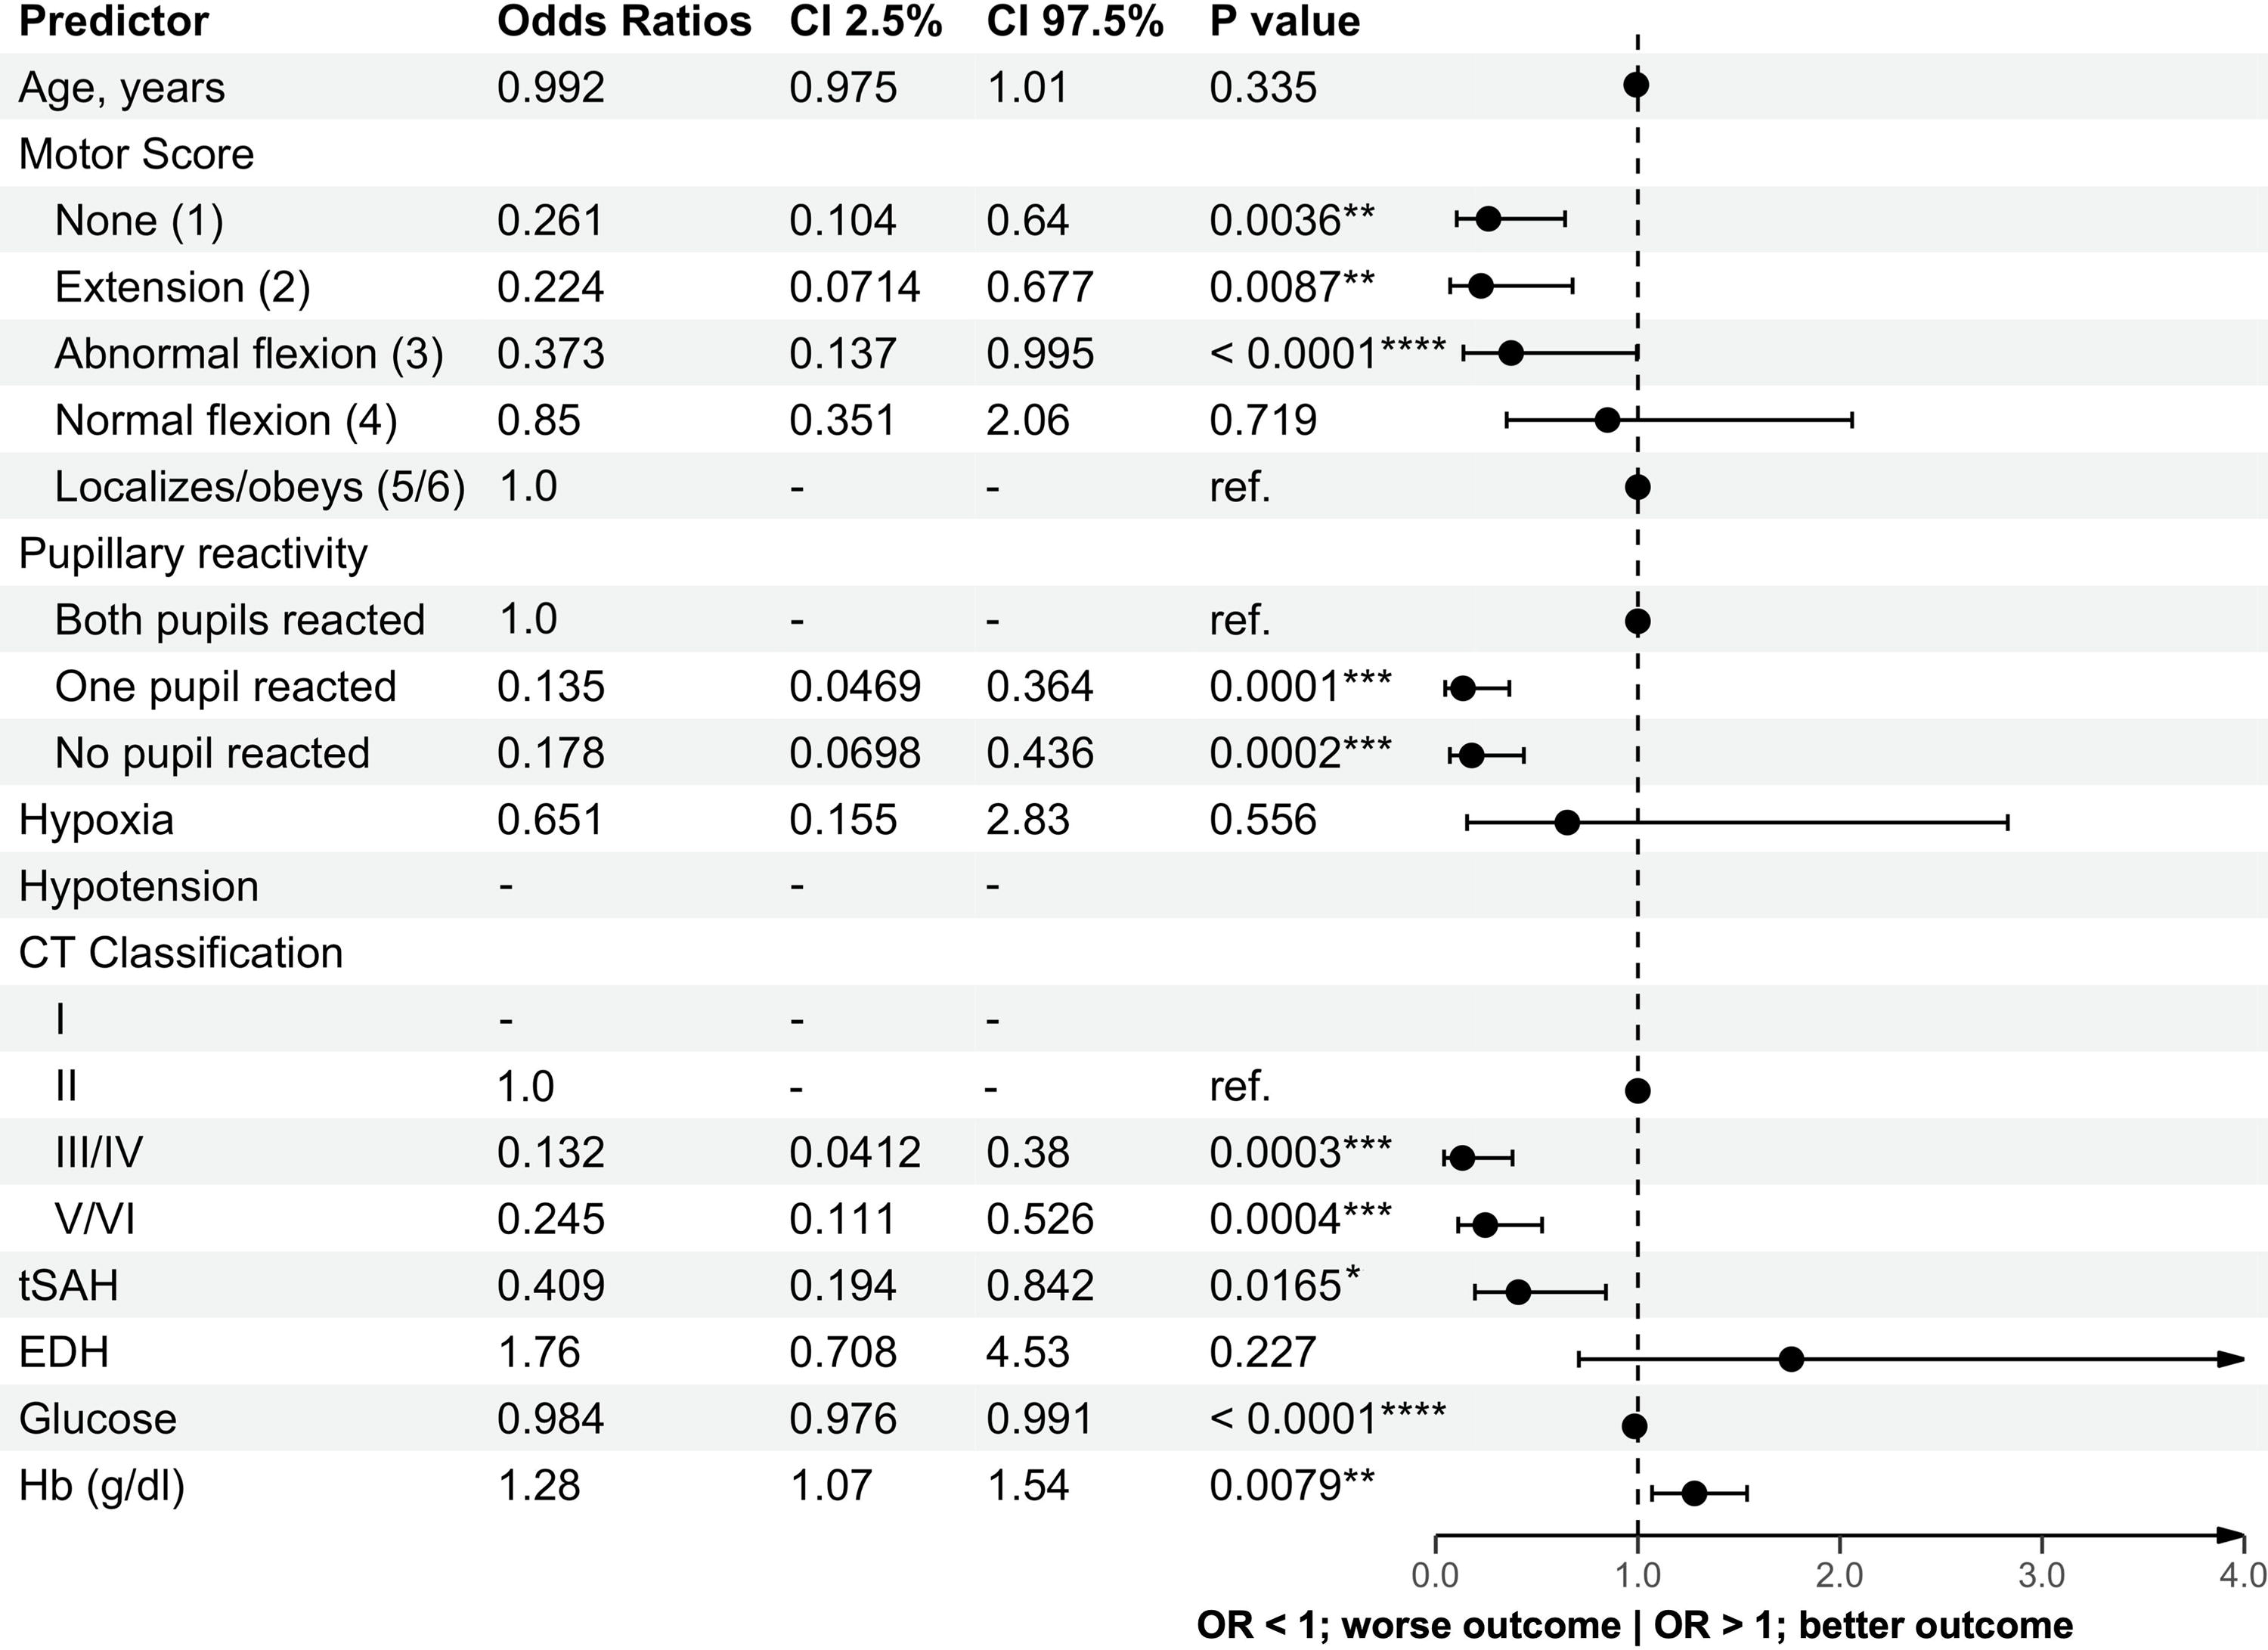
Forest plot of odds ratios for the TXA cohort. Forest plot displaying the odds ratios for various variables in relation to the Glasgow Outcome Scale within the TXA cohort. -, indicates absence of patient data; CI, confidence interval; EDH, epidural hematoma; Hb, hemoglobin; OR, odds ratio; Ref., reference value in this model; tSAH, traumatic subarachnoid hemorrhage; TXA, Prehospital Tranexamic Acid for TBI. *p < 0.05; **p < 0.01; ***p < 0.001; ****p < 0.0001.
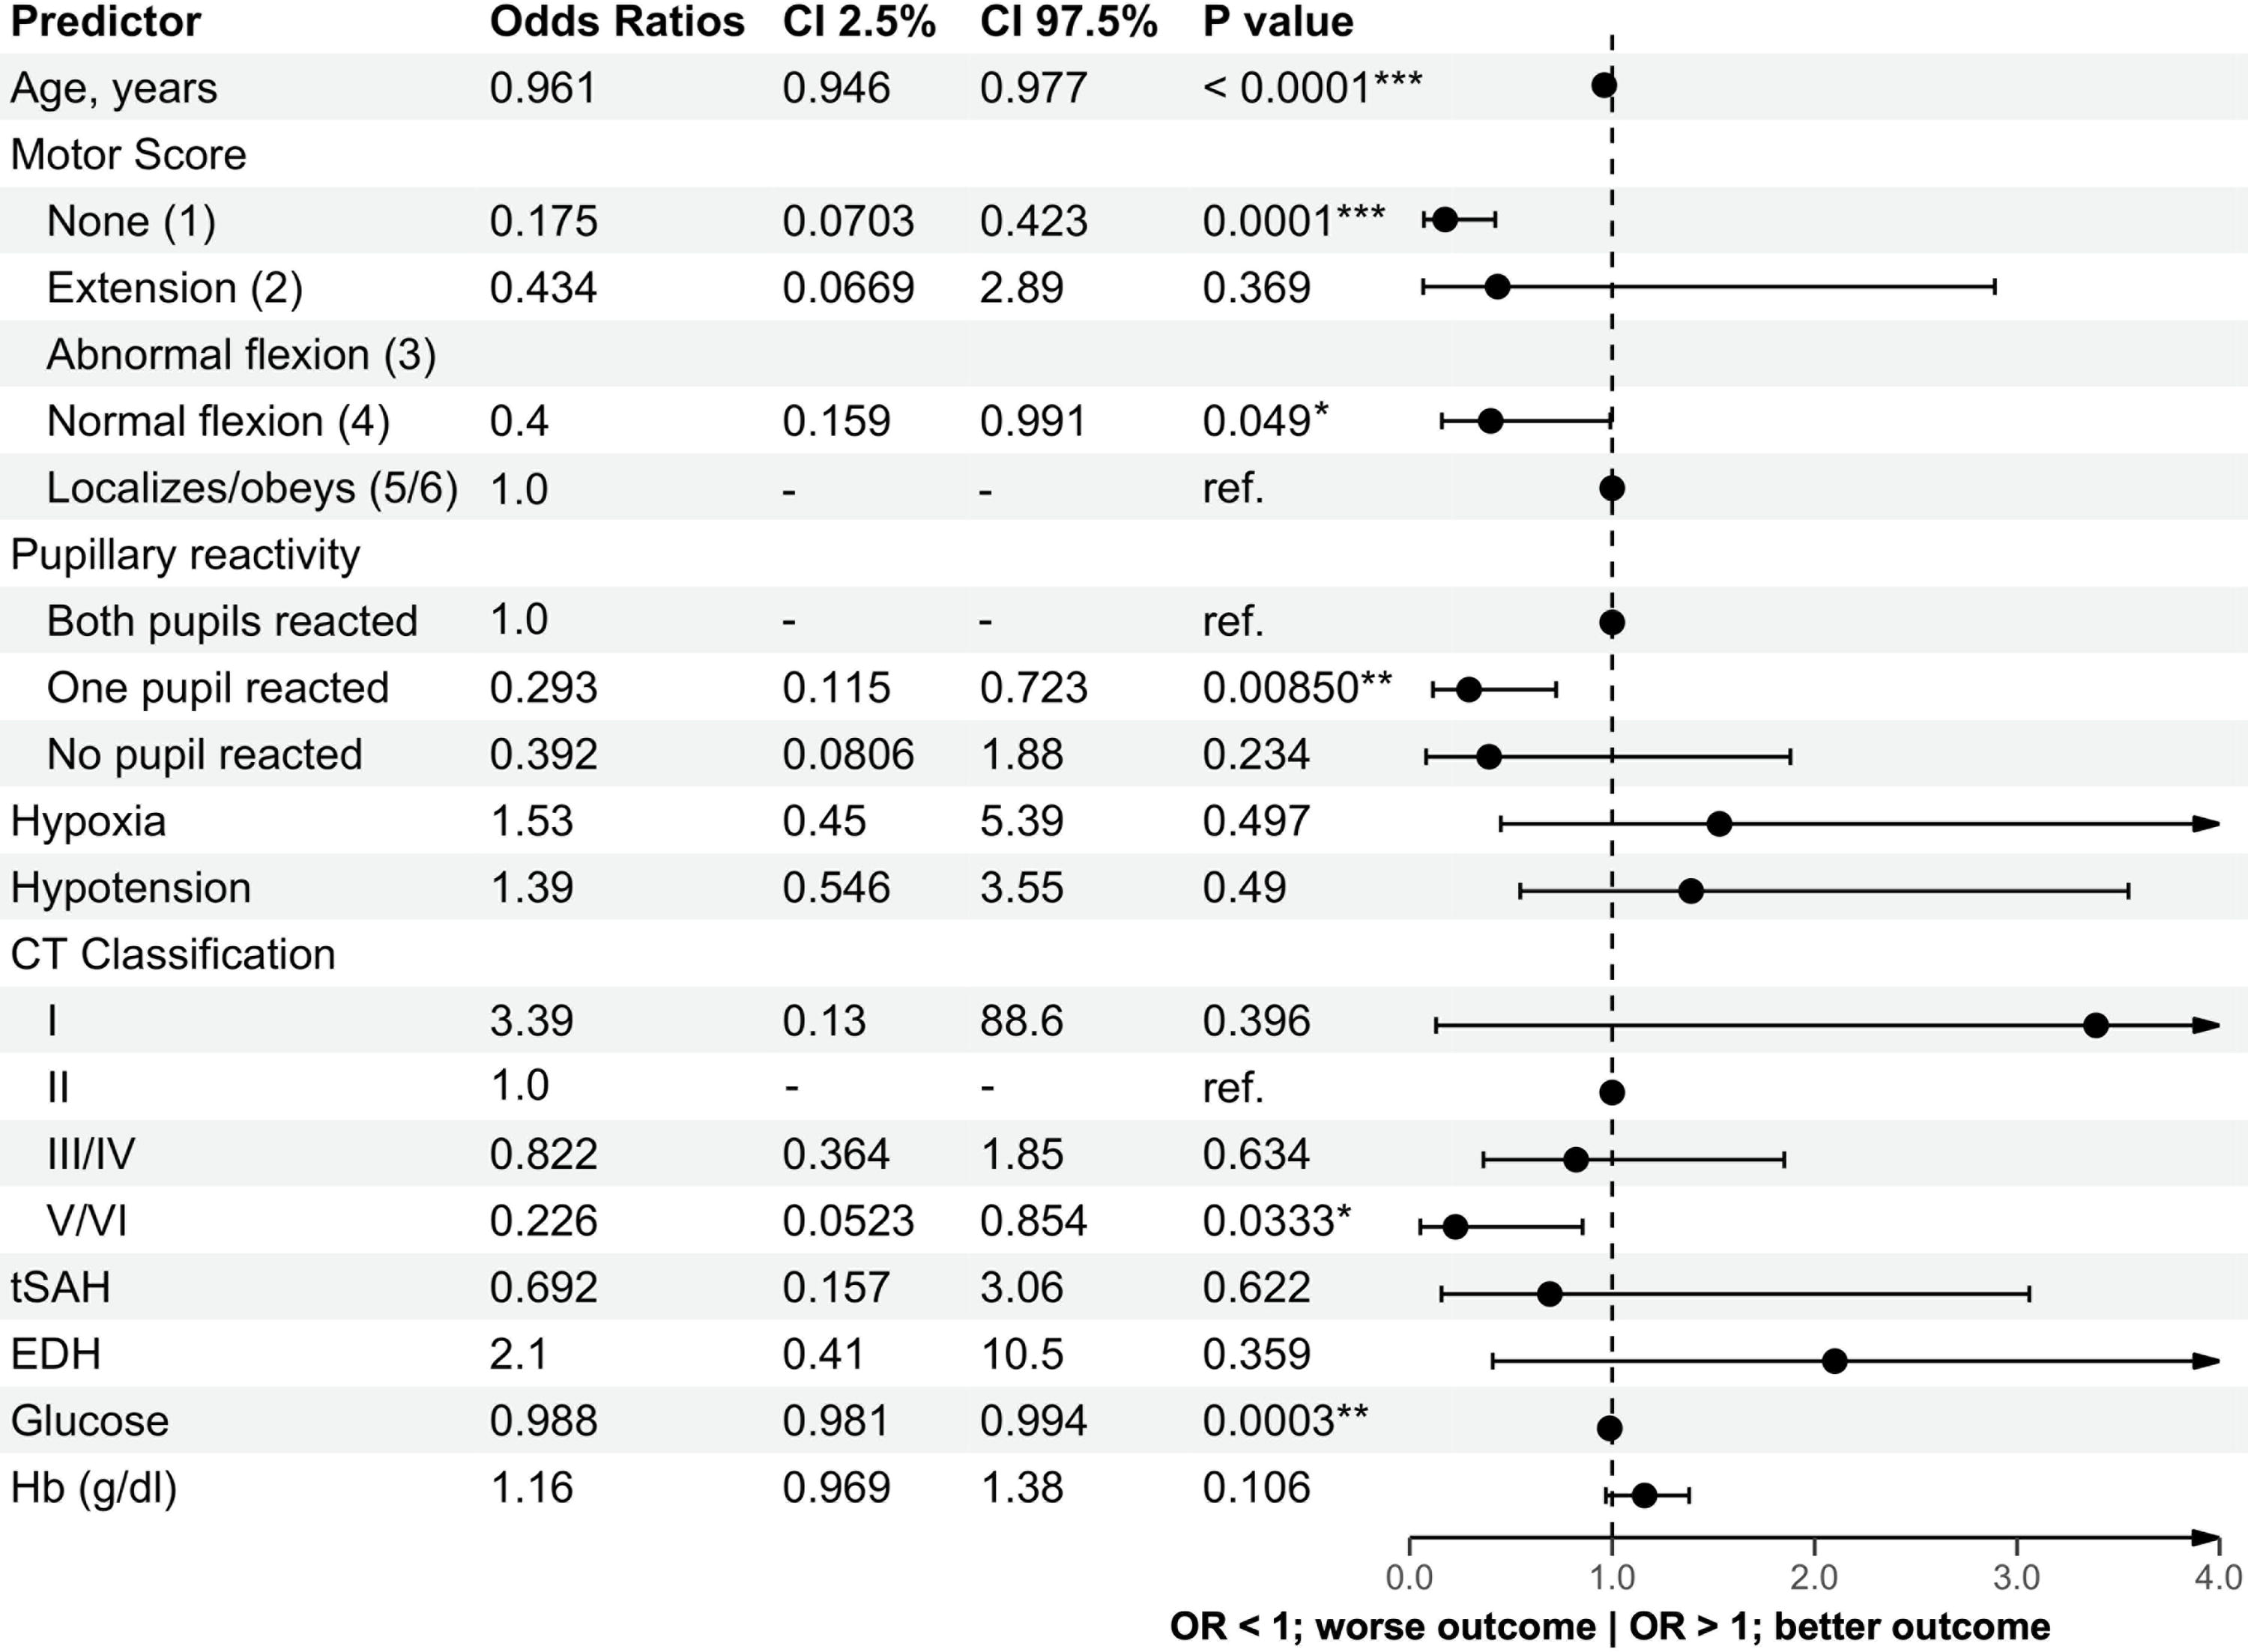
Forest plot of odds ratios for the PROTIPS cohort. Forest plot displaying the odds ratios for various variables in relation to the Glasgow Outcome Scale within the PROTIPS cohort. -, indicates absence of patient data; CI, confidence interval; EDH, epidural hematoma; Hb, hemoglobin; OR, odds ratio; PROTIPS, Predictors of Low-risk Phenotypes after Traumatic Brain Injury Incorporating Proteomic Biomarker Signatures; Ref., reference value in this model; tSAH, traumatic subarachnoid hemorrhage. *p < 0.05; **p < 0.01; ***p < 0.001; ****p < 0.0001.
Age did not show a strong association with outcomes across both cohorts, with odds ratios of 0.99 and 0.96, respectively, contrasting with the original IMPACT cohort, where increasing age was associated with worse outcomes (odds ratio 2.2, higher odds are associated with a higher likelihood of poor outcomes in the original article). The GCS motor score in both cohorts was positively correlated with better outcomes as scores increased. Pupil reactivity analysis revealed strong associations with poor outcomes for conditions of “one pupil reacted” and “no pupil reacted,” with odds ratios of 0.13 and 0.17, and 0.29 and 0.39, respectively. Regarding CT classification, classes worse than Marshall CT score Class 2 uniformly exhibited odds ratios <1, suggesting adverse associations with outcomes. SAH in both cohorts had odds ratios <1 (0.40 and 0.69), associated with worse outcomes, whereas the presence of EDH was associated with more favorable outcomes, with odds ratios of 1.76 and 2.09, respectively. These findings for SAH and EDH align with those in the original IMPACT cohort. Glucose levels had little to no association with outcomes in both cohorts, with odds ratios of 0.98 and 0.99, and hemoglobin levels showed odds ratios of 1.27 and 1.15.
Model evaluation through calibration and model updating through recalibration
To evaluate the coefficients of the original IMPACT model for predicting mortality and unfavorable outcomes in our two study cohorts, we next analyzed the prediction performance of the original model with our data using calibration methods.
The calibration intercepts and slopes for each model plotted against each observed outcome are shown in Figures 3 and 4. Generally, we observed a moderate calibration performance, with intercepts close to 0 and slopes not far from 1. Specifically, for mortality, intercepts ranged from 0.08 to −0.17, indicating a relatively accurate systematic risk assessment. Slope values in the TXA cohort varied (0.46, 1.02, 1.34), suggesting some inconsistency, whereas in the PROTIPS cohort, values of 0.73 and 0.91 suggested that the predicted risk in this case tends to be more pessimistic than the actual observed risk. In addition, a slope <1 also implies that the change in predicted risk is slightly “overly extreme” than the actual change in probability. 5 When implementing this model in clinical settings, it is necessary to guard against overly pessimistic predictions, which might contribute to a self-fulfilling prophecy. For unfavorable outcomes, intercepts between 0.07 and 0.24, all exceeding zero, were within a reasonable range. Slopes for the TXA cohort (0.4 and 0.7) and for the PROTIPS cohort (0.9 and 0.77) indicated that that here too, the overall predicted risk is slightly more pessimistic than the actual risk, and the model’s predicted risk changes more extremely than the actual risk changes.

Calibration plots of the original IMPACT model for the TXA cohort. Calibration plots of the IMPACT models (Core, CT, Lab) with original coefficients, which were applied to the TXA cohort. The points represent the plot between predicted probabilities and actual probabilities. The vertical lines extending upward and downward indicate the 95% confidence intervals. The blue line represents a linear approximation, whereas the red curve is an approximation using splines. CT, computed tomography; IMPACT, International Mission on Prognosis and Analysis of Clinical Trials in Traumatic Brain Injury; TXA, Prehospital Tranexamic Acid for TBI.

Calibration plots of the original IMPACT model for the PROTIPS cohort. Calibration plots of the IMPACT models (Core, CT, Lab) with original coefficients, which were applied to the PROTIPS cohort. The points represent the plot between predicted probabilities and actual probabilities. The vertical lines extending upward and downward indicate the 95% confidence intervals. The blue line represents a linear approximation, whereas the red curve is an approximation using splines. CT, computed tomography; IMPACT, International Mission on Prognosis and Analysis of Clinical Trials in Traumatic Brain Injury; PROTIPS, Predictors of Low-risk Phenotypes after Traumatic Brain Injury Incorporating Proteomic Biomarker Signatures.
Figure 5 displays the calibration plots for the models that initially showed suboptimal predictive probabilities (Lab model for mortality in PROTIPS and Lab models for unfavorable outcomes in both TXA and PROTIPS cohorts), both after recalibration in the large (adjusting the intercept only) and logistic recalibration (adjusting both intercept and slope). Both intercept and slope values showed improvement across all models, indicating significant enhancements in predicted probabilities indicating that predicted probabilities became more aligned with actual probabilities.

Comparison of calibration plot changes between “original model,” “recalibration in the large,” and “logistic recalibration.” This figure presents the recalibration of three models that initially showed suboptimal predictive probabilities in calibration plots. The top panel represents TXA Lab unfavorable outcome, the middle panel depicts PROTIPS Lab mortality, and the bottom panel illustrates PROTIPS Lab unfavorable outcome. Adjustments were made to the model intercept (recalibration in the large) and both the intercept and slope (logistic recalibration) for improved calibration. The points represent the plot between predicted probabilities and actual outcomes, with lines extending vertically indicating the 95% confidence intervals. The blue line represents a linear approximation, whereas the red curve is an approximation using splines. PROTIPS, Predictors of Low-risk Phenotypes after Traumatic Brain Injury Incorporating Proteomic Biomarker Signatures; TXA, Prehospital Tranexamic Acid for TBI.
The discriminative performance of the original and coefficient-updated models for our cohorts
Next, we assessed the discriminative performance using ROC curves and AUC, as illustrated in Figures 6–9. ROCs reflect discriminative performance as the ability of the model to accurately classify patients into correct outcome categories. An AUC closer to 1 indicates a high level of accuracy, whereas an AUC closer to 0.5 suggests performance no better than random chance. 20,23
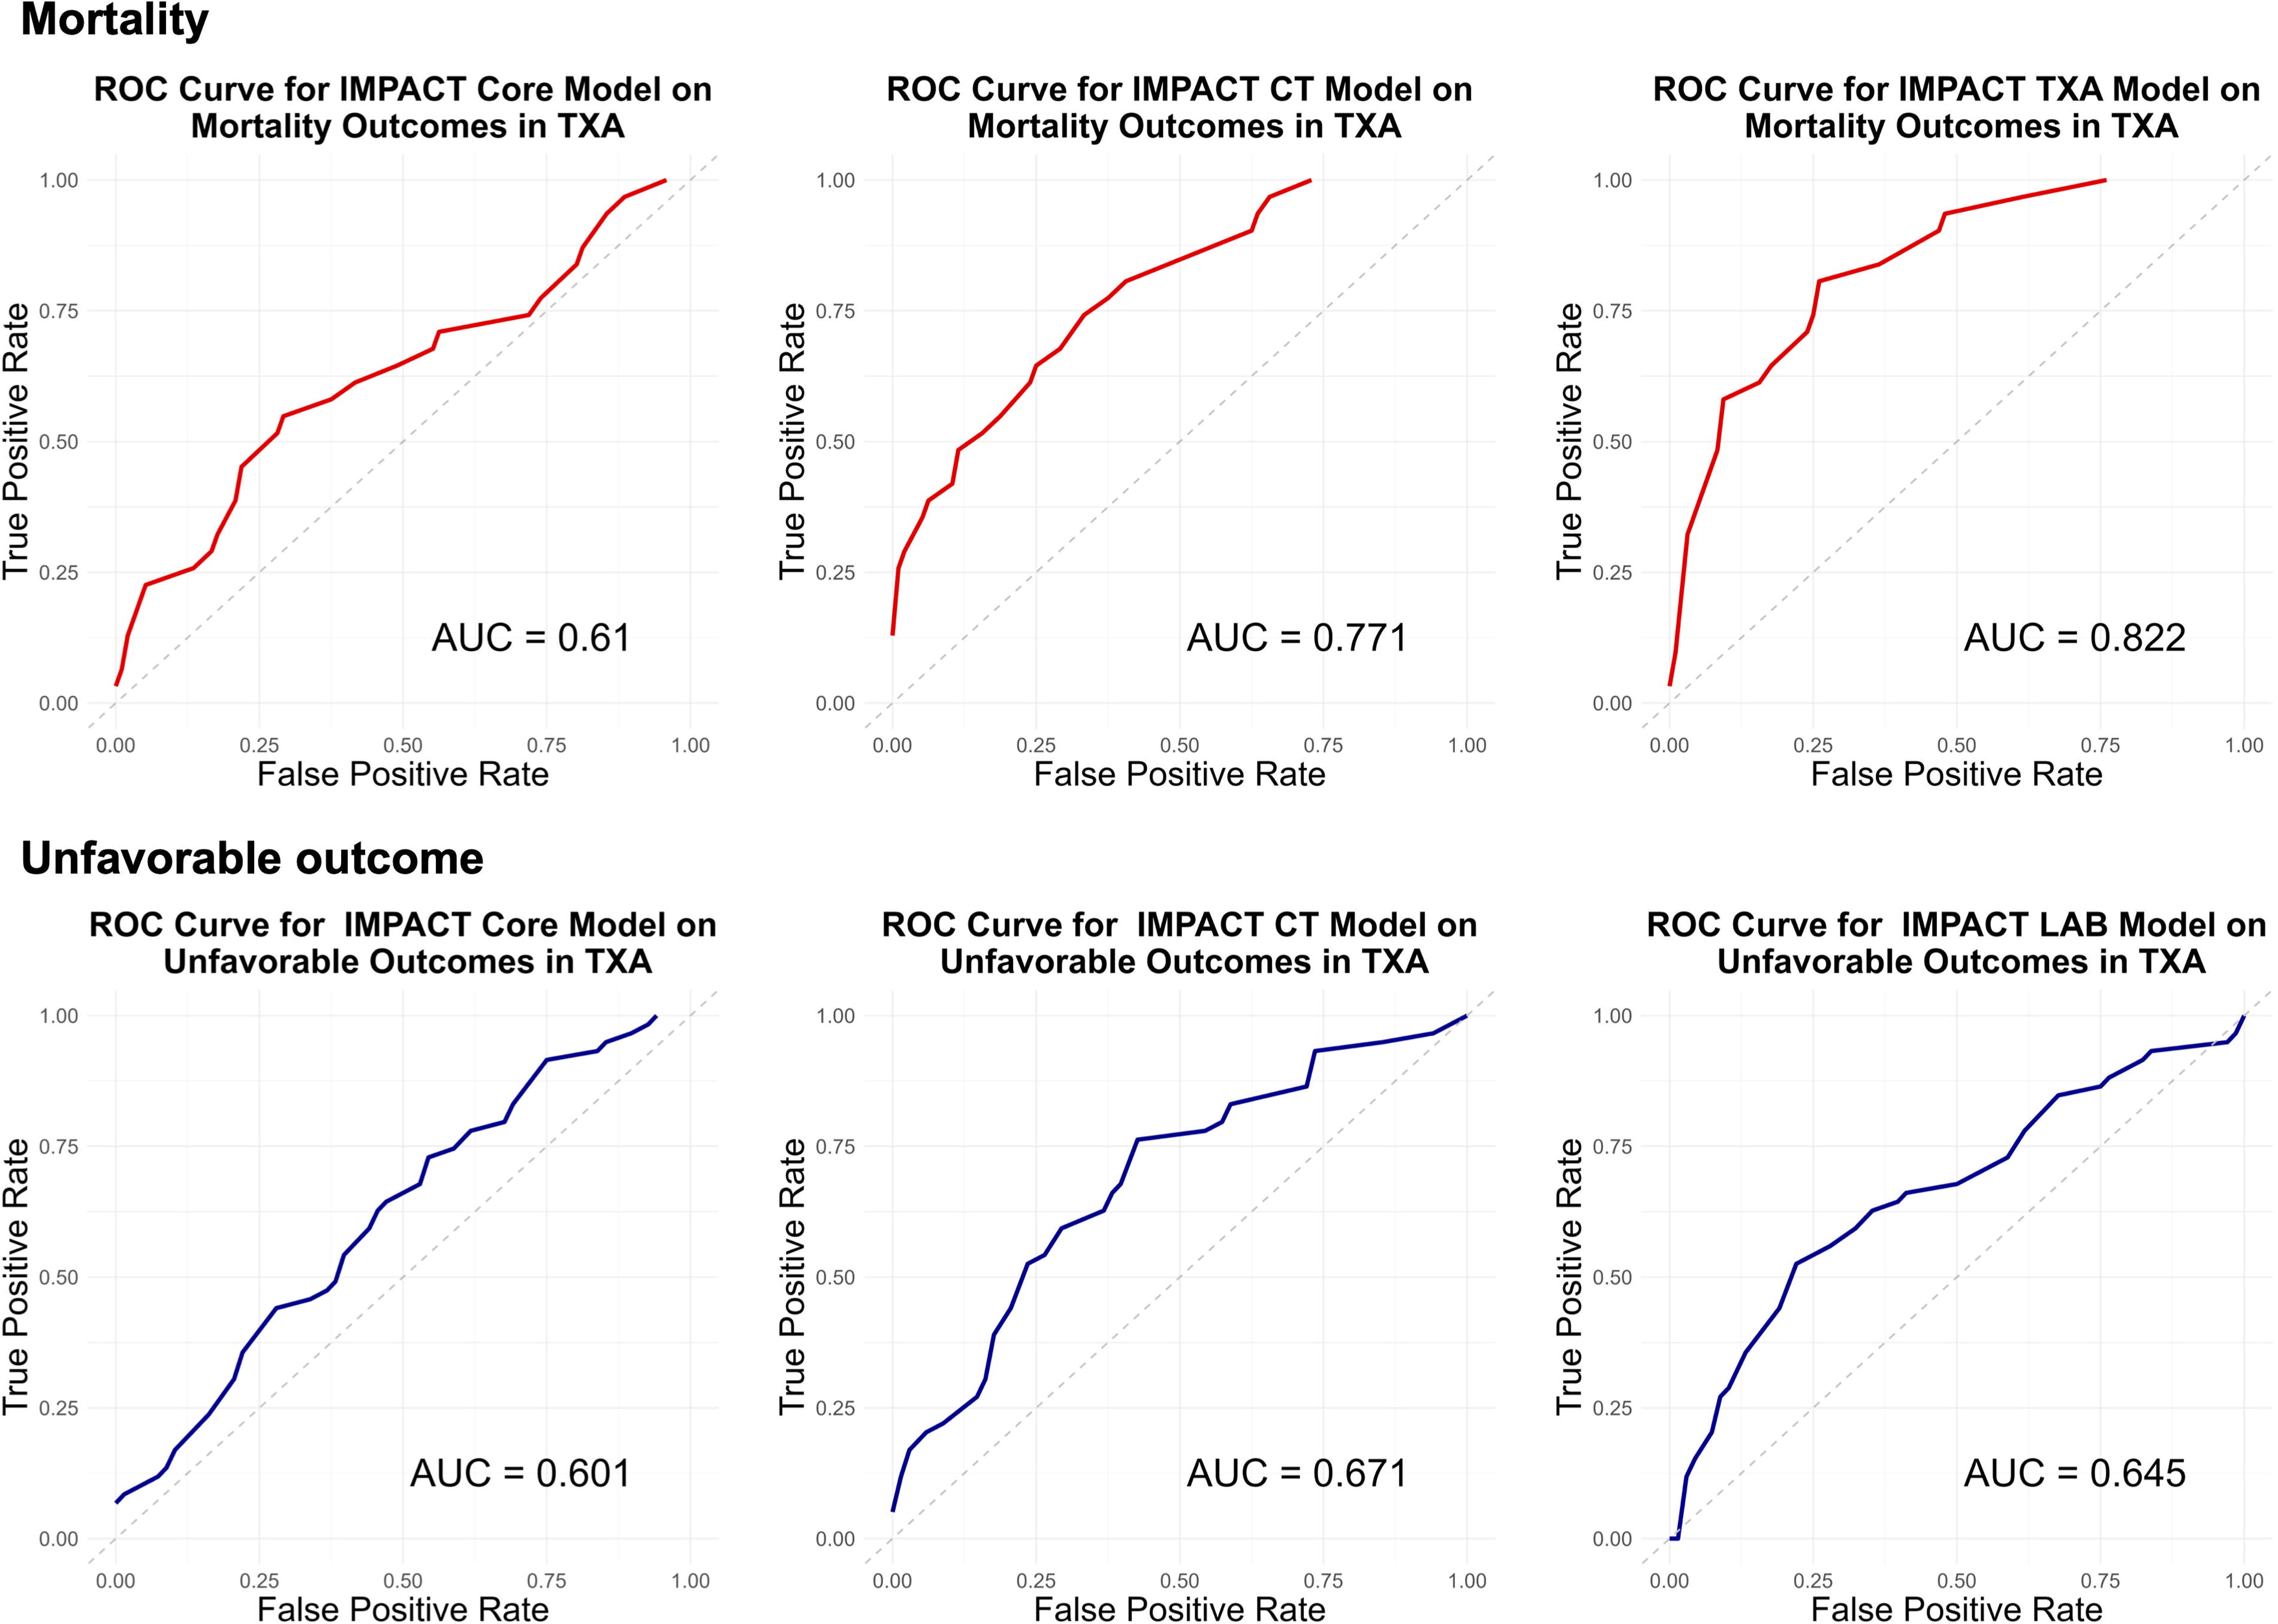
ROC curves for the IMPACT model (Core, CT, Lab) using original coefficients in the TXA cohort. This figure showcases ROC curves generated using the IMPACT model’s original coefficients (Core, CT, Lab) for the TXA cohort. The upper panel shows TXA original model mortality, and the lower panel illustrates TXA original model unfavorable outcome. The red line represents the model’s predictive performance for mortality, whereas the yellow line corresponds to the prediction of unfavorable outcomes. CT, computed tomography; IMPACT, International Mission on Prognosis and Analysis of Clinical Trials in Traumatic Brain Injury; ROC, receiver operating characteristic; TXA, Prehospital Tranexamic Acid for TBI.

ROC curves for the IMPACT model (Core, CT, Lab) using original coefficients in the TXA cohort. This figure showcases ROC curves generated using the IMPACT model’s original coefficients (Core, CT, Lab) for the PROTIPS cohort. The upper panel displays the PROTIPS original model mortality, and the lower panel depicts the PROTIPS original model unfavorable outcome. The red line represents the model’s predictive performance for mortality, whereas the yellow line corresponds to the prediction of unfavorable outcomes. CT, computed tomography; IMPACT, International Mission on Prognosis and Analysis of Clinical Trials in Traumatic Brain Injury; PROTIPS, Predictors of Low-risk Phenotypes after Traumatic Brain Injury Incorporating Proteomic Biomarker Signatures; ROC, receiver operating characteristic; TXA, Prehospital Tranexamic Acid for TBI.

ROC curves for the updated (refitted) IMPACT model (Core, CT, Lab) in the TXA cohort. This figure illustrates the ROC curves for the updated (refitted) IMPACT models (Core, CT, Lab) applied to the TXA cohort. The upper panel displays the TXA coefficient updated model mortality, and the lower panel depicts the TXA coefficient updated model unfavorable outcome. The red line indicates the model’s performance in predicting mortality, whereas the yellow line denotes predictions for unfavorable outcomes. CT, computed tomography; IMPACT, International Mission on Prognosis and Analysis of Clinical Trials in Traumatic Brain Injury; ROC, receiver operating characteristic; TXA, Prehospital Tranexamic Acid for TBI.

ROC curves for the updated (refitted) IMPACT model (Core, CT, Lab) in the PROTIPS cohort. This figure illustrates the ROC curves for the updated (refitted) IMPACT models (Core, CT, Lab) applied to the PROTIPS cohort. The upper panel displays the PROTIPS coefficient updated model mortality, and the lower panel depicts the PROTIPS coefficient updated model unfavorable outcome. The red line indicates the model’s performance in predicting mortality, whereas the yellow line denotes predictions for unfavorable outcomes. CT, computed tomography; IMPACT, International Mission on Prognosis and Analysis of Clinical Trials in Traumatic Brain Injury; PROTIPS, Predictors of Low-risk Phenotypes after Traumatic Brain Injury Incorporating Proteomic Biomarker Signatures; ROC, receiver operating characteristic.
Discrimination reflects the model’s ability to correctly classify patients into the outcome of interest, as predicted outcome is compared with actual outcome. 23,30 –34 The concordance index or the AUC in logistic models is commonly used to assess this, where a higher value indicates better discriminatory performance. 20
Initially, the predictive performance for mortality of the original model applied to the TXA cohort showed ROC-AUCs of 0.61, 0.77, and 0.82, for the Core, CT, and Lab models, respectively (the same order applies below). Meanwhile, for unfavorable outcomes, it was 0.60, 0.67, and 0.52. For the original model applied to the PROTIPS cohort, the predictive performance for mortality had ROC-AUCs of 0.75, 0.80, and 0.79, and for unfavorable outcomes, it was 0.73, 0.70, and 0.60. For reference, the original IMPACT validation showed ROC-AUCs of 0.66–0.84 for the Core model, 0.71–0.87 for the extended (CT) model, 0.72–0.80 for the Lab models for mortality and ROC-AUCs of 0.70–0.82 for the Core model, 0.73–0.84 for the CT model, and 0.75–0.82 for poor outcome, respectively.
In terms of the discriminative performance of the coefficient-updated models for the TXA cohort, for mortality prediction, the ROCs were 0.67, 0.82, and 0.84, whereas for unfavorable outcomes, they were 0.76, 0.77, and 0.79. For the coefficient-updated models applied to the PROTIPS cohort, the predictive performance for mortality demonstrated ROCs of 0.81, 0.84, and 0.82 and 0.73, 0.67, and 0.68 for unfavorable outcome (GOSE of <4).
The trend observed across both cohorts and all models was that AUCs were either improved or remained nearly the same. It was also consistently noted that the AUCs for predicting unfavorable outcomes were generally lower/poorer. Regarding the Core, CT, and Lab models, the coefficient-updated Lab model tended to yield comparatively better results.
Closed test using likelihood ratio test
Subsequently, we determined the most appropriate model update by using a closed testing procedure with likelihood ratio tests. Test 1 compared the coefficient-updated model against the original model, Test 2 evaluated the coefficient-updated model against the recalibration in the large model, and Test 3 compared the coefficient-updated model with the recalibrated model. We observed that the coefficient-updated model showed the best performance across every model and cohort (p < 0.0001).
Discussion
In applying the IMPACT model to two contemporary North American cohorts, we observed that the original IMPACT model generally predicted mortality outcomes better than unfavorable outcomes. Our calibration analysis noted biased probability predictions from the Lab model, which improved with recalibration. When we updated the model based on our specific cohorts (retaining the same predictor variables, but updating the coefficients), that performance improved significantly, such that the coefficient-updated model emerged as the best performer across every model and cohort.
Demographics and clinical characteristics
The demographics and clinical characteristics of our cohorts shared some similarity with those of the original IMPACT cohort. Our study cohorts, derived from patients at large academic U.S. hospitals, may not fully represent the entire spectrum and diversity of patients with TBI. However, the distinct characteristics of each cohort lend significance to our comparative evaluation. The TXA cohort was drawn from the placebo arm of an interventional trial, whereas the PROTIPS cohort was sourced from a prospective observational study. In addition, the TXA cohort primarily included patients with pre-resuscitation GCS, as these participants were enrolled pre-hospital, whereas the PROTIPS cohort mainly consisted of patients with post-resuscitation GCS enrolled from the emergency department. This diversity in patient inclusion enhances the relevance of our findings to varied clinical settings. When examining each predictor, hypotension was an exclusion for our cohorts, and thus, the rates of hypotension were much lower than the original IMPACT derivation or validation cohorts. Another difference in our cohorts, particularly PROTIPS, was a lower rate of poor motor responses (22.22%) and a higher incidence of traumatic SAH (tSAH, 95.24%). The high rate of tSAH might be related to the selection of CT-positive subjects in our cohorts, whereas the original IMPACT cohorts did not have this stipulation. In addition, the lower incidence of hypoxia in both cohorts (6.3% and 7.94%) compared with the original cohort might be attributed to variations in inclusion criteria, with clinical trials generally including fewer ill subjects who may be expected to demonstrate some recovery as opposed to including all-comers. Overall, the TXA cohort showed many similarities to the original IMPACT derivation cohort, including age and outcomes. However, the PROTIPS cohort had a higher median age (42.5 vs. 30 years) and higher rates of unfavorable outcomes (64% vs. 48%) and tSAH (95% vs. 45%) compared with the original IMPACT cohort, suggesting a possibly more severely injured patient group.
Relationships between predictor variables and outcomes
Although our analysis of odds ratios between predictor variables and outcomes revealed similarities with the IMPACT cohort, some differences emerged. For example, we did not observe a relationship between age and outcomes, as well as disparities in motor scores, pupil reactivity, and the minimal association between hypoxia, hypotension, and poor outcomes. These relationships were likely modified by the relative infrequency of findings such as hypotension in our cohorts, underscoring the appeal of updating the IMPACT model to the specific data set under consideration.
Performance of the original IMPACT model
One of the reasons that the IMPACT model has been so enduring since its publication 15 years ago is how well it performs in novel populations, which is fundamental to the model’s reliability and clinical validity. 28 Although many researchers prioritize discrimination, typically assessed by the AUC, calibration is equally essential. Calibration measures how accurately a model predicts the actual risk to patients, which confirms the model’s reliability. 29 This accuracy is vital in clinical settings, where it aids clinicians and patients in making informed decisions based on precise risk estimates.
Specifically, for the calibration of the Lab model, there were cases where the original model’s predicted probabilities were excessively biased toward worse outcomes (death or unfavorable outcome), which may not be suitable for guiding treatment decisions based on these predictions. This observation underscores the importance of evaluating both the discrimination and calibration of models, as the Lab model with a satisfactory ROC of 0.79 showed a significant bias in predicted probabilities.
In addition, most other models exhibited calibration plots where slopes were <1, with plots residing below the y = x line. This suggests that the predicted risk is more pessimistic compared with the actual risk and that the change in predicted risk is slightly more extreme than the actual change in probability.
When using this model in practical clinical settings, considering the slope of the calibration plot and the model’s characteristics may enhance decision-making by providing a more informed basis for interpreting the model’s predictions.
Other investigators have observed mixed results when performing external validations. For example, when considering mortality, the IMPACT core’s slope values indicated generally adequate calibration in some studies, 11,12 whereas for unfavorable outcomes, the variation was more significant, suggesting instances of miscalibration in predicting more severe outcomes. The variability in calibration metrics across studies and patient populations underscores the need for contextualizing model performance. It is unclear whether the models evaluated in previous studies used original or retrained coefficients, which could explain some of the observed differences. For those models that were poorly calibrated in our investigation (Lab model for mortality in PROTIPS, Lab models for unfavorable outcomes in both TXA and PROTIPS cohorts), recalibration made significant improvements in intercept and slope values, either through adjusting the intercept alone or both intercept and slope. This adjustment led to a marked enhancement in predicted probabilities, underscoring the importance of recalibration in clinical prediction models for accurate risk estimation.
In terms of the discriminative performance using original coefficients, our results differ somewhat with prior external validation studies. From other external validation studies, the AUC for mortality ranged from 0.67 to 0.89 and, for unfavorable outcomes, from 0.68 to 0.81. 4,6 –16 These figures contrast with some of our findings, where certain AUC values fell below the 0.70 threshold, suggesting less effective discrimination in these specific contexts. It is noteworthy that studies with AUCs in the 0.6–0.7 range, such as those by Sun et al. and Wongchareon et al., were conducted in diverse cultural and economic conditions, including lower and middle-income countries, reflecting a possible influence of different patient demographics and health care systems on model performance. 9,15 Regarding the impact of differences in patient population characteristics on discriminative ability, in comparison with previous external validations, studies by Maeda et al., Han et al., and Wan et al. reported higher average and median ages (60.1 years, 53 years, 73.1 years, and 49 years, respectively), 10,12,14 whereas others generally found the average age to be in the 30s. In addition, in terms of race and ethnicity, over 30% of the TXA cohort was classified as unknown. However, among those identified, Caucasians represented 81.9% in TXA and 80.3% in PROTIPS, both percentages exceeding the U.S. average of 57.8%. The proportion of Hispanics, within the range of identified ethnicities, was 11.4% in TXA and 7.3% in PROTIPS, both below the national average of 18.7%. In terms of model performance, except for the external validation to the Pharmos trial, the AUCs generally achieved were around 0.75–0.85, which does not significantly differ from other reports. 11 Regarding the impact of age on AUC, Rita de Cássia Almeida Vieira et al. conducted a meta-regression on age, showing a p value of <0.001; however, the coefficient was 0.004, indicating a minimal impact on AUC. 16 As for race, although no studies systematically conducting sensitivity analysis were found, we consider it an important topic for future investigation.
Performance of the updated IMPACT model
The coefficient update in our study significantly improved AUC results, indicating that updating the model with our cohort-specific data is an option to enhance IMPACT’s predictive accuracy. This finding aligns with the acknowledgment of the importance of refitting coefficients in prior reports, 4 although few explicitly documented their approach to this process. The variability within our cohort results suggests a divergence in predictor effects from those in the original model, reinforcing the necessity of model update for specific populations. However, this approach of coefficient updating presents the risk of overfitting, especially in scenarios with limited sample sizes, where adopting a previously developed model without modification might lead to poorer predictions for new patients. 16 The ideal is to strike a balance between adapting an existing model to new data and the potential overfitting risks associated with such modifications, which is essential for maintaining the clinical utility and relevance of any model in diverse patient cohorts and settings.
We utilized a closed testing procedure with likelihood ratio tests to determine the most effective method for model updating. We considered three update methods: recalibration in the large (re-estimation of the model intercept), recalibration (re-estimation of both intercept and slope), and coefficient update (retraining of all coefficients). 16 This method is important for systematic model updating, especially when dealing with limited sample sizes, to avoid overfitting while still enhancing model predictions. 1 –3,35
An important aspect of model updating is transparency in external validation studies. Researchers should clearly document whether and how they have updated a model when applying it to new cohorts. This practice is vital for the scientific community, allowing for a better understanding of the model’s adaptability and the effectiveness of various update methods. Detailed reporting on model updates can provide valuable insights into the model’s performance in different settings and guide future improvements. There is a pressing need for further development regarding the methodologies for evaluating and choosing model update methods. As our understanding of different patient populations and clinical conditions evolves, so too must our approaches to model updating. This involves not just refining existing methods but also exploring new, robust, and flexible approaches, such as machine learning techniques or Bayesian modeling. 36,37 These advancements will ensure that clinical prediction models remain accurate, reliable, and relevant in the ever-changing landscape of health care.
From a practical clinical perspective, our work provides some context as to why the application of IMPACT without cohort-specific updating might be less useful as applied to individual patients, for example, through the use of online calculators. We recommend that clinicians who chose to calculate IMPACT scores for their patients do so in the context of the entire clinical picture, rather than relying on this information in isolation. Without consideration of context, unadjusted IMPACT results risk providing potentially misleading prognostic estimates.
Limitations
Our work has a number of important limitations. First, the sample size in our cohorts was relatively small compared with some previous external validation studies using the IMPACT model, which range from 48 to 8509 individuals. 4,6 –15,21,22 Given the smaller sample size in our study, careful consideration was required to select the appropriate model update methods. As cohort size varies, investigators must tailor their recalibration and model update strategies to the properties of the cohort. Second, in our analysis, all model variants benefited from the coefficient update such that the updated models were selected over the traditional versions. This result opens the possibility that the coefficient updated model may exhibit overly optimistic predictions compared with other updating methods cannot be dismissed. Future considerations may include likelihood calculations that account for optimism, such as bootstrapping in the coefficient updated model. Another limitation is the lack of consensus in the field regarding the process for model updating. Exploring broader perspectives for model updating, such as Bayesian modeling, may offer alternative pathways to refine the IMPACT model. 38
Conclusion
We found that the original IMPACT model predicted 6-month mortality and poor outcome reasonably well in two modern North American TBI cohorts. When we updated the models based on our specific cohorts, that performance improved significantly. The field of clinical prediction modeling is at a critical juncture where there is an opportunity for the field to come to clearer consensus regarding a standardized way to update existing prediction models and to develop more accurate models to provide the most accurate estimates to support patients and their families after TBI.
Transparency, Rigor, and Reproducibility Statement
This secondary analysis detailed in this article was not formally registered before its conduct. One of the cohorts, the TXA study, was registered at ClinicalTrials.gov (NCT01990768). The PROTIPS study was not formally registered as it was an observational cohort study. The analytic plan for this analysis was not preregistered. The sample sizes were dependent on the available data from the two cohorts as detailed in the Methods section. As we were not evaluating an intervention, masking/blinding was not relevant.
Our statistical analysis was comprehensive, utilizing multiple imputation for missing data and applying advanced techniques such as proportional odds logistic regression and model recalibration. Effect sizes and confidence intervals have been reported in the main text for all outcomes. This approach not only addressed potential biases but also contributed to the robustness of our findings. The use of widely recognized software (R) and packages, alongside clear documentation of our methodologies, underscores our dedication to transparency and allows for the replication of our work. Upon publication, code for the analysis we conducted will be publicly available in a GitHub repository. Deidentified data from this study are not currently available in a public archive. Deidentified data from this study will be made available (as allowable according to IRB standards) by emailing the corresponding PIs of each cohort (TXA for TBI—S.R., PROTIPS—H.E.H.).
Footnotes
Acknowledgment
The authors extend their gratitude to Dr. Shannon McWeeney for her constructive feedback, which significantly contributed to the refinement of this article.
Authors’ Contributions
N.T. was responsible for conceptualization, methodology, data curation, visualization, formal analysis, writing—original draft preparation, and reviewing and editing. A.T.-E. was responsible for conceptualization, methodology, writing—reviewing and editing, and supervision. Y.I. was responsible for data curation, software, investigation, validation, visualization, and formal analysis. I.W. was responsible for data curation, visualization, investigation, validation, and formal analysis. A.R.F. was responsible for methodology, investigation, resources, funding acquisition, writing—original draft preparation, and reviewing and editing. H.E.H. was responsible for conceptualization, methodology, resources, writing—original draft preparation, reviewing and editing, visualization, supervision, project administration, and funding acquisition.
Author Disclosure Statement
The authors have no competing interest to disclose.
Funding Information
This work was supported by NINDS 1K23NS110828 for “Predictors of Low-risk Phenotypes after Traumatic Brain Injury Incorporating Proteomic Biomarker Signatures.”