




Abstract
An extensive library of symptom inventories has been developed over time to measure clinical symptoms of traumatic brain injury (TBI), but this variety has led to several long-standing issues. Most notably, results drawn from different settings and studies are not comparable. This creates a fundamental problem in TBI diagnostics and outcome prediction, namely that it is not possible to equate results drawn from distinct tools and symptom inventories. Here, we present an approach using semantic textual similarity (STS) to link symptoms and scores across previously incongruous symptom inventories by ranking item text similarities according to their conceptual likeness. We tested the ability of four pretrained deep learning models to screen thousands of symptom description pairs for related content—a challenging task typically requiring expert panels. Models were tasked to predict symptom severity across four different inventories for 6,607 participants drawn from 16 international data sources. The STS approach achieved 74.8% accuracy across five tasks, outperforming other models tested. Correlation and factor analysis found the properties of the scales were broadly preserved under conversion. This work suggests that incorporating contextual, semantic information can assist expert decision-making processes, yielding broad gains for the harmonization of TBI assessment.
Introduction
Self-reported symptom inventories are essential tools across clinical and research settings. 1 –6 Standard clinical practice for patients with mild traumatic brain injury (TBI) enacts a symptom-based approach to direct treatment, but documenting heterogenous symptoms is a complex process. 7,8 As a result, a wide variety of self-reported symptom inventories has been developed over time, each with distinct items, phrasings, use cases, and reference periods. 2 –6 To give one example, a recent report found at least nine different symptom inventories are used by athletic trainers to assess sports-related concussion. 9 Beyond TBI, hundreds of distinct symptom assessments are in common use, which undermines reproducibility and our capacity to synthesize findings drawn from distinct sources. 10
To alleviate this problem, clinicians who regularly use these instruments form expert panels to identify similar symptomatology across different instruments and cocalibrate results. 11 –14 This expert panel-based approach is labor-intensive, and its subjectivity can introduce noise and bias. 15 Despite expert panel efforts to identify standard definitions and controlled terminologies, only modest reductions in the variety of instruments have been achieved. 16,17 Meanwhile, the number of comparisons needed is large, 18 while efforts to harmonize inventories are slow, costly, and can involve hundreds of experts. 19
Supplementing human expertise with artificial intelligence (AI) tools has the potential to enhance diagnosis, reduce disease-related burden, and automate laborious processes. 20 –23 Beyond diagnosis, deep learning has the potential to assist with complex clinical and research processes where intuition and domain expertise are required. 24 These advances have renewed interest in various applications of transformer models to process clinical text by fine-tuning contextual embedding models on text semantics corpora, incorporating biomedical metadata using transformer embeddings, and testing various embeddings schema on biomedical source vocabularies. 25 –27
Here, we report an international collaboration between neuroscientists, clinicians, and AI experts to robustly link symptom inventories using semantic textual similarity (STS). Instead of relying on predictive models to estimate scores, our approach leverages the meaningful relationship between descriptions of symptoms to identify related content. 28
We demonstrate how pretrained natural language processing (NLP) models can offer a rapid and accurate means to quantify the relationships between thousands of symptoms across measures. We focus on four inventories, two that are commonly used to assess both TBI and general symptoms: The Brief Symptom Inventory-18 (BSI-18) and The Symptom Checklist-90-Revised (SCL-90-R), as well as two inventories specific to brain injury: The Neurobehavioral Symptom Inventory (NSI) and The Rivermead Post-Concussion Symptoms Questionnaire (RPQ). 2 –6 We prioritized TBI because it is frequently clinically assessed using self-reported symptom inventories. 7 In addition, TBI research lacks the consensus within the field that research into other conditions have achieved, perhaps due to the heterogeneity of TBI clinical presentation and the multitude of existing TBI instruments. 29
We hypothesized that an approach incorporating contextual semantic information would outperform traditional and machine learning models when tasked to predict participant scores on symptoms across different inventories. This hypothesis was based on our observation that the application of clinical intuition can sometimes better predict and explain trends in noisy medical data than pure learning models. Following AI safety and reporting requirements, 30,31 we tested this hypothesis by assessing the ability of semantically linked items to estimate cross-inventory symptom scores for thousands of patients with TBI who were dually assessed on different inventories. The resulting analysis pipeline is available as a free online tool (https://enigma-tools.shinyapps.io/symptom-inventories-calculator/) that can convert scores across previously incompatible symptom inventories. However, this tool is designed for research and testing purposes and is not currently tested for clinical use. This study presents a tangible example of how deep learning tools may help to mitigate long-standing health data compatibility issues in TBI research and practice as well as for general health assessments.
Methods
Inventory data sources
This secondary mega-analysis 32 study petitioned collaborators for item-level data, drawing from the Enhancing NeuroImaging Genetics Through Meta-Analysis Brain Injury working group 33,34 and the Long-term Impact of Military-relevant Brain Injury Consortium—Chronic Effects of Neurotrauma Consortium. 35 We also included public data from the Federal Interagency Traumatic Brain Injury Research Informatics System (FITBIR). 36 We obtained 16 datasets that included different combinations of symptom inventories (see Supplementary Table S1). Multiple examples of inventory items are provided in the results. Data quality and consistency were confirmed during discussions among authors who collected the primary data. The University of Utah provided overall institutional review board (IRB) approvals and data use agreements. All self-reported measures were completed or administered in English.
Measures
Comprehensive details of the four self-reported symptom inventories are provided in Supplementary Data S1. Briefly, we assessed two TBI-related inventories, the NSI 4 and the RPQ, 2,3 and two general symptom inventories commonly used for TBI: The 18-item BSI-18 5 and The SCL-90-R. 6
The 22-item NSI 4 evaluates cognitive, somatic, and emotional symptoms commonly experienced by adults following a brain injury, including headache, dizziness, irritability, and difficulty concentrating. Symptom frequency and severity are measured on a 5-point Likert-Scale, where the respondent indicates the degree to which they were disturbed by each symptom over the past two weeks from 0 (none) to 4 (very severe).
The 16-item RPQ 2,3 measures the presence and severity of commonly reported TBI symptoms, across somatic, cognitive, and emotional domains, including headache, dizziness, fatigue, irritability, and concentration difficulties. Using a 5-point Likert scale from 0 (not experienced) to 4 (severe problem), respondents are instructed to rate the severity of each symptom experienced within the past 24 h, relative to their experience of the symptom before injury.
The 18-item BSI-18 5 is a shortened version of the SCL-90-R and the original 53-item BSI. The BSI-18 is designed to efficiently and broadly assess psychological symptoms in both healthy and patient populations. The BSI-18 consists of items rated on a 5-point scale, ranging from 0 (not at all) to 4 (extremely), indicating how much the problems distressed or bothered respondents over the past 7 days. 5
The SCL-90-R 6 is a widely used self-report measure designed to assess the presence, severity, and frequency of 90 broad psychological symptoms and measures of emotional distress and, like the BSI-18, is not just specific to TBI. Respondents rate each item on a 5-point scale from 0 (not at all) to 4 (extremely), indicating how much they have been bothered or distressed by the symptom over the past week.
Semantic textual similarity
This study used the similarity of question-level text descriptions to identify related items across inventories. This is a challenging task because symptom descriptions can have similar meanings, yet share no words in common. For example, “Vision problems,” “blurring,” “trouble seeing,” and “Light sensitivity” all relate to vision/ocular symptoms, but they do not include the same words. Therefore, a traditional bag-of-words model that merely counts terms would not necessarily calculate these symptoms text as related (see Supplementary Data S2). Advancements in NLP have yielded tools that can rapidly score the semantic similarity of text, such as transformer models trained on a large corpus of text to encode and represent text strings within an embedded feature space. 37 –40 These approaches can represent text descriptions as feature vectors via pretrained embeddings which offers two main advantages: (1) Sentences of arbitrary length are converted to an embedded feature vector of prespecified length. This means different lengths of text can be directly compared as representations of prespecified length; and (2) sentences closer in the embedding space are more semantically similar, so the distance between feature vectors measures the meaningful similarity of text.
AI safety and reporting criteria
Modeling and usage were conducted in accordance with guidelines and quality criteria for deep learning research.
30,31
To protect patient privacy, models that were additionally trained on sensitive clinical operations data were not published online.
37
All models were developed as research tools and should not be used for decision-making in individual clinical cases. We followed eight recommended guidelines for reporting deep learning studies:
Data sources: All data sources are outlined in Supplementary Table S1.
Data preprocessing: Raw, unadjusted scores were used. Symptom inventories with one or more scores missing were excluded.
Partitioning: The same 50/50 train-test splitting of participants was performed for all models.
Disjointness: Participant data was fully disjoint to avoid duplicates across training and test data. Any repeated measurements over time for the same participants of the same inventory were dropped. When learning to convert numeric scores from one inventory to another, only one inventory type was permitted in the training data for all participants at a time, and only one test-inventory item was permitted as the target.
Models and Training: Four deep learning models were evaluated, each pretrained on different corpuses of general and medical text: (a) For the base model (MiniLMBERT), a pretrained Bidirectional Encoder Representations from Transformers (BERT) model was used. MiniLMBERT distilled the self-attention module of the last transformer layer of a large transformer
38
trained on several million sentence pairs.
39
This model is publicly available online.
40
Three other models pretrained on biomedical and clinical text were also evaluated: (b) ClinicalCovidBERT: A publicly available model pretrained on the CORD-19 medical dataset.
41
(c) VAClinicalDocsBERT: A clinically trained model that used ClinicalCovidBERT as a base, but with additional pretraining on 5,00,000 generic clinical operational documents from the Veterans Affair (VA) Corporate Data Warehouse (CDW
42
), including admissions and discharge summaries. (d) VAMetadataBERT: A medically trained model that used ClinicalCovidBERT as a base, with additional training on 1.5 million text strings of clinical lab names, medication names, and document titles from the VA CDW. Additionally, we included a traditional bag-of-words vector model using term frequency—inverse document frequency weighted vectors in order to compare conventional word counting schema against the semantic models.
Hyperparameters and Tuning: To improve reproducibility, no fine-tuning was performed. We did not change any of the weights of models at any stage to tune to symptom inventory content.
Model Selection: The four BERT models were evaluated by comparing their relative performance at the task of correctly converting scores across inventories. Given scores on one set of inventory items, the task was to estimate all scores on another, fully distinct, set of inventory items. The ground truth for this problem was two dually administered inventories per person. Performance was only evaluated on held-out test participants.
Model Metrics. The primary metric used in study was cosine similarity, S, which measures the semantic similarity of two symptom descriptions in the range 0–1. A value of 0 indicates the symptom descriptions share no meaningful similarity, while 1 means they have identical meanings. Given two output feature vectors A and B, cosine similarity is defined as the dot product of the two vectors divided by the product of their vector magnitudes, C = A·B/(|A‖B|). Higher cosine similarity means the relative angle between the vectors is closer in the feature space.
Model prediction performance was measured using mean absolute error (MAE), binary accuracy, and multinomial accuracy. Multinomial accuracy was defined as the percentage of estimated scores that equaled the correct symptom severity on a 5-point Likert scale. Although accuracies near 50% normally indicate poor performance, the random guess accuracy was 20% for accuracy on a 5-point scale. Multinomial accuracy was our preferred metric since it measures accuracy on the true scale, and also strongly correlates with MAE (see Supplementary Fig. S1).
Crosswalk model
A “crosswalk” refers to the process of relating items of one inventory to another. A conceptual overview of the model process is shown in Figure 1. First, the pretrained BERT transformer scored the similarity of symptom descriptions across inventories (Fig. 1A). For each item, its most similar item descriptions were found on other inventories.

Flowchart diagram of the STS crosswalk model.
The second step adjusted for differences in scale response across items (Fig. 1B). For example, on the BSI-18, “Mild” is defined as the second option on the 5-point Likert scale. In contrast, “Mild” is the third point on the Likert scale for the RPQ. Therefore, different raw scores imply the same symptom severity level. A percentile sampling approach was used to mitigate these differences which accurately captured empirical score distributions (see Supplementary Fig. S2). It is essential to capture the natural variance of scores found in real world data for the converted scores to have practical utility, particularly for implementing clinical cutoffs. Therefore, the model outputs were explicitly forced to be stochastic in ways that mimic the natural score variations found in real data. If items had no single close analogue on other inventories, multiple items were used for prediction (Fig. 1C). After model construction, performance was assessed by comparing estimated and actual inventory scores for dually administered assessments (Fig. 1D).
Statistical analysis
Analysis was performed in Python 3. Validation data required no covariate adjustment, as the same set of individuals were dually administered the same two inventories. Crossvalidation with 50/50 test train splitting was used to determine statistical variation of results. The sentence-transformers 40 Python package was used for text embedding, while the statsmodels 43 and scikit-learn packages 44 were used to construct linear and machine learning models, respectively. Specifically, we implemented three comparison models (OLS [ordinary least squares regression], RF [random forest], GB [gradient boosting]). The number of tree estimators was set to 200 for GB and RF to improve performance. Confirmatory factor analysis was implemented using the factor-analyzer package.
For prediction, we define A and B to be two dually administered assessments. The goal was to predict a single item in B, named b, given all items in A. Various strategies were explored to predict scores across inventories, including OLS, 1-NN (nearest neighbor), 3-NN, 5-NN, and a weighted approach that used all variables and the STS similarity scores as weights of relative item importance in the model. Overall, a 1-NN approach produced superior results on the test data. The nearest-neighbor approach selected only the most semantically similar item in A, a = argmax[S(A,b)], to predict b, excluding all other scores. The model did not use any score frequency or distribution information to link items.
Results
Data summary
Table 1 summarizes characteristics of the cohort (n = 6,607). The cohort showed good representation across age, sex, education level, race, ethnicity, and TBI status. In terms of injury severity, 1,159 participants (17.5%) were controls with no history of TBI, 5,400 participants (81.7%) had a history of mild TBI, and just 48 participants (0.7%) had a history of moderate/severe TBI. Across all participants, the median age was 29 years old, with an interquartile range of 20–43 years, and 29.4% were female. Using appropriate scoring schema, the means (and standard deviations) of total scores were BSI-18: 8.86 (10.52), RPQ: 17.49 (14.83), SCL-90-R: 70.5 (67.21), and NSI: 25.5 (16.95). An overlapping sample of the same participants (n = 2,056) was administered both the BSI and RPQ as part of the same site visit assessment; these included 286 controls.
Descriptive Characteristics for the Cohort by Measure
Indicates overlapping n = 2,056 administration.
BSI-18, Brief Symptom Inventory–18; NSI, Neurobehavioral Symptom Inventory; RPQ, Rivermead Post-Concussion Symptoms Questionnaire; SCL-90-R, Symptom Checklist-90-Revised; TBI, traumatic brain injury.
Semantic textual similarity
Initial analysis was performed using the general language model, MiniMLBERT. Illustrative examples of MiniMLBERT symptom similarities are shown in Table 2 for symptom pair comparisons. Figure 2 shows a stem plot of cosine similarities for one RPQ symptom, “Nausea and/or vomiting,” compared with all BSI-18 symptom descriptions. Most of the 18 BSI-18 items were classified as conceptually unrelated to the item, but “Nausea or upset stomach” was strongly related. As these two items had maximum similarity, they formed one cross-inventory pair. Conversely, the model did not link unrelated items, even if they contained overlapping words (see Supplementary Data S2).

Semantic textual similarity (STS) of symptoms. A stem plot shows the cosine similarity of the RPQ symptom “Nausea and/or vomiting” with the 18 symptoms assessed by the BSI-18. BSI-18, Brief Symptom Inventory–18; RPQ, Rivermead Post-Concussion Symptoms Questionnaire.
Example Comparisons of Symptoms Ranked by Semantic Similarity Using Two Methods: TF-IDF and STS
Small changes have been made to protect instrumental integrity. Overlapping words are shown in bold. Unlike the TF-IDF cosine similarity scores, the STS cosine similarity scores robustly mirror symptom pair relatedness.
STS, semantic textual similarity; TF-IDF, term frequency-inverse document frequency.
To extend beyond single examples, Figure 3 shows the similarity scores of all items across all inventories (NSI, SCL-90-R, BSI-18, and RPQ), sorted and color-coded by cross-inventory comparison. The SCL→BSI comparison had 18 near-identical item pairs (cyan stars, top). This means that the BSI-18 was effectively a semantic subset of the SCL-90-R, as would be expected given the BSI-18 uses items from the SCL-90-R. In this way, STS can rapidly screen for closely related items across inventories, regardless of whether these relationships are established or not in the literature.
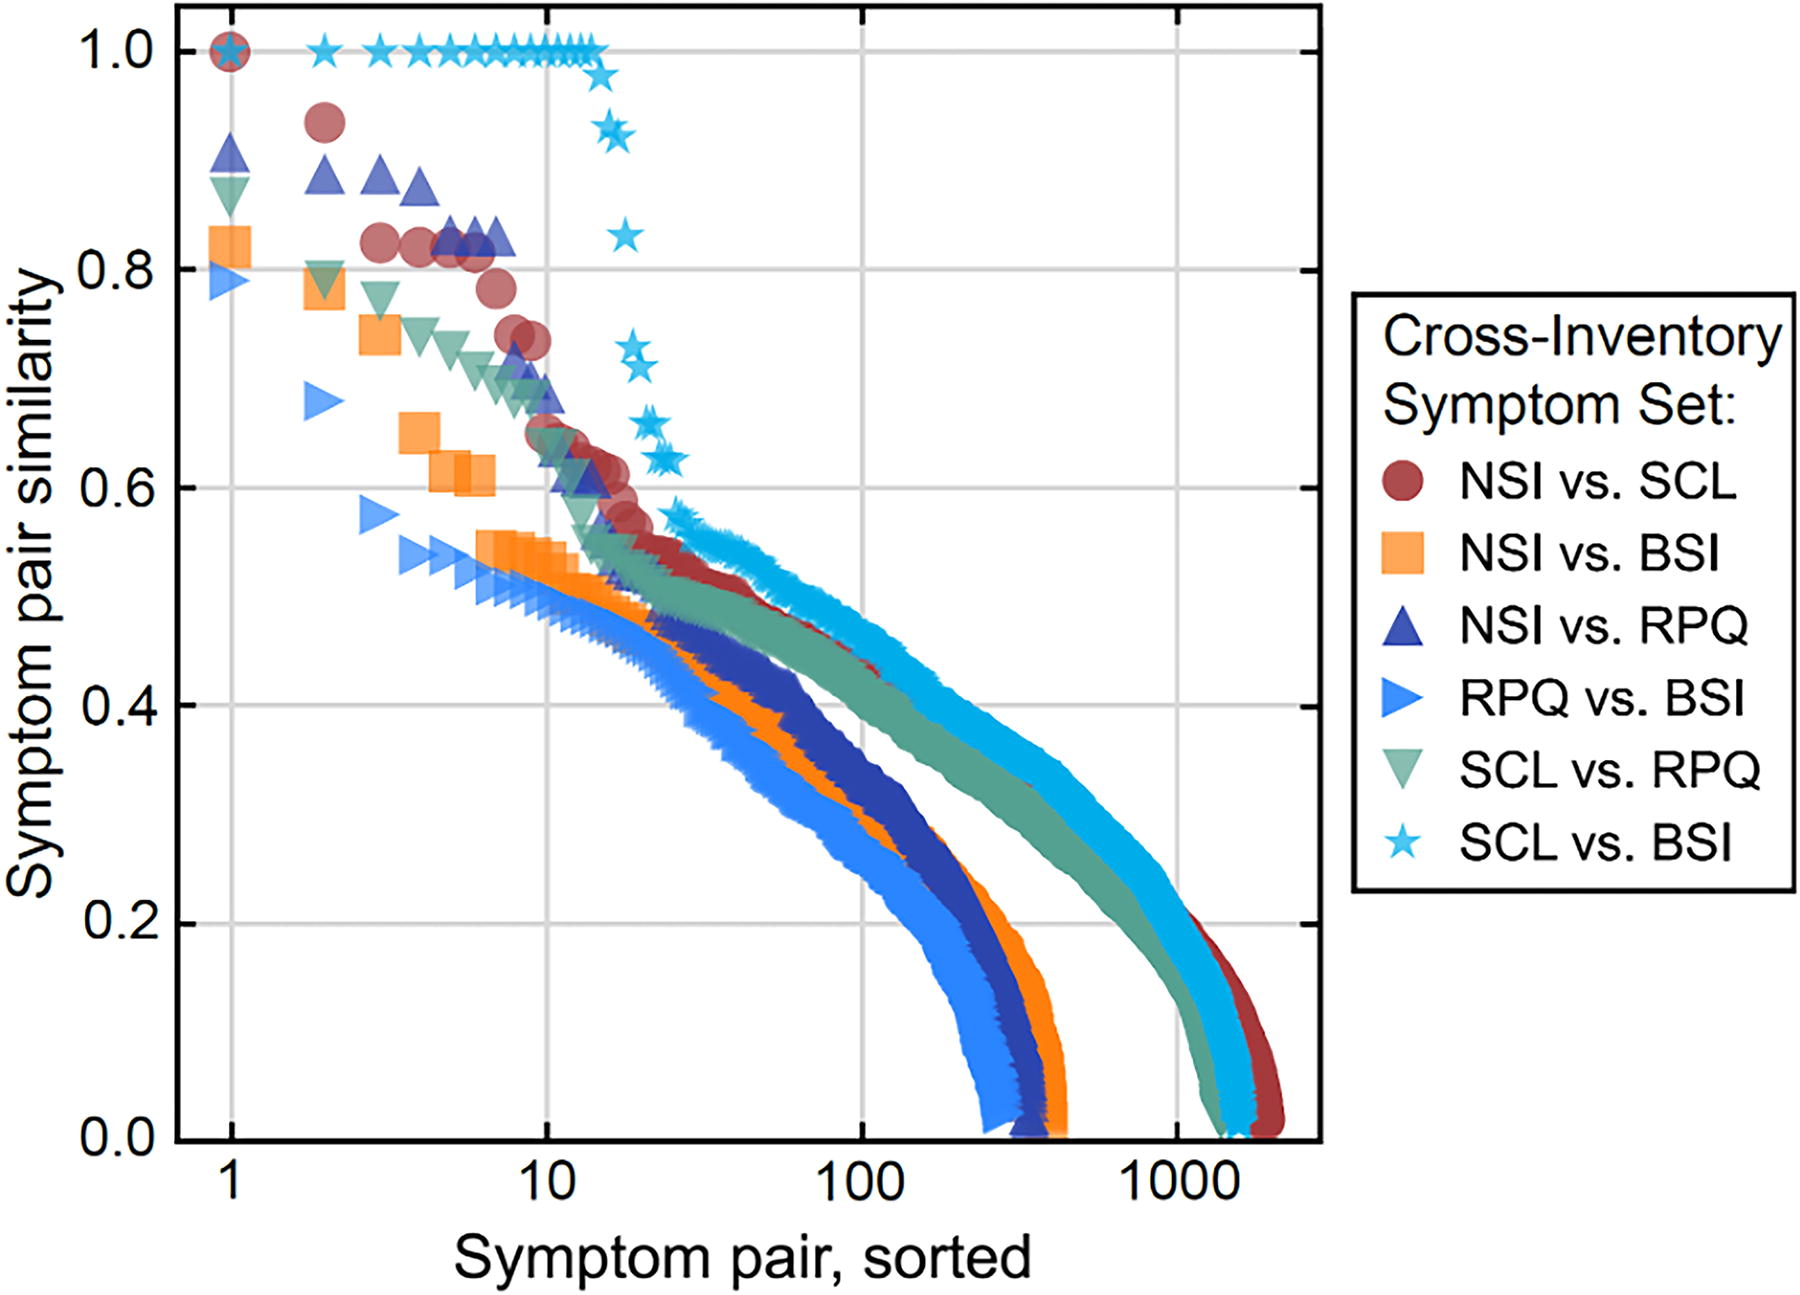
Similarity of symptom pairs across all inventories. The semantic textual similarities for all items across the NSI, SCL-90-R, BSI-18, and RPQ are shown sorted and color-coded by inventory pair. Semantically related items are embedded in a large background of unrelated symptomatology; for example, the BSI-18 is a subset of the SCL-90-R, so there are 18 near-identical SCL-BSI similarity scores (cyan stars, top). BSI-18, Brief Symptom Inventory–18; NSI, Neurobehavioral Symptom Inventory; RPQ, Rivermead Post-Concussion Symptoms Questionnaire; SCL-90-R, Symptom Checklist-90-Revised.
To assess the semantic similarity of different inventories in aggregate, the distribution of closest-pair cosine similarities was found for each inventory pair (Fig. 4). Overall, 41.7% of the closest pairs were S > 0.6, indicating that many single symptoms had close analogues in other inventories. When considering aggregate similarity across inventories, directionality matters (i.e., A→B vs. B→A). The NSI and RPQ, both TBI-related inventories, contained similar content, whereas the NSI and BSI-18 showed relatively low median similarity.
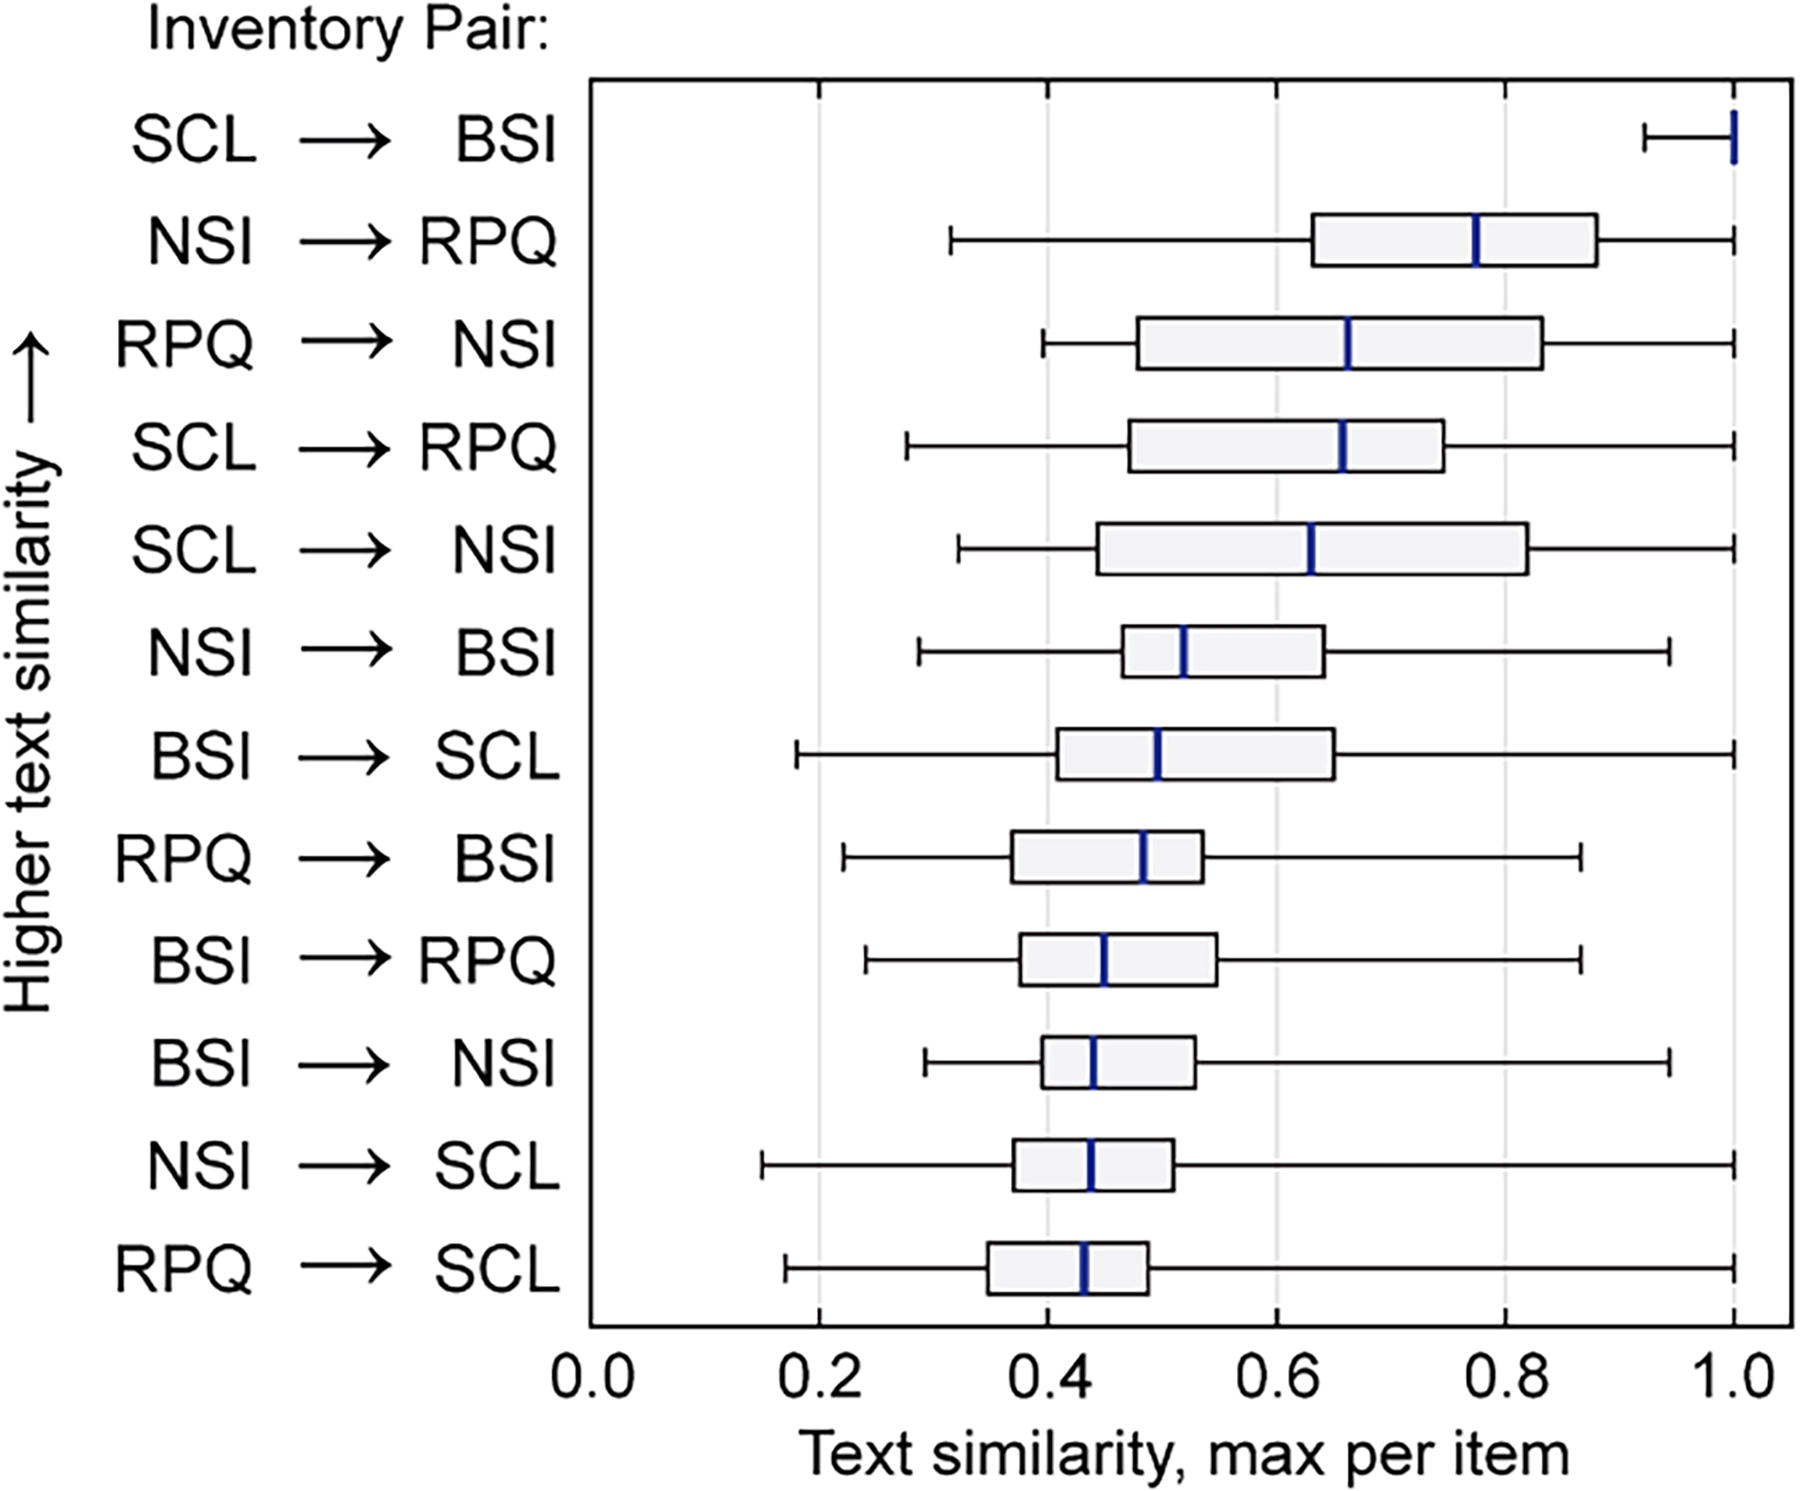
Quantifying the similarity of symptom inventories. Boxplots show the distribution of maximum semantic textual similarities of symptoms broken out for each inventory crosswalk in both directions. Overall, 5 of the 12 inventory comparisons showed maximum linked text similarity medians of 0.6 or higher. BSI-18, Brief Symptom Inventory–18; NSI, Neurobehavioral Symptom Inventory; RPQ, Rivermead Post-Concussion Symptoms Questionnaire; SCL-90-R, Symptom Checklist-90-Revised.
Inventory score prediction
Before implementing cross-inventory models, within-inventory score prediction was implemented to assess the ability to convert scores in the absence of cross-inventory effects (Supplementary Fig. S3). Within-inventory models used data for all items in a given inventory (except one) as explanatory variables to estimate scores on the single, reserved item. As these experiments were not subject to any cross-inventory effects (e.g., differences in administration or scoring), they set a plausible limit on the accuracy free of cross-inventory effects. The average prediction accuracy was 57.2% for within-inventory estimation of BSI-18 and RPQ.
Figure 5 shows the cross-inventory prediction accuracies for four different models: (1) STS, (2) linear regression, (3) random forest, and (4) gradient boosting. The data included n = 2,056 individuals who were administered both the RPQ and BSI-18, split randomly into 50/50 test-train groups (designating n = 1,028 held out test participants). Only RPQ items were used to estimate BSI item scores (RPQ→BSI-18, gray circles), and only BSI-18 items used to estimate RPQ item scores (BSI-18→RPQ, white circles). The STS model (blue line) achieved 54.3% multinomial accuracy when predicting scores across inventories, consistently outperforming the benchmark models across a wide range of symptoms, and reaching close to the average expected accuracy on within-inventory score estimation when no cross inventory effects or related processes are required (57.2%).

Cross-inventory symptom prediction. Cross-inventory accuracies are shown for the semantic textual similarity (STS) model, alongside three comparison models. Predictions were tested with 50/50 test-train splitting of n = 2,056 subjects who were all dually administered both the RPQ and BSI. Only RPQ items were used to estimate BSI item scores (RPQ→BSI, right gray circles), and only BSI items were used to estimate RPQ item scores (BSI→RPQ, right white circles). The nonclinical semantic model (blue line) achieved 54.3%, significantly (p < 0.001) outperforming all other benchmark approaches. Within measure OLS score prediction accuracies are shown as gray bars. GB, gradient boosting; OLS, ordinary least squares regression; RF, random forest.
Model performance
Benchmark models were evaluated by comparing their relative performance at cross-inventory symptom score conversion for five different multinomial and binary classification tasks (Table 3).
Cross-Inventory Model Accuracies for Right Models
Four benchmark models, linear regression, gradient boosting, random forest, and term frequency−inverse document frequency (TF-IDF), and four pretrained variants of semantic models were evaluated for accuracy under different scenarios. The models are assessed under five different scenarios: Prediction of binary classification at all four possible threshold scores (0, 1, 2, 3), and multinomial accuracy. Predictions were tested with 50/50 test-train splitting of n = 2,056 subjects who were all dually administered both the RPQ and BSI. The model trained on generic, nonmedical text (MiniLMBERT) performed with the highest accuracy overall (74.8%), although linear regression performed optimally at some thresholds. MiniLMBERT also performed optimally on the clinically useful multinomial metric, which does not presuppose a specific score threshold (t).
BSI-18, Brief Symptom Inventory–18; RPQ, Rivermead Post-Concussion Symptoms Questionnaire; TF-IDF, term frequency-inverse document frequency.
Maximum scores shown in bold for the multinomial and average metrics.
Overall, the MiniLMBERT model trained on a general corpus of text showed the highest accuracy, 74.8%, when averaged across all scenarios, consistently outperforming the three clinically pretrained transformers (72.9–73.8%). MiniLMBERT also achieved 54.3% on the more challenging multinomial prediction task, outperforming all benchmark models (40.6–48.0%), and the three other medically pretrained transformers (52.0–53.2%). These results persisted under 30-fold 50/50 test/train splitting, and a large effect (d = 27.73) between MiniLMBERT performance and the best-performing non-STS (OLS) model was found under repetition (Supplementary Fig. S2). Correlation and factor analysis found the properties of the measure scales and subscales were broadly preserved under conversion (see Supplementary Data S3: Correlation and Confirmatory Factor Analysis). The symptom inventory conversion tool is available as a web interface (see Supplementary Fig. S4).
To explore whether model efficacy varied across sex, MiniLMBERT performance was stratified for dually administered male (N = 1,349) and female (N = 707) participants. The model predicted female symptoms with 6% lower accuracy than male symptoms, equivalent to an effect size of d = −0.43 (p < 0.001). Relatedly, only 14.7% of the training cohort were female. An age-stratified performance evaluation was conducted for two groups of dually administered participants: aged 65 years or above (N = 190) and aged below 65 years (N = 1,866). Interestingly, symptoms were more accurately predicted for the elderly group (61.7%) than for those below 65 years of age (53.4%, p < 0.001).
Discussion
Providers often use standard inventories for initial evaluation and tracking of TBI symptoms. However, comparing results across distinct symptom inventories is challenging due to subtle differences in how symptoms are described, assessed, and conceptualized. These differences confound the aggregation of data and findings across clinical and research settings and limit comparison between historical and current studies. To address this problem, this study reported a novel application of language models to rapidly and accurately link items and scores across self-reported symptom inventories.
We tested four semantic symptom-linking models on data for thousands of individuals who each completed two different symptom inventories. Overall, a deep learning model trained on a general text corpus showed the highest accuracy, which confirmed our hypothesis. The superior performance of the generic language model over clinically pretrained models is consistent with the straightforward language inventories used to describe symptoms. Although the general text semantic model showed the best performance overall, model performance varied considerably across individual items.
One issue when comparing symptom inventories is that their content can overlap. For example the BSI-18 is a short version contained in the SCL-90. Initially considered a potential challenge for the work, the existence of direct analogues across inventories was valuable because they provided identical semantic ground truths across inventories. This facilitated the direct observation of the effects of different inventory scoring schemes and scales for otherwise identical items.
This study also offers useful insights into the nature of TBI-related symptomatology and measurement. Many studies conduct multiple inventory assessments to more completely capture a wide range of potential patient experiences. Semantic insights could help to guide and optimize the selection of complementary instruments. Across inventories, about two-thirds of the NSI and RPQ symptoms were strongly related, confirming that they were semantically similar assessments, which was anticipated since both assess TBI. By contrast, those wishing to pair a general and TBI specific inventory could consider the NSI and BSI-18, as they had lower average similarity than other inventory pairs. Beyond existing inventories, deep learning text similarity paradigms might also be able to assist in the development of new, abbreviated questionnaires that more precisely assess distress, and one could imagine a synthetic superscale that draws semantically from all inventories.
Although “harmonization” commonly refers to data aggregation and cleaning, true data harmonization aims to minimize unwanted measurement variations while preserving the underlying meaning of the measures of interest. The central goal of this study was to use harmonization techniques to produce online resources that can link scores across previously incompatible inventories. However, in the course of developing a deep learning pipeline for cross-walking across symptom inventories, we observed that the STS model did not always link items with the highest empirical correlation on scores. Instead, it detected and leveraged subtle relationships between symptom phrasings and, in doing so, exceeded the performance of other empirically trained linear and machine learning models. The current finding that the similarity of text describing symptoms was generally more useful than training on empirical data is surprising. One explanation for why transformer models leveraging semantic similarity have an advantage over shallow baselines such as bag-of-words is because the diversity of terms used in clinical text is large but quite general. This is consistent with recent reports where a majority of top-ranking systems make use of transfer learning to outperform traditional baselines. 45
Many studies using AI in medicine have demonstrated impressive gains in diagnostic accuracy, but the diagnostic labels needed to train machine learning models are often assigned using clinical evaluation tools with long-standing data compatibility issues. This is doubly true in TBI research where case definitions are often unclear. This study leveraged AI to address a fundamental decision-focused task—the harmonization of clinical measurements. If deep learning can be used to improve the quality of tools that assign training data labels, then it may be possible to achieve further, untapped gains in accuracy across a range of health-related learning tasks.
Strengths and limitations
Strengths of this study include a large, aggregated sample drawn from 16 data sources, high-quality dually administered test data, evaluation of multiple models trained on different medical and general text sources, and detailed investigations of both disease-specific and general symptom inventories. Other strengths include a close collaboration between methodologists and clinical experts that ensured patient safety, privacy, and careful adherence to recommended AI reporting criteria, and both data and code are made available.
There are some limitations of the current study worth noting. First, three or more inventories per participant were unavailable. We also did not adjust for symptom validity. Three of the inventories use distinct reference time frames, and differences in administration were not considered. However, since the method was nearly as accurate when estimating scores across, compared with within, inventories, cross-assessment effects were largely mitigated. Fourth, the data were drawn from 18 English language sources, including both military and civilian datasets. Therefore, the findings may not generalize to specific populations. However, insofar as this was tested, stratifying the results by age and sex showed only modest variations in performance.
Choice of model comes with relative benefits and costs, including potential loss of human interpretability. Simple models such linear regression afford clear coefficients and interpretability. Conversely, why STS models link certain item pairs and not others may be difficult to interpret. In some scenarios, more interpretable models may be advantageous, for example if explainability of the model process, rather than optimization of overall conversion accuracy is not the primary objective. Inventories do not capture all elements of personal experience, and some may even systematically screen out or inadequately capture meaning. The extent to which crosswalk tools incur related loss of information regarding the patient’s experience should be studied. The finite number of items available per instrument constrains the accuracy of crosswalks. To address this, future work could explore extensions using reinforcement learning through human feedback to learn an optimal process for handling items that have low semantic similarity.
Future development of the model to specifically target underperforming item conversions could help to improve overall model performance. For example, a single item in an inventory can potentially correlate with multiple items in another, but some items may have no close analogue or correlating item on another instrument. Further work is needed to explore whether one-to-many relationships could resolve this issue using multivariate models that aggregate information from multiple weak correlated predictors. Only inventories with 5-point scales were used, but there is no reason why this approach could not be extended to inventories with different numeric scales. Nevertheless, this study utilized one of the largest samples of symptom inventory data in TBI yet assembled and focused upon the most widely used and recommended measures in the field. 46 –48
Footnotes
Authors’ Contributions
Original data were collected by M.T., M.R.N., R.A.M., D.F.T., W.S.C.W., and E.A.W. E.K., E.L.D., E.A.W., D.F.T., F.G.H., K.D.O., H.M.L., and S.W.L. conceived of the project. E.L.D. and H.M.L. compiled and cleaned the data. E.K., S.V., K.S.P., and R.A. completed the processing and analysis. E.K. wrote and revised the article, and all authors reviewed, edited, and approved the article.
Data Availability
We included 16 different sources of data in this study. Of these, 6 data sources are freely available online as part of the FITBIR data repository, hosted at  . The other 10 datasets are available from the corresponding author upon reasonable request, pending IRB approval for dissemination of data, and additional institutional approval of data use and access.
Code Availability
Disclaimer
The views expressed in this article are those of the author(s) and do not reflect the official policy of the Department of Army/Navy/Air Force, Department of Defense, or U.S. government.
Author Disclosure Statement
None of the authors have competing interests relevant to this article. N.J. and P.M.T. received a research grant from Biogen, Inc., for research unrelated to this article. T.B.M. receives compensation as a member of the Clinical and Scientific Advisory Board for Quadrant Biosciences, Inc. V.N. holds a grant from Roche Pharmaceuticals for a project unrelated to this article. A.O. is a cofounder and owner of Nordic Brain Tech AS.
Funding Information
This work was supported by R61NS120249 to E.L.D., E.A.W., F.G.H., and D.F.T.
Supplementary Material
Supplementary Data S1
Supplementary Data S2
Supplementary Data S3
Supplementary Figure S1
Supplementary Figure S2
Supplementary Figure S3
Supplementary Figure S4
Supplementary Table S1
Supplementary Table S2
References
Supplementary Material
Please find the following supplemental material available below.
For Open Access articles published under a Creative Commons License, all supplemental material carries the same license as the article it is associated with.
For non-Open Access articles published, all supplemental material carries a non-exclusive license, and permission requests for re-use of supplemental material or any part of supplemental material shall be sent directly to the copyright owner as specified in the copyright notice associated with the article.
