




Abstract
Following spinal cord injury (SCI), there is a short-lived recovery phase that ultimately plateaus. Understanding changes within the spinal cord over time may facilitate targeted approaches to prevent and/or reverse this plateau and allow for continued recovery. Untargeted metabolomics revealed distinct metabolic profiles within the injured cord during recovery (7 days postinjury [DPI]) and plateau (21 DPI) periods in a mouse model of severe contusion SCI. Alterations in lipid metabolites, particularly those involved in phospholipid (PL) metabolism, largely contributed to overall differences. PLs are hydrolyzed by phospholipases A2 (PLA2s), yielding lysophospholipids (LPLs) and fatty acids (FAs). PL metabolites decreased between 7 and 21 DPI, whereas LPLs increased at 21 DPI, suggesting amplified PL metabolism during the plateau phase. Expression of various PLA2s also differed between the two time points, further supporting dysregulation of PL metabolism during the two phases of injury. FAs, which can promote inflammation, mitochondrial dysfunction, and neuronal damage, were increased regardless of time point. Carnitine can bind with FAs to form acylcarnitines, lessening FA-induced toxicity. In contrast to FAs, carnitine and acylcarnitines were increased at 7 DPI, but decreased at 21 DPI, suggesting a loss of carnitine-mediated mitigation of FA toxicity at the later time point, which may contribute to the cessation of recovery post-SCI. Alterations in oxidative phosphorylation and tricarboxylic acid cycle metabolites were also observed, indicating persistent although dissimilar disruptions in mitochondrial function. These data aid in increasing our understanding of lipid metabolism following SCI and have the potential to lead to new biomarkers and/or therapeutic strategies.
Introduction
Spinal cord injury (SCI) is a debilitating condition with deleterious consequences, including loss of function or paralysis, chronic pain, and decreased life expectancy. There are approximately 305,000 individuals in the United States currently living with SCI and an incidence of 18,000 new cases per year. 1 Treatment and rehabilitation following SCI are extensive and expensive, requiring a multidisciplinary approach often including surgical intervention, treatment for sensory, motor, and autonomic dysfunction, and often lifelong home treatment. 2 As such, the cost of care for a patient can be over $5 million, making SCI a detrimental condition for the individuals, their caregivers, and the health care system in general.
Although a certain degree of recovery is expected following SCI, the majority of this recovery takes place within the first 9–12 months, after which recovery stalls, reaching a plateau around 12–18 months after injury. 3,4 A similar effect is observed following SCI in mice, in which studies regularly report the existence of a period of initial recovery that plateaus around 2 weeks postinjury. 5 Understanding the physiological differences within the spinal cord during recovery and plateau phases could allow for targeted approaches aimed at preventing and/or reversing this effect, enabling continued improvement following injury.
Metabolomics is a large-scale analysis of metabolites in biological specimens that can be used to explore biomarkers, as well as underlying consequences/mechanisms of diseases and therapeutic strategies. 6,7 Trauma to the spinal cord disrupts metabolic processes, including amino acid, lipid, and energy metabolism, which is thought to hinder regeneration and recovery postinjury. 8,9 As such, metabolic profiling following SCI has recently garnered interest. 8 –12 To our knowledge, however, no studies exist comparing metabolic profiles across different phases of disease progression. To address this, this study utilized metabolomics to characterize the metabolic profile within the injured cord in vivo during the recovery and plateau periods post-SCI.
Materials and Methods
Animals and SCI model
All studies were approved by the Institutional Animal Care and Use Committee of the University of Arizona in accordance with the guidelines set forth by the National Institutes of Health Guide for the Care and Use of Laboratory Animals. Female wild-type C57Bl/6J mice 7–8 weeks of age were obtained from The Jackson Laboratories (Bar Harbor, ME), housed in groups of 3–5 in temperature-controlled conditions under a light/dark photocycle with food and water ad libitum, and allowed to acclimate for 7 days before use. Mice were randomized into sham and SCI groups, and laminectomy of the T11 was performed as described previously. 13 Animals were anesthetized with 10 mg/kg of ketamine and 6 mg/kg xylazine via intrapintraperitoneal (i.p.) injection. The vertebral column was clamped and stabilized at the upper thoracic and lumbar levels, and a controlled contusion with a force of 80 kilodynes (kdyn) was administered using the Infinite Horizon IH-0400 impactor (Lexington, KY) with the dura intact. Sham mice received laminectomy only. Manual bladder expression was performed twice daily until functional recovery. The animals used here were administered <1%Dimethylsulfoxide (DMSO)/saline daily, as concurrent pharmacology studies were carried out during these experiments. No antibiotics or analgesics were administered postsurgery. Groups were euthanized 7 or 21 days postinjury (DPI) via anesthesia overdose and spinal cords collected and flash frozen.
Locomotor capability assessment
Locomotor capability was assessed using the 10-point (0–9) Basso Mouse Scale (BMS) 14 by a blinded observer. Each mouse was observed for 3 min, with bladder expression taking place before assessment. Animals were observed 24 h after surgery and every other day thereafter until euthanasia. Sham animals maintained a BMS score of 9 throughout the experiment.
Metabolomics dataset
Approximately 25 mg of thoracic spinal cord centered on the injury site (∼1.5 cm rostral–caudal tissue length) was snap frozen and stored at –80°C until transfer to Metabolon Inc. (Durham, NC, USA) for sample preparation 15 and analysis. The metabolomic profiles were assessed by Metabolon Inc. using an untargeted mass spectrometry (MS)-based approach, allowing for the identification of 715 named metabolites through liquid and gas chromatography, both combined with MS (LC/MS and GC/MS, respectively). Only features of known identity were analyzed. Metabolites with more than 10% missing values were removed, leaving 650 metabolites. These features were divided by Metabolon Inc. into super pathways, including lipid-, amino acid-, and carbohydrate-related metabolites, which were further divided into various subpathways. The remaining missing data were imputed using one-fifth of the minimum positive value of each variable through MetaboAnalyst software. 16 Data were filtered using a 25% interquartile range, and raw peak intensities were subjected to log transformation and auto-scaling, to reduce biases due to highly variable metabolites’ range. After initial metabolomic analyses, lipidomic analysis was exclusively performed on lipid metabolites using MetaboAnalyst and BioPAN software. 17
BioSpyder TempO-Seq
RNA was isolated from the injury site of a separate cohort of mice using TRIzol extraction as per the manufacturer’s protocol (Invitrogen, Waltham, MA), followed by purification using Qiagen RNeasy MinElute Cleanup Kit (Hilden, Germany) as described previously. 18 Isolated RNA was then combined with lysis buffer provided by BioSpyder (Carlsbad, CA) and samples annealed to match pairs of detector oligos each targeting a single gene with a detector oligo pool specific to the mouse transcriptome. After annealing, excess oligos were removed by nuclease digestion, and the annealed oligos ligated to form amplifiable templates. These ligated oligos were then amplified with one pair of primers with a different combination of tag sequences assigned to each sample. The products were pooled into a sequencing library, which was purified and run on an Illumina Next-Gen Sequencer to count the number of sequences per sample. The resulting sequencing read counts from the library were then analyzed to determine the abundance of each phospholipase A2 (PLA2) gene in each sample. 18,19
Immunoblot
Protein was extracted from the spinal cords from a separate cohort of mice using radioimmunoprecipitation assay (RIPA) buffer with protease inhibitor cocktail (1:100), 1 mM sodium fluoride, and 1 mM sodium orthovanadate (Sigma-Aldrich, St. Louis, MO) as described previously. 20 Protein was quantified using a bicinchoninic acid assay, and 10 µg of protein was separated via electrophoresis using 4–15% sodium dodecyl sulfate–polyacrylamide gel electrophoresis (SDS-PAGE) gels, then transferred to nitrocellulose membranes (Bio-Rad, Hercules, CA). Membranes were blocked in 5% bovine serum albumin (BSA) in Tris-Buffered Saline with Tween 20 (TBST) and incubated overnight with primary antibodies with constant agitation at 4°C. Membranes were incubated with the appropriate horseradish peroxidase-conjugated secondary antibody and visualized using chemiluminescence (Thermo Scientific, Waltham, MA) on a GE ImageQuant LAS4000 (GE Life Sciences, Pittsburgh, PA). Optical density was determined using Image Studio Lite software. Primary antibodies used were p-cPLA2, cPLA2 (1:1000, Cell Signaling), and α-tubulin (1:10,000, Abcam).
Statistical analysis
Tissue isolated from a single animal or a single animal’s behavior represented n = 1. All analyses were performed on n ≥ 6 mice per group. Significantly altered metabolites were identified with MetaboAnalyst using one-way analysis of variance (ANOVA) with a false discovery rate cutoff of 0.05, followed by Tukey’s honestly significant difference (HSD) post hoc test. For molecular assessments, and to confirm significance of select metabolites pictured, differences between three or more groups were analyzed using one-way ANOVA followed by Tukey’s post hoc test. In all cases, GraphPad Prism software (La Jolla, CA) was used, and unless otherwise indicated, different letters signify statistically significant differences between mean values with a p < 0.05.
Results
Differences in metabolic profile of the injured cord across time
Female mice were subjected to a severe 80 kdyn force-controlled impactor-induced contusion model of SCI as described previously. 18,21 Locomotor capability was assessed using the BMS, a 10-point scale ranging from complete paralysis (0) to normal hindlimb function (9), 14 beginning 24 h after injury and continuing every alternate day thereafter for 21 DPI. As expected, injured mice displayed complete hindlimb paralysis 24 h post-SCI, and sham controls maintained normal function for the duration of the study. Similar to that reported previously, injured mice experienced a period of locomotor recovery during the first 11 DPI, ultimately reaching a BMS score of ∼2, after which function plateaued through 21 DPI 13,20,21 (Fig. 1A). Based on these locomotor data, the metabolic profile was assessed within the injured cord 7 DPI and 21 DPI to decipher the metabolic changes that underlie the transition from recovery to plateau phases. Using univariate one-way ANOVA analysis, 367 of the 650 metabolites analyzed (56.5%) were deemed statistically different between the sham, 7 DPI, and 21 DPI groups. Of these, over 50% of lipid-, amino acid-, and carbohydrate-related features were found to be different between groups (Fig. 1B). The complete list of altered metabolites within each super pathway can be found in Supplementary Table S1.
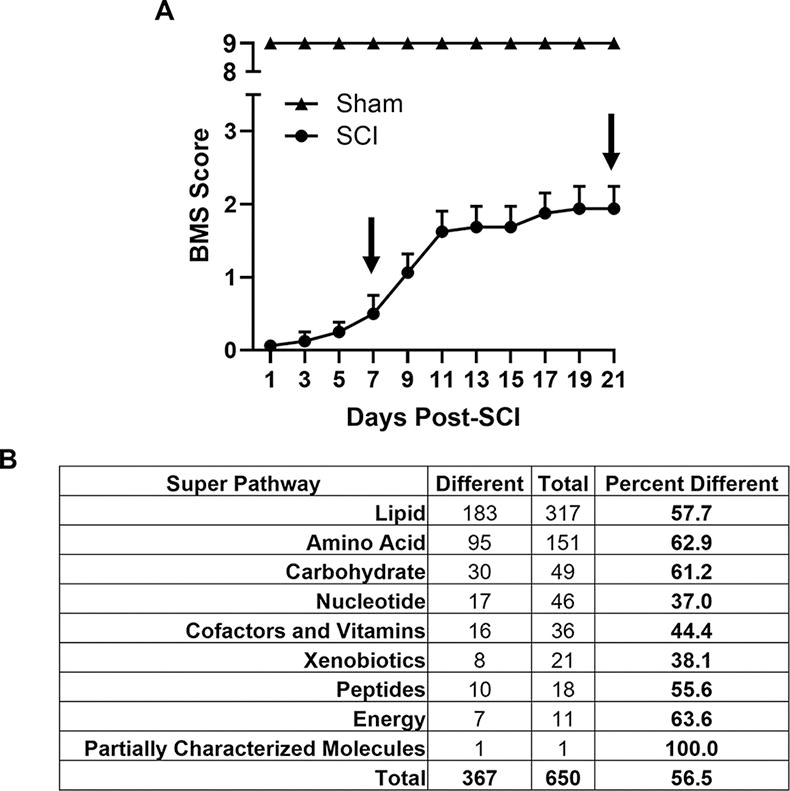
Metabolic profile of the injured cord across time.
Partial least squares-discriminant analysis (PLS-DA), a supervised principal component analysis that considers grouping when assessing variability, revealed a noticeable separation between sham, 7 DPI, and 21 DPI groups, indicating significant differences in metabolic profile (Fig. 2A). A critical measurement in PLS-DA is the variable importance in projection (VIP) score, which estimates the importance of each metabolite on the model, thereby describing its overall contribution to the separation observed between groups. Analysis of VIP scores revealed an abundance of lipid metabolites within the top 25, particularly phospholipids (PLs) and lysophospholipids (LPLs), suggesting that lipid metabolism is strongly contributing to the altered metabolic profiles observed across groups (Fig. 2B). Cross validation of PLS-DA indicated that the model did not overfit data and can be found in Supplementary Figure S1.
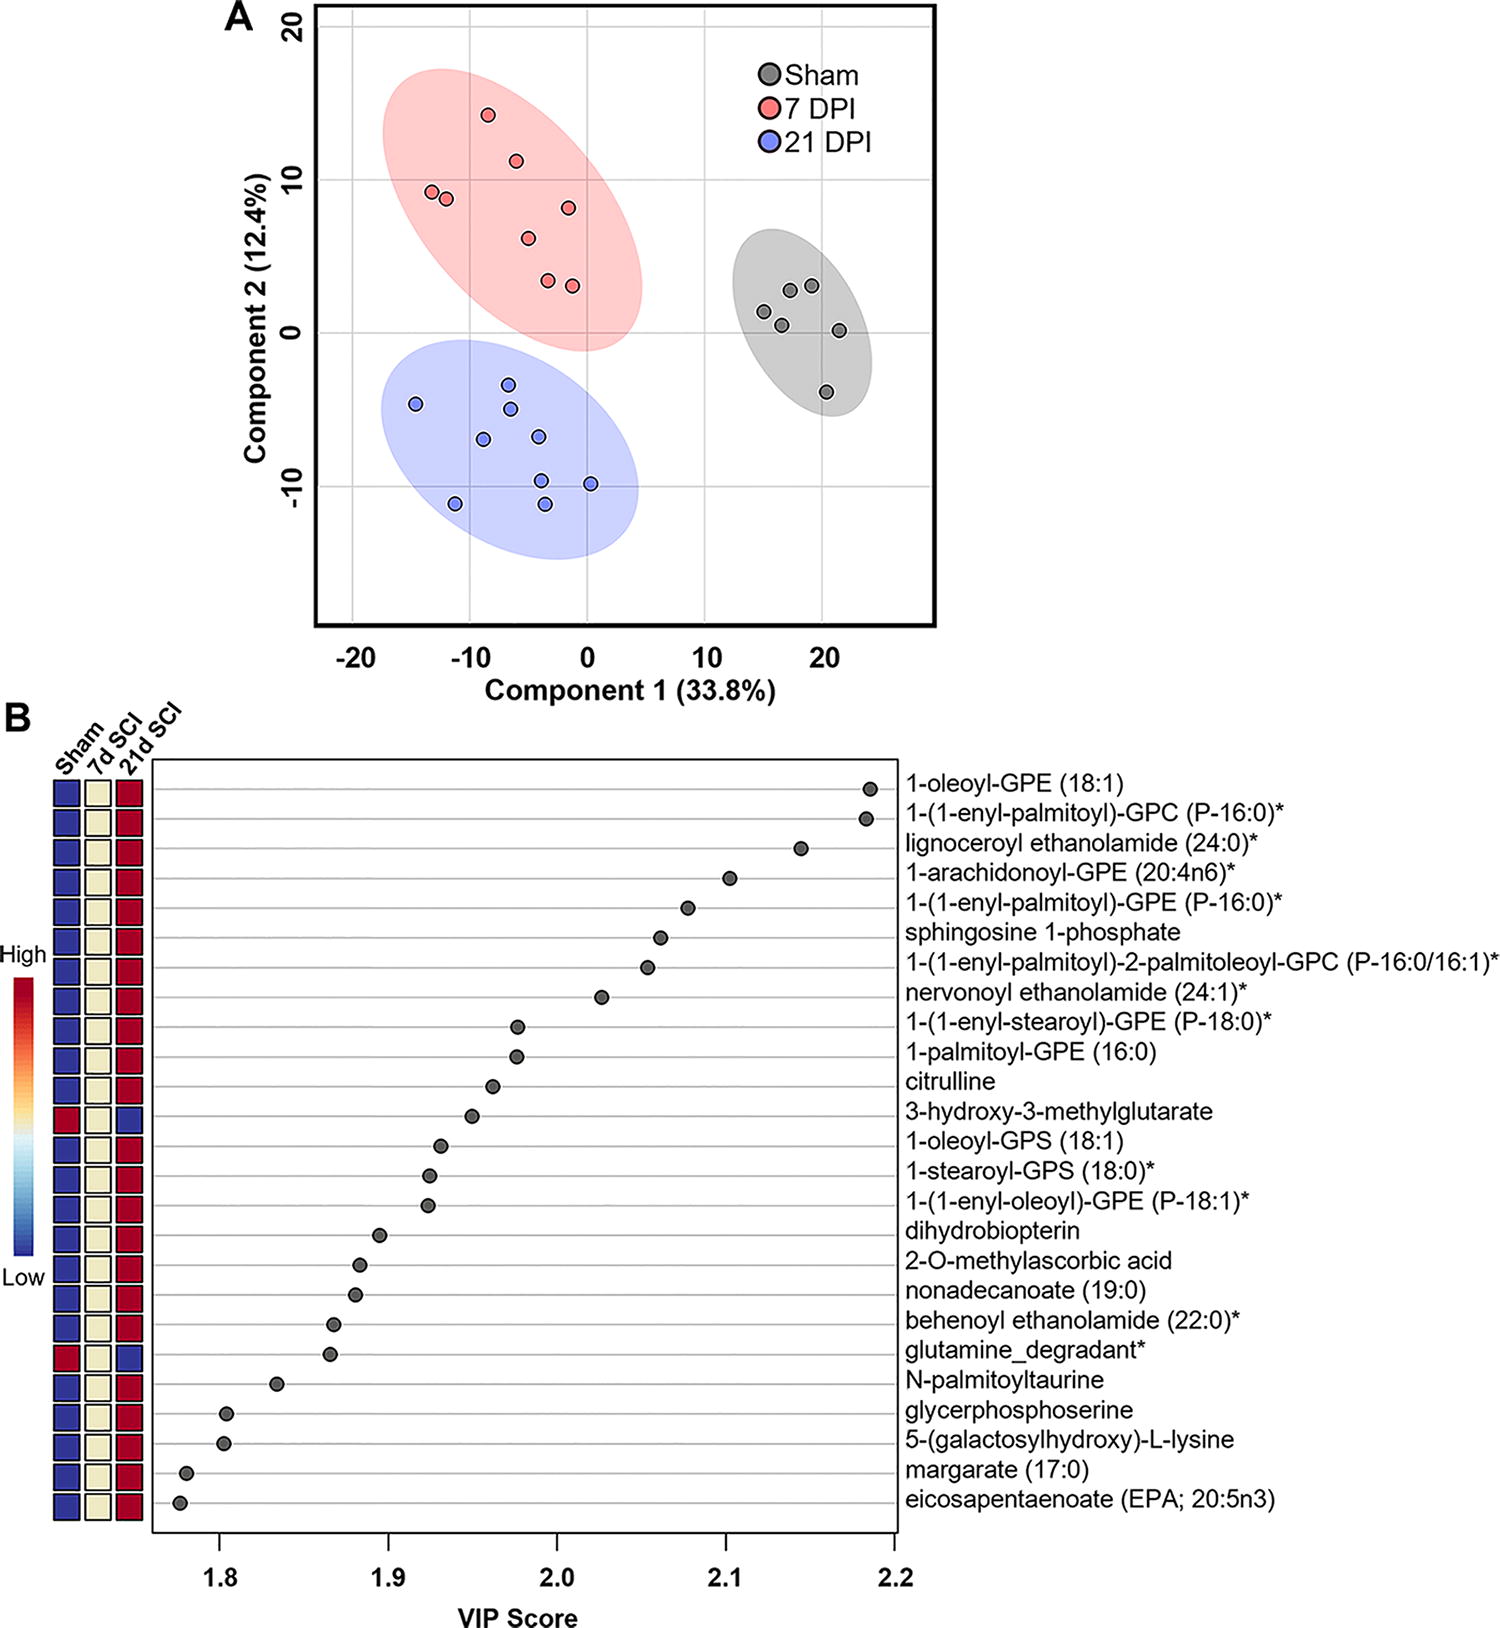
Partial least squares-discriminant analysis (PLS-DA) of metabolites in the injured cord across time.
Alterations in lipid metabolites in the injured cord across time
Based on the apparent contribution of lipid metabolites to overall differences in metabolic profile between groups, analysis was performed exclusively on the 317 lipid metabolites assessed by Metabolon Inc. using MetaboAnalyst software. Using univariate one-way ANOVA analysis, 183 lipid metabolites were deemed statistically different between the sham, 7 DPI, and 21 DPI groups (Fig. 3A). The complete list of these altered metabolites can be found in Supplementary Table S2. To visualize the relative abundance of important lipid metabolites, correlation analysis was performed and a heatmap generated depicting the top 25 features based on the ANOVA (Fig. 3B). Interestingly, the identified metabolites largely consisted of LPLs, fatty acids (FAs), and acylcarnitines.
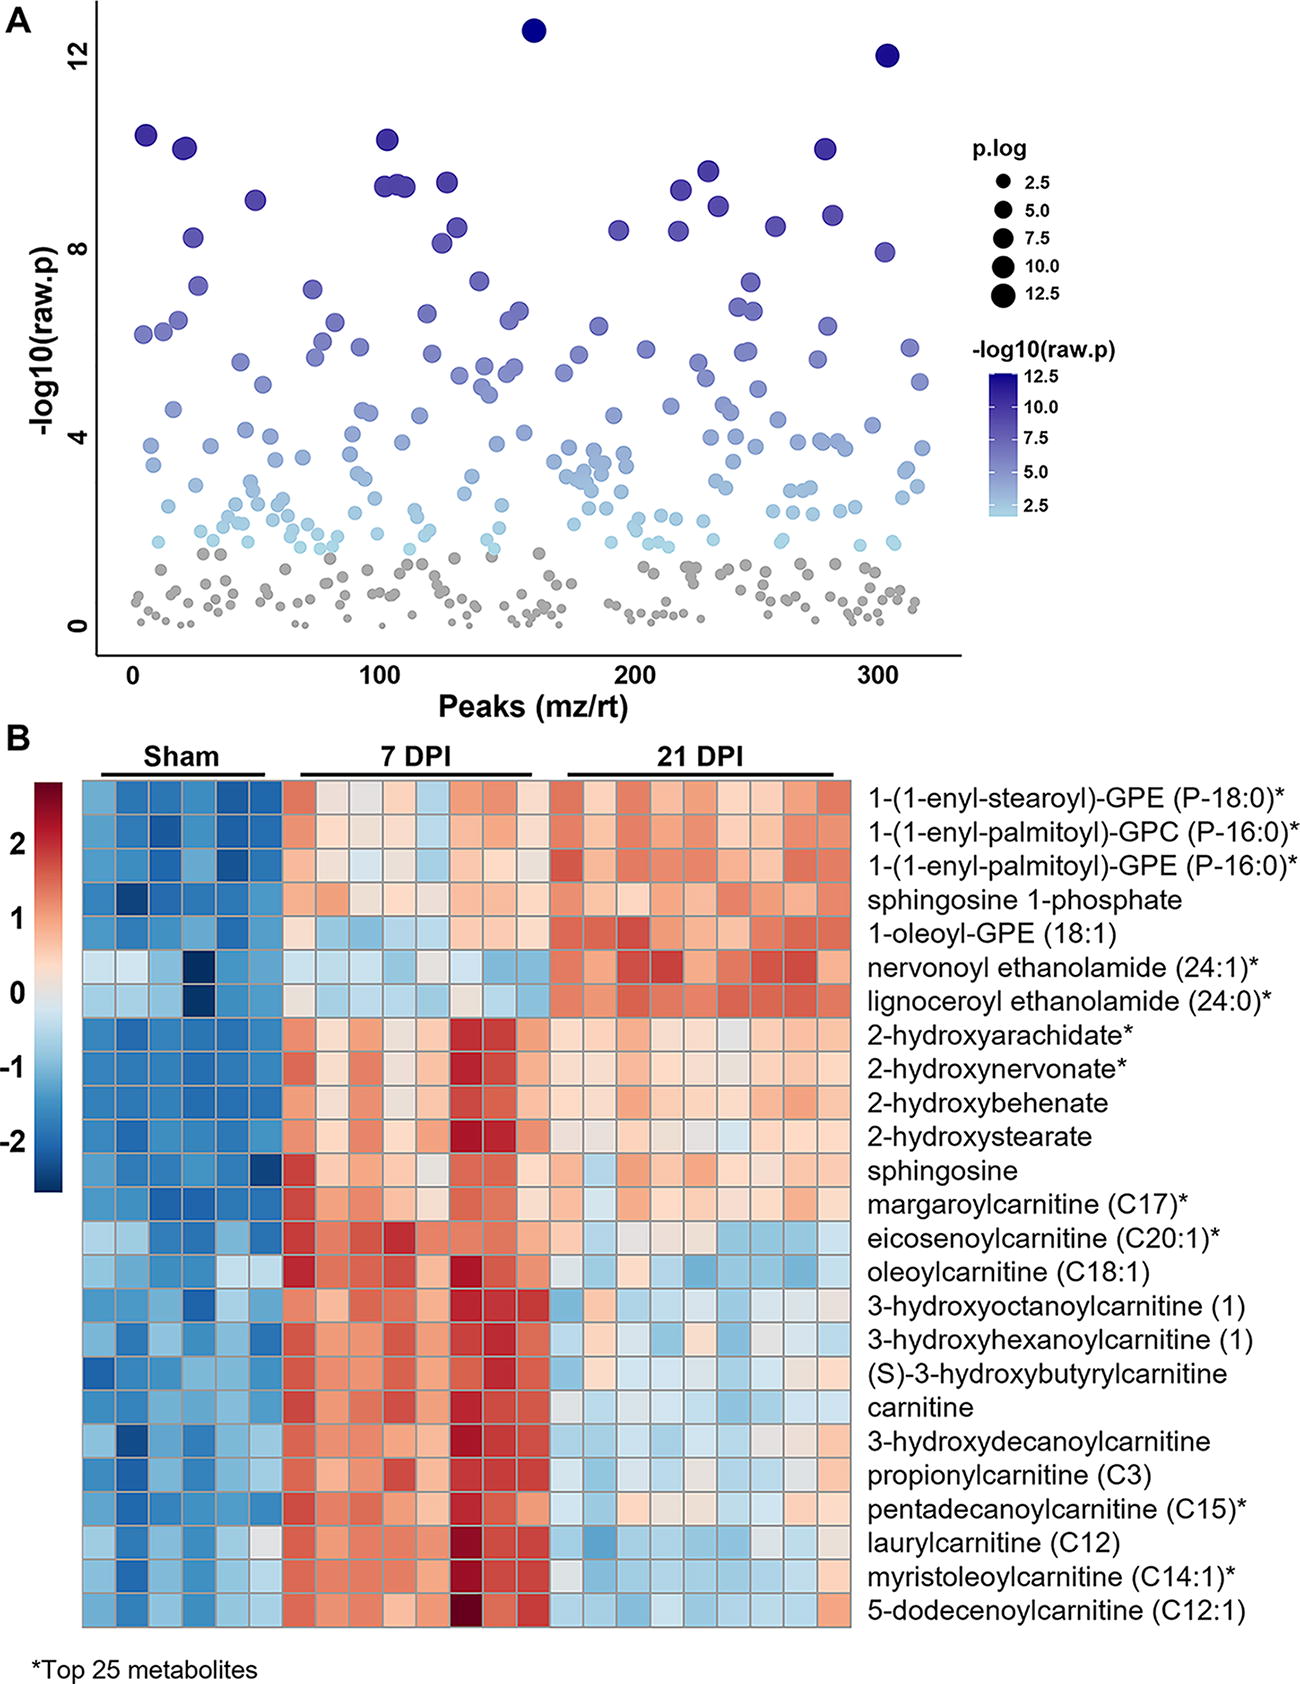
Altered lipid metabolites in the injured cord across time. Female mice were subjected to SCI or sham surgery using an 80 kdyn force-controlled impactor-induced contusion model and the injured cord extracted for metabolic analysis.
Alterations in PLs, LPLs, and FAs in the injured cord across time
PL metabolism via phospholipase results in the hydrolyzation of PLs to yield LPLs and FAs. Therefore, based on the data obtained from the aforementioned heatmap, analysis of the normalized abundance of metabolites involved in PL metabolism was performed across groups. Select PL and LPL features are shown in Figure 4, and the complete list and abundance of metabolites within each category can be found in Supplementary Tables S3 and S4. Phosphatidylcholines (PC; Fig. 4A) and phosphatidylserines (PS; Fig. 4B) often increased at 7 DPI compared with sham, whereas this effect was not seen with phosphatidylglycerol (PG; Fig. 4C), phosphatidylethanolamine (PE; Fig. 4D), and phosphatidylinositol (PI; Fig. 4E) features. Regardless of the type of phospholipid, the pattern of abundance in the injured cord across time was similar, with concentrations decreasing between 7 and 21 DPI (Fig. 4A–E). In contrast, the majority of altered LPLs were increased in the injured cord regardless of time point, with many features further increasing between 7 and 21 DPI (Fig. 4F). These data suggest amplified PL metabolism at this later time point after SCI.
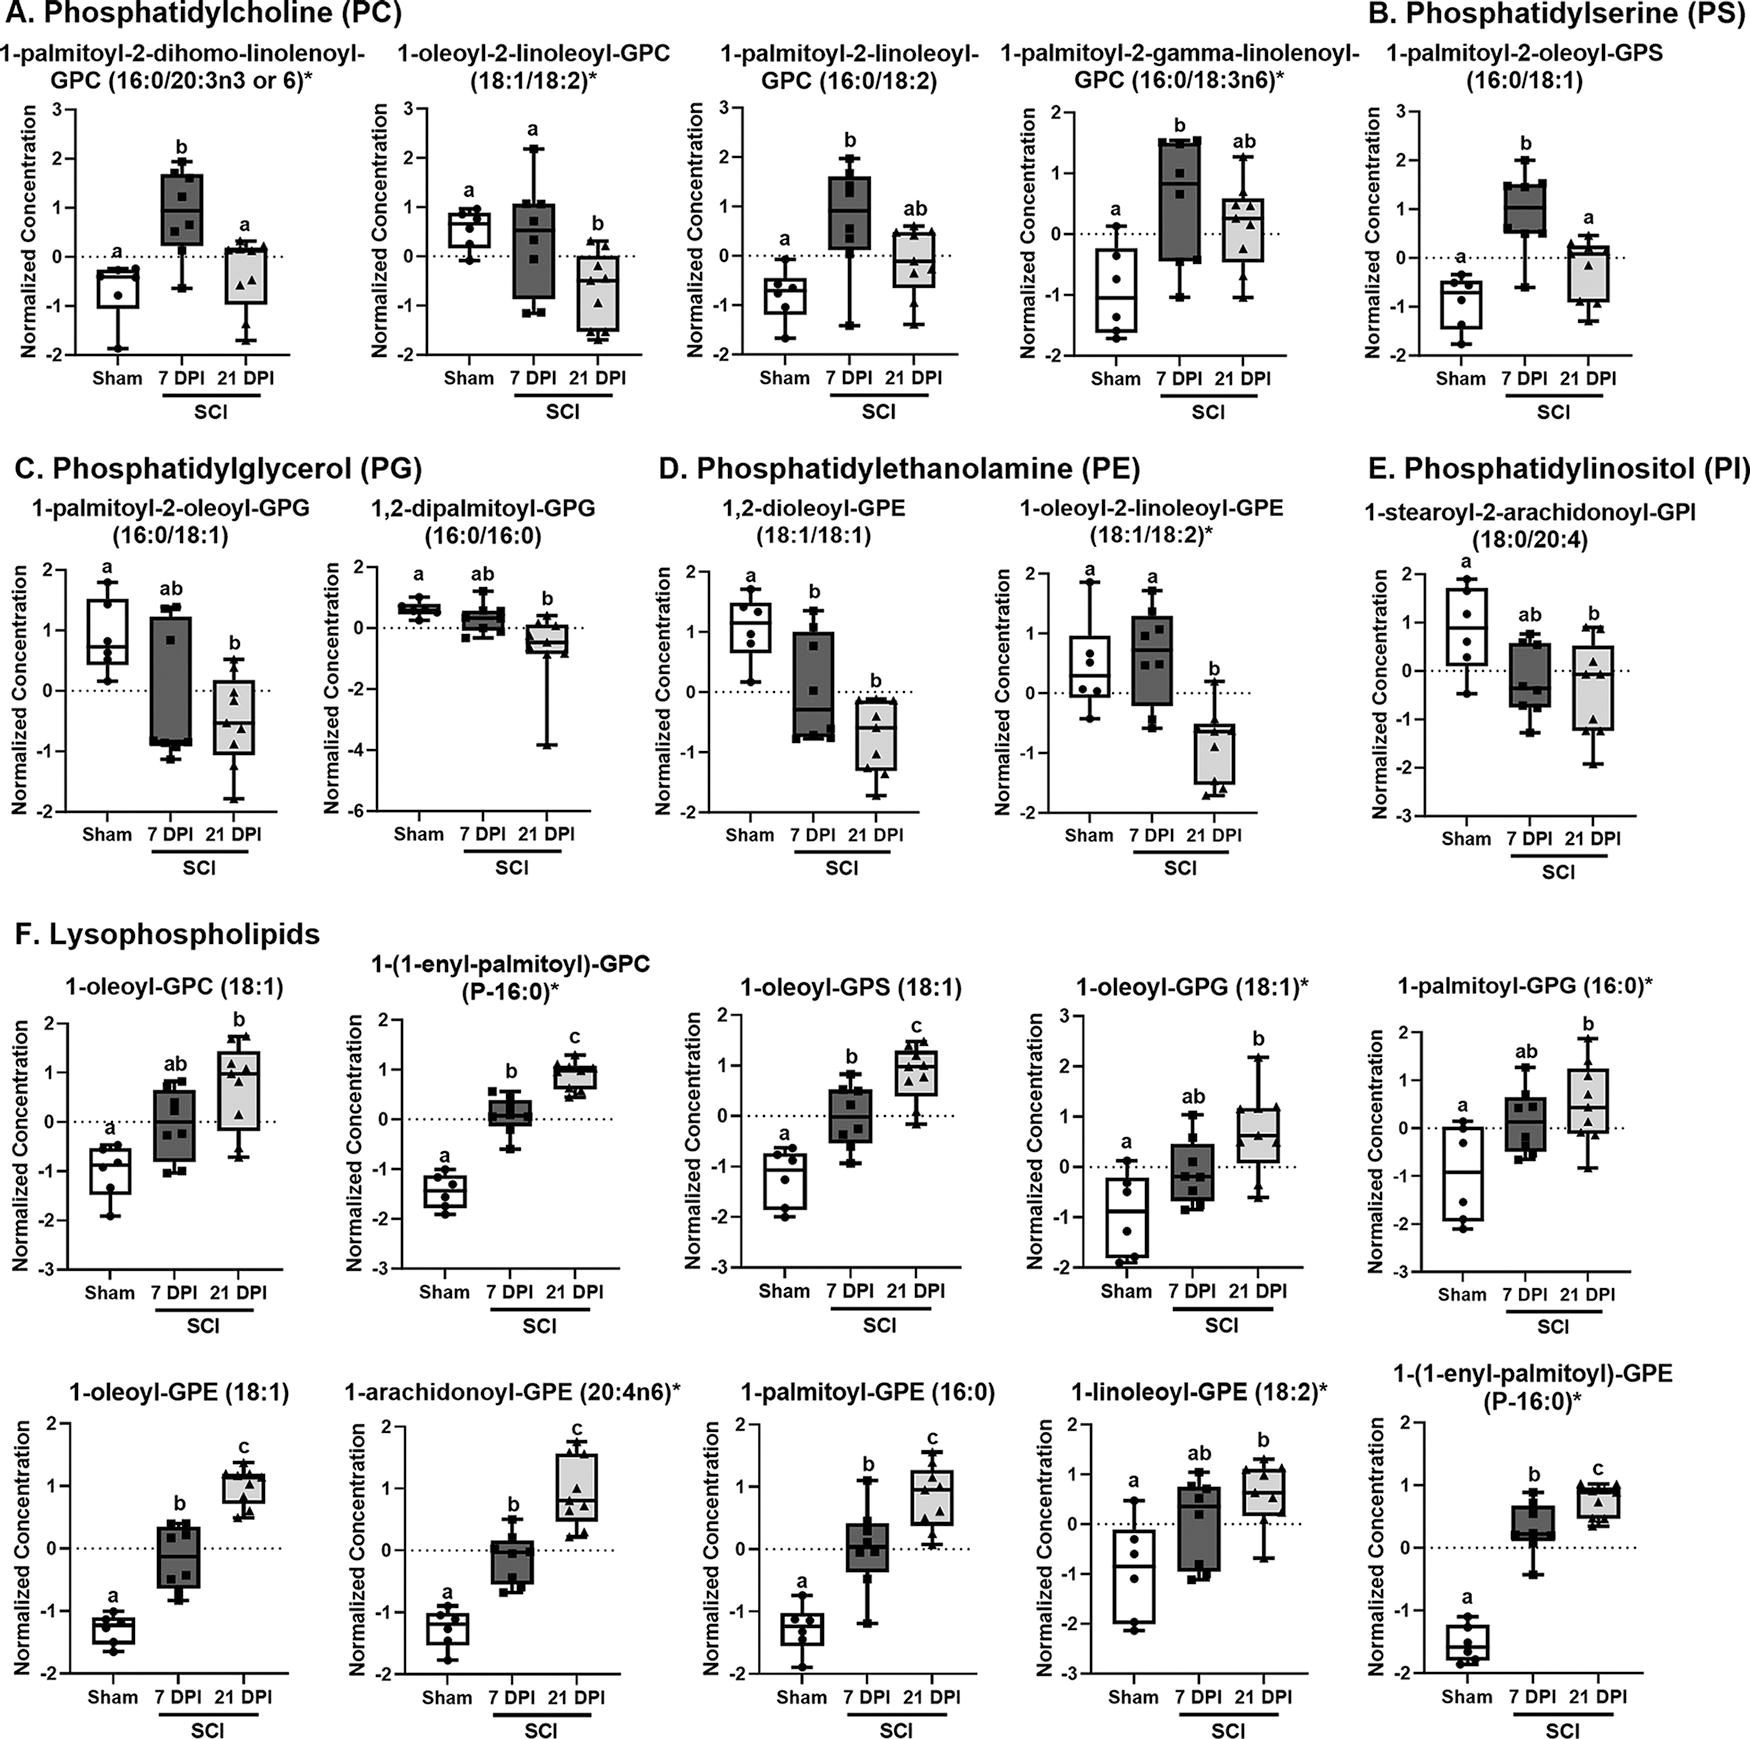
Partial list of altered phospholipids and lysophospholipids in the injured cord across time. Female mice were subjected to SCI or sham surgery using an 80 kilodyne (kdyn) force-controlled impactor-induced contusion model and the injured cord extracted for metabolic analysis. The normalized concentration of individual phospholipid metabolism-related metabolites, including
To investigate this further, BioPAN software, 17 a pathway analysis tool designed specifically for lipid analysis, was used to examine altered lipid class reactions in the injured spinal cord across time (Fig. 5). This analysis depicted increased PG→LPG, PC→LPC, PS→LPS, PE→LPE, and PI→LPI activity compared with sham at both 7 and 21 DPI (Fig. 5A,B). Furthermore, increased PG→LPG, PE→LPE, and PS→LPS activity, typical preferential substrates of PLAs, was observed between 21 and 7 DPI (Fig. 5C). Increased activity, as determined by z-score, is denoted by green highlighting of the reaction. BioPAN software then predicted the genes involved in both the activated and suppressed reactions. Altered reaction chains, z-scores, and predicted genes involved can be found in Tables 1–3.
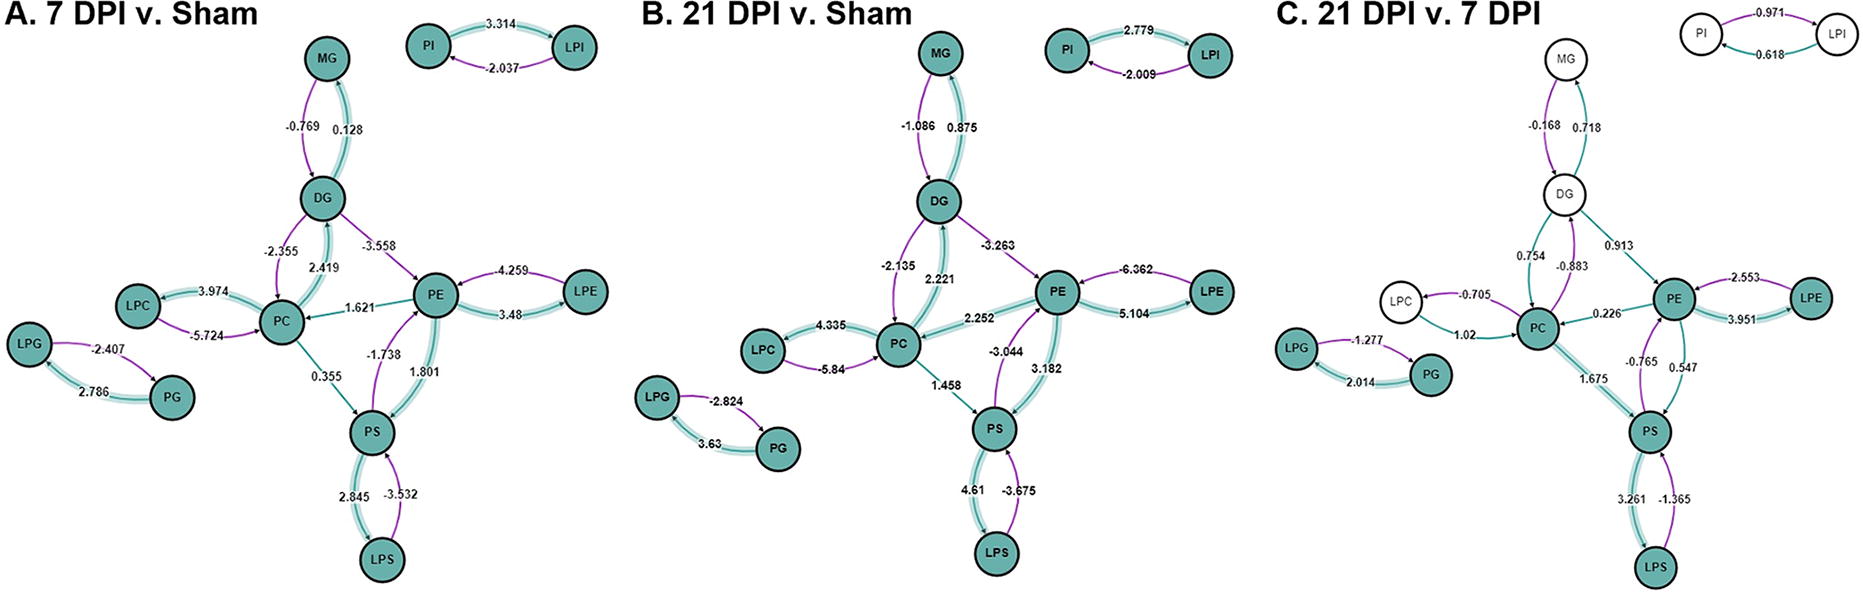
Altered lipid class reactions in the injured cord across time. BioPAN software was used to assess altered phospholipid metabolism pathways in the injured cord
Seven Days Postinjury Versus Sham BioPAN-Derived Reactions and Predicted Genes
Twenty-One Days Postinjury Versus Sham BioPAN-Derived Reactions and Predicted Genes
Twenty-One Days Postinjury Versus 7 Days Postinjury BioPAN-Derived Reactions and Predicted Genes
We next looked at the other product of PLA activity, FAs. Select FA metabolites are shown in Figure 6, and the complete list can be found in Supplementary Table S5. Consistently, altered long chain FAs were increased in the injured cord compared with sham, regardless of time point, be they polyunsaturated (Fig. 6A), such as arachidonate and docosahexaenoate (DHA), or saturated (Fig. 6B). In contrast, altered hydroxy FAs (Fig. 6C), while also increased compared with sham at both time points, were decreased 21 DPI compared with 7 DPI.

Partial list of altered fatty acid metabolites in the injured cord across time. Female mice were subjected to SCI or sham surgery using an 80 kdyn force-controlled impactor-induced contusion model and the injured cord extracted for metabolic analysis. The normalized concentration of individual fatty acid metabolites, including
Alterations in PLA2 in the injured cord across time
PLA2s catalyze the hydrolysis of PLs, liberating FAs from their LPL base. Therefore, based on our metabolomic findings, we assessed the expression of various PLA2s within the injured mouse spinal cord over time. In a separate cohort of mice, the injury site was extracted, and TempO-Seq, a high-throughput microarray tool designed by BioSpyder, was used to determine PLA2 gene expression differences across groups (Fig. 7). Interestingly, the pattern of PLA2 expression after SCI differed across isoenzymes. Secretory PLA2 (sPLA2) IID (Fig. 7A) and XIIA (Fig. 7B) were increased at 21 DPI, but not 7 DPI compared with sham. Calcium-independent (iPLA2, Fig. 7C) and adipocyte PLA2 (Fig. 7D) were decreased after injury at both time points, whereas lysosomal PLA2 was increased (Fig. 7E). While lipoprotein-associated PLA2 (Lp-PLA2, Fig. 7F) did not differ with injury compared with sham, expression of both it and adipocyte PLA2 was increased between 7 and 21 DPI. Gene expression of cytosolic PLA2 (cPLA2) did not differ across groups (Fig. 8A). As cPLA2 activity is regulated by phosphorylation, 22 however, immunoblot analysis of p-cPLA2 in the injury site was performed using a separate cohort (Fig. 8B). Interestingly, p-cPLA2 increased at 7 DPI and returned to sham levels by 21 DPI.

Phospholipase A2 gene expression in the injured cord across time. Female mice were subjected to SCI or sham surgery using an 80 kdyn force-controlled impactor-induced contusion model. The injury site was extracted and RNA isolated for analysis using TempO-Seq by BioSpyder for gene expression of various phospholipases A2 (PLA2s). Data are representative of n = 6–8/group. Different letters are indicative of statistically significant differences (p < 0.05 by one-way ANOVA followed by Tukey’s post hoc test).

Expression of cytosolic PLA2 in the injured cord across time. Female mice were subjected to SCI or sham surgery using an 80 kdyn force-controlled impactor-induced contusion model.
Alterations in acylcarnitine formation and mitochondrial function in the injured cord across time
FAs can bond with carnitine to generate acylcarnitines, which can then be translocated across the mitochondrial membrane for use during β-oxidation. 23 Given the sustained increase in FAs observed in the injured cord, we assessed the abundance of carnitine and acylcarnitine metabolites. In general, carnitine (Fig. 9A) and acylcarnitines were consistently increased 7 DPI compared with controls. By 21 DPI, concentrations decreased, often returning to that of sham controls. This was true for short (Fig. 9B), medium (Fig. 9C), and long chain acylcarnitines (Fig. 9D), as well as hydroxy (Fig. 9E), monounsaturated (Fig. 9F), and polyunsaturated acylcarnitines (Fig. 9G). The complete list of altered carnitine-related features can be found in Supplementary Table S6.
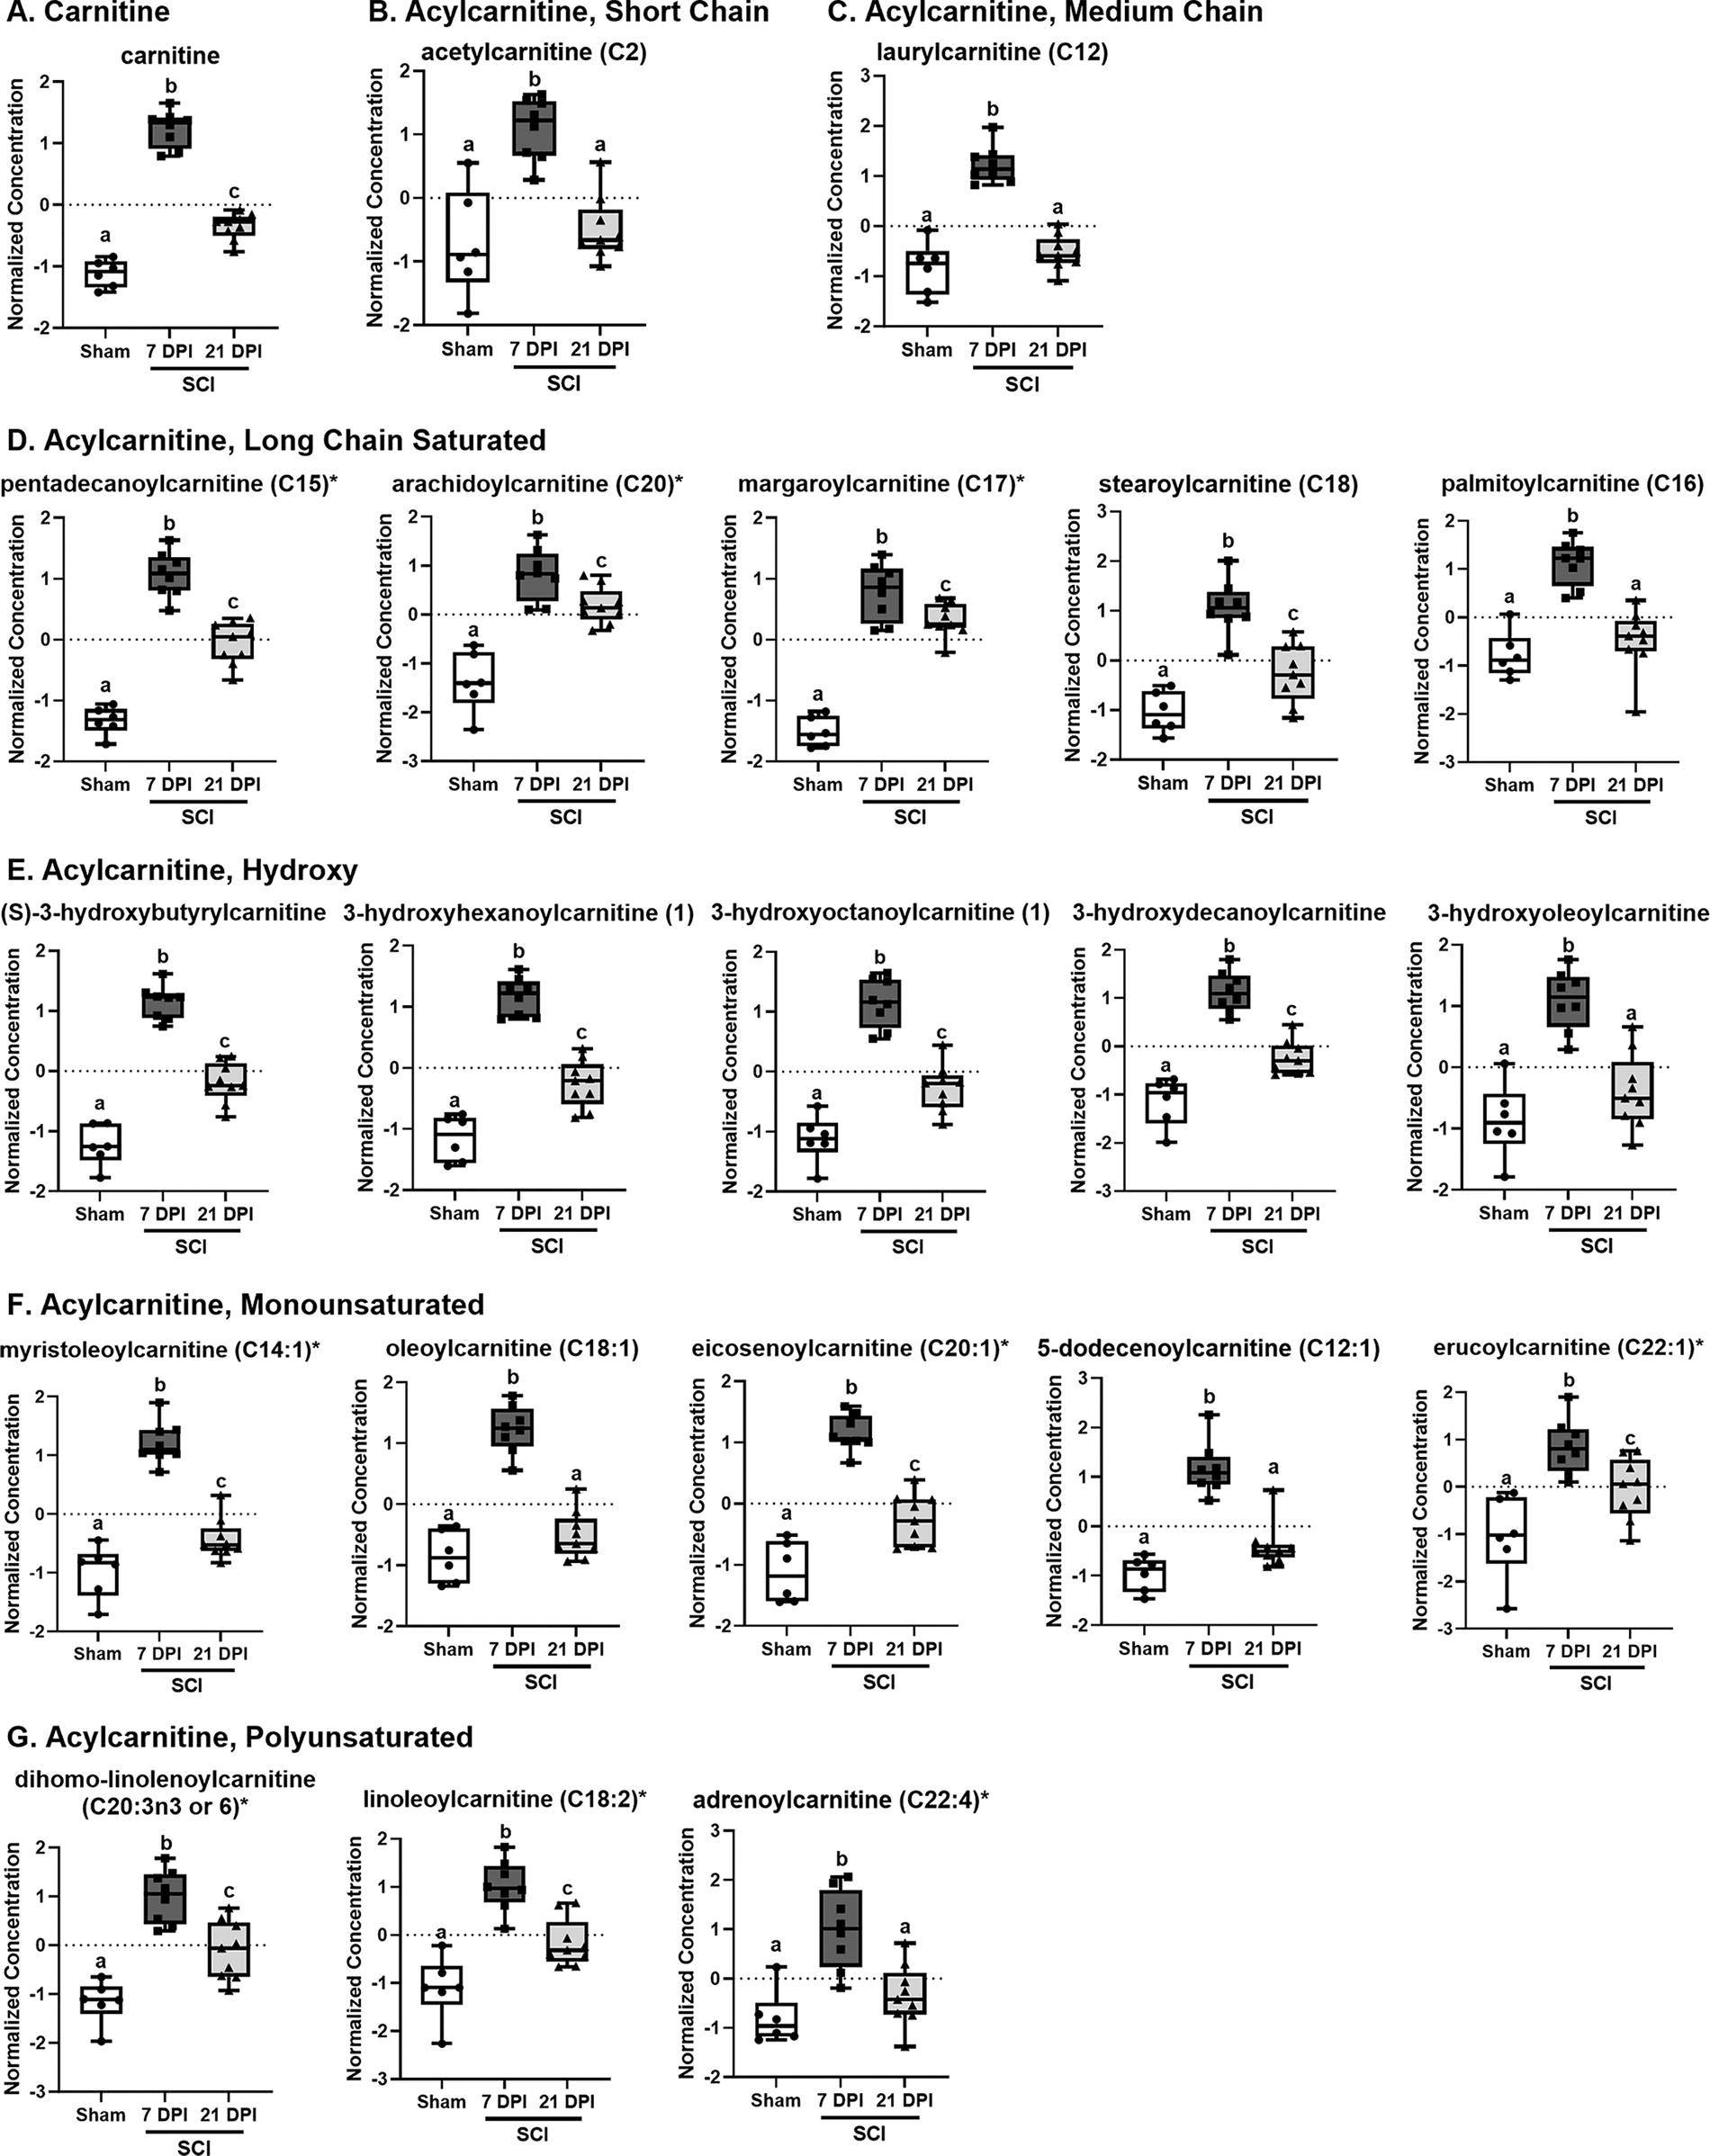
Partial list of altered carnitine metabolites in the injured cord across time. Female mice were subjected to SCI or sham surgery using an 80 kdyn force-controlled impactor-induced contusion model and the injured cord extracted for metabolic analysis. The normalized concentration of individual carnitine metabolites, including
Given the role of β-oxidation and the production of acetyl-CoA in oxidative phosphorylation, energy-related metabolites were assessed, including those involved in the tricarboxylic acid (TCA) cycle. Mitochondrial dysfunction in the injured cord is a well-known consequence of SCI. 24,25 Consistent with previous reports, we observed decreased mitochondrial DNA (mtDNA) content in the injury site regardless of time point. However, mtDNA did increase 21 DPI compared with 7 DPI (Fig. 10A). Phosphate, which is needed to generate adenosine triphosphate (ATP) from adenosine diphosphate (ADP), was decreased 7 DPI, indicating mitochondrial dysfunction, and was restored by 21 DPI (Fig. 10B). In contrast, metabolites associated with the early steps of the TCA cycle, namely citrate and aconitate, displayed a similar pattern to that of carnitines, increasing in the injured cord compared with sham regardless of time point, yet decreased at 21 DPI compared with 7 DPI. In contrast, fumarate, a later stage TCA cycle intermediate, was similarly increased in the injured cord regardless of time point (Fig. 10B).

Mitochondrial DNA content and partial list of altered energy-related metabolites in the injured cord across time.
Discussion
Metabolomic analysis of the injured mouse spinal cord revealed distinct metabolic profiles across various stages post-injury, with 56.5% of metabolites assessed being different across groups. Metabolites within each of the nine super pathways were affected, with over half of all lipid-, amino acid-, and carbohydrate-related residues being altered, indicating a broad and robust metabolic effect of SCI. Although a greater percentage of amino acid and carbohydrate-related metabolites were affected, PLS-DA revealed that lipid residues were major contributors to the overall shifts in metabolic profile observed. In addition, of the altered features, nearly 50% (183 out of 367) were categorized within the lipid pathway.
Traumatic SCI is characterized by demyelination of axons and the generation of high quantities of myelin debris. In addition to the consequences of myelin loss, myelin debris itself can promote disease pathology, including chronic inflammation and decreased axonal regeneration. 26 Neuroinflammation is a well-established hallmark of SCI that is characterized by activation and infiltration of glial cells, such as macrophages, which are responsible for myelin debris clearance. 27 As this debris is composed of ∼70% lipids, including cholesterol, PLs, and glycolipids, its degradation can lead to the generation and accumulation of lipids within the injury site. 26,28 Our analyses revealed increased PL metabolism, including increases in LPL and FA metabolites, and alterations in corresponding PLA2 enzyme expression in the injured cord.
Studies indicate that cPLA2 activity plays an important role in SCI pathology and progression. 29,30 We observed increased phosphorylation of cPLA2 in the injury site 7 DPI, but not 21 DPI. This is similar to previous reports describing increased cPLA2 expression in the rat spinal cord following SCI, peaking 7 days after injury. 30 cPLA2 is known to be involved in post-traumatic neuroinflammation, with macrophage-produced cPLA2 recently being implicated in myelin debris-mediated prolonged inflammation following SCI. 31 Hydrolyzation of certain membrane PLs by cPLA2 after injury can lead to the production of pro-inflammatory mediators, such as arachidonate, that can propagate the neuroinflammatory cascade, making cPLA2 critical to SCI progression. 32 Furthermore, arachidonate can be metabolized into oxylipins, which have recently been connected to pain, 33 a severely deleterious consequence of SCI. In addition, pro-inflammatory cytokines have been shown to induce cPLA2 activation in glial cells in vitro, leading to arachidonate release, which can then trigger mitochondrial dysfunction and cell death. 32 Importantly, arachidonate was increased in the injured cord, supporting cPLA2 activation and this pro-inflammatory state.
Secondary SCI is accompanied by prolonged dysregulation in autophagy, a catabolic process of breaking down cytoplasmic proteins and organelles that is essential for cellular homeostasis. Disruption of autophagy has been associated with neuronal cell death in various neuropathologies, including SCI. 34,35 Autophagy is dependent upon degradation enzyme-containing lysosomes, which are enclosed by phospholipid membranes, making them vulnerable to PLA2 activity. cPLA2 has recently been implicated in lysosomal membrane damage and dysfunction as early as 2 h post-SCI, likely contributing to autophagic dysregulation. 36 Furthermore, inhibition of cPLA2 prevented these effects and decreased neuronal cell death after injury. 36 In addition, previous studies have shown that acute inhibition of cPLA2 shortly after SCI can lead to enhanced recovery observed up to 6 weeks post-injury. 29 Therefore, while we observed an early and temporary increase in p-cPLA2, existing data support the therapeutic potential of mitigating cPLA2 activity acutely post-SCI.
In contrast to cPLA2, gene expression of sPLA2 IID and XIIA was increased in the injury site 21 DPI, but not 7 DPI. sPLA2 IID is an anti-inflammatory sPLA2 isoform that targets DHA-containing PLs, leading to increased DHA release, which was observed here. 37 Given that neuroinflammation is a long-term consequence of SCI that contributes to both glial scar formation and neuropathic pain development, 38,39 the increase in sPLA2 IID expression during the plateau phase could be indicative of an attempt to impede this chronic neuroinflammatory response and promote healing. The role of this increase in injury progression, however, remains to be discerned. sPLA2 XIIA is an atypical form of sPLA2 that has not been as extensively studied as other isoforms; however, it is thought to be involved in innate immunity, as well as working memory and attention. 37 How this relates to SCI pathology remains unknown. It is important to note that this study utilized C57bl/6 mice, which do not express pro-inflammatory sPLA2 IIA, which is arguably the most well-studied isoform of sPLA2 post-SCI. 40
Recent studies show that activated astrocytes display altered lipid secretion and metabolism that can promote neuronal toxicity. Specifically, Guttenplan et al. found that a considerable amount of activated astrocyte-mediated cell death can be attributed to upregulation of saturated lipids, including saturated long chain free FAs. 41 In addition, excess free FAs can lead to the accumulation of lipid droplets, which can be harmful to neurons 28 and contribute to decreased axonal regeneration following SCI. 42 Toxic effects of free FAs, however, can be attenuated with carnitine conjugation. 43 –46 We observed similar degrees of FA upregulation, including long chain FAs, in the injured cord during both the recovery and plateau phases. In contrast, carnitine and acetylcarnitine were increased at 7 DPI, but then decreased at 21 DPI. This decrease during the plateau phase suggests that carnitine-mediated mitigation of FA-induced toxicity is likely diminished, which could be contributing to the cessation of recovery observed. Multiple studies have shown that treatment with acetylcarnitine improves recovery and decreases neuronal degeneration following SCI in vivo. 47 –51 While these results have been largely attributed to improved mitochondrial function, the effect of acetylcarnitine treatment on FA-induced toxicity post-SCI could represent another potential mechanism of action.
Carnitine is essential for the transfer of long chain FAs to mitochondria for β-oxidation, which degrades fatty acyl-CoAs to produce acetyl-CoA, a necessary substrate of the TCA cycle and subsequently ATP production. 52 Similar to that observed with carnitine and acylcarnitines, the TCA intermediates citrate and aconitate were increased at 7 DPI, then decreased at 21 DPI, suggesting a more hypoenergetic state at the earlier time point. In contrast, mtDNA and phosphate were decreased at 7 DPI, signifying mitochondrial dysfunction. This increase in carnitine- and TCA-related metabolites during the recovery phase could be indicative of either an attempt to address the energy demand after injury or a consequence of mitochondrial dysfunction leading to under-use and over-accumulation of these substrates, both of which would be mitigated by the improved mitochondrial function observed during the plateau phase.
While female rodents are generally preferred for SCI studies due to ease of bladder expression and decreased likelihood of developing urinary tract infections, 53 the majority of SCIs occur in males. 1 We have previously shown similar degrees of loss of hindlimb function and recovery in male and female mice following 80 kdyn contusion SCI. 21 However, it is important to note that sex influences metabolism in both humans and rodents. Recent studies have identified sex-dependent differences in metabolic profiles in rodent models of central nervous system (CNS) diseases such as stroke and Alzheimer’s diseases. 54,55 Therefore, future work should include metabolic analysis in male mice following SCI.
Conclusions
The data presented here suggest an evolution toward amplified PL metabolism in the injured spinal cord post-SCI, leading to an increase in the release of potentially toxic FAs. While FA-induced toxicity can be lessened by carnitine, the presence of carnitine and acylcarnitine residues decreased during the plateau phase of SCI recovery. Future studies will investigate how this effect contributes to the cessation of recovery post-SCI. We also observed alterations in PLA2 expression indicative of a shift from a pro-inflammatory response during the recovery phase to an anti-inflammatory response during the plateau phase. Whether this is a cause or effect of injury progression remains to be discerned. Nevertheless, these findings provide insight to improve our understanding of the molecular alterations within the spinal cord during critical phases post-SCI. In addition, the metabolic data generated have the potential to influence the conception of multiple testable hypotheses beyond the context of this study, which could uncover biomarkers for injury progression and/or aid in the future development of therapeutic strategies.
Transparency, Rigor, and Reproducibility Statement
All statistical analyses were performed using MetaboAnalyst or GraphPad Software Prism 10, and differences were considered significant when p value < 0.05. Sample sizes were determined based on power analyses desiring π = 0.90 and α = 0.05. Correction for multiple comparisons between experimental groups was performed using Tukey’s post hoc test. One animal died due to postinjury complications and was excluded from the study. Mice were randomly assigned to groups receiving sham or SCI surgery, and SCI mice were randomly assigned to either the 7 DPI or 21 DPI group. Tissues were held at −80°C until use. Experimental materials were analyzed simultaneously in a single batch. Details of n, statistical tests, and results of statistical comparisons can be found in the results and figure legends. The surgical procedure and primary behavioral outcome measure are standards in the field.
Footnotes
Authors’ Contributions
Conceptualization: N.E.S., E.C.S., J.M.S., and R.G.S. Formal analysis: N.E.S., E.C.S., and J.M.S. Funding acquisition: N.E.S., E.C.S., J.M.S., and R.G.S. Investigation: N.E.S., E.C.S., K.B., and L.G.B. Methodology: N.E.S., E.C.S., J.M.S., and R.G.S. Project administration: N.E.S., J.M.S., and R.G.S. Resources: N.E.S., J.M.S., and R.G.S. Supervision: N.E.S., J.M.S., and R.G.S. Validation: N.E.S. and E.C.S. Visualization: N.E.S. and E.C.S. Writing—original draft: N.E.S., E.C.S., and J.M.S. Writing—review and editing: N.E.S., E.C.S., J.M.S., and R.G.S.
Author Disclosure Statement
The authors have no conflicts of interest to report.
Funding Information
This work was supported by the BLR&D Career Development Program of the Department of Veterans Affairs [IK2BX005218; NES], the National Institute of Neurological Disorders and Stroke [F31 NS115413; ECS], the National Institute on Aging [T32 AG061897], the National Cancer Institute [P30 CA023074], and the BLR&D of the Department of Veterans Affairs [I01BX004868; RGS].
Supplementary Material
Supplementary Figure S1
Supplementary Table S1
Supplementary Table S2
Supplementary Table S3
Supplementary Table S4
Supplementary Table S5
Supplementary Table S6
References
Supplementary Material
Please find the following supplemental material available below.
For Open Access articles published under a Creative Commons License, all supplemental material carries the same license as the article it is associated with.
For non-Open Access articles published, all supplemental material carries a non-exclusive license, and permission requests for re-use of supplemental material or any part of supplemental material shall be sent directly to the copyright owner as specified in the copyright notice associated with the article.
