
Abstract
Traumatic brain injury (TBI) causes transient but robust increases in hippocampal neurogenesis, referred to here as the neurogenic response, which is distinct from baseline or constitutive levels of neurogenesis. The neurogenic response may reflect a restorative process for cognitive recovery from TBI. It is unknown whether the hippocampus remains capable of eliciting another neurogenic response to a subsequent TBI, and whether a potential loss in this endogenous repair mechanism affects cognitive recovery from a repeated TBI. To address this, 2-month-old male and female mice received a sham or mild TBI (mTBI) using the closed-head concussive injury model. Mice received another sham or mTBI procedure 3 weeks later. Mitotic and immature neuronal markers were used to assess the proliferative and neurogenic responses. Neurogenesis-sensitive strategy flexibility was assessed as the functional outcome using the reversal water maze task 1 month after the second procedure. The experimenters collecting the data were blind to the group assignment of each mouse. Proliferation and neurogenesis were higher after a single mTBI but not after a second mTBI. Noteworthy, deficits in the neurogenic response were observed despite normal levels of constitutive neurogenesis. There were no deficits in the radial glia-like stem cell pool, but their proliferative rates to the second mTBI did not increase. The lack of a proliferative response was unlikely due to the injury interval as the dampened responses, which included blunted increases in glial fibrillary acidic protein (GFAP) immunoreactivity, were as pronounced when a longer injury interval (2 month) was used. In contrast to the aberrant neurogenesis observed in more severe TBI models, neurons born after a single or second mTBI had normal dendritic branches, suggesting a beneficial role in hippocampal restoration. In line with this finding, mice with a second mTBI had impairments in neurogenesis-sensitive strategy flexibility, whereas mice with a single mTBI did not. These impairments were specific to strategy flexibility: Mice with two mTBIs had intact reference memory in the water maze. In conclusion, our findings demonstrate that a loss in the neurogenic response to a subsequent mTBI occurs weeks after a single mTBI and that this deficit is not transient. A loss in this endogenous repair mechanism could in part contribute to worse cognitive recovery after a repeated mTBI. Although our data may indicate that the absence of the neurogenic response could include impairments in the proliferative capacity of the radial glia-like stem cells, an alternative explanation could involve adaptative responses that alter the injury severity of the second mTBI. These possible explanations need to be validated in order to move forward with therapeutic strategies to reengage the neurogenic response.
Introduction
Mild traumatic brain injury (mTBI) makes up 70–90% of TBIs. 1 Most cognitive complications from mTBI resolve within weeks to months, but some mTBIs, especially when repeated, cause long-term complications, including changes in mood stability and memory function. 2 –5 Currently, there are no Food and Drug Administration-approved drugs to treat chronic cognitive impairments resulting from mTBI. However, the brain is endowed with the ability to transiently but robustly increase the generation of new neurons in response to brain injury (neurogenic response). 6 –8
Adult hippocampal neurogenesis has key roles in a wide array of cognitive processes, including pattern separation, 9,10 which allows discrimination between overlapping contexts; resilience to stress-induced neurophysiological changes and anxiety-like behaviors; 11 –13 it facilitates forgetting; 14,15 and plays a role in long-term memory consolidation. 16 –18 Neurogenesis is also required for the efficacy of a major class of antidepressants 19 –21 and is involved in the architecture of sleep. 22 Thus, given its many roles in cognitive function, there is wide interest in augmenting the neurogenic response to facilitate recovery after brain injury. 23 –26
However, with regard to the therapeutic promise of neurogenesis, two key points require clarification in order to clearly appreciate the purpose of this study: (1) the distinction between ongoing, constitutive neurogenesis versus the neurogenic response to mTBI and (2) the functional significance of the neurogenic response in cognitive recovery. Here, we define the neurogenic response as the transient but robust increase and integration of new hippocampal neurons that occurs acutely after TBI. This specific response has been extensively examined for its therapeutic potential in hippocampal recovery following brain injury, 27 –30 which is thought to occur via the replacement of dying or damaged neurons. 6,31 Constitutive neurogenesis, on the other hand, is the ongoing or baseline levels of neurogenesis that occurs daily 32,33 and does so independent of salient stimuli such as exercise or a brain insult. The roles of neurogenesis on cognitive functions such as pattern separation and mood regulation, for example, are based on constitutive levels of neurogenesis.
Regarding the first key point—the distinction between the neurogenic response and constitutive neurogenesis—it is important to recognize that these are distinct processes because they may be differentially affected by TBI acutely and over time. For example, in contrast to acute increases in post-TBI neurogenesis, moderate-to-severe TBI models cause a slow decline in constitutive levels of neurogenesis several weeks to months after injury. 34 –37 Based on this observation, it is reasonable to suspect that a TBI may also alter the neurogenic response to a subsequent TBI; however, this has yet to be experimentally determined. Furthermore, if TBI affects the neurogenic response, it is unknown whether deficits occur slowly, or immediately after TBI, nor whether deficits are transient. These temporal aspects are key knowledge for clinical interventions, as well as for return to play recommendations. The distinction between constitutive neurogenesis and the neurogenic response is also important because they might have distinct roles in cognitive function after TBI. The evidence suggesting that post-TBI neurogenesis represents a repair mechanism is based on studies targeting the robust population of newborn neurons that are generated acutely after injury, again what we refer to here as the neurogenic response. In contrast, normal baseline levels of neurogenesis may not be sufficient to replace damaged or lost neurons and the new synaptic connections needed to aid hippocampal repair.
The second point of clarification relates to functional significance of the neurogenic response in hippocampal recovery. Although several studies suggest that the neurogenic response is beneficial for cognitive recovery, 27,30,38 more recent studies suggest that inhibiting the neurogenic response to brain injury is more beneficial for the recovery process. 37,39,40 Additionally, several reports demonstrate that post-TBI born neurons are not the same as those generated in a non-injured brain. For example, neurons generated after a moderate-to-severe controlled cortical impact (CCI) mis-localize within the hippocampal circuitry and have aberrant dendritic morphologies. 41 –43 Importantly, it is not known whether mTBI or repeated mTBI results in similar developmental abnormalities of post-TBI born neurons. Thus, some of the discrepancies among studies addressing the functional significance of posttraumatic neurogenesis may be owed to the qualitative type of neurogenesis that is induced.
In this study we used a mTBI mouse model that resembles a concussive-like injury, the most common type of TBI sustained by humans, to determine whether a prior mTBI prevents the hippocampus from mounting a neurogenic response to a second mTBI. We subsequently investigated the proliferative behavior of the radial glia-like cells (RGCs) to determine if deficits begin with proliferation, which is the initial stage of neurogenesis. Two lines of transgenic mice were used to determine whether post-mTBI born neurons have aberrant dendritic morphology. We then used the reversal water maze task, which is sensitive to changes in neurogenesis, 44 to evaluate the extent to which mice recover from a second mTBI in the absence of a neurogenic response.
Methods
Animals
All procedures were performed according to the National Institutes of Health Guidelines for the Care and Use of Laboratory Animals and were in compliance with approved Institutional Animal Care and Use Committee (IACUC) protocols at Oregon Health & Science University and Legacy Research Institute, Portland, Oregon, USA. Animals were 2-month-old male and female transgenic or C57Bl/6J wild-type mice bred in-house. They were housed in standard cages under a 12-h light/dark cycle and had ad libitum access to food and water. To analyze the dendritic morphology of neurons generated after mTBI, we used a Doublecortin-CreERT2 mouse (generously provided by Dr. Zhi-Qi Xiong, Institute of Neuroscience, Shanghai, China), which we crossed with a Rosa26-CAG-tdTomato reporter mouse and referred to here as DCX-Cre/tdTom mice. The tamoxifen-inducible Cre in this mouse is under the control of the doublecortin (DCX) promoter, allowing us to permanently pulse label newborn neurons as previously shown. 42 Proopiomelanocortin-enhanced green fluorescent protein (POMC-EGFP) mice, which express GFP in immature neurons within the hippocampal dentate gyrus, 42,45 provided an additional level of rigor for the assessment of neurogenesis, as newborn neurons were labeled with GFP in addition to the immature neuronal marker DCX. Litter mate male and female mice were divided into the various groups as evenly as possible. The number of mice and sex for each group and experiment is reported in Experimental Design below and are represented by dots in the bar graphs. A total of 196 mice were used for this study.
Closed head injury
Mice were anesthetized in an induction chamber using spontaneously inhaled isoflurane (2%) and transferred to a soft sponge (approximate density of 0.043 g/cm3) within a stereotaxic apparatus. Ear bars were not used. Anesthesia was maintained using a nose cone. A neuroimpactor device (Neuroscience Tools; O’Fallon, MO) was used to position a 3 mm stainless steel piston flush with the skull surface on the right hemisphere (approximately AP −2.0, ML−1.5), which was then retracted and lowered by 2.2 mm at a 10-degree angle toward the midline. The piston was fired at a speed of 4.67 m/s with an 800 ms dwell time. Mice were allowed to recover on a heating pad, and the righting time of each mouse was recorded (Supplementary Fig. S1). Sham mice had an equal amount of time under anesthesia (approximately 3 min) with no injury. Mice received a second sham or closed head injury procedure 3 weeks or 2 months later. A 3-week injury interval was chosen in order to isolate and quantify the population of cells born after the second procedure from those born after the first procedure, which was possible because of the transient expression of DCX and GFP. The 2-month injury interval was chosen in order to determine whether the proliferative response potentially required a longer injury interval than 3 weeks.
Controlled cortical impact
The controlled cortical impact (CCI) protocol was conducted as previously described. 42 Mice were anesthetized in an induction chamber using spontaneously inhaled isoflurane (2%) and transferred to a stereotaxic apparatus with a heating pad. Ear bars were used to hold the head in place. Anesthesia was maintained using a nose cone. A scalp incision was made over the sagittal suture followed by a 4 mm craniotomy (dura intact) between lambda and bregma, bordering the right of the midline. A 0.9-mm deformation (4.4 m/s; 800 ms dwell) was made in the exposed cortical area using a 3-mm-diameter sterile stainless-steel tip attached to a Neuroimpactor device. The scalp was then sutured, and mice recovered in a warm padded chamber. Sham mice underwent the same procedure minus the craniotomy and impact.
Neurological severity score
Thirty minutes after injury, mice were assessed for sensorimotor and locomotor impairments using a neurological severity score (NSS), which included the following assessments: gait, exploratory behavior, string test, beam balance, and a startle response (for task and rating details see Supplementary Data). A 30-min post-injury assessment was chosen because we observed that some of the measures of neurological injury resolved with a longer time point (1 h) after injury in our pilot studies. In order to quantify the temporal resolution of neurological injury, another cohort of mice was included to assess NSS at 30 min, 24 h, 48 h, and 72 h post injury.
Experimental design
The first experiment was conducted to characterize the extent of injury in our closed head injury model and to determine whether it causes an aberrant dendritic phenotype in the neurons born after mTBI. C57Bl/6J wild-type mice received a single sham (3 females, 5 males) or closed head injury (4 females, 4 males) at 2 months of age (Fig. 1A Timeline). Fluoro-Jade C (described in the Immunohistochemistry section) was used to compare the extent of cell death in the dentate gyrus and cortex of mice with a mTBI to similarly aged wild-type male mice (n = 3) that received a sham or CCI as previously described. 43 Mice with a CCI were included as a positive control for Fluoro-Jade C+ cells. All mice were euthanized 3 h after sham, mTBI, or CCI. To assess the resolution of injury, the NSS and locomotor behavior of mice were assessed over three days in another cohort of mice: sham (2 females; 2 males) and mTBI (2 females; 3 males). To assess the dendritic morphology of neurons born after mTBI, DCX-Cre/tdTom mice received a sham (2 females, 3 males) or a mTBI (4 females, 4 males) and were then injected with tamoxifen (i.p. 40 mg/kg twice daily, 7 h apart) for three days starting 1 week after sham or mTBI to induce expression of tdTom. Mice were euthanized 2 months later, which allowed assessment of the new neurons at a mature state.

mTBI resembles a mild concussive-like injury and generates new neurons with normal dendritic morphology.
We emphasize two key points to help explain the experimental groups, injury intervals and timeline we designed to address the neurogenic response to a repeated mTBI. First, increases in neurogenesis after TBI are transient, lasting about a week. 6 Second, adult-born neurons express GFP and DCX only when they are immature, at approximately 12 and 18 days of age, respectively. 45 To determine whether a second mTBI elicits a neurogenic response, POMC-EGFP mice underwent a first procedure, either a sham or mTBI (Fig. 2A Timeline). Three weeks later, mice received a second procedure, either a first or second sham or mTBI followed by bromodeoxyuridine (BrdU) administration (described in BrdU/EdU injections section). All mice were euthanized 18 days later. This design resulted in four groups with frequency-and age-matched exposure to anesthesia: sham-sham (2 females, 4 males); sham-mTBI (3 females, 4 males); mTBI-sham (3 females, 4 males); and mTBI-mTBI (3 females, 3 males). The sham-sham group was the control group. The sham-mTBI group was the single mTBI group that received a mTBI during its second procedure and served as the positive control. The mTBI-mTBI group was the repeated mTBI group. The mTBI-sham group, which received mTBI during the first procedure, allowed us to determine whether constitutive levels of neurogenesis were affected by the first mTBI. Because the neurogenic response is transient, levels of neurogenesis at this remote time of assessment in the mTBI-sham group (approximately 5 weeks post mTBI) were expected to return to baseline levels (e.g., comparable levels to the sham-sham group). Only groups that received a mTBI during their second procedure were expected to exhibit increases in neurogenesis.
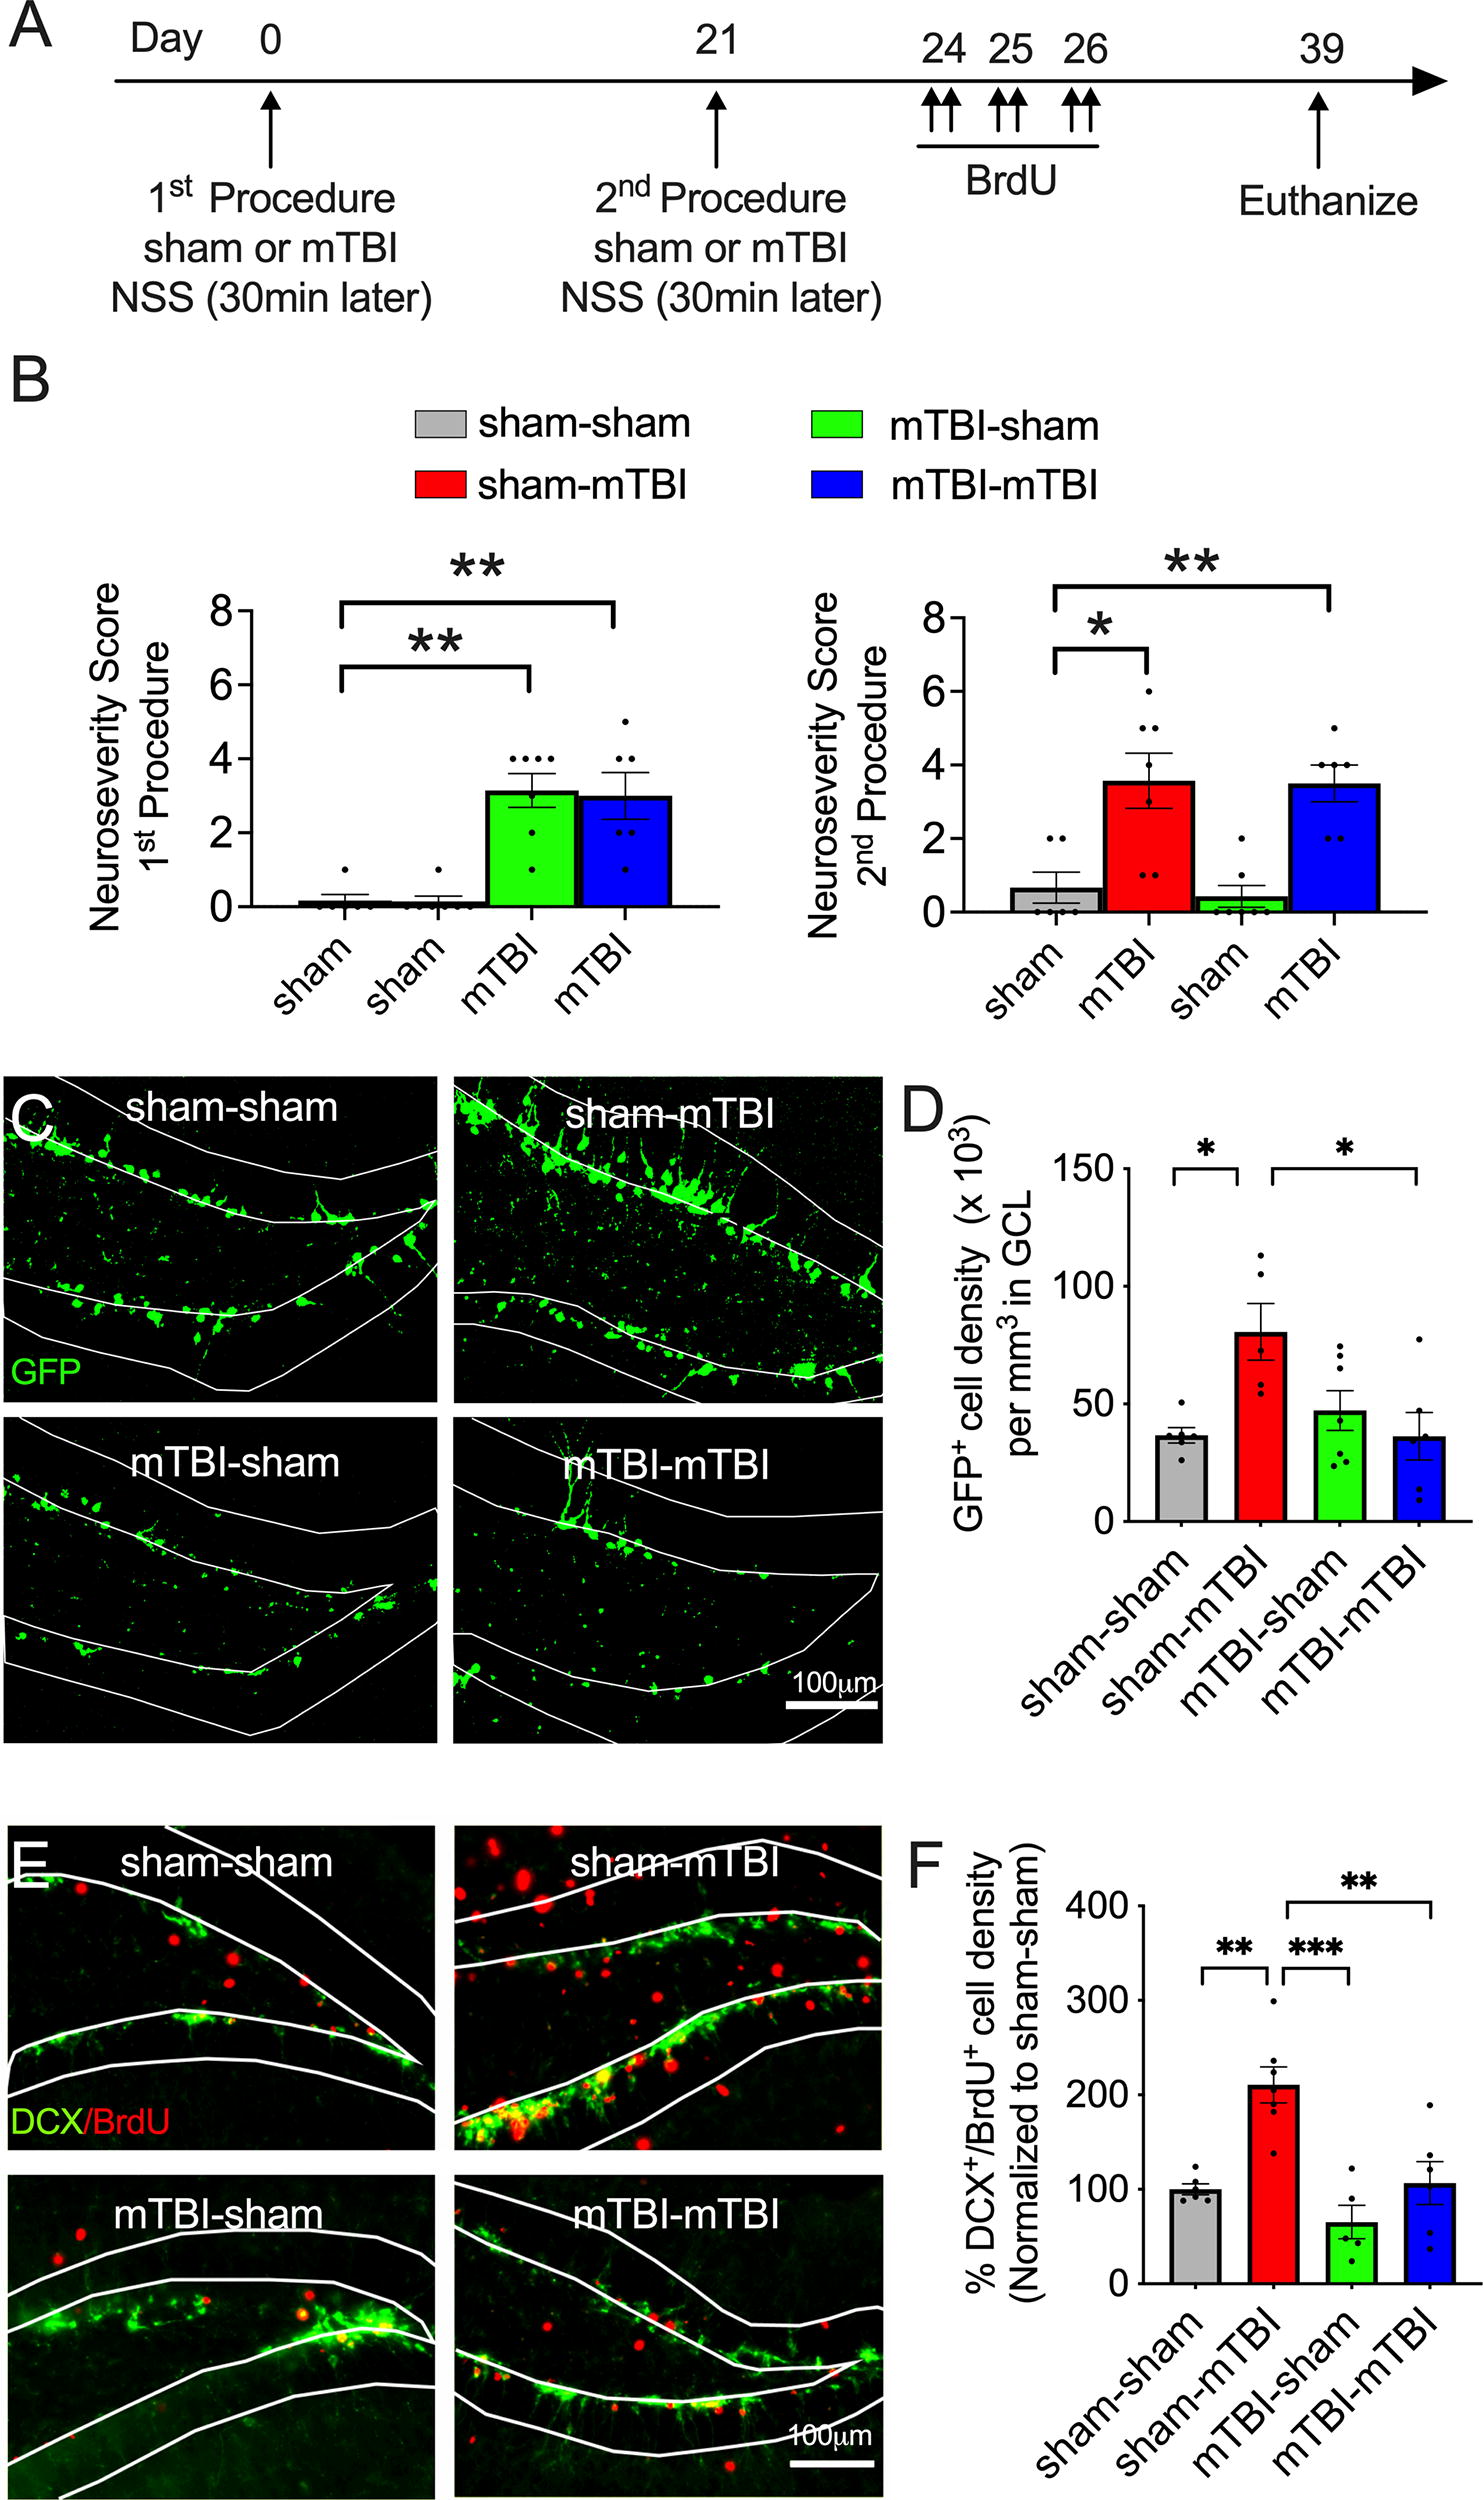
A prior mTBI impairs the neurogenic response to a second mTBI.
The 3-week interval allowed us to distinguish the cohort of new neurons born after the second procedure from those born during the first procedure. In other words, the transient expression of immature neuronal markers allowed us to exclude the neurons born after the first procedure as they would no longer express the immature markers. BrdU administration after the second procedure provided a second method of validation to ensure that our quantitation was specific for the neurons born after the second procedure. Mice were euthanized 18 days after the second procedure in order to selectively quantify the immature neurons born acutely after the second procedure via their expression of GFP or DCX.
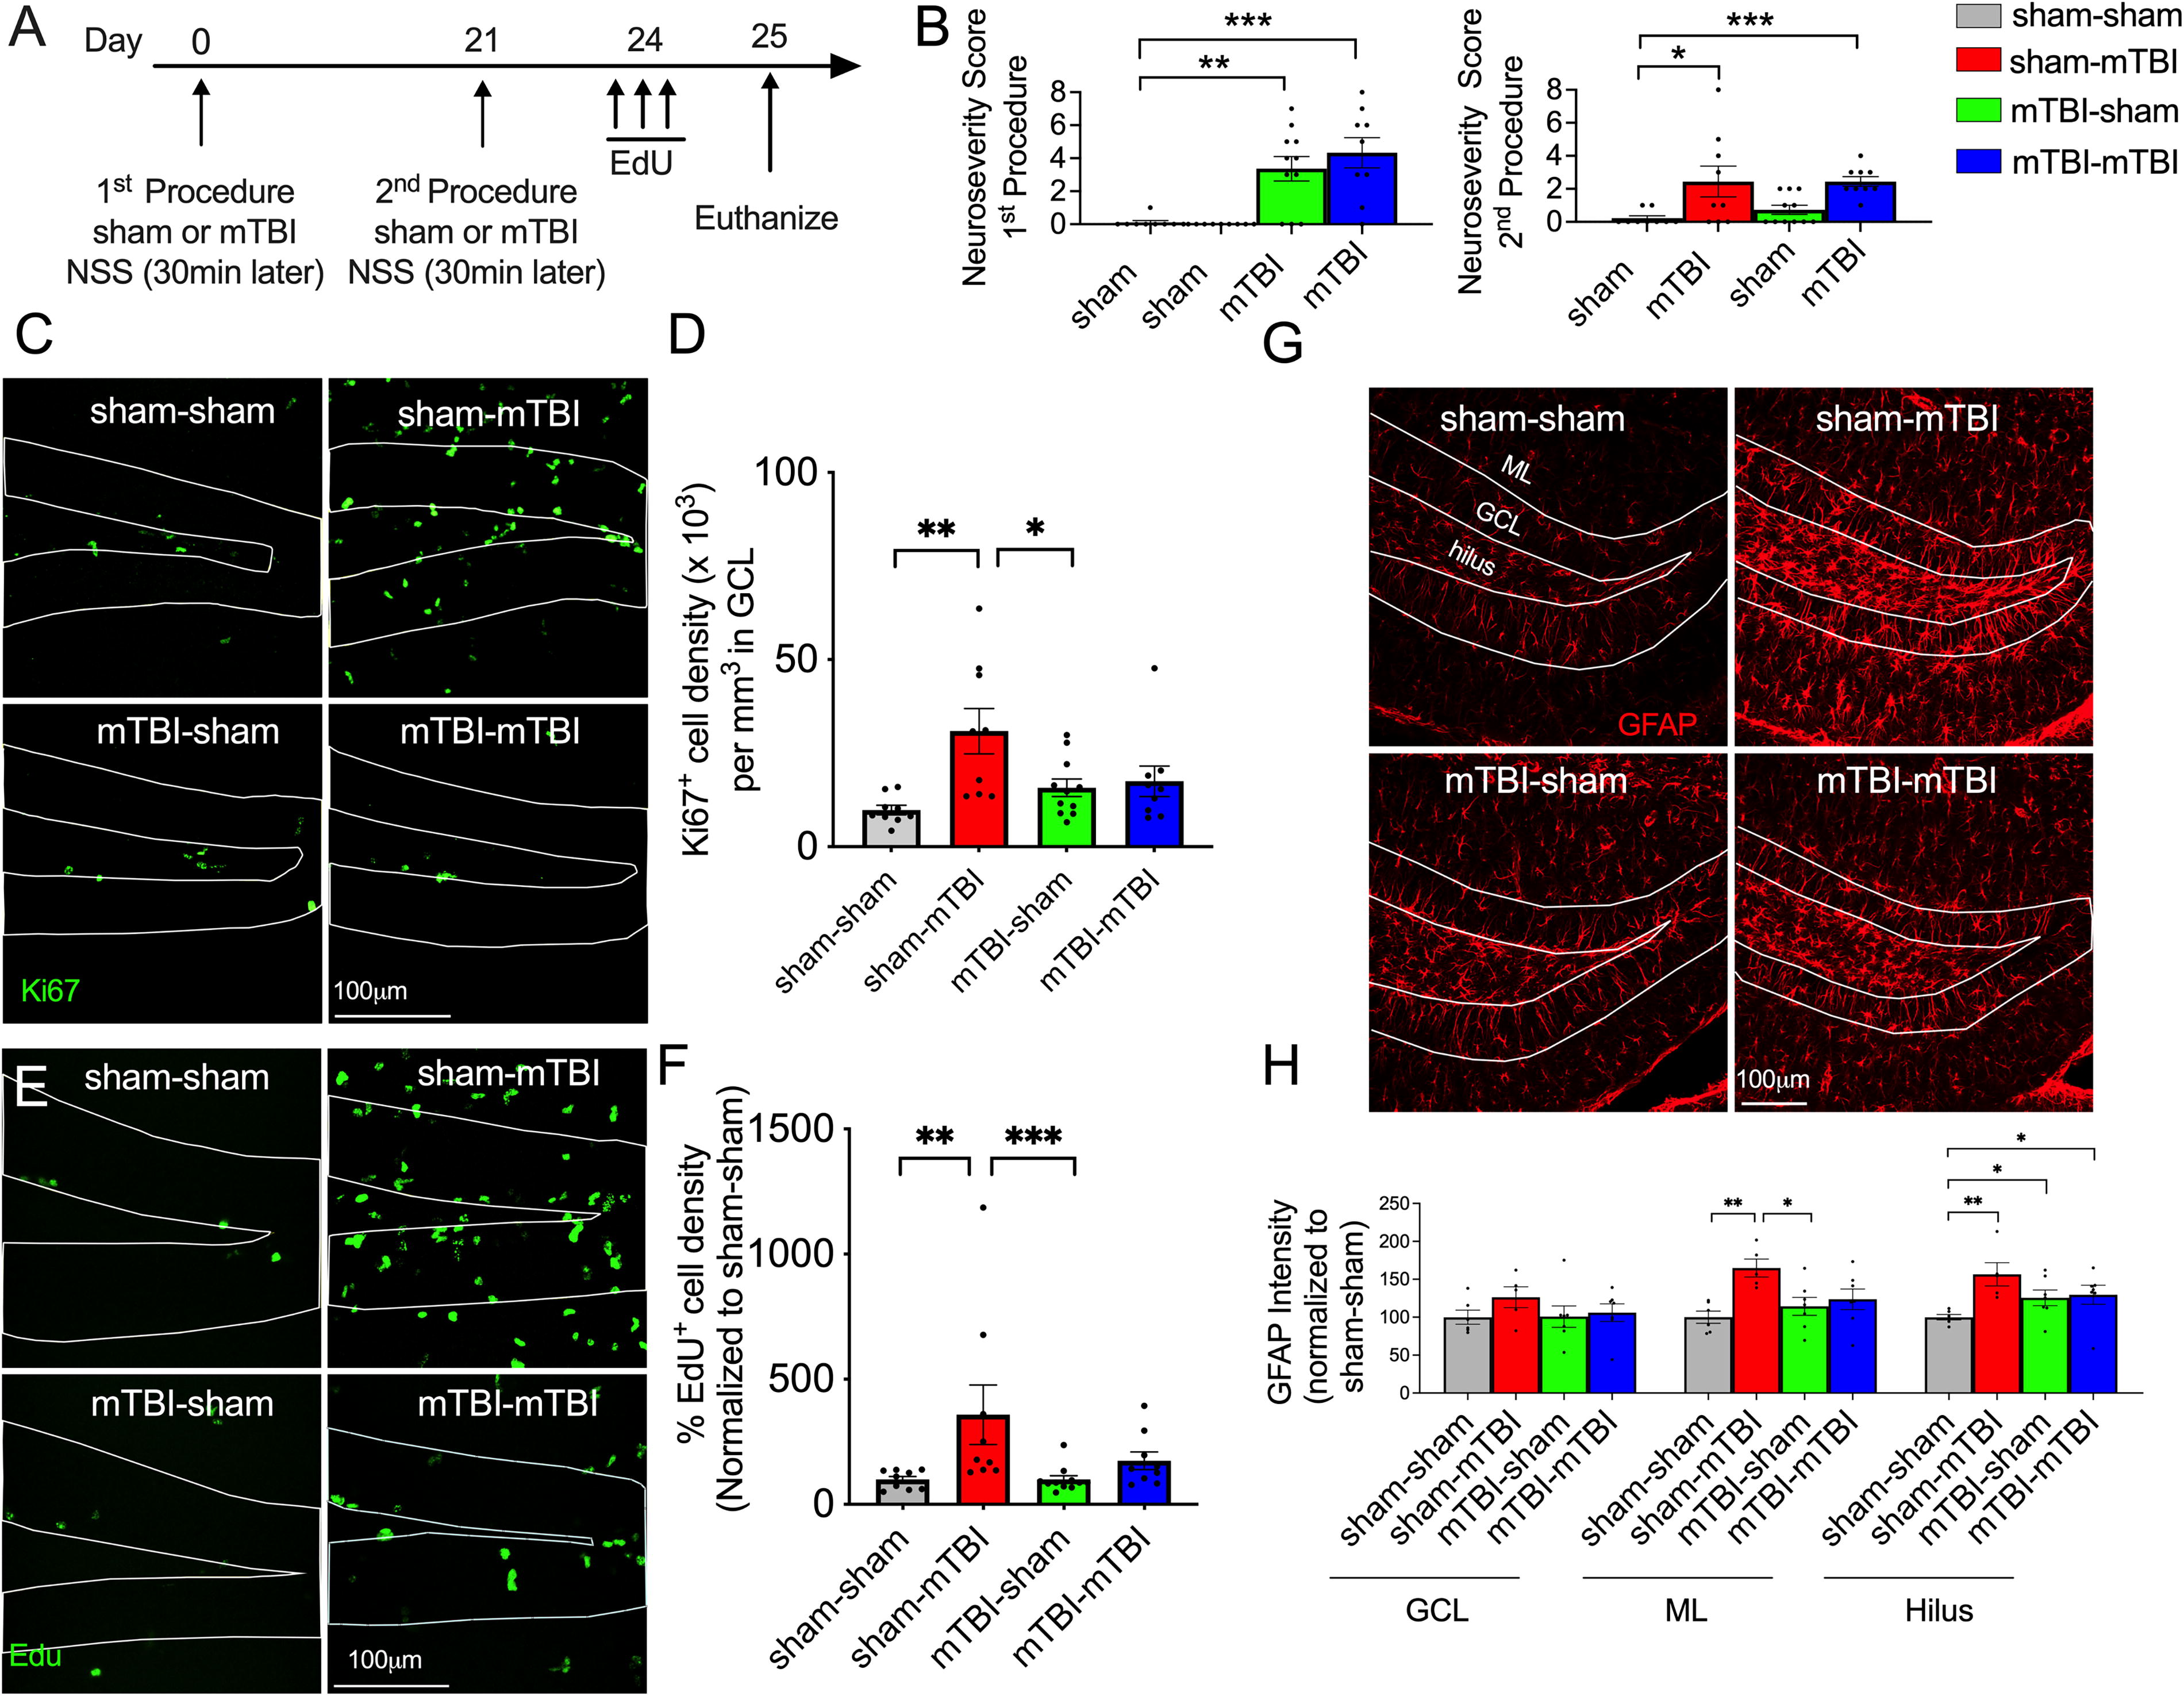
C57Bl/6J wild-type mice were then used to determine whether a subsequent mTBI elicits a proliferative response. The experimental design was similar to the prior experiment, but mice were instead injected with the mitotic marker ethynyldeoxyuridine (EdU) three days after the second procedure and were euthanized the following day in order to determine the degree of proliferating cells (Fig. 3A Timeline). The groups and number of mice were as follows: sham-sham (4 females, 5 males); sham-mTBI (4 females, 5 males); mTBI-sham (4 females, 6 males); and mTBI-mTBI (4 females, 5 males). Tissue samples from these mice were also analyzed for glial fibrillary acidic protein (GFAP) immunointensity and for proliferation of radial glia-like cells (RGCs). The number of samples for each group was as follows for GFAP immunointensity: sham-sham (4 females, 2 males); sham-mTBI (2 females, 3 males); mTBI-sham (3 females, 4 males); and mTBI-mTBI (3 females, 3 males).
A prior mTBI impairs the proliferative response to a second mTBI
C57Bl/6J wild-type mice were also used to determine whether the degree of the proliferative response after the first injury predicts deficits in the proliferative response to the second injury. Mice were injected with the mitotic marker bromodeoxyuridine (BrdU) for two days starting two days after the first mTBI and received a second sham or mTBI three weeks later followed by euthanasia the next day (Fig. 5A Timeline). The number of mice for each group was as follows: sham-sham (2 females, 4 males) and mTBI-mTBI (4 females, 4 males).
Another cohort of C57Bl/6J mice was also used to assess the proliferative response to a longer interval (2 month) between the two injuries. Mice received BrdU three days after the second procedure and were euthanized the following day to assess proliferation (Fig. 6A Timeline). In addition to NSS assessment, mice were placed on a brief (3 trial) rotorod paradigm 2 h after the second procedure (described below). The proliferative response of the RGCs and GFAP immunointensity were also assessed in these mice. The number of mice in each group was as follows: sham-sham (2 females, 2 males); sham-mTBI (4 females, 1 male); mTBI-sham (3 females, 1 male); and mTBI-mTBI (5 females, 2 males).
To assess whether the effect of mTBI on the dendritic morphology of new neurons is transient and whether it is observed after a repeated mTBI, another cohort of POMC-EGFP mice was used to label new neurons during their immature state. POMC-EGFP mice received two shams (2 females, 3 males) or two mTBIs (2 females, 2 males) 3 weeks apart and were euthanized 18 days after the second procedure (Fig. 8A Timeline). These mice were also used for a separate experiment in which they were given a single saline i.p. injection 2 h after their first procedure.
C57Bl/6J mice were used for behavioral testing in the water maze task (described in the Reversal water maze testing section). These mice received no injury, a single injury or two injuries 3 weeks apart and were behaviorally tested 1 month after the second procedure (Fig. 9A Timeline). The number of mice for each group was as follows: sham-sham (6 females, 8 males); sham-mTBI (6 females, 5 males); mTBI-sham (3 females, 6 males); and mTBI-mTBI (6 females, 6 males).
BrdU/EdU injections
POMC-EGFP mice were injected with the thymidine analog BrdU (i.p. 50 mg/kg) twice daily (4 h apart) for 3 days starting 3 days after the second procedure. Double labeling of BrdU with the immature marker, DCX provided a second measure of neurogenesis in addition to the GFP marker. To label proliferating cells, wild-type mice were injected with EdU (i.p. 50 mg/kg) 3 times daily (2 h apart) three days after the second procedure and were euthanized the following day.
Open field test
Immediately after the NSS assessment, mice were individually placed in a 40 × 40 cm open chamber (200 lux) with white walls for 10 min. To determine the temporal resolution of locomotor impairments, another cohort of mice was placed in the following open-field chambers with the times noted after a sham or mTBI: 26.8 × 61 cm clear chamber (30 min); 48.3 × 35.6 cm gray chamber (24 h); 40 × 40 cm white chamber (48 h); and a Y-maze shaped clear chamber with 45.7 × 10.2 cm arms (72 h). Different chambers were used in different rooms, and the sessions were reduced to 5 min in order to avoid habituation. The total distance moved and velocity were recorded and analyzed using Ethovision XT Software (Noldus; The Netherlands).
Rotorod testing
Two hours after the second procedure, mice were placed on a rotating rod (Rotomex-5, Columbus Instruments, Columbus, OH) initially rotating at 5 rpm by an experimenter blind to the group assignment of the mice. Once all four mice were placed on individually divided sections of the rod, the speed of the rod was automatically increased by 1 rpm every 3 s for a maximum of 24 rpm. Beam breaks digitally recorded the fall of each mouse. Three trials were conducted 5 min apart for each mouse approximately 2 h after the second procedure. The rotorod was conducted on the mice with a 2-month injury interval.
Reversal water maze testing
One month after the second procedure, mice were tested on the water maze by an experimenter blind to the group assignment of the mice. One hour prior to daily morning testing, mice were moved to a holding room separate from the water maze. They were placed in individual cages that sat half way on top of a heating pad. The water maze (122 cm circular pool) was placed in the middle of a room with stationary distal cues and filled with opaque water (white Crayola color) maintained at 20°C. A clear circular platform (10 cm in diameter) invisible to the mice (2 cm under the water surface) was located in the middle of one of four imaginary quadrants of the pool. Mice were trained to locate the platform with four trials per session (10 min inter-trial-intervals) with one session per day for 3 days. Mice that did not locate the platform before 60 sec were hand-led to it. All mice were allowed to remain on the platform for 5 sec. On the 4th day, the platform was removed and the time the mice spent searching in the quadrant where the platform was previously located was assessed. On the 5th day, the location of the platform was moved to the opposite quadrant, and the mice were trained to locate the new location for 3 days followed by a second probe trial on the 8th day. Ethovision was used to analyze the swimming patterns of mice.
Immunohistochemistry
Mice were deeply anesthetized, and transcardially perfused with 0.9% saline followed by 4% paraformaldehyde according to IACUC-approved methods. Brains were removed, post-fixed overnight, cryoprotected in 30% sucrose, and then frozen. Three to four coronal sections (70 µm thick) of the hippocampus approximately spanning −1.46 to −2.8 from bregma were selected from each mouse, washed, and permeabilized in phosphate buffered saline with 0.4% Triton (PBST). Sections stained for BrdU were treated with 2N HCl at 37°C for 30 min, followed by neutralization in 0.1M sodium tetraborate for 10 min and washed with PBST (pH 7.4) for 30 min. EdU staining was performed using a Click-iT EdU Imaging Kit (Invitrogen). All sections were then blocked using a buffer of 4% normal donkey serum in PBST, then incubated overnight at 4°C with primary antibodies diluted in 2% normal donkey serum in PBST. Primary antibodies were as follows: rabbit anti-GFP (1:400; Invitrogen, A-21311; Lot 2551333); guinea pig anti-DCX (1:500; Millipore, AB2253); rabbit anti-Kiel (Ki67,1:400; Abcam, AB15580; Lot 1009703-1), rat anti-BrdU (1:500; Santa Cruz, sc-70441; Lot F0515), rat anti-Sox2 (1:400; Invitrogen, 14-9811-82; Lot 2213316), mouse anti-GFAP (1:600; Novus, NBP1-05197); rabbit anti-GFAP (1:600; Dako, Z0334); and rabbit anti-tdTom (1:500; Clonetech, 632496; Lot 1612022). EdU (Invitrogen, C10086; Lot 1985283) was stained according to the manufacturer’s recommendations. Sections were washed the following day and incubated with secondary antibody solutions for 2 h at room temperature. Secondary antibodies were as follows: donkey anti-rat (1:500; Alexa Fluor 555, Invitrogen), donkey anti-rabbit (1:500; Alexa Fluor 488, Invitrogen), goat anti-guinea pig (1:500; Invitrogen), and donkey anti-mouse (1:500; Alexa Fluor 647, Invitrogen). Lastly, sections were washed with PBST, incubated with 4′,6-diamidino-2-phenylindole (DAPI) in PBST (1:10,000) for 20 min, and then mounted with Vectashield Anti-Fade Mounting Medium.
Fluoro-Jade C (Histo-Chem Inc. 1FJC; Lot 17) staining was performed on mice that were sacrificed 3 h after sham or injury. Slices (70 µm thick) taken from directly beneath the injury site were mounted and dried on Colorfrost Plus slides, ethanol rehydrated, incubated in 0.06% potassium permanganate for 10 min, followed by 0.002% Fluoro-Jade C for 10 min. Slices were cleared with xylene and coverslipped with castor oil.
Image analyses
Slides were coded for blind analyses and imaged using a Leica Mi8 confocal microscope with a 20x/0.8 NA lens. Unless stated otherwise, analyses were conducted on the ipsilateral (injured) hippocampus. To assess neurogenesis, GFP+ and DCX+/BrdU+ cells within the granular cell layer (GCL) of the dentate gyrus were imaged through a 10 µm stack. These included the infra- and suprapyramidal blades of the dentate gyrus. To assess proliferation, Ki67+, EdU+, and BrdU+ cells within the GCL were imaged through a 20 µm stack. RGCs within the GCL were identified using GFAP/Sox2 labeling and by their primary process as previously described. 46 The density of cells was calculated by normalizing the number of cells to the GCL volume (area multiplied by the depth). The percent of proliferating RGCs was calculated by the density of GFAP+/Sox2+/Ki67+ cells divided by the density of GFAP+/Sox+ cells. To assess the dendrites of new neurons for Sholl analysis (Image J2 version 2.3.0/1.53f), individual GFP+ and tdTom+ cells were imaged through their entire dendritic tree. Only GFP+ and tdTom+ cells that did not have truncated dendrites due to sectioning were included in the analyses. Because neurogenesis frequently occurs in clusters, 3D reconstructions were made to correctly identify the dendrites from individual cells. For each mouse, 8–10 cells from 3 to 4 different sections were traced. For intensity analyses of GFAP, z-stacks of 7 µm were obtained at consistent starting points using DAPI, and the mean intensity of pixels within the GCL, ML, and hilus was quantified using ImageJ after digital subtraction of mean background values. DAPI was used to trace the GCL but was omitted from most representative images to better illustrate group differences for the various markers. The GCL in the representative images is traced in white to show region of analysis for the various markers. The brightness of all images, including representative images, was enhanced in the exact same manner for all groups.
Statistical analyses
All figures were generated using Prism Software Version 9.5 (GraphPad Software, La Jolla CA), and data were analyzed using SPSS Version 28 (IBM SPSS Statistics, Armonk, NY). Data normality for each measure was assessed using a Shapiro–Wilk test to determine the use of parametric versus nonparametric statistical tests as indicated in the Results section. Because the repeated procedures are interrelated, that is, the first sham or mTBI may affect the response of the second sham or mTBI, differences were assessed by a one-way ANOVA in order for each of the groups to remain independent. Analyses were followed by a Bonferroni post hoc test where appropriate. Data that did not meet normality were assessed with a Kruskal–Wallis test followed by a Mann–Whitney U post hoc test (two-tailed) where appropriate. Group comparisons were considered significant at p < 0.05. EdU and BrdU quantifications were normalized to the control group (sham-sham) within their cohorts. Linear regressions were used to analyze the relationship between neuroseverity scores and BrdU+ cell densities and BrdU+ and Ki67+ cell densities. Sholl analysis was conducted using a repeated measures ANOVA with the group assignment as the between-subject factor and the distance from soma (branch point) as the within-subject factor. The water maze learning curves were analyzed with a repeated measures ANOVA with group assignment as between subject factor and sessions as the within-subject factor. In the probe trial analysis of quadrant preference, the percent time in each quadrant is dependent on the other three quadrants. Therefore, a one-way ANOVA was used within each group to assess quadrant preference in the first probe trial, and the difference between the old and new platform quadrants was assessed using a Student’s t-test. Data are expressed as means ± SEM. The dots in the graphs represent the number of mice per group for each measure.
Results
mTBI resembles a concussive-like injury and generates new neurons with typical dendritic morphology
Here, we ask whether a history of a concussive-like injury impairs the neurogenic response to a subsequent injury. The extent of neurological and histological pathology after a single mTBI was assessed to determine if it resembles a concussive-like injury (Timeline Fig. 1A). The NSS was measured 30 min after each procedure because in pilot studies we found that deficits mostly resolved after 45–60 min. The time it took mice to rise on all limbs after surgery (righting reflex) was significantly longer in the mTBI group compared to the sham group (Fig. 1B; p = 0.0002, Mann–Whitney U, n = 8/group). NSSs assessing gait, exploratory behavior, string test, beam balance, and startle response 30 min after surgery showed deficits in mTBI mice (Fig. 1C; p = 0.0003, Mann–Whitney U; n = 8/group). The mTBI group moved less (Fig. 1D, p = 0.007, Mann–Whitney U; n = 8/group) and slower (Fig. 1E, p = 0.007, Mann–Whitney U; n = 8/group) than the sham group in the open field (Fig. 1D, E). Another cohort of mice that was added to assess the temporal resolution of injury showed that the NSS of mice was comparable to sham mice 48 h after injury (Supplementary Fig. S4). Unlike the more severe CCI model, there was no gross cell death hours after a closed head injury in the dentate gyrus (Fig. 1F) nor around the somatosensory cortex near the impacted site (Supplementary Fig. S3). No gross cell death was observed in the contralateral hemisphere (data not shown). Small hematomas were noted in ∼25% of the mice assessed acutely after injury (within 3 days); however, none of the mice had subarachnoid hemorrhages or skull fractures. Apnea ranging from 4 to 20 sec was observed in some of the mice immediately after injury.
Prior studies demonstrate that neurons born acutely after CCI as well as other types of brain insults have aberrant dendritic morphologies, which could result in maladaptive integration within the hippocampal circuitry, thus potentially rendering them more harmful than beneficial. These dendritic abnormalities can be characterized by early dendritic branching near the soma; lateral branching across the GCL; and by the development of multiple versus one primary dendrite. 39,41,42 To determine whether a mTBI resembling a concussive-like injury also results in aberrant neurogenesis, tamoxifen was administered to DCX-Cre/tdTom mice to label the neurons born acutely after mTBI. The mice were sacrificed five weeks after sham or injury to allow the newborn neurons to mature. The dendritic analysis of 6- to 8-week-old tdTom labeled neurons that were born after a single mTBI demonstrates they are morphologically similar to those born in non-injured mice (Fig. 1G and H). Sholl analysis (Fig. 1 I and J) showed similar dendritic measures between the sham and mTBI groups. It appeared that neurons from the mTBI group may have had increased branching approximately 150 µm from the soma, but the group by branch point interaction did not reach significance (F3.9, 324 = 2.23; p = 0.068, repeated measures ANOVA, Greenhouse Geisser). There was no significant interaction between group and branch point (F3.9, 324 = 2.30; p = 0.061, Greenhouse Geisser, n = 42–46 cells/group). There was no difference in the total dendritic length of the neurons born after sham versus mTBI (Fig. 1J).
Increases in neurogenesis are absent after a second mTBI
To determine if a second mTBI elicits a neurogenic response, POMC-EGFP mice received a single or a second sham or mTBI 3 weeks apart (Timeline Fig. 2A). The 3-week time period was chosen to allow the cohort of neurons born after the first procedure to mature and stop expressing immature neuronal markers. For an additional measure of neurogenesis, mice were injected with the mitotic marker BrdU after the second sham or mTBI in order to colabel the cohort of newborn neurons with the immature neuronal marker DCX.
The NSS of mice was assessed 30 min after the first and second treatment (Fig. 2B). Analysis of the NSS after the first treatment showed a group effect (Fig. 2B; p = 0.0002, Kruskal–Wallis; n = 9–11/group): Compared to the sham-sham group, the mTBI-sham and the mTBI-mTBI groups had a greater NSS (p = 0.0022 and 0.0035, respectively, Mann–Whitney U). Similarly, analysis of the NSS 30 min after the second procedure only showed elevated NSS levels in mice that received a mTBI (p = 0.0014, Kruskal–Wallis): Compared to the sham-sham group, the sham-mTBI and mTBI-mTBI groups had a greater NSS (p = 0.0134 and 0.0074, respectively, Mann–Whitney U). Notably, the mTBI-sham group that received a single mTBI weeks prior to the second procedure (green bars) no longer showed an elevated NSS, illustrating transient neurological impairments that resemble a concussion. Also noteworthy, the NSS of the mTBI-mTBI group (blue bars) did not differ from the NSS of sham-mTBI group (red bars).
There was a significant group effect in the density of GFP+ cells (Fig. 2C and D; F3,20 = 4.953; p = 0.01, one-way ANOVA, n = 5–7/group): A Bonferroni post hoc test determined that the sham-mTBI mice had greater densities of GFP+ cells compared to the sham-sham (p = 0.018) and mTBI-mTBI groups (p = 0.017). In contrast, the mTBI-mTBI group had similar densities of GFP+ cells as the sham-sham group. Notably, the density of GFP+ cells in the mTBI-sham group did not differ from the sham-sham group (Fig. 2D, green versus gray bars), indicating that baseline levels of neurogenesis were not impaired at this time period after a single mTBI (approximately 5.5 weeks). Importantly, because the neurogenic response is transient and the expression of GFP stops at about 12 days of age in the new cells, 45 increases in neurogenesis that occurred acutely after mTBI in the mTBI-sham group were not expected to be captured at this later time point. There was a similar group effect in the density of DCX+ cells colabeled with BrdU (Fig. 2E and F; F3,20 = 13.11; p < 0.0001; one-way ANOVA; n = 5–7/group). A Bonferroni post hoc analysis showed that the sham-mTBI group had a greater density of DCX+/BrdU+ cells compared to the sham-sham group (p = 0.0011), the mTBI-sham group (p < 0.0001), and the mTBI-mTBI group (p = 0.0022). Again, the lack of increase in the density of immature neurons following a second injury in the mTBI-mTBI group occurred in the absence of deficits in baseline levels of neurogenesis in the mTBI-sham group (Fig. 2F, green versus gray bars). An example of a zoomed in image of DCX+/BrdU+ cells used for quantification is provided in the Supplementary Fig. S2. Although similar group trends in DCX+/BrdU+ cell densities were observed on the contralateral dentate gyrus, there was no significant group effect (p = 0.285, Kruskal–Wallis; sham-sham = 99.83 + 17.02; sham-mTBI = 209.0 + 55.93; mTBI-sham 101.8 + 27.41; mTBI-mTBI = 135.70 + 46.19, n = 5–7/group).
Lack of a proliferative response of RGCs to a second mTBI
To determine whether impairments in the neurogenic response after a subsequent mTBI were associated with impairments in proliferation, wild-type mice underwent two procedures (sham or mTBI) 3 weeks apart and were injected with the mitotic marker EdU 3 days after the second procedure (Timeline Fig. 3A). Mice were injected 3 days after the second procedure to catch the peak of proliferation. 6,8
Similar to prior observations, analysis of the NSS after the first procedure showed a group effect on the NSS of mice (Fig. 3B; p < 0.0001, Kruskal–Wallis; n = 9–11/group). A Mann–Whitney U analysis determined that the NSS of the mTBI-sham and mTBI-mTBI groups were greater than the sham-sham group (p < 0.0001). A group effect on the NSS of mice was also observed after the procedure (p = 0.0015, Kruskal–Wallis; n = 9–11/group): Compared with the sham-sham group, the sham-mTBI and mTBI-mTBI groups had a greater NSS (p = 0.032 and p < 0.0001, respectively, Mann–Whitney U).
There was a group effect on the density of Ki67+ cells (Fig. 3C and E, p = 0.0075, Kruskal–Wallis; n = 9–11/group). The sham-mTBI group had higher densities of Ki67+ cells compared to sham-sham and mTBI-sham groups (p = 0.0012, and 0.0310, respectively, Mann–Whitney U). In contrast, the density of Ki67+ cells in the mTBI-mTBI group was no different from the sham-sham group (p = 0.07, Mann–Whitney U). A similar group effect was observed in the density of EdU+ cells (Fig. 3E and F, p = 0.0017, Kruskal–Wallis; n = 9–11/group): A Mann–Whitney U analysis determined that the sham-mTBI group had a higher density of EdU+ cells compared to the sham-sham and the mTBI-sham groups (p = 0.0031 and 0.0001, respectively), whereas the density of EdU+ cells in the mTBI-mTBI group did not differ from the sham-sham group (p = 0.0623). Notably, the lack of increase in proliferation within the mTBI-mTBI group was again observed in the absence of deficits in baseline levels of proliferation (Fig. 3F, green versus gray bars). In contrast to the neurogenesis marker DCX, we found a significant group effect on the density of Ki67+ cells within the contralateral dentate gyrus (p = 0.011, Kruskal–Wallis, n = 6 −10/group; density of Ki67+ cells: sham-sham group = 7553 ± 1140; sham-mTBI group = 16969 ± 2583; mTBI-sham group = 7945 ± 1065; mTBI-mTBI group = 10572 ± 1355). The sham-mTBI group had a greater density of Ki67+ cells than the sham-sham and mTBI-sham groups (p = 0.0012 and 0.0075, respectively, Mann–Whitney U), whereas the mTBI-mTBI did not.
Not surprisingly, the intensity of GFAP staining appeared to differ between mice with a sham versus injury. Therefore, we compared the pixel intensity of each group as a semiquantitative means to assess group differences within the different layers of the dentate gyrus. Both astrocytes and RGCs express GFAP, but within the dentate gyrus, the soma and primary processes of RGCs are located in the GCL, whereas astrocytes are largely found in the hilus and molecular layer. Thus, we analyzed the pixel intensity of GFAP individually within the GCL, ML, and hilus using a Kruskal–Wallis nonparametric test followed by a Mann–Whitney post hoc test. Although the sham-mTBI group appeared to have higher GFAP intensities within the GCL compared to the sham-sham group, a group effect did not reach significance (Fig. 3G and H, p = 0.369; n = 5–7/group). In contrast, there was a group effect within the ML (p = 0.022; n = 5 −7/group): The sham-mTBI group had greater GFAP intensities than the sham-sham (p = 0.0043) and mTBI-sham groups (p = 0.0177). There was also a group effect in the hilus (p = 0.0152; n = 5–7/group). Compared to the sham-sham group, higher GFAP intensity levels were observed in the sham-mTBI (p = 0.0043), mTBI-sham (p = 0.0350), and mTBI-mTBI groups (p = 0.0350).
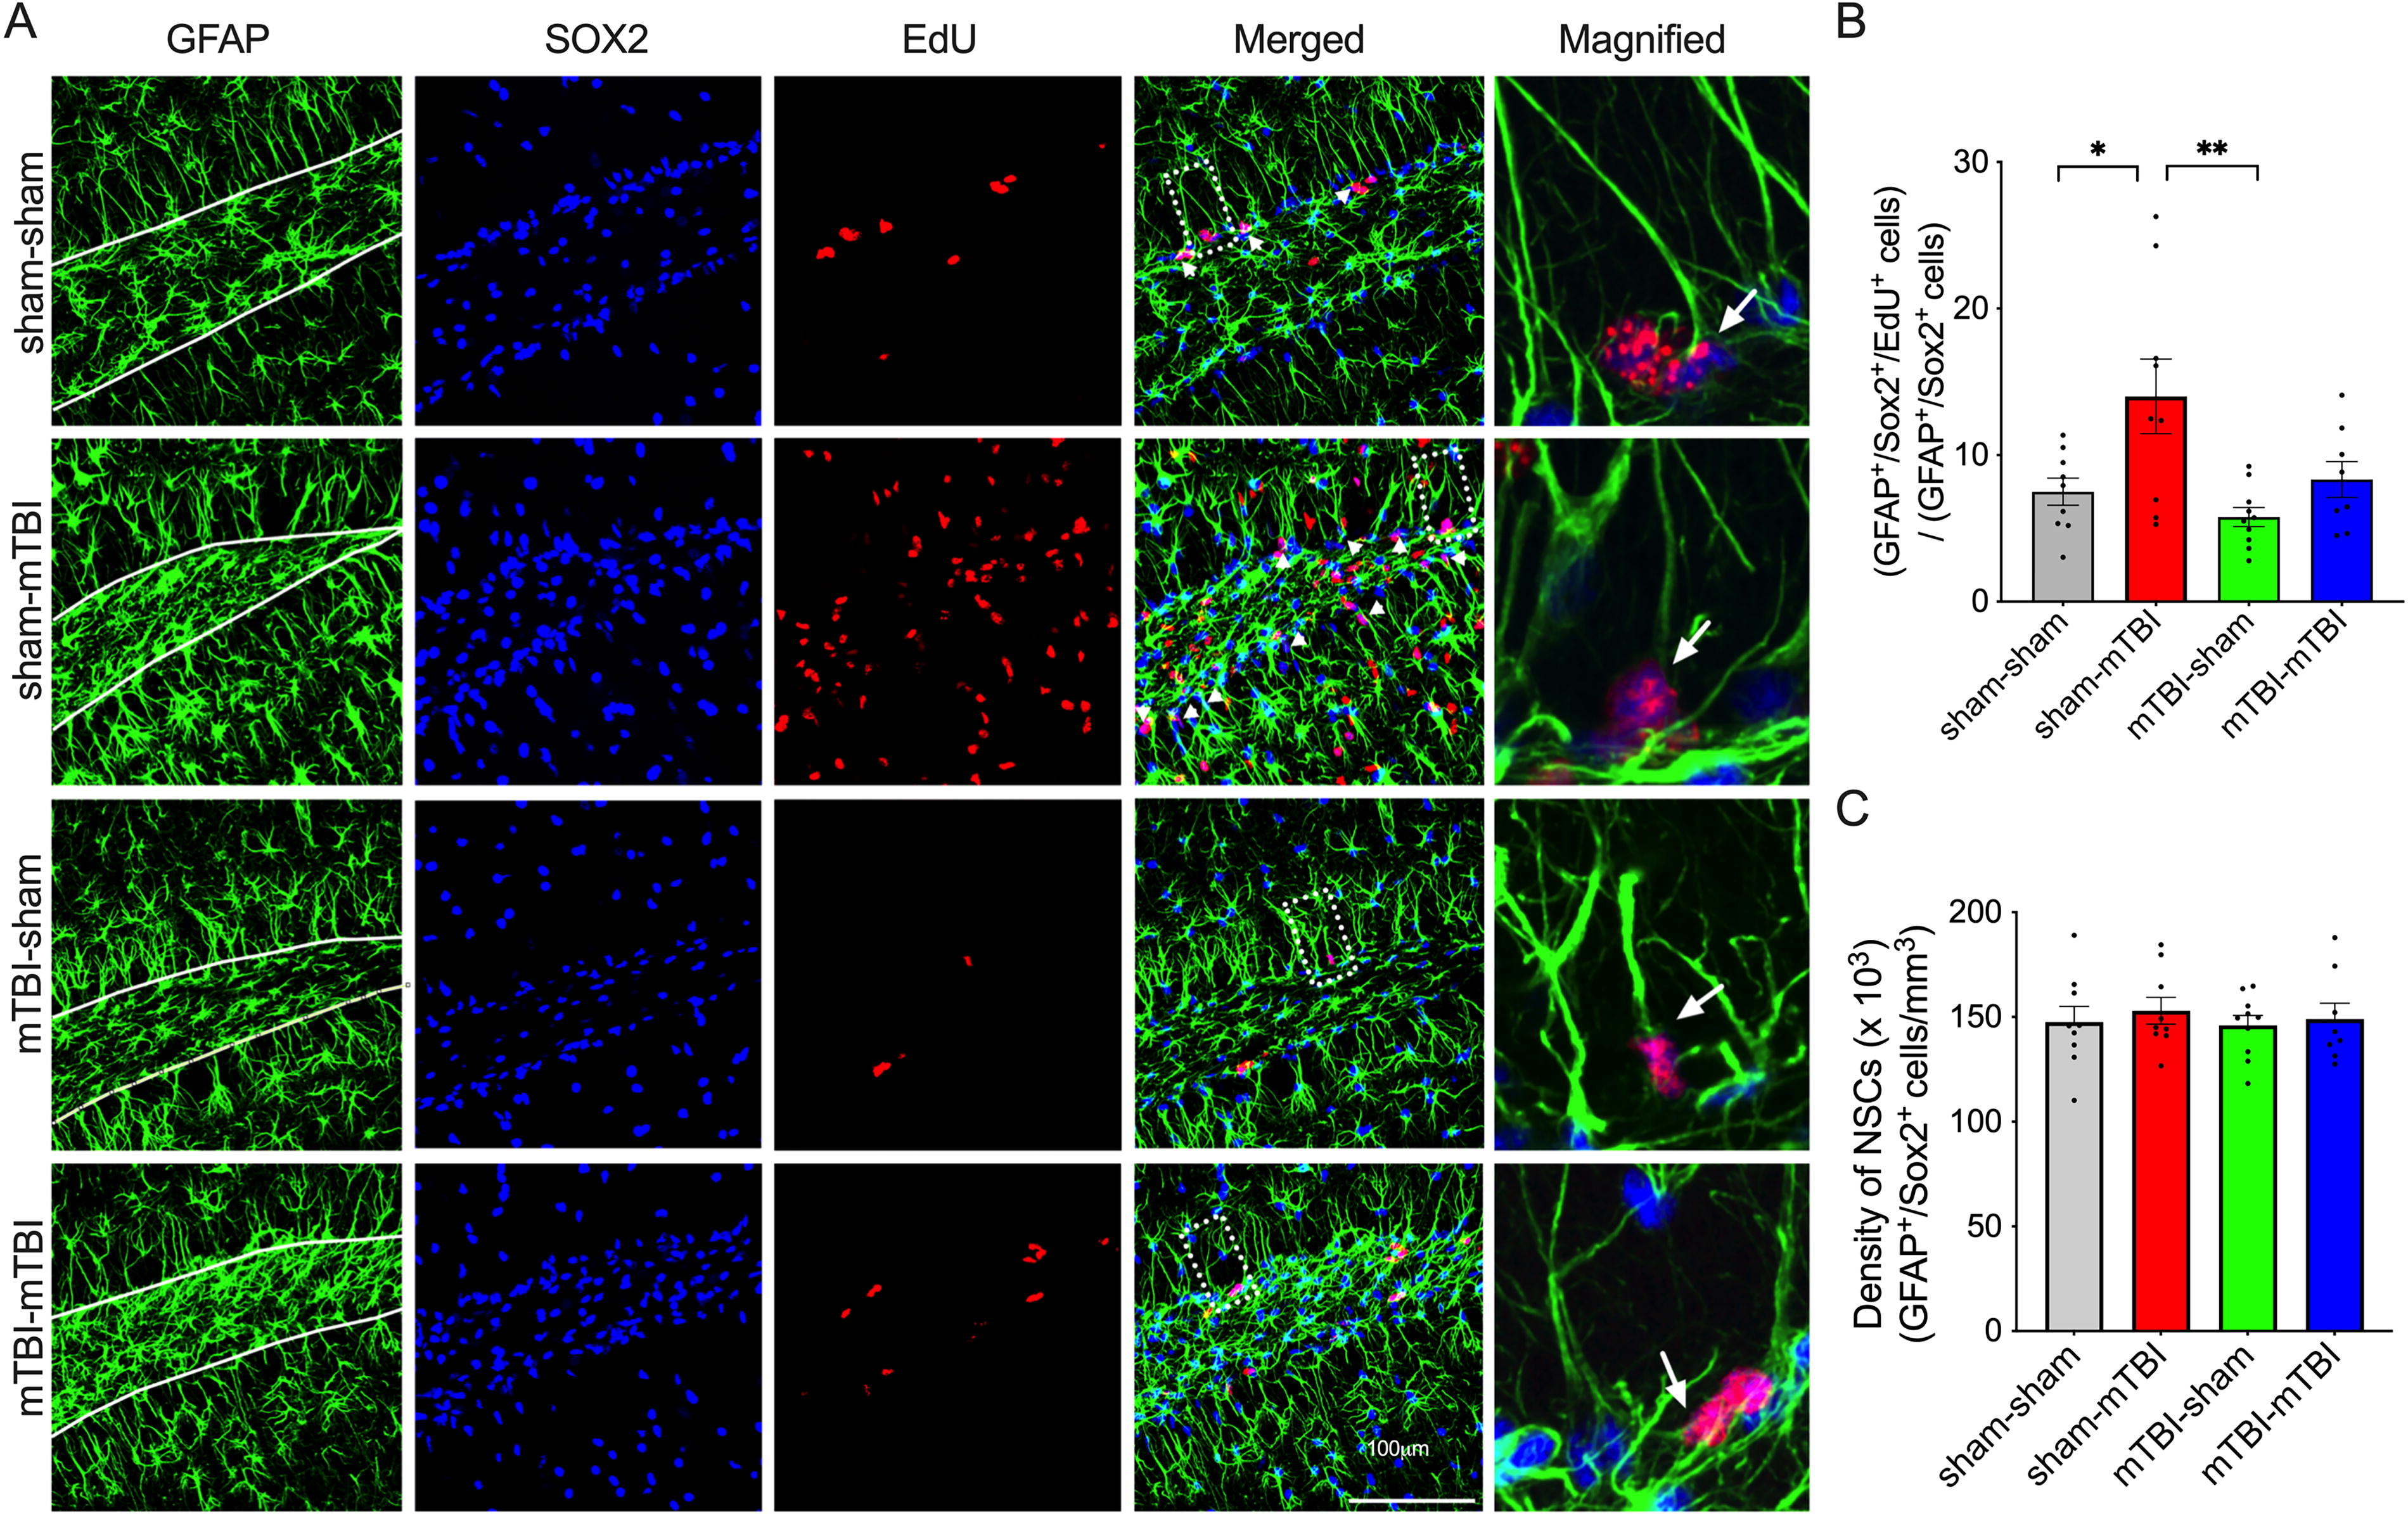
Increases in neurogenesis after TBI are driven by the proliferation of RGCs. 47 Thus, we next determined whether there were group differences in proliferation specifically within the RGCs. There was a group effect on the density of GFAP+/Sox2+ cells co-labeled with EdU (Fig. 4A and B, F3,32 = 5.796, p = 0.0028: one-way ANOVA): A Bonferroni post hoc test determined that the sham-mTBI group had a greater density of proliferating RGCs than the sham-sham (p = 0.0263) and the mTBI-sham groups (p = 0.0022). In contrast, the density of proliferating RGCs in the mTBI-mTBI group were no different from that of the sham-sham group. There were no deficits in baseline levels of RGC proliferation (Fig. 4B, green versus gray bars), and notably, there were no deficits in the density of total RGCs between the different groups as assessed by the density of GFAP+/Sox+ cells (Fig. 4C).
Absent proliferative response of radial glia-like cells to a second mTBI
The density of BrdU+ cells after an initial mTBI predicts the proliferative response to second mTBI
The degree of neurological injury predicts increases in the neurogenic response. 8 In line with this observation, we observed that the NSS of mice after an initial mTBI predicted the degree of BrdU+ cells generated after that initial injury (Fig. 5C; r2 = 0.67; p < 0.0004, linear regression, n = 6–8/group). We next asked whether the degree of proliferation after the first injury also predicts the proliferative response to the second injury. We found that the density of BrdU+ cells, which were labeled 3 days after the first injury (Fig. 5A Timeline), was inversely correlated with the density of Ki67+ cells present 3 days after the second injury (Fig. 5D; r square = 0.55; p < 0.0354 linear regression, n = 8), suggesting that impairments in the proliferative response to the second mTBI can be predicted by the degree of proliferative response to the first injury.
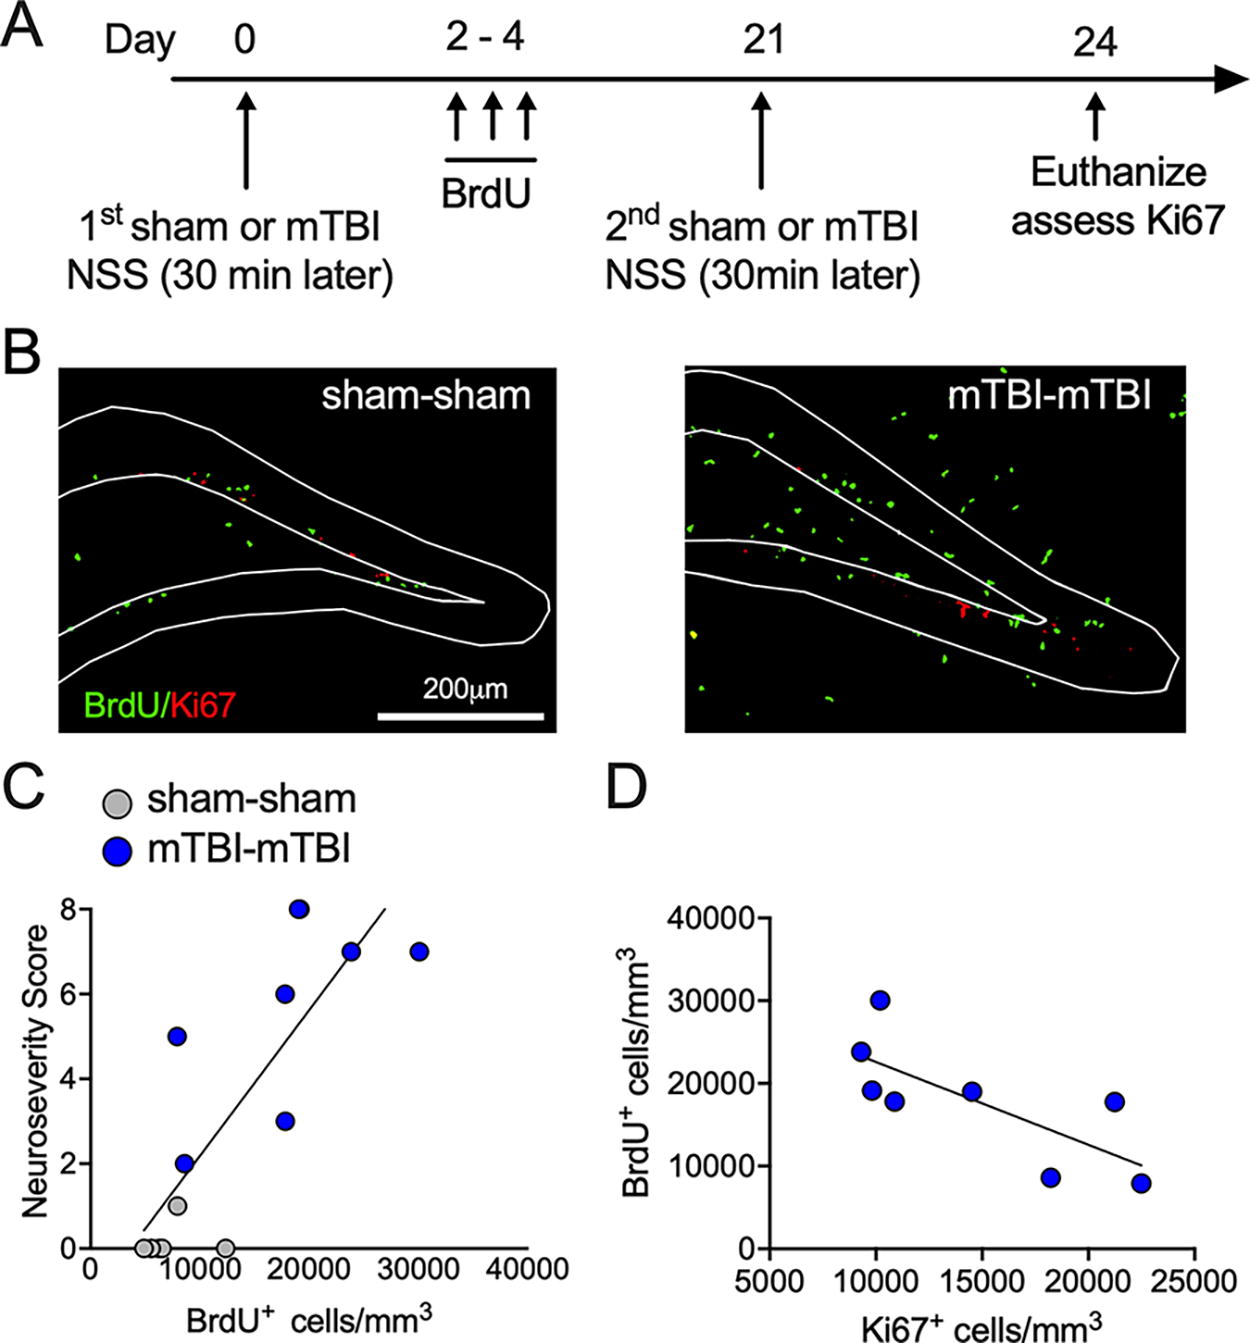
The proliferative response to an initial mTBI predicts the response to a second mTBI.
Increasing the injury interval does not ameliorate impairments in the proliferative response of RGCs
We considered the possibility that the RGCs may require a longer interval between injuries to functionally recover, thus we increased the injury interval to 2 months (Timeline Fig. 6A). Furthermore, to determine whether our results were replicable using other markers of proliferation, we used BrdU, which is the most commonly used thymidine analog, in addition to Ki67, which is expressed in all phases of the cell cycle except the G0 phase.

Increasing the injury interval does not ameliorate deficits in the proliferative response to a second mTBI.
There was a group effect on the NSS of mice after the first procedure (Fig. 6B; p = 0.0019, Kruskal–Wallis; n = 4–7/group). Compared to the sham-sham group, the mTBI-sham and mTBI-mTBI had a greater NSS (p = 0.0139 and 0.0061, respectively, Mann–Whitney U). There was also a group effect on the NSS 30 min after the second procedure (p = 0.0019, Kruskal–Wallis; n = 4–7/group). Compared to the sham-sham group, the NSS of the sham-mTBI group was greater (p = 0.0073, Mann–Whitney U); However, in stark contrast to our prior observations (Figs. 2B and 3B), the NSS of the mTBI-mTBI group was not different from that of the sham-sham group.
Surprised by this result, we conducted a rotorod test 2 h after the second sham or mTBI. Significant group differences were observed in the last of three trials (Fig. 6C, p = 0.0170, Kruskal–Wallis, n = 4–7/group): The sham-mTBI group had shorter latency than the sham-sham and mTBI-mTBI groups (p = 0.049 and 0.0118, respectively, Mann–Whitney U). In agreement with the surprising NSS after the second procedure, the mTBI-mTBI group did not differ from the sham-sham group (blue versus gray bars).
There was a group effect on the density of Ki67+ cells (Fig. 6D and E; F3, 16 = 30.09; p < 0.0001; one-way ANOVA; n = 4–7/group): A Bonferroni post hoc test determined that the sham-mTBI group had increased densities of Ki67+ cells compared to the sham-sham, mTBI-sham, and mTBI-mTBI groups (p < 0.0001), whereas the density of Ki67+ cells in the mTBI-mTBI group was not different from that of the sham-sham group. A similar group effect was observed in the density of BrdU+ cells (Fig. 6F and G, F3,16 = 18.44; p < 0.0001; n = 4–7/group): A Bonferroni post hoc test determined that the density of BrdU+ cells was greater in sham-mTBI group compared to the sham-sham, mTBI-sham, and mTBI-mTBI group (p < 0.0001). The density of BrdU+ cells in the mTBI-mTBI group was not different from that of the sham-sham group. Neither the density of Ki67+ cells nor BrdU+ cells in the mTBI-sham group differed from that of the sham-sham group, indicating that baseline levels of proliferation were not impaired even at this longer time point (∼2 months post-mTBI).
A similar group pattern in the intensity of GFAP expression within the different regions of the dentate gyrus was again observed, but was more pronounced with the 2-month injury interval (Fig. 6H and I). There was a group effect on the GFAP pixel intensity within the GCL, where the RGCs reside (p = 0.0033; Kruskal–Wallis; n = 5–7/group): A Mann–Whitney U test determined that compared to the sham-sham group, higher levels of GFAP intensity were observed in the sham-mTBI group (p = 0.0159), mTBI-sham group (p = 0.0286), and the mTBI-mTBI group (p = 0.0242). However, the sham-mTBI group still had higher GFAP intensity compared to the mTBI-mTBI group (p = 0.0101). A group effect on GFAP intensity was also observed in the ML (p = 0.0317, n = 5–7/group): Compared to the sham-sham group, the sham-mTBI group had a higher intensity (p = 0.0159). The sham-mTBI again had a higher intensity than the mTBI-mTBI group (p = 0.0303). Lastly, there was also a group effect on GFAP intensity within the hilus (p = 0.0061, n = 5–7/group): Compared to the sham-sham group, the sham-mTBI, mTBI-sham and mTBI-mTBI groups had higher GFAP itensities (p = 0.0159, 0.0286, and 0.0060, respectively).
The lack of a proliferative response of RGCs to a repeated mTBI persisted at the two-month injury interval (Fig. 7A and B; p = 0.0467, Kruskal–Wallis; n = 4–7/group): Results of a Mann–Whitney U test determined that the mice with sham-mTBI had a greater percent of GFAP+/Sox+/Ki67+ cells compared to the sham-sham group (p = 0.0143) and the mTBI-mTBI group (p = 0.0118). The lack of increases in the percent of GFAP+/Sox+/Ki67+ cells in the mTBI-mTBI group (compared to the sham-sham group) occurred despite a lack of deficits in the RGC pool as there were no group differences in the density of GFAP+/Sox+ cells (Fig. 7C).

Lack of proliferative response of RGCs in mice with a repeated mTBI persist despite a longer injury interval.
The dendritic morphology of immature neurons born after a second mTBI is not aberrant
Previous reports demonstrate that the dendritic arborization of immature neurons born after CCI and other types of brain insults is largely aberrant, mainly characterized by early branching of the primary dendrite near the soma, as well as splitting of the primary dendrites, which then project horizontally across the GCL instead of vertically toward the ML. Here, we used POMC-EGFP mice to confirm whether a repeated mTBI also produces this phenotype in immature neurons (Timeline Fig. 8A). Consistent with our characterization of mature neurons born after a single mTBI (Figs. 1G and H), we found that the immature neurons born after a second mTBI appear indistinguishable from those born in the sham-sham group (Fig. 8B). Examples of dendritic traces (Fig. 8b and C) illustrate that immature neurons born after a second mTBI have single primary dendrites that perpendicularly transverse the GCL, which is similar to the immature neurons born in the sham-sham group. Sholl analysis further demonstrates that the dendritic branching of immature neurons from the sham-sham and mTBI-mTBI groups were not different from each other (Fig. 8D, F3.5, 199 = 1.480; p = 0.216, branch by group interaction, repeated measures ANOVA, Greenhouse-Geisser, n = 21–30 cells/group), nor was there a difference in their total dendritic length (Fig. 8E; p = 0.831, Kruskal–Wallis; n = 21–30 cells/group).

Dendrites of neurons born after a second mTBI appear typical.
Impairments in strategy flexibility in mice with second mTBI
Mice were tested in the water maze one month after the second sham or mTBI to allow the new neurons to mature and integrate within the hippocampal circuitry (Timeline Fig. 9A). Deficits in neurogenesis do not consistently result in impairments in the reference memory paradigm of the water maze test, whereas multiple studies have shown that the reversal water maze task, which involves distinguishing overlapping cues (pattern separation), is sensitive to changes in neurogenesis. 44,48 –50 Given the notion that the neurogenic response facilitates cognitive recovery, the performance of mice on the standard reference versus the reversal water maze test was assessed to determine if a loss in the integration of a robust population of new neurons that are normally generated after injury was associated with worse recovery.

Intact reference memory but impaired strategy flexibility in mice with a second mTBI.
There were no group differences in spatial memory acquisition when mice were trained in the water maze test one month after the second procedure (Fig. 9B, F 6,84 = 0.608; p = 0.723, session by group interaction, repeated measures ANOVA; n = 9–14/group). All mice learned the location of the platform and there were no group differences in swim speed. All groups showed a bias toward the quadrant where the platform was previously located when the probe trial was conducted 24 h after the 3rd session (Fig. 9C; one-way ANOVA for effect of quadrant within each group: sham-sham, F3,52 = 11.17, p < 0.0001; sham-mTBI, F3,40 = 21.00, p < 0.001; mTBI-sham, F3,32 =38.19, p < 0.0001; and mTBI-mTBI, F3,44 = 15.37, p < 0.0001); however, a few mice within each group did not show a preference for the target quadrant (sham-sham, 3; sham-mTBI, 1; mTBI-mTBI, 3). The criteria used to determine preference was ≥25% of the trial time spent in the target quadrant. As different weights for the memory of the first platform could influence acquisition to a new platform in the reversal task, the mice that did not show a bias for the new platform during the first probe trial were omitted from the reversal water maze analysis. Figure 9D shows that this exclusion criteria did not result in group differences in the target quadrant preference for probe 1.
There were no differences in group performances when the mice where trained to locate the new platform location (Fig. 9E, F 4,30 = 0.367, p = 0.830, repeated measures ANOVA; n = 6–8/group), suggesting all groups of mice were able to acquire the new location. In contrast, analysis of the percent time in the correct quadrant during the reversal probe test showed that all groups except for the mTBI-mTBI group spent more time in the correct new quadrant versus the old quadrant (Fig. 9F, sham-sham, t20 = 6.466, p < 0.0001, n = 11; sham-mTBI, t18 = 3.418, p = 0.0031, n = 10; mTBI-sham, t16 = 3.587, p < 0.0025, n = 9; and mTBI-mTBI, t16 = 1.436, p = 0.1701, n = 9, unpaired Student’s t-test), suggesting the mTBI-mTBI mice were unable to correctly retain the new spatial information 24 h after acquisition. We also compared the bias to the old platform versus the new platform location using the swim proximity to where the platforms where previously located (Fig. 9G and H). An unpaired Student’s t-test determined that the sham-sham group swam closer to the new platform location versus the old platform location (t20 = 7.053, p < 0.0001, n = 11), as did the sham-mTBI (t18 = 3.204, p = 0.0049, n = 10) and mTBI-sham groups (t16 = 4.880, p = 0.0002, n = 9). In contrast, the swim proximity to the new versus the old platform location was not different in the mTBI-mTBI group (t16 = 1.911, p = 0.0742, n = 9).
Discussion
Several lines of evidence suggest that increases in neurogenesis in response to TBI may represent a critical endogenous repair mechanism. Given that moderate-to-severe TBI models cause long-term reductions in constitutive neurogenesis, we asked whether the hippocampus remains capable of eliciting increases in neurogenesis in response to a second TBI shortly and long after an initial TBI. Because concussive-like injuries are the most common type of TBI sustained by humans, we investigated this question using a mild closed head injury model. While an initial mTBI increased neurogenesis, we found that the neurogenic response was absent in mice with a prior mTBI. Notably, the mTBI-sham group, which had a mTBI at the same time point as the first injury in the mTBI-mTBI group, did not have deficits in constitutive neurogenesis. This suggests that deficits in the neurogenic response precede the slow decline in constitutive neurogenesis. The finding that the neurogenic response after a second mTBI was absent is a novel finding, as is the finding that this deficit occurs despite normal levels of constitutive neurogenesis. Here, we assessed levels of constitutive neurogenesis approximately 5 weeks after a single mTBI. Although more moderate-to-severe models of TBI show deficits in constitutive neurogenesis months after TBI, it is not known whether similar long-term deficits also occur with milder forms of TBI.
Closed head injury induces a mTBI or concussive-like injury
While the 2.2-mm impact depth used in this study is greater than other studies using a similar electromagnetic impactor, 51,52 this depth did not result in mortality, skull fractures, or gross cell death (Fig. 1 and Supplementary Fig. S3). Furthermore, the neurological injury of mice resolved within days (Supplementary Fig. S4) unlike more moderate-to-severe TBI models in which neuroscores remain elevated several weeks to months after injury. 53 Although apnea was observed in some of the mice immediately after injury, apnea is common in closed head injury models that result in concussive-like injuries. 52 Thus, given the lack of gross cell death, the lack of injury-induced mortality, the quickly resolving neurological injury, and lack of gross hippocampal-dependent memory impairments, this model most likely resembles a mild versus moderate-to-severe TBI. Finally, although the contralateral hemisphere did not result in remarkable cell death assessed by Fluoro-Jade C, the fact that there was a proliferative response in the contralateral dentate gyrus in the sham-mTBI group (described in Results section) suggests that this model results in diffuse injury.
Mechanisms contributing to the absence of the neurogenic response
We considered the possibility that a delayed response in the mTBI-mTBI group might explain why a neurogenic response was not observed. For instance, it is possible that the peak in proliferation could occur at a later time point than in mice with a single injury. However, because GFP and DCX are expressed within days after intermediate progenitor cells (IPCs) become neurons, our end-point would have captured new neurons generated up to 2 weeks after the second injury. Thus, it is unlikely that a delayed response explains the lack of increases in neurogenesis after the second mTBI.
In this study, deficits in the neurogenic response occurred in conjunction with reductions in the proliferative response, the first stage of neurogenesis. We found that the proliferative response was likewise blunted in mice with a prior mTBI and corroborated this with three different markers of proliferation, Ki67, EdU, and BrdU. We first observed this impairment in mice with a three-week injury interval. At this interval, proliferating cells may have still been undergoing higher rates of proliferation or may have not been in an “active” state to induce proliferation. 54 Therefore, we asked if a 2-month injury interval would result in similar deficits. Using two markers of proliferation, Ki67 and BrdU, we found a similar lack in the proliferative response to a second mTBI when the injury interval was considerably increased. Thus, deficits in the proliferative response were unlikely related to the recovery time window required for proliferation to return to baseline levels. Moreover, proliferation was not elevated 3 weeks, nor 2 months after injury in the mTBI-sham group, demonstrating proliferation had returned to baseline levels.
Although the extent to which a history of a mTBI impairs the neurogenic response to a repeated mTBI is novel, work by Santhakumar’s group shows that a fluid percussion injury (FPI) impairs the neurogenic response to subconvulsive doses of kainic acid. 35 Specifically, they demonstrated that the density and proliferative rates of the IPCs at baseline (i.e., no subsequent challenge) are suppressed three months after FPI. Because RGCs are required for the neurogenic response to TBI, 47 we instead focused our examination on changes in the proliferative behavior of RGCs in response to a subsequent challenge (a second mTBI). Notably, impairments in the proliferative response of RGCs were observed despite a lack of deficit in their population, suggesting that changes in the proliferative behavior of RGCs caused by a previous mTBI develop prior to pool depletion. It may seem surprising that there were no deficits in baseline levels of proliferation in the mTBI-mTBI group. We speculate that the quiescent nature of RGCs could explain why we did not observe changes in constitutive proliferation in the mTBI-mTBI group. The slow division of RGCs across the different groups could also explain why deficits in the RGC pool were not observed in the mTBI-mTBI group. We did not examine whether IPCs undergo similar changes or whether an initial mTBI also alters cell fate or survival. Any of these changes could also alter the neurogenic response to a subsequent mTBI.
Both RGCs and astrocytes visually appeared hypertrophic after mTBI, which is in line with prior reports of reactive astrocytosis after TBI. 8,55,56 In general, we observed that both a single and a repeated mTBI increased GFAP immunointensity. Unexpectedly, however, mice with a second mTBI had lower GFAP intensity levels than mice with a sham-mTBI even though they received a mTBI at the same time point. This was most evident in the two-month injury interval experiment and may have been due to increased astrocytosis in the mice with a mTBI during their first procedure (mTBI-sham group). Additionally, the increased GFAP intensity within the GCL of the sham-mTBI group in the two-month but not three-week interval experiment could be related to the age of the mice at the time of the first injury.
The dampened intensity of the reactive astrocytic marker after the second mTBI is reminiscent of delayed preconditioning. For instance, cellular stress prior to a TBI can reduce pathology and neurological outcome. 57 The surprising observation that mice with a repeated mTBI had no evidence of gross neurological impairment (Fig. 6B) or deficits in the rotorod test (Fig. 6C), could potentially be explained by a form of delayed preconditioning, which may have been more developed with the two-month versus the three-week injury interval. Notably, others have shown that TBI increases bone density, 58,59 which could potentially explain the blunted response to a second injury. Thus, we speculate that a prior mTBI may act as a preconditioned stimulus to alter the subsequent induction of neurogenesis or may provide an adaptive response such as increased bone density. As such, we cannot exclude the possibility that a loss in the neurogenic response after a mTBI may in part be due to a preconditioning effect or an adaptive response rather than a specific dysfunction in the proliferative capacity of the RGCs. It bears noting that preconditioning is typically demonstrated on the scale of hours to days. To the best of our knowledge, the effects of preconditioning on TBI responses have not been demonstrated beyond 1 week. 60 Further, the majority of repeated TBI studies consist of short intervals (hours to days), which may not allow for delayed preconditioning to develop. This may explain why this phenomenon has not been observed. We also considered the possibility that pre-exposure to isoflurane may have provided protection against injury in the mTBI-mTBI group; 61 however, this possibility is undermined by the observation that the sham-mTBI group, which were also pre-exposed to isoflurane, had elevated GFAP intensity.
Without a clear determination on whether the proliferation capacity of the RGCs is indeed impaired versus adopted a higher threshold for activation, we cautiously speculate on potential changes in the various factors involved in mediating stem cell quiescence, such as Wnt signaling. 62 Furthermore, we recognize that the lack of proliferative response resembles aging, as stem cells become more quiescent with age. 63 However, it is unknown whether the proliferative or neurogenic response to TBI is impaired during aging. In sum, prior to investigating mechanisms underlying deficits in the neurogenic response after mTBI, future studies should first confirm whether the proliferative response of the RGCs is in fact impaired or whether their reluctance to proliferate may instead be due to a form of preconditioning or adaptation.
Functional significance of the neurogenic response to mTBI
Our Sholl analysis suggests that in contrast to more severe TBI models, mTBI does not alter the dendritic morphology of post-mTBI born neurons. This is an important finding because the abnormal development of new neurons could contribute to maladaptive integration associated with seizure activity 35 or cognitive dysfunction, 39 whereas nonaberrant neurogenesis may play a beneficial role in cognition as has been suggested by studies in which elevated levels of neurogenesis are associated with improved memory. 10 The finding shown here that loss of the neurogenic response after a second mTBI was associated with deficits in the reversal water maze task indicates that post-mTBI neurogenesis is beneficial for recovery. Noteworthy, mice with a second mTBI did not exhibit deficits in reference memory (probe 1), which is similar to other studies suggesting neurogenesis is not required for reference memory, but is essential for integrating overlapping information such as in reversal water maze. 49,50
We emphasize that a potential beneficial role of post-mTBI neurogenesis may be specific to the type of neurogenesis that is induced. For example, the more moderate-to-severe CCI causes aberrant morphology in the dendrites of post-injury born neurons. 41,42 While these aberrant neurons have physiological properties that are indistinguishable from neurons born in non-injured mice, 42 inhibiting their generation after CCI improves memory outcome. 37 It bears noting that here we chose to assess functional outcome with a behavioral assay because prior electrophysiological examination of post-CCI born neurons, as well as spine densities, revealed no functional differences from neurons born in non-injured mice. 42 Therefore, we reasoned that a more circuitry-based assessment, such as a neurogenesis-sensitive behavioral assay, may be required to observe potential functional differences after their integration.
The finding that the loss of the neurogenic response after a second mTBI is associated impairments in strategy flexibility is a novel finding that supports the beneficial role of the neurogenic responses. To reiterate, we submit that this beneficial role may be due to the typical (versus aberrant) neurogenesis that is elicited by the type of TBI model and/or degree of injury. This suggestion appears to contradict the conclusions of another study that demonstrates that inhibiting neurogenesis after repeated mTBI improves cognitive recovery. 64 However, the focus of that study did not pertain to a loss in the neurogenic response and consisted of repeated mTBI’s with injury intervals spaced too closely together to ascertain a loss in a subsequent neurogenic response.
Implications for loss of the neurogenic response
Although in this study we specifically asked about implications involving recovery from repeated mTBI, it is conceivable that mTBI-induced changes in the neurogenic response could also blunt other stimuli that normally increase neurogenesis, such as exercise. 65,66 Similarly, the efficacy of serotonin-acting antidepressants that are modulated by neurogenesis 21 could be affected by impairments in the neurogenic response. Third, alterations in the neurogenic response by TBI could also compromise resilience to age-related neurodegenerative diseases. For example, evidence from human subjects suggests that neurogenesis provides cognitive resilience to Alzheimer’s disease related pathology. 67 Thus, the health implications for how TBI affects the neurogenic response to other physiologically relevant responses may extend beyond repeated TBI.
Limitations
An important limitation of our study is that it was underpowered to determine sex differences. For example, prior studies suggest that there are sex differences in the activation of immature neurons. 68 Future studies are warranted to determine the degree to which sex influences how this impairment affects neurogenesis-dependent learning and memory as well as the trajectory of cognitive aging. Another important limitation of our study is that we did not address the causal relationship between impairments in the neurogenic response following repeated mTBI and cognitive recovery. Future research involving direct manipulation of neurogenesis will be essential to determine if an impaired neurogenic response contributes to adverse cognitive outcomes after repeated mTBI. Future studies are also warranted to determine whether loss of the neurogenic response by mTBI affects other factors that either increase or are dependent on the neurogenic response, such as exercise and the efficacy of antidepressants. It is notable that deficits in the neurogenic response were observed following a mTBI that models a concussive-like injury. This alarming observation underscores the importance of accurately translating experimental mTBI models to the varying degree of injury TBI causes in humans.
Conclusions
Our findings demonstrate that a history of mTBI resulting in a concussive-like injury impairs the neurogenic response to a subsequent mTBI and that these impairments are associated with a lack in the proliferative response of the RGCs. Importantly, we show these deficits are not due to exhaustion of the RGC pool. Our findings show that the loss of the neurogenic response is not transient, but rather more pronounced over time, which is contrary to current opinion on time windows for injury resolution. This study also demonstrates that unlike more severe TBIs, the neurons generated after mTBI or repeated mTBI are not aberrant in their morphology and that the failure to increase levels of neurogenesis after a second mTBI is associated with worse neurogenesis-sensitive memory. These findings introduce a previously unrecognized aspect of repeated TBI pathology and provide a novel target to help improve the trajectory of recovery and cognitive aging after mTBI.
Transparency, Rigor, and Reproducibility Statement
The study design and analytic plan were not preregistered. A total of 196 mice were used for this report. For each experiment, litter mate male and female mice were assigned to different groups so that each of the four groups contained litter mate controls. No animals died as a result of mTBI, and no animals were excluded. A few tissue samples were lost during the COVID-related shut down due to mold growth in the tissue, resulting in a lower sample size in the GFAP analysis (Fig. 3H) compared to the proliferation analysis (Fig. 3D and F). These included four less samples in the sham-mTBI group and three less samples in each of the sham-sham, mTBI-sham, and mTBI-mTBI groups. In the experiment that assessed the temporal resolution of neurological injury, videos for the 30 min and 48 h time points were lost (corrupted files) for one mouse in the sham group and two mice in the mTBI group. The experiments involving proliferation analysis (Fig. 3) were conducted at Oregon Health & Science University (OHSU) and Legacy Research Institute (LRI). All data were acquired by experimenters that were blind to the group assignment of the mice.
Footnotes
Acknowledgment
The authors thank Dr. Stefanie Kaech Petrie of the OHSU Advanced Light Microscopy Core for technical assistance with imaging and our lab volunteer Sam Raphael for assisting with the pilot studies for this report.
Authors’ Contributions
L.V. designed research. T.M.B., S.N.Y., N.S., and S.F. performed research. L.V. and B.B. wrote the article.
Author Disclosure Statement
The authors declare no competing financial interests.
Funding Information
This material was supported by start-up funds for Dr. Villasana from the Anesthesiology and Perioperative Medicine Department at Oregon Health & Science University and by the Dow Department at Legacy Research Institute.
Supplementary Material
Supplementary Figure S1
Supplementary Figure S2
Supplementary Figure S3
Supplementary Figure S4
Supplementary Data
References
Supplementary Material
Please find the following supplemental material available below.
For Open Access articles published under a Creative Commons License, all supplemental material carries the same license as the article it is associated with.
For non-Open Access articles published, all supplemental material carries a non-exclusive license, and permission requests for re-use of supplemental material or any part of supplemental material shall be sent directly to the copyright owner as specified in the copyright notice associated with the article.