




Abstract
This study compared the roles of extraparenchymal autonomic nervous system (ANS) control of cerebral blood flow (CBF) versus intraparenchymal cerebrovascular autoregulation in 487 patients with aneurysmal subarachnoid hemorrhage (SAH) and 413 patients with traumatic brain injury (TBI). Vasomotion intensity of extraparenchymal and intraparenchymal vessels were quantified as the amplitude of oscillations of arterial blood pressure (ABP) and intracranial pressure (ICP) in the very low frequency range of 0.02–0.07 Hz, or periods of 55–15 sec, computed with a bandpass filter. A version of the pressure reactivity index (PRx-55-15) was computed as the correlation of the filtered waveforms, ABP-55-15 and ICP-55-15. Since ABP-55-15 is measured in the radial artery, any influence of cerebral factors must be mediated by the ANS. ICP-55-15 is measured in the brain and is influenced by intraparenchymal chemical and metabolic factors in addition to the ANS. Patient outcome was assessed using the Extended Glasgow Outcome Score (GOSe). Ten-day mean cerebral perfusion pressure (CPP) was negatively correlated with GOSe in the TBI cohort (R = −0.13, p = 0.01) but positively correlated with GOSe in the SAH cohort, (R = 0.32, p < 0.00001), indicating a much greater dependence on ANS support in the form of elevated CPP in SAH. The optimal CPP range for TBI was 60–70 mmHg, but for SAH it was 110–120 mmHg. The percentage of monitoring time with PRx-55-15 < 0.8, indicating very pressure-active cerebral vessels that resist ANS influence via systemic ABP, is positively correlated with GOSe in the TBI cohort (R = 0.14, p = 0.003), but negatively correlated with GOSe in the SAH cohort (R = −0.10, p = 0.004). The TBI cohort optimal PRx-55-15 for patient outcome was −1.0, while the SAH optimum was 0.3. For the TBI cohort, the correlation of ABP-55-15 amplitude with 10-day mean ICP-55-15 amplitude was 0.29. For the SAH cohort the correlation was 0.51, which is stronger (p = 0.0001). The TBI cohort had a median GOSe of 5 (interquartile range [IQR] 3–7), while SAH had a median of 3 (IQR 3–5), which is worse (p < 0.00001). The higher optimal CPP in patients with SAH, more passive optimal pressure reactivity, and greater dependence of cerebral on systemic vasomotion indicate that they require more active support by the ANS and systemic circulation for CBF than patients with TBI. CBF in patients with TBI is more reliant on cerebrovascular autoregulation based on metabolic demand. This appears to be deficient following SAH, making the heightened ANS support necessary. Although this support is beneficial, it does not fully compensate for the loss of cerebrovascular autoregulation, as reflected in the problems in the SAH cohort with delayed cerebral ischemia and poor outcome.
Introduction
Intact cerebral autoregulation and adequate cerebral blood flow (CBF) are major concerns in the treatment of both traumatic brain injury (TBI) and aneurysmal patients with subarachnoid hemorrhage (SAH), but there are major differences between these patient groups. Patients with SAH in intensive care require higher levels of cerebral perfusion pressure (CPP), are more vulnerable to secondary ischemic injury, and have significantly worse outcomes than patients TBI. 1 Heightened autonomic nervous system (ANS) activity has also been noted following SAH and the effects of this on cerebral autoregulation and blood flow in these patients is an object of concern. 2 –4
In a previous study, we looked at the role of cerebrovascular pressure autoregulation as measured with the pressure reactivity index (PRx) 5 following SAH and TBI and found surprising differences between these patient populations. 6 In the current study, we consider vasomotor reactivity more broadly, including rhythmic vasomotion in the extraparenchymal arteries feeding CBF, and in the intraparenchymal arterioles involved in metabolic autoregulation balancing blood flow within the brain. We also consider the role of cerebrovascular pressure reactivity as the interface between these two systems.
The intensity of vasomotion was quantified as the amplitude of short-term (15–55 sec) oscillations of intracranial pressure (ICP) for intraparenchymal vasomotion, and of systemic arterial blood pressure (ABP) for the extraparenchymal arteries. The latter are of interest because they can be influenced by intracerebral factors via the ANS, 7,8 and can in turn influence CBF; for example, through increased pulsatility in reaction to systemic hypotension. 9 Quantifying the vasomotion of both extraparenchymal arteries and intraparenchymal arterioles has allowed us to separate to an extent the influences of the ANS and intracerebral autoregulation on CBF, to confirm the heightened activity of the ANS in patients with SAH compared with patients with TBI, and to evaluate the effects of ANS activity in our SAH and TBI cohorts.
Methods
Patient material
This study includes patients with TBI and spontaneous aneurysmal SAH admitted to the Uppsala University Hospital neurointensive care unit (NICU) between January 2008 and January 2018. Inclusion required at least 24 h of ICP monitoring during the first 10 days following injury or ictus.
Patient outcome was assessed using the extended Glasgow outcome scale (GOSe) at 6 (TBI) or 12 (SAH) months after discharge from the ICU.
Physiological data collection
For both cohorts, ICP was monitored via an intraparenchymal probe or external ventricular drain. ABP was monitored in the radial artery at heart level. Data were collected and analyzed using the Odin software developed at Edinburgh and Uppsala Universities by the first and second authors. Odin connects to the patient monitors using the hospital intranet. ICP and ABP waveforms were collected via the Dräger Infinity® Gateway software at a sample rate of 100 Hz. Trended mean arterial pressure (MAP), systolic arterial pressure (SAP), mean ICP (ICPm), and cerebral perfusion pressure (CPP) were calculated for each minute of monitoring by averaging trended values collected from the Dräger system during the minute. Longer-term average values of MAP and ICPm were calculated using the minute-by-minute values. Fast Fourier Transforms were computed using the FFTW3 libraries. 10
Patient treatment guidelines
Treatment guidelines for patients with TBI were ICPm <20 mmHg, CPP >60 mmHg, SAP ≥100 mmHg, central venous pressure 0–5 mmHg, PaO2 ≥ 2 kPa, and body temperature <38°C. 11
For patients with SAH, the treatment of ruptured aneurysms was either by endovascular coiling or surgical clipping. Over the 10-year period of this study, treatment shifted increasingly toward endovascular. 12 ICU treatment guidelines were ICPm <20 mmHg, body temperature <38°C, and arterial oxygen saturation >95%. Before the aneurysm was secured, central venous pressure (CVP) was maintained at 0–5 mmHg and afterward at 5–10 mmHg. 13 Nimodipine was administered intravenously for all patients with SAH during the first 3 weeks following the initial bleeding. 14,15
Calculating the pressure reactivity index
The PRx 5 is based on the correlation of ABP and ICP. In this study, we used a version of PRx called PRx-55-15, which was computed using a bandpass filter with a range of 0.018–0.067 Hz (oscillations with periods from 55 to 15 sec) on the ABP and ICP waveforms before calculating their correlation. 16 We will refer to the filtered waveforms as ABP-55-15 and ICP-55-15.
Quantifying the intensity of intraparenchymal and extraparenchymal vasomotion
The bandpass filter described above was applied to the ABP and ICP waveforms. In this study, we used the amplitude of ABP-55-15 as a measure of the intensity of extraparenchymal arterial vasomotion, and the amplitude of ICP-55-15 as a measure of the intensity of vasomotion of cerebral intraparenchymal arterioles.
Binned weighted-mean graphs
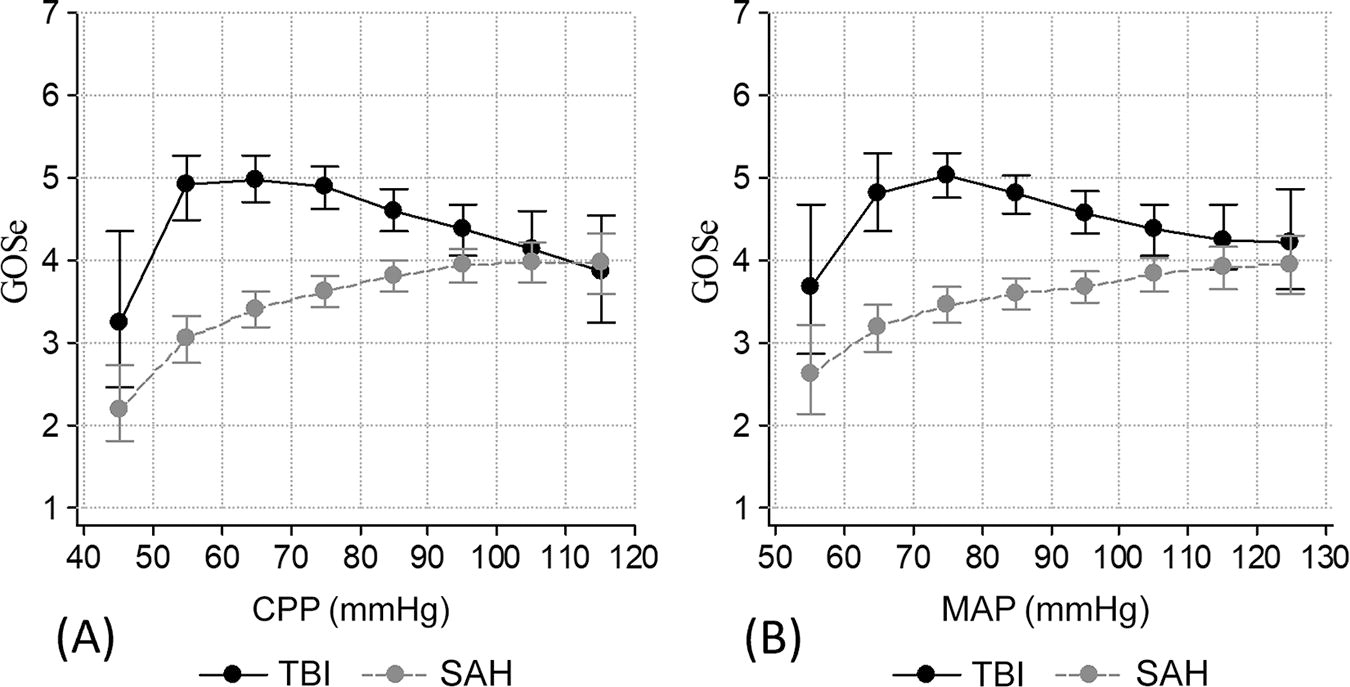
To display the relationship between a physiological variable and patient outcome, we first binned the physiological variable to be displayed on the x-axis. For example, in Figure 1A, CPP is displayed as eight bins each of width 10 mmHg, ranging from 40 to 120 mmHg. For each patient, the proportion of monitoring time that the physiological variable was within the range of each bin was recorded. Then for each bin, the total of all the proportions was calculated and a weight for each patient assigned as their bin proportion divided by the total, so that the weights sum to one. Then. the GOSe value for each bin was calculated as the weighted sum of the GOSe scores for each patient.
To display the relationship between a physiological variable and a second physiological variable, the same procedure was followed to compute the y value for a bin, except that instead of using a patient’s GOSe score, the mean value for the second physiological variable while the first variable was in the range of that bin was computed. Then the y value for that bin was computed as the weighted sum of those mean values.
Error bars were computed as the 95% confidence range for each y value estimate based on 1000 bootstrap resamplings of the patients.
Statistics
Distributions are reported as median and interquartile range. Correlations are reported together with the 95% confidence interval and p value. p values less than 0.05 were considered statistically significant and values >0.05 and <0.10 marginally significant. All correlations were calculated using Spearman’s method. Multivariate linear regression was computed using Statistica®.
Results
Patient cohorts
This study included 413 patients with TBI and 487 patients with spontaneous aneurysmal SAH. The TBI cohort included 324 males and 89 females with a median age of 52 (32–65). The SAH cohort included 160 males and 327 females with a median age of 59 (51–67), which is significantly older (p < 0.00001).
In the SAH cohort, 331 patients received endovascular treatment for their aneurysm, 131 were treated surgically, 4 received both treatments, and 21 neither.
For all patients, mean values for the first 10 days following injury or ictus were computed for ICP, MAP, CPP, PRx-55-15, ABP-55-15 amplitude, and ICP-55-15 amplitude. For both the SAH and TBI cohorts, the distributions of Glasgow Motor Score, GOSe, and the 10-day mean values are shown and compared between the two cohorts in Table 1.
Comparisons of the Distributions of Glasgow Coma Score Motor Score on Admission, Extended Glasgow Outcome Score at 6 Months for Subarachnoid Hemorrhage or 1 Year for Patients with Traumatic Brain Injury, and Monitored Parameters Averaged over the First 10 Days Following Injury or Ictus: Cerebral Perfusion Pressure, Mean Arterial Pressure, Mean Intracranial Pressure, and Proportion of Monitoring Time with ICPm >30 mmHg
CPP, cerebral perfusion pressure; GCS, Glasgow Coma Score; GOSe, Extended Glasgow Outcome Score; ICPm, mean intracranial pressure; IQR, interquartile range; MAP, mean arterial pressure; PRx, pressure reactivity index; SAH, subarachnoid hemorrhage; TBI, traumatic brain injury.
The group medians and interquartile ranges are given for both cohorts together with the p values for the differences between the two cohorts.
By marginal significance (0.05 < p value ≤ 0.10).
By statistical significance (p value ≤ 0.05).
Univariate correlations are given in Table 2. MAP and CPP are positively correlated with age and negatively correlated with GOSe in the TBI cohort. In the SAH cohort, the reverse is true; MAP and CPP are negatively correlated with age and positively correlated with GOSe. ABP-55-15 amplitude and ICP-55-15 amplitude are significantly correlated in both cohorts, but the correlation is significantly stronger in the SAH cohort. The percentage of monitoring time with PRx-55-15 < 0.8 is positively correlated with GOSe in the TBI cohort, but negatively correlated with GOSe SAH cohort.
Univariate Correlations
ABP, arterial blood pressure.
MAP, CPP ABP-55-15 and ICP-55-15 values are 10-day means in mmHg. PRx-55-15 values are the proportion of monitoring time with PRx-55-15 < −0.8. Comparisons are between the SAH and TBI cohorts. *Indicates marginal significance (0.10 > p > 0.05), and **indicates statistical significance (p < 0.05).
Multivariate regression predicting GOSe
In the both the SAH cohort (Table 3) and the TBI cohort (Table 4), multivariate linear regressions predicting GOSe were performed with the following predictors: age, Glasgow Coma Score (GCS) Motor Score, Fisher Score (in SAH) or Marshall Score (in TBI), and 10-day means of MAP, ICP, ICP-55-15 amplitude, and ABP-55-15 amplitude. All of the predictors were statistically significant independent predictors of GOSe except for the 10-day means of MAP and ABP-55-15, Fisher Score, and Marshall Score. When the regressions were repeated with ICP-55-15 amplitude excluded from the predictors, ABP-55-15 amplitude was significant both in the SAH (p = 0.00003, Supplementary Table S1) and TBI (p = 0.046, Supplementary Table S2) cohorts.
Multivariate Test of ABP-55-15 Amplitude and ICP-55-15 Amplitude Predicting Extended Glasgow Outcome Score in the Subarachnoid Hemorrhage Cohort
The standardized slope and standard error of the regression line associating the variable with GOSe are given together with the p value for statistical independence as a predictor. *Indicates marginal significance (0.10 > p > 0.05), and **indicates statistical significance (p < 0.05).
Multivariate Test of ABP-55-15 Amplitude and ICP-55-15 Amplitude Predicting the Extended Glasgow Outcome Score in the Traumatic Brain Injury Cohort
The standardized slope and standard error of the regression line associating the variable with GOSe are given together with the p value for statistical independence as a predictor. *Indicates marginal significance (0.10 > p > 0.05), and **indicates statistical significance (p < 0.05).
Last-tier thiopental treatment
In both the TBI and SAH cohorts, the last-tier treatment options for refractory ICP were thiopental treatment and decompressive craniectomy (DC). As shown in Table 5, we have compared ICP-55-15 and ABP-55-15 amplitude and patient outcome in both the SAH and TBI cohorts in three subgroups: those patients who had no last-tier treatment, those who had thiopental treatment only, and those who had DC only.
Comparisons of Patients with no Last-Tier Treatment, Decompressive Craniectomy Only, and Thiopental Treatment Only in the Subarachnoid Hemorrhage and Traumatic Brain Injury Cohorts
Features compared are patient outcome as measured with the GOSe and proportion of monitoring time over the first 10 days following injury or ictus with ABP-55-15 and ICP-55-15 amplitudes <1 mmHg.
Indicates marginal significance (0.10 > p > 0.05), and **indicates statistical significance (p < 0.05).
Patient outcome in the subgroup with thiopental treatment only was not significantly different from the group with no last-tier treatment in the TBI cohort (p = 0.67), while in the SAH cohort, the thiopental only group had significantly worse outcomes than the no last-tier treatment group (p < 0.00001).
Patient outcome in the thiopental only group was significantly better than the DC only group in the TBI cohort (p = 0.01), while in the SAH cohort the thiopental only group had significantly worse outcomes than the DC only group (p = 0.003).
Discussion
Systemic arterial pressure, CPP, and patient outcome
MAP and CPP are the clearest examples of the ANS contributing to CBF via its influence on the cardiovascular system. Some minimum level of CPP support is required for intracerebral vessels and autoregulation to function. Consistent with previous work, 1 Figure 1A shows an optimal CPP range of 60–70 mmHg in TBI, but 110–120 mmHg for patients with SAH. The equivalent graph for MAP (Fig. 1B) has an optimal MAP for TBI of 70–80 mmHg and 120–130 mmHg for SAH.
The TBI results are consistent with the current Brain Trauma Foundation guideline of maintaining CPP between 60 and 70 mmHg. 17 A clinical recommendation of a CPP of 120 mmHg or MAP of 130 mmHg for patients with SAH sounds high, and these results must be qualified, as they are based on retrospective analysis and, in extreme ranges, on sparse data. The median proportion of monitoring time with CPP between 110 and 120 mmHg in our SAH cohort was 0.005 (0.002–0.02). With these qualifications, our SAH results regarding CPP and MAP are generally consistent with current American Heart Association/American Stroke Association guidelines, 18 which do not address CPP directly, but the recommendations regarding ABP are relevant. These involve strict avoidance of hypotension, defined as MAP <65 mmHg, but caution in lowering ABP even when the patient is extremely hypertensive, defined as SAP over 180 mmHg. Diastolic ABP is not specified but a common definition of extreme hypertension is 180/120 mmHg, 19 which would be a MAP of 140 mmHg. This puts the range in which the guidelines recommend caution in lowering ABP well above our optimal MAP range for patients with SAH of 120–130 mmHg. The concern with lowering ABP is cerebral ischemia, especially if ICP is elevated. The guidelines refrain from formally recommending any upper limit for ABP, but state that limits on SAP of 160 or 180 mmHg “may be reasonable to consider in practice.”
The results reported here regarding MAP and CPP are consistent with official guidelines and indicate that for patients with SAH CBF benefits from vigorous ANS support in the form of elevated MAP and CPP, while patients with TBI benefit from limited ANS influence and primary reliance on intraparenchymal autoregulation of CBF.
The effects of patient age on MAP, CPP, and patient outcome
Usually MAP and CPP are positively correlated with age, since older people have stiffer arteries and more problems with systemic hypertension, and this is what we see in the TBI cohort (Table 2). In the SAH cohort, however, MAP and CPP were negatively correlated with age; it was the younger patients who had higher blood pressure. Further, in the SAH cohort elevated MAP and CPP were positively correlated with good patient outcome as measured with GOSe, while in TBI they were negatively correlated. These results are further evidence that in the SAH cohort elevated MAP and CPP were generally a beneficial response to low CBF and cerebral ischemia, while in the TBI cohort they were often pathological.
Quantifying vasomotion intensity
As described in the methodology section, ABP-55-15 and ICP-55-15 are bandpass-filtered versions of the ABP and ICP waveforms that include only short-term oscillations with periods from 55 to 15 sec (0.018–0.067 Hz). These generally have an amplitude of just a few mmHg but can range up to 10 mmHg or slightly higher. This frequency range was selected using an algorithm that optimized the correlation of the index with patient outcome in a cohort of patients with TBI. 16 In subsequent studies of patients with SAH ICP-55-15 amplitude has been found to be significantly associated with markers of good cerebral energy metabolism, 20 reduced delayed ischemic neurological deficits and good patient outcome. 21 The question of why these small oscillations of ICP that resolve in less than a minute and would not even be noticed clinically should have such significant clinical associations may be explained by an association with cerebral vasomotion and blood flow regulation.
This frequency range (0.018–0.067 Hz) corresponds closely to the very low frequency (VLF) range of blood pressure variability, often defined as 0.02–0.07 Hz (50–14 sec periods), which previous studies have found to be the frequency range of blood pressure and CBF variability relevant to cerebrovascular autoregulation. 22 –25 Laser Doppler flowmetry studies of vasomotion in the forearm have identified 0.02–0.06 Hz (50–17 sec) as the range of rhythmic variation in arterial diameter that is neurogenic in origin 26 and is associated with optimal tissue perfusion as measured by oxygen saturation and red blood cell count. 27 Vasomotion in the VLF range has been observed in the conduit arteries of the arm, including the radial artery. 28 –30 In these arteries, vasomotion appears to be coordinated by the ANS, while microvascular vasomotion, although related to macrovascular, appears to be primarily controlled by local intrinsic factors. 30,31
Spectral analysis of ABP fluctuations in the VLF range before and during cardiac autonomic blockade has led to the conclusion that this frequency range is dominated by vasomotor activity and that cardiac activity has little influence. 32 Therefore we have treated ABP-55-15 amplitude as a measure of the intensity of extraparenchymal arterial vasomotion and ICP-55-15 amplitude of the intensity of intraparenchymal vasomotion.
Our methodology was similar to that in a previous study of cardiovascular influence on low- and very-low-frequency waves of ICP, ABP, and CBF velocity by Martinez-Tejada and colleagues, 33 although they used a different approach to frequency analysis and a broader range of 0.013–0.155 Hz (periods of 77–6 sec).
ANS versus intracerebral influence on the ABP and ICP waveforms
Since ABP is measured in the radial artery in the arm, it is unlikely that intracerebral factors could have any effect on it other than through the ANS. Although the radial artery does not feed CBF, our hypothesis was that the neuronal signals influencing its vasomotor activity were similar to those, received by peripheral arteries approaching and on the surface of the brain that do supply CBF, and which, like the radial artery, are innervated by autonomic nerve fibers. The results reported here provide substantial evidence that this is the case. On the other hand, ICP, measured either in the ventricles or the parenchyma, reflects the vasomotor activity of the entire cerebrovascular tree, which is influenced by vascular pressure reactivity and local intraparenchymal metabolic autoregulation in addition to the ANS.
Cerebral pressure reactivity and patient outcome
Pressure reactivity as measured using PRx-55-15 is the interface between extraparenchymal arterial vasomotion (ABP-55-15) and intraparenchymal vasomotion (ICP-55-15). As seen in Figure 2, in both TBI and SAH a PRx-55-15 >0.8, indicating extreme pressure passivity, is associated with very poor patient outcome. As pressure-reactivity becomes more active (going right to left in Fig. 2) patient outcome at first rapidly improves in both cohorts, but then the results diverge, with patient outcome in SAH going into a gradual decline as PRx-55-15 approaches negative territory and a rapid decline below −0.6. In contrast, the TBI cohort shows a steady improvement in patient outcome across the entire range of PRx-55-15 from one (extreme passivity) to −1 (extreme reactivity). These results are similar to previous studies using standard PRx which found that both high (near one) and low (near −1) PRx were associated with poor outcome in aneurysmal patients with SAH. 6,34

The relationship between PRx-55-15 as an index of cerebrovascular pressure reactivity with patient outcome, where a PRx-55-15 of −1 represents maximally active reactivity, and 1 maximally passive reactivity. PRx, pressure reactivity index.
When PRx or PRx-55-15 are close to −1, cerebrovascular pressure reactivity resists increases of ABP with vasoconstriction and counters decreases with vasodilation: that is, it works to maintain CBF at its current level. This is beneficial when CBF is adequate, but if existing CBF is too low then PRx near −1 is a sign of disturbed pressure autoregulation and a risk of ischemia. This appears to be the case in the SAH cohort but not in TBI. Again, similar to our CPP results, this indicates that for patients with SAH limiting ANS influence on CBF via the cardiovascular system may be a bad idea.
Pressure reactivity in SAH and nimodipine treatment
The median 10-day mean PRx-55-15 for was significantly higher in the SAH cohort than the TBI cohort (Table 1), indicating more passive cerebrovascular pressure reactivity, which allows a greater influence of ABP and the ANS on CBF in the SAH cohort. This is surprising given the association of SAH with myogenic hyperreactivity, which generally limits the influence of ABP and increases pressure reactivity. 6 One possibility is that treatment with vasodilators reverses vasoconstriction and results in more passive than normal vessels in patients with SAH, 35,36 which would be consistent with our results. During the first 3 weeks after admission, we administered intravenous nimodipine, which is a vasodilator and is protective against DCI. 37,38 The benefits of nimodipine are no longer believed to be due to the reversal of large-vessel angiographic vasospasm, but the clinical relevance of this definition of vasospasm has been questioned. 39 Increasingly, pathological intraparenchymal arteriolar constriction is believed to be a significant contributor to vasospasm and DCI, 40,41 and the benefits of nimodipine may be related to dilation of these vessels. 42,43
Intraparenchymal and extraparenchymal vasomotion and ANS control
Our vasomotion intensity metrics, ICP-55-15 amplitude and ABP-55-15 amplitude, were both greater in the SAH cohort than the TBI cohort (Table 1). In both cohorts, intraparenchymal vasomotion is significantly correlated with extraparenchymal, but the correlation is significantly higher in the SAH (R = 0.51) than TBI (R = 0.29) (p = 0.0001, Table 2). This, like the CPP and cerebral pressure reactivity results discussed above, indicates that the greater intensity of vasomotion in SAH is due in large part to heightened ANS involvement.
Vasomotion intensity and patient outcome
In multivariate linear regressions controlling for age, GCS Motor Score, Fisher Score (for patients with SAH) or Marshall Score (for patients with TBI), and 10-day means for MAP, and ICPm, ICP-55-15 amplitude was found to be a significant, independent predictor of good patient outcome, while ABP-55-15 amplitude was not in both the SAH (Table 3) and TBI (Table 4) cohorts. When ICP-55-15 was excluded, ABP-55-15 amplitude became significant in both cohorts (Supplementary Tables S1 and S2), although its influence is highly significant in SAH (p = 0.00003) and much less so in TBI (p = 0.046). The reason that ABP-55-15 amplitude loses significance when ICP-55-15 amplitude is controlled for is not because it is not important, but because all of its influence on CBF is due to its influence on ICP-55-15 amplitude. These results are further indications that ANS influence on CBF is important in patients with SAH but plays a relatively minor role in TBI.
Vasomotion intensity and pressure reactivity
In Figure 3A, we see the relationship between PRx-55-15 and ICP-55-15 amplitude. There is very little change of ICP-55-15 in the TBI cohort across the full range of PRx-55-15 from −1 to 1. In the SAH cohort, however, there is a gradual increase of ICP-55-15 amplitude as pressure reactivity becomes more active and the increase accelerates sharply as it approaches −1 (maximum reactivity). We know from Figure 2 that PRx-55-15 below −0.6 is associated with poor outcome in patients with SAH. This is likely because intense pressure reactivity, which limits the support of CBF by the ANS, can lead to inadequate CBF and DCI in these patients. The strong reaction of cerebral vasomotion when PRx-55-15 is in this range appears to be an attempt to increase CBF in response to metabolic demand. This reaction is out of sync with the pressure-reactivity response, which is working to limit any change in CBF, and indicates a failure of intraparenchymal vascular autoregulation in SAH.
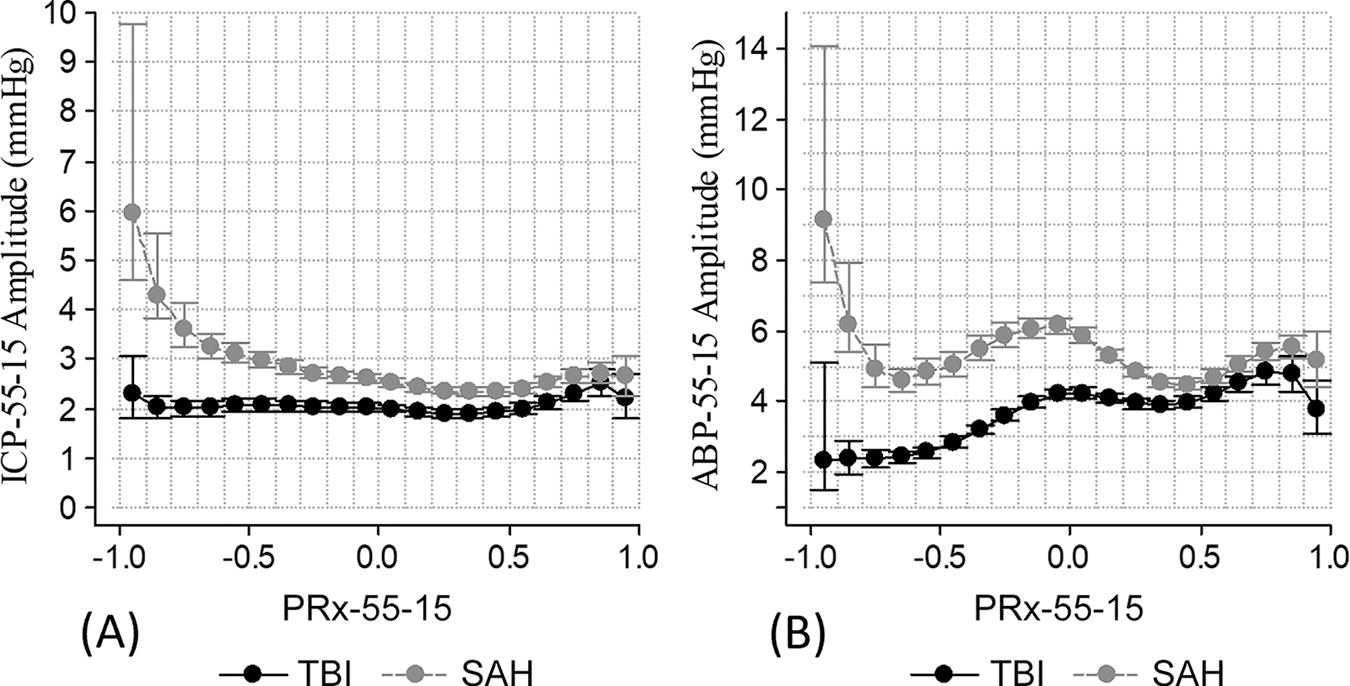
Figure 3B shows the relationship between PRx-55-15 and ABP-55-15 amplitude. There is a low-level oscillation in both cohorts that we cannot explain. Neglecting that, in TBI as PRx-55-15 decreases ABP-55-15 amplitude also decreases, which means that pressure reactivity increasingly counteracts extraparenchymal vasomotion, which at the same time is reducing its activity, so in this case the two systems are in synch. In the SAH cohort, we see the same spike in ABP-55-15 associated with PRx-55-15 below −0.6 that we saw with ICP-55-15. This appears to be an ANS-mediated response of extraparenchymal arteries to brain hypoxia due to inadequate CBF.
Vasomotion and systemic blood pressure
Figure 4A shows the relationship between MAP and ABP-55-15 amplitude in our cohorts. With MAP above about 74 mmHg these have a strong positive correlation, indicating that extraparenchymal arterial vasomotion MAP increase and decrease in unison to support peripheral blood flow. When MAP drops below about 74 mmHg, however, the correlation becomes negative with ABP-55-15 increasing in response to decreases in MAP, indicating increased arterial vasomotion to compensate for systemic hypotension. This is consistent between the SAH and TBI cohorts.
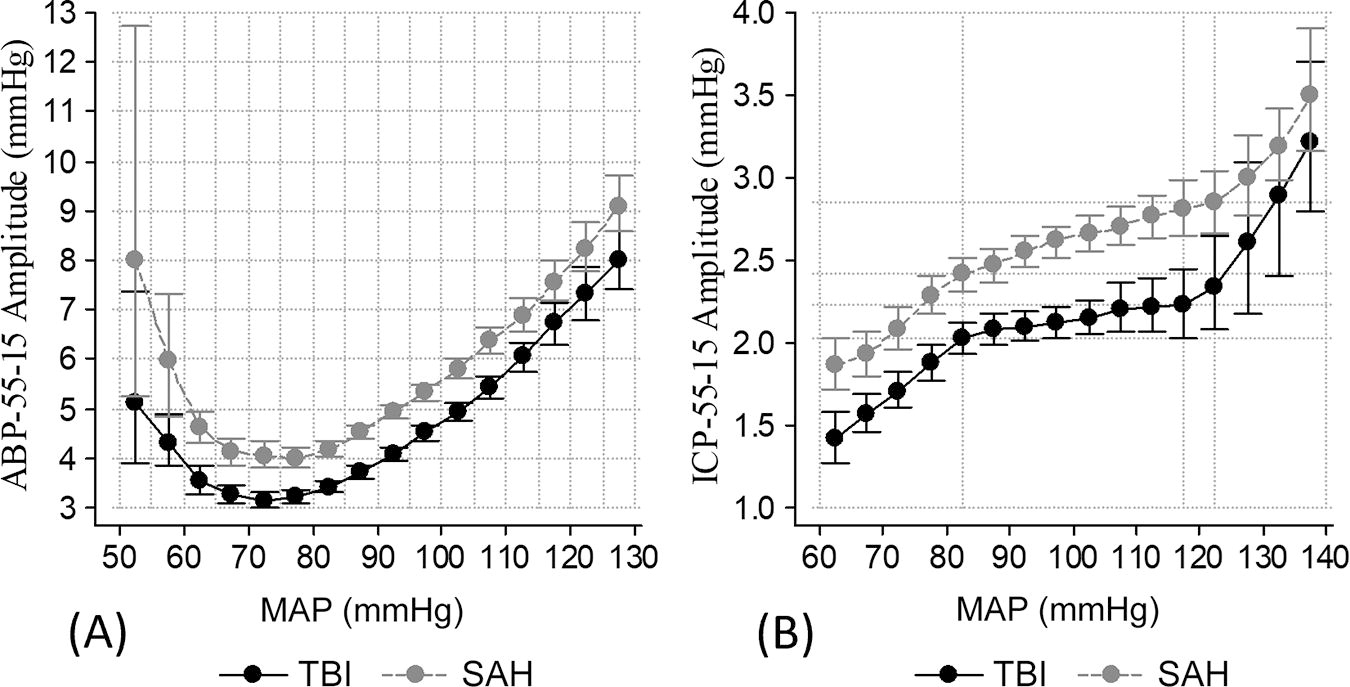
The relationship between MAP and ICP-55-15 amplitude shown in Figure 4B is very different. ICP-55-15 amplitude remains positively correlated with MAP throughout this range, but there are two inflection points. When MAP reaches 82 mmHg the upward slope decreases and continues at the reduced rate of increase until it reaches 118 mmHg (TBI) or 122 mmHg (SAH) when the upward slope abruptly resumes its original rate of increase. It appears that in the middle range cerebrovascular tone increases and limits the influence of MAP on intraparenchymal vasomotion. As a result, we see the familiar Lassen curve 44 with its autoregulatory plateau in which CBF is kept relatively constant by cerebrovascular contraction and dilation. In practice, the Lassen curve is known to vary widely between individuals and to have a narrowed range and an upward slope to the plateau phase in people with hypertension and/or microvascular disease 37,45 –47 that resembles what we see in Figure 4B for our TBI and SAH cohorts.
Our results regarding MAP and arterial and cerebral arteriolar vasomotion demonstrate both a strong dependence of vasomotion on MAP, but also areas in which vasomotion resists the influence of MAP: notably systemic hypotension in the case of extraparenchymal arterial vasomotion, and the plateau phase of intraparenchymal vasomotion. The plateau phase of the SAH cohort is steeper than that in the TBI cohort, again indicating a greater dependence on systemic ABP and ANS influence in the SAH cohort.
Systemic blood pressure, vasomotion, and elevated ICP
Figure 5 shows the relationship of elevated ICP with MAP. We see MAP first rise and then fall as ICP goes from 0 to 60 in both cohorts. This fits the general pattern of the Cushing response but is much more restrained. Median MAP only increases about 5 mmHg before dropping about 15 mmHg as ICPm increases from 0 to 60 mmHg.

The relationship of ICPm to MAP, both in mmHg. ICPm, mean intracranial pressure.
The response of ABP-55-15 amplitude to elevated ICP shown in Figure 6A looks more like a Cushing response, at least for the SAH cohort, with a large spike associated with ICP in the 30–50 mmHg range, and a sharp drop beyond 50 mmHg. In the TBI we see a smaller peak in the 30–40 mmHg range. These spikes are superimposed on an overall decline of ABP-55-15 amplitude in conjunction with increasing ICP, which is the general rule when ICP is below 20 mmHg. This decline is consistent with the ANS stepping back in the face of an increasingly delicate intracranial situation and leaving the response to intracerebral autoregulation. This changes dramatically when ICP approaches 30 mmHg. The spikes in ABP-55-15 amplitude, especially in the SAH cohort, appear to be attempts by the ANS to restore CBF in response to global cerebral hypoxia and ischemia. These results are similar to those reported by Fedriga and colleagues, who observed nonsignificant changes in MAP in response to elevated ICPm but significant increases in ANS activity. 48 These results and those discussed in the previous section regarding systemic hypotension are also consistent with studies finding that vasomotion is increased in hypoxic tissue. 49 –51

The intraparenchymal vasomotion response to elevated ICP is shown in Figure 6B. ICP-55-15 amplitude steadily increases as ICP goes from 0 to 30 mmHg. Then the SAH cohort has a big spike similar to the one in ABP-55-15 amplitude, while the TBI cohort continues its steady increase until ICPm is in the 30–40 mmHg range, after which it declines again. The overall TBI intraparenchymal and extraparenchymal responses are much weaker than the SAH responses, indicating heightened ANS activity and greater ANS control of CBF in the SAH cohort.
These results regarding elevated ICP, once again, demonstrate a greater reliance on ANS activity for CBF regulation in patients with SAH compared with TBI.
Vasomotion and CBF
We have looked for relationships of ICP-55-15 amplitude with CBF and cerebral vascular resistance as measured using xenon computed tomography (xenon-CT) but failed to find any correlation, 52 so we cannot explain the mechanisms behind the apparent positive effects of cerebral vasomotion. Nevertheless, the strong associations discussed above of vasomotion with hypoxia on the one hand and with improved cerebral energy metabolism, 20 reduced delayed cerebral ischemia (DCI), 21 and good patient outcome on the other, strongly suggest that mechanisms involving microvascular CBF regulation exist. One possibility is that rather than increasing total CBF vasomotion improves the distribution of the available blood. A plausible theory is that vasomotion is triggered in hypoxic tissue and propagates synchronously back through the vascular tree in a way that carries information regarding the paths that blood should follow to perfuse this tissue. 31 On the other hand, the fact that the curves plotting ICP-55-15 amplitude against MAP in both the SAH and TBI cohorts (Fig. 4B) look so similar to Lassen curves, which plot CBF against MAP, suggests a strong relationship between ICP-55-15 amplitude and total CBF. Of course, cerebral vasomotion as measured with ICP-55-15 amplitude could be associated with both increased total CBF and better targeting of hypoxic tissue.
The difference between our ICP-55-15 results and xenon-CT results may be explained by limitations on the use of xenon-CT in the ICU. Xenon-CT is an elaborate methodology, which is primarily used for research. Even a single scan producing a snapshot of CBF is disruptive to ICU routines and exposes the patient to potentially dangerous radiation. It would generally not be used on an unstable or deteriorating patient. In contrast, the ICP waveform was monitored continuously in all of the patients included in this study.
Vasomotion and last-tier thiopental treatment
Thiopental is a barbiturate, and its primary mechanism of action is inhibition of the central 53 nervous system. It was used in our clinic as a last-tier treatment for refractory ICP in both TBI53 and SAH 54 patients. Thiopental was remarkably successful in our TBI cohort. The outcomes (GOSe) for patients with TBI who received thiopental treatment but not a DC were similar to those for the group that did not receive either of the last-tier treatments and significantly better than those for the group that received a DC only (for these and the following statistics see Table 5). As previously reported, thiopental was much less successful in patients with SAH. 54 In our SAH cohort, the thiopental only group had significantly worse outcomes than both the group with no last-tier treatment and the DC only group.
The incidence of very low ABP-55-15 amplitude (<1 mmHg) was significantly increased in the thiopental subgroups of both the SAH and TBI cohorts, indicating reduced extraparenchymal arterial vasomotion. In spite of this in the TBI cohort, the incidence of very low ICP-55-15 amplitude (<1 mmHg) was only marginally larger in the thiopental group than in the group that had no last-tier treatment (p = 0.09). In the SAH cohort, however, the thiopental group had significantly greater proportion of monitoring time with very low ICP-55-15 amplitude (p < 0.00001). This indicates that intraparenchymal vasomotion in patients with SAH is highly dependent on ANS support, while in TBI it is more independent.
Thiopental inhibits ANS activity, resulting in decreased cerebral metabolic demand and reduced CBF and ICP. The reduction of CBF is considered to be safe because of an “inverse steal” process in which CBF is distributed in favor of hypoperfused brain areas over areas with adequate perfusion, 55 but this assumes that cerebral metabolic autoregulation is intact. The results reported here regarding thiopental treatment are yet another indication that this generally true in patients with TBI but false in patients with SAH. Patients with SAH have seriously deficient intraparenchymal metabolic autoregulation and are therefore highly dependent on ANS support for the maintenance of CBF.
Sedation in the SAH and TBI cohorts
Sedation in our patient cohorts was individualized but generally involved propofol infusion in combination with opioids. There are several proposed mechanisms of action for propofol that are not fully elucidated, including modulation of GABA receptors and calcium-ion channels. 56 The overall effect is decreased level of consciousness and ANS activity. In our brain injury patients this further results in reductions in MAP, CBF, and ICP. In the patients with TBI, there were more problems with intracranial mass-effect from contusions, hematoma, and edema causing high ICP, while in patients with SAH, there were greater concerns regarding insufficient CBF and delayed cerebral ischemia. Therefore, the patients with TBI generally received deeper sedation than the patients with SAH, which probably plays a role in the elevated ANS activity observed in our SAH cohort relative to the TBI cohort.
Surgical clipping versus endovascular treatment in the SAH cohort
The only significant change in treatment over the study period was a shift from surgical clipping toward endovascular coiling in the SAH cohort. A previous study found that endovascular and surgical treatment were associated in our center with very similar results regarding delayed neurological deficits and long-term patient outcome. 13 Endovascular treatment was associated with a much lower rate of last-tier hemicraniectomies. This may indicate that endovascular treatment is less likely to cause elevated ICP, but it is likely that this is due to selection bias. In 44% of the cases treated surgically, the reason given was the need to evacuate a hematoma.
Summary
We have used ICP-55-15 amplitude and ABP-55-15 amplitude as metrics of the intensity of intraparenchymal and extraparenchymal vasomotion. As discussed above, previous work provides evidence that ABP and ICP oscillations in the 0.02–0.07 Hz frequency range (55–15 sec periods) are related to cerebrovascular autoregulation. The results presented here demonstrate that higher vasomotion based on these measures is associated with improved patient outcome in both of our patient cohorts. This is in spite of the fact that increased vasomotion by these measures is also associated with physiological crises that negatively affect CBF like systemic hypotension and elevated ICP. To overcome these negative associations, vasomotion must play an important role in normal extraparenchymal and intraparenchymal circulation as well.
The influence of cerebral factors on extraparenchymal vasomotion can only come via the ANS. Intraparenchymal vasomotion can also be directly and indirectly influenced by the ANS but in our TBI cohort, it is largely controlled by local intracerebral metabolic autoregulation. In our SAH cohort, however, cerebrovascular autoregulation appears to be disturbed. In this case, the ANS control of CBF is increased, which appears to benefit these patients, although it by no means fully compensates for the failure of intraparenchymal autoregulation.
Evidence for the greater dependence of our SAH cohort on ANS support for CBF compared with the TBI cohort has been presented based on several results, including: The much greater dependence on elevated CPP, which is controlled by the ANS, for the support of CBF in the SAH cohort than in TBI (Fig. 1A). Very pressure-active cerebral vessels (low PRx-55-15), which restrict the influence of the ANS on CBF, are associated with very good outcome in TBI but poor outcome in SAH (Fig. 2). Thiopental treatment, which quiets the ANS, is beneficial as a last-tier treatment for intractable ICP in the TBI cohort, but not in SAH (Table 5). ABP-55-15 and ICP-55-15 are more highly correlated in the SAH cohort (R = 0.51) than in the TBI cohort (R = 0.29) (p = 0.00008, Table 2), indicating a greater dependence of intracerebral vasomotion on systemic vasomotion and hence the ANS in SAH. In multivariate regression predicting patient outcome (GOSe) with ICP-55-15 excluded, ABP-55-15 is a highly significant predictor in the SAH cohort (p = 0.00003, Supplementary Table S1) but only barely significant in TBI (p = 0.046, Supplementary Table S2).
The evidence presented in this article very consistently indicates that CBF in our SAH cohort was highly dependent on vigorous support from systemic ABP and vasomotion, while our TBI cohort benefitted from much more limited systemic, ANS support, and relied primarily on cerebrovascular autoregulation of CBF.
Limitations
This is a retrospective analysis of correlated physiological variables that interact in complex ways, and causality cannot be definitively determined. We have introduced ICP-55-15 amplitude and ABP-55-15 amplitude as measures of intraparenchymal and extraparenchymal vasomotion. We do not have definitive proof for this, but rather cumulative evidence from this and previous studies. Future work could include evaluation of these new metrics using existing methodologies for monitoring CBF and vasomotor reactivity such as xenon-CT, infrared spectroscopy, positron emission tomography, and transcranial doppler ultrasonography, although these come with their own problems and caveats. 57 –59 An advantage of ICP-55-15 amplitude and ABP-55-15 amplitude is that they are derived from the ICP and ABP waveforms that are routinely and continuously monitored in severely brain-injured patients in intensive care.
In this study, we have dealt exclusively with long-term averages over two large patient cohorts, which limits the extent to which the data can be relied on in the treatment of any specific patient. 25 Future work could focus on extending these results to the understanding of individual patients or clusters of similar patients. For example, a critical distinction in this study was that in the TBI cohort intraparenchymal autoregulation appears to be largely intact, while in the SAH cohort, it is largely disturbed, but there will be patients with TBI where it is disturbed, and possibly patients with SAH where it is intact. In particular, it is possible that patients with TBI who have suffered a traumatic SAH would respond better to treatment according to SAH guidelines than TBI guidelines.
Our database lacks detailed minute-by-minute data on treatment to match our physiological data, so it was not possible to separate the physiological effects of brain injury from those of treatment. We have discussed the effects nimodipine treatment, thiopental treatment and propofol sedation above, but other treatments including, for example, vasopressors and beta-blockers have significant effects on CBF in these patients that could vary between patients with SAH and TBI. Developing the capability to adequately integrate detailed treatment data in our intensive care research databases is a major challenge for the field as a whole.
Conclusions
CBF was controlled primarily by cerebrovascular autoregulation in the TBI cohort but by the ANS in the SAH cohort. Our results support the view that ANS activity is heightened in patients with SAH, and that this is connected to disturbed cerebrovascular autoregulation. They do not support the view that therapies that reduce this ANS activity could help patients with SAH, but on the contrary, highlight the dangers of such an approach and the necessity of this heightened ANS activity for their survival and recovery. The ANS is attempting, with partial success, to compensate for the failure of intraparenchymal cerebrovascular autoregulation, and that failure should continue to be a focus for future therapies.
Transparency, Rigor, and Reproducibility Summary
Because of its retrospective nature, the study and the analysis plan were not preregistered. The included patients were selected based on admission to our intensive care unit diagnosed as TBI or aneurysmal SAH, with physiological data requirements as described in the methodology section. The sample sizes are large enough to ensure reproducibility by other centers with reasonably similar patient cohorts and treatment policies to our own.
Footnotes
Acknowledgments
The authors thank Elisabeth Ronne Engström for maintaining the SAH clinical database, Anders Lewén for maintaining the TBI clinical database, and Henrik Engquist for help with the material regarding sedation in these patients.
Authors’ Contributions
All of the authors contributed to the study conceptualization. P.E. had responsibility for supervision of the reported research. T.H. and A.H. were responsible for data curation. T.H. conducted the formal analysis and wrote the original draft. A.H., T.S.W., and P.E. participated in review and editing.
Ethical Approval and Consent to Participate
The study was approved by the Swedish Ethical Review Authority. Written informed consent for inclusion of anonymized physiological and clinical data was obtained from the patients or their relatives during treatment or follow-up.
Availability of Data and Materials
The individual patient data that is the basis of the study is not available because of conditions in the ethical approvals. The summary data analyzed and presented in the study is not available in a public repository but may be available by emailing the corresponding author.
Author Disclosure Statement
No competing financial interests exist.
Funding Information
There was no special funding supporting this study.
Supplementary Material
Supplementary Figure S1
Supplementary Figure S2
Supplementary Figure S3
Supplementary Figure S4
Supplementary Figure S5
Supplementary Figure S6
Supplementary Table S1
Supplementary Table S2
References
Supplementary Material
Please find the following supplemental material available below.
For Open Access articles published under a Creative Commons License, all supplemental material carries the same license as the article it is associated with.
For non-Open Access articles published, all supplemental material carries a non-exclusive license, and permission requests for re-use of supplemental material or any part of supplemental material shall be sent directly to the copyright owner as specified in the copyright notice associated with the article.
