




Abstract
To introduce the UChicago PBI Imaging score, a novel characterization of imaging features using head computed tomography (HCT) in patients with gunshot wounds to the head (GSWH) resulting in penetrating brain injury (PBI) and to quantify the association with mortality. We retrospectively collected and analyzed data from 230 patients with GSWH admitted to our Level 1 trauma center between May 1, 2018, and October 31, 2023. HCT images obtained on hospital arrival were evaluated for predefined imaging features by two blinded readers and arbitrated, when needed, by a third. The average contribution of each radiological feature to mortality at hospital discharge was assessed using a SuperLearner ensemble model trained on ∼77% of the cohort. Each feature’s contribution was scaled to ensure the additive final score per patient ranged between 0 and 100. The HCT features predicting in-hospital mortality, ranked from highest to lowest importance, were transhemispheric projectile below the level of the third ventricle (18 [16.8, 19.9]), presence of blood in the lateral ventricles (ventricles casted) (18[16.8, 19.6]), brainstem involvement (14 [12.7, 15.1]), transhemispheric projectile above the level of the third ventricle (11 [9.7, 11.6]), presence of any amount of blood in the ambient cistern (9[8.2, 10]), presence of any amount of blood in the lateral ventricles (9 [7.9, 9.8]), cerebellar involvement (9 [7.9, 9.5]), any evidence of ventricular effacement (4 [3.4, 4.6]), midline shift (MLS) >0 mm (4 [3.4, 4.4]), perforating injury (3 [2.4, 3.2]), and presence of an intracerebral hematoma (ICH) >20 mm in the largest diameter (2 [1.4, 1.9]). The UChicago PBI Imaging score showed a strong performance, achieving an area under the curve (AUC) of 0.86 (95% CI: [0.77, 0.96]) on a test set of 56 patients who were not included in model training. This indicates better prediction accuracy compared to both the Rotterdam score (AUC 0.8, 95% CI: [0.68, 0.96]) and the Marshall score (AUC 0.66, 95% CI: [0.52, 0.81]). Our model performed particularly well for patients with a Glasgow Coma Scale (GCS) score between 5 and 9. In this range, our model’s performance (AUC 0.86) remained stable, while the Rotterdam and Marshall Scores showed notably lower predictive accuracy, with AUCs of 0.61 and 0.52, respectively. A dedicated evaluation of GSWH HCT reveals an association between disease burden, as quantified by unique features not native to blunt TBI imaging models, and mortality. Specifically, transhemispheric injury below the level of the third ventricle along with blood-casting bilateral ventricles and brainstem involvement was highly associated with mortality. The model is optimized for intermediate GCS scores where greater prognostic uncertainty exists. This study parallels efforts to refine TBI classification, underscoring the necessity for precise imaging-based classification in PBI to identify imaging biomarkers and ultimately enhance prognostication and targeted treatment.
Introduction
Gun violence stands as the leading cause of death for adolescents and young adults in the United States, disproportionately affecting low-income communities of color. 1 In 2021, the country recorded over 48,000 firearm-related deaths, marking the highest rate since 1994. 2,3 Penetrating brain injury (PBI) from gunshot wounds to the head (GSWH) is associated with mortality rates between 44% and 55%. 4 Despite the profound impact of PBI, there is a scarcity of data on the management and prognostication of the disease. 5 –7 Furthermore, PBI has often been excluded from most randomized controlled trials on investigating therapeutic interventions for severe traumatic brain injury (sTBI), limiting the applicability of knowledge derived from blunt injuries to PBI. This neglect extends into imaging leaving the unique imaging features of PBI underexplored. Furthermore, more recent attempts to refine the classification of TBI do not explicitly include PBI.
Unique imaging features associated with outcomes following PBI are similarly underexplored. There is extensive literature on imaging in blunt TBI, from basic models like Rotterdam and Marshall 8,9 to advanced deep learning methods for injury detection and interpretation, 10,11 and initiatives like the Enhancing NeuroImaging Genetics through Meta-Analysis adult moderate/severe TBI working group, which facilitates global research in TBI imaging. 12 Although this focus is understandable given the prevalence of blunt TBI, it has resulted in a significant knowledge gap related to PBI imaging. Beyond traditional objectives such as (1) identifying injuries requiring urgent surgical or procedural intervention, (2) detecting injuries that may benefit from early medical treatment or close monitoring, and (3) assessing prognosis for rehabilitation, family counseling, and discharge planning, 13 imaging is essential for the evolving classification of TBI. In TBI, this classification integrates clinical examination, imaging, and other biomarkers into a multimodal framework that supports medical decision-making, aligning with the National Institute of Neurological Disorders and Stroke (NINDS) initiative for a precise, evidence-based TBI classification system beyond the Glasgow Coma Scale (GCS) definitions of “mild, moderate, and severe”. Meanwhile, PBI lacks a standardized radiographical descriptions of injury and a nuanced disease classification system.
While recent models of survivability in PBI, such as the SPIN score, excel in early prognostication, they have not been employed for the improvement of disease classification. 14 Further, they provide limited actionable information for intermediate injuries. Rather than concentrating solely on early prognostication, emphasis should be placed instead on disease phenotyping and identifying patient subgroups that may benefit differentially from various treatments.
To address these shortcomings, we sought to identify neuroimaging features of PBI associated with mortality to systematically classify grades of injury severity in PBI. We described and quantified radiographical features, examined the association between imaging-determined disease burden and mortality, and ranked imaging features accordingly. We focused on quantifying the significance of each imaging feature in relation to mortality, therefore offering a nuanced perspective on their relative importance, and aiming to reduce the arbitrary nature often attributed to these features. By quantitatively assessing and assigning significance to imaging features, we aim to move beyond the subjective and often arbitrary assumptions commonly made in clinical practice regarding the relevance of specific imaging characteristics. Correspondingly, by developing a comprehensive hierarchical imaging scoring classification system for PBI (U Chicago PBI Imaging Score), our approach aims to mitigate the risk of underestimating or overestimating the importance of certain imaging findings, which can inadvertently contribute to therapeutic nihilism and less aggressive treatment strategies, as well as to enrich the granularity and clinical utility of radiographical assessments, ultimately supporting targeted treatment strategies.
Methods
Study design and data collection
This observational study included retrospectively collected data from patients admitted to University of Chicago Medical Center (UCMC) with GSWH between May 2018 and January 2023. Inclusion criteria were (1) age 16 or older; (2) PBI secondary to GSWH; and (3) evidence of dural injury on initial head computerized tomography (HCT). Patients who were dead on arrival or did not undergo HCT imaging were excluded from the analysis. For each patient, information was collected on demographics, GCS on arrival, pupillary reactivity on arrival, transfer status, laboratory results, length of hospital stay, withdrawal of life support (WOLST) status, and discharge status. Figure 1 presents a flow diagram, detailing the inclusion and exclusion procedure. The study was approved by the UCMC institutional review board protocol 22-0474.
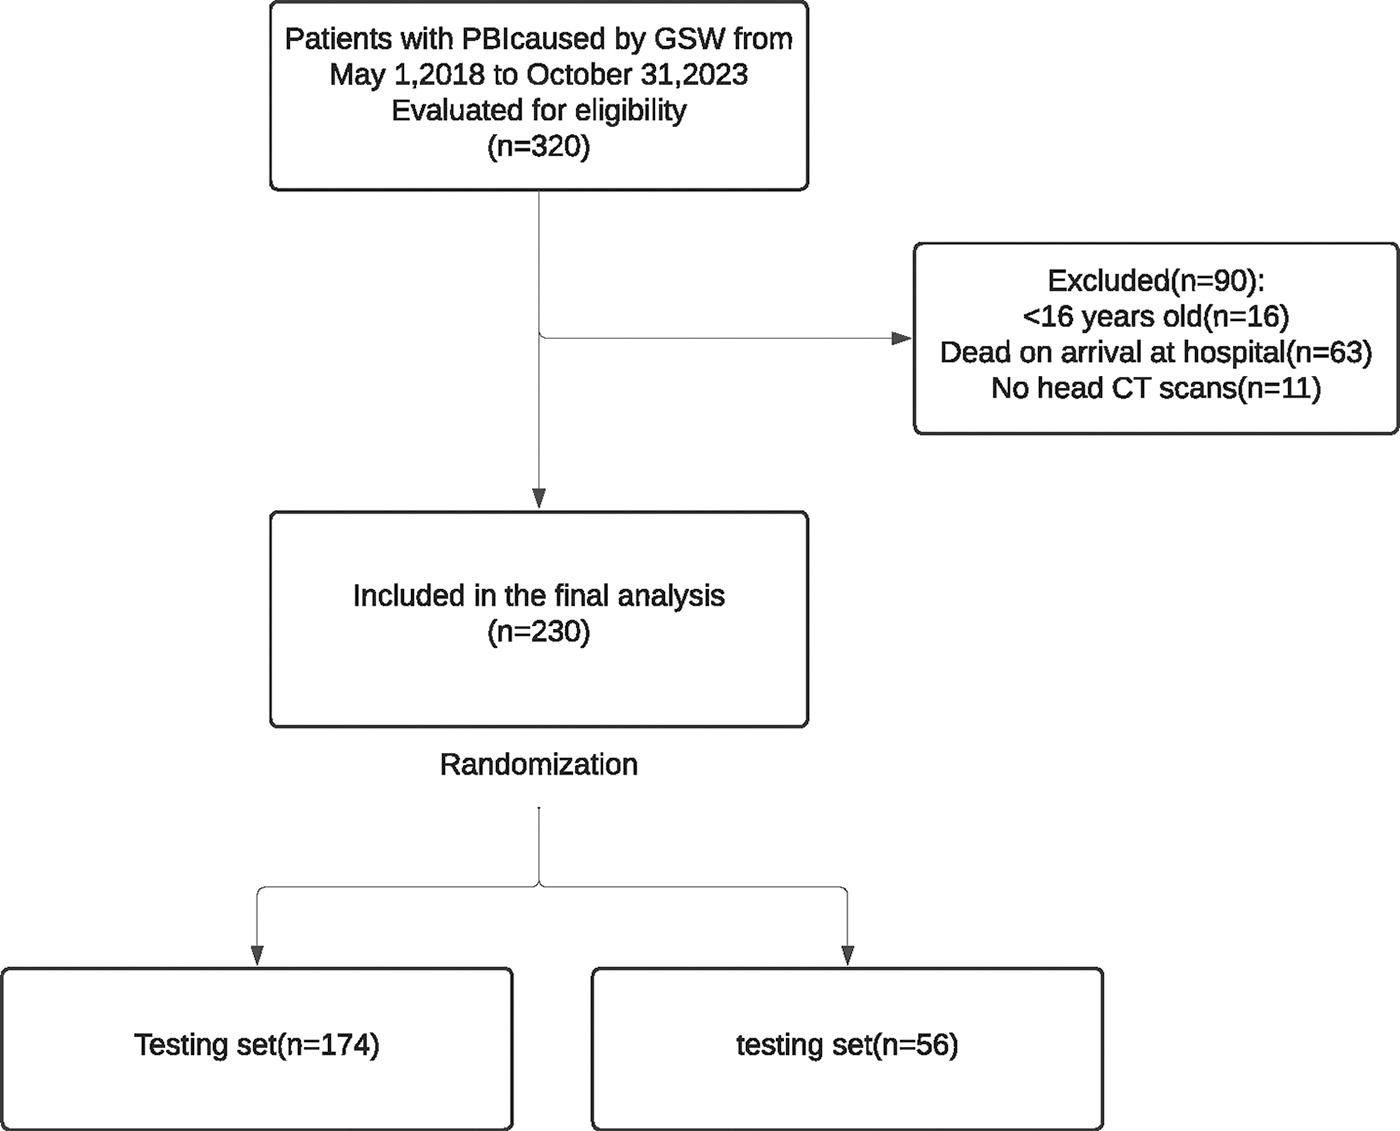
Consort diagram.
Imaging features definition
HCT images were reviewed by two independent readers: one board-certified neuroradiologist and one clinical fellow specializing in neuroradiology, neurocritical care, or neurology. Readers were blinded to patient outcomes to ensure unbiased evaluation. In cases where consensus was not achieved, a third senior reader provided arbitration. Inter-reader performance was evaluated using Kappa coefficient.
The HCT clinical features (available in Supplementary Table S1) were determined through a priori consensus among the study team that included a neurosurgeon, two neurointensive care physicians, and a neuroradiologist. The selected features emphasize the following criteria: Relevance and peculiarity to the disease context: The features are specifically pertinent to PBI caused by GSWH, ensuring they are directly applicable to this unique clinical scenario. Reproducibility: The features were chosen based on their ability to be consistently identified and measured across different cases and reader experiences. Avoidance of common or obscure features: To maintain specificity, features that are either commonly present across all patients or are difficult to quantify accurately were excluded. For example, subarachnoid hemorrhage, which is frequently seen in various types of brain injuries and almost universally in PBI, was not included. Additionally, hematoma volume assessment using the formula AxBxC/2 was avoided, as hematomas in PBI are often heterogeneous and irregularly shaped.
This selection process ensured that the identified features were both specific to PBI due to GSWH and reliably measured, providing a robust basis for clinical assessment.
Outcomes variables definition
The primary outcome of this study was defined as patient mortality at the time of discharge. The secondary outcome was defined as patient disposition (favorable vs. unfavorable) at the time of discharge. Favorable outcome was defined as discharge to home, acute rehabilitation, or leaving against medical advice. Unfavorable outcome was defined as discharge to skilled nursing facility, long-term acute care, hospice, or death. No long-term follow-up data are available for the purposes of this article, as the emphasis was on quantifying the significance of imaging features in relation to in-hospital mortality.
Statistical analysis
SuperLearner model
Our statistical methodology comprised three main steps: (1) stratified sample split and sample description; (2) model training; and (3) mortality risk score calculation and assessment.
We assessed and reported descriptive summary statistics on baseline demographic and clinical characteristics for the full sample, presenting means with standard deviations or medians with interquartile ranges for continuous variables, and percentages for categorical ones, all stratified on the binary mortality outcome and compared with univariate t-tests, with a significance level set at p < 0.05. We utilized stratified sampling to divide the totality of the cohort into two mutually exclusive sets: a training set, used for training the model and calculating the mortality risk score, and a holdout test set, reserved for out-of-sample validation of both the predictive model and the mortality risk score assessment (https://github.com/MIDRC/Generalized_Stratified_Sampling). 15,16 To improve balance and minimize bias in our model estimation process, we stratified the samples based on patients’ age, GCS on arrival, and WOLST status. This approach ensured that both the training and test sets were adequately balanced concerning these critical factors, thereby enhancing the robustness of our predictive model and mortality risk score assessment. 9
We developed a machine learning model, trained to predict mortality as a function of radiological HCT features after a Lasso preselection to mitigate the risk of overfitting. We used an optimal ensemble modeling approach for its desirable properties in terms of ex-ante performance and to further mitigate overfitting. 17 Specifically, we trained a SuperLearner binary classifier consisting of a cross-validated, optimally weighted combination of several individual binary classifiers. 17 Individual classifiers included in the SuperLearner were (1) logistic regression; (2) elastic net; (3) K-nearest neighbors; (4) kernel-supporting vector machine; and (5) gradient-boosted trees, following model selection guidelines from Phillip et al 2023 given our sample size and the data structure of our outcome and predictors. 18 Further, during the cross-validation stage of the model, we weighted the loss function such that errors are penalized inversely proportional to GCS frequency. This decision was based on clinical judgment, given that mortality outcomes tend to be less ambiguous toward the extremes of GCS range. Software used for this step was the SuperLearner R package, version 2.0-30-9000. Consensus-derived (Supplementary Table S1) radiological features selected in a prescreening step using Lasso were included as final predictors in the SuperLearner. Software used for this step was the glmnet R package, version 4.1-8. Out-of-sample performance was evaluated using receiver operating curve (ROC) analysis with the area under the curve (AUC) serving as the figure of merit score and 95% confidence intervals estimated via bootstrapping with 10000 iterations.
Shapley values and UChicago PBI imaging score calculation
We developed a mortality risk score by estimating the feature importance of each predictor in the model. To measure feature importance, we computed the exact Shapley values from the SuperLearner classifier for each observation in our training set and then aggregated them. Shapley values represent the average marginal contribution of each feature to the output of the model (in this case, mortality), such that we obtain the deviation from the mean outcome that can be attributed to marginalized changes in a given feature value, across each possible combination of the rest of the feature values. 19 In this way, for each observation in our training sample, every predicted probability of mortality produced by our model can be additively decomposed into several marginal feature contributions, beyond the mean mortality in the sample. After performing such decomposition, we calculated a risk score component for each HCT feature by taking the mean across their positive (in our context, “present”) Shapley values, across all iterations within a bootstrap procedure performed over the training set. We then normalized the resulting score components to an additive 0–100 scale and reported their corresponding 95% confidence intervals. Finally, we assigned each patient in the holdout test set a total additive score of 0–100 according to the presence or absence of each HCT feature according to its corresponding standardized score component derived from the Shapley values as previously described. We then evaluated this mortality risk score by its ability to correctly classify patients into their observed outcome. In addition, we analyzed the concordance of total GCS and the UChicago PBI Imaging score to examine their joint ability to identify at-risk patients. Software used for calculating Shapley values was the shapr R package, version 0.2.3.9200.
There are several reasons why we opted for this feature importance-based method for the calculation of the UChicago PBI Imaging score. First, the underlying model we used to predict mortality (SuperLearner) was selected because of its superior expected out-of-sample performance and because is not naturally accompanied by regression coefficients (or any direct measure of the weight that the features have on the output of the model, more generally). Therefore, a model-agnostic method to derive feature importance was necessary. Second, among different model-agnostic methods to calculate feature importance, Shapley values have mathematical properties that make them, at least for certain types of applications, advisable and favored over other approaches. Third, their interpretation is particularly well-suited for our main task, which is to develop a rapid medical scoring method based on the additive marginal contributions of the presence of multiple salient features to predicted mortality.
Results
Clinical characteristics
A total of 320 patients with PBI due to GSW were admitted to UCMC between May 1, 2018, and October 31, 2023. In total, 230 patients met inclusion criteria and were included in the analysis. From the total of 230 patients, 110 (47.4%) survived at discharge and 120 (52.6%) died. Basic demographic and clinical characteristics of the final cohort are summarized in Table 1. The median age (IQR) of our cohort was 28 (21.9, 35) years. The minority of the patients (16.5%) were female. Black patients comprised most of the sample (84.4%), followed by Hispanic (7.6%) and White patients (4.6%). None of these demographic characteristics were significantly different between patients with respect to mortality. The median hospital intensive care unit length of stay was 5 (2.0, 18) days and was significantly higher for patients who survived. After stratified sample split, 174 (77%) patients comprised the training set, and 56 (23%) comprised the holdout test set.
Patient Characteristics
Median (Q1, Q3).
n (%).
Pearson’s chi-squared test.
GCS, Glasgow Coma Scale; ICU, intensive care unit.
Radiological Features
Median (Q1, Q3).
n (%).
Pearson’s chi-squared test.
HCT, head computed tomography.
Inter-reader reliability
Table 2 shows the radiolocal features across the two groups. Supplementary Table S2 reports inter-rater reliability at identifying HCT characteristics, with an average Kappa correlation coefficient of 0.712, a value that indicates a strong level of agreement between our readers.
Model performance and Shapley values
Figure 2 shows the ROC curve for our model when tested on the 56-patient holdout test set (AUC of 0.86, 95% CI: [0.77, 0.96]). Shapley values for each HCT predictor included in the SuperLearner model, resulting from a bootstrap procedure of 100 iterations within the training dataset are shown in Figure 3. The resulting HCT score components for each radiological feature predicting outcome are, from highest to lowest importance in relation to mortality: (1) transhemispheric projectile below the level of the third ventricle (18 [16.8, 19.9]), (2) presence of blood in the lateral ventricles (ventricles casted) (18 [16.8, 19.6]), (3) brainstem involvement (14 [12.7, 15.1]), (4) transhemispheric projectile above the level of the third ventricle (11 [9.7, 11.6]), (5) presence of any amount of blood in the ambient cistern (9 [8.2, 10]), (6) presence of any amount of blood in the lateral ventricles (partial presence) (9 [7.9, 9.8]), (7) cerebellar involvement (9 [7.9, 9.5]), (8) any degree of ventricular effacement (4 [3.4, 4.6]), (9) midline shift (MLS) >0 mm (4 [3.4, 4.4]), (10) perforating injury (3 [2.4, 3.2]), and (11) intracerebral hematoma (ICH) >20 mm in the largest diameter (2 [1.4, 1.9]). (Fig. 3).
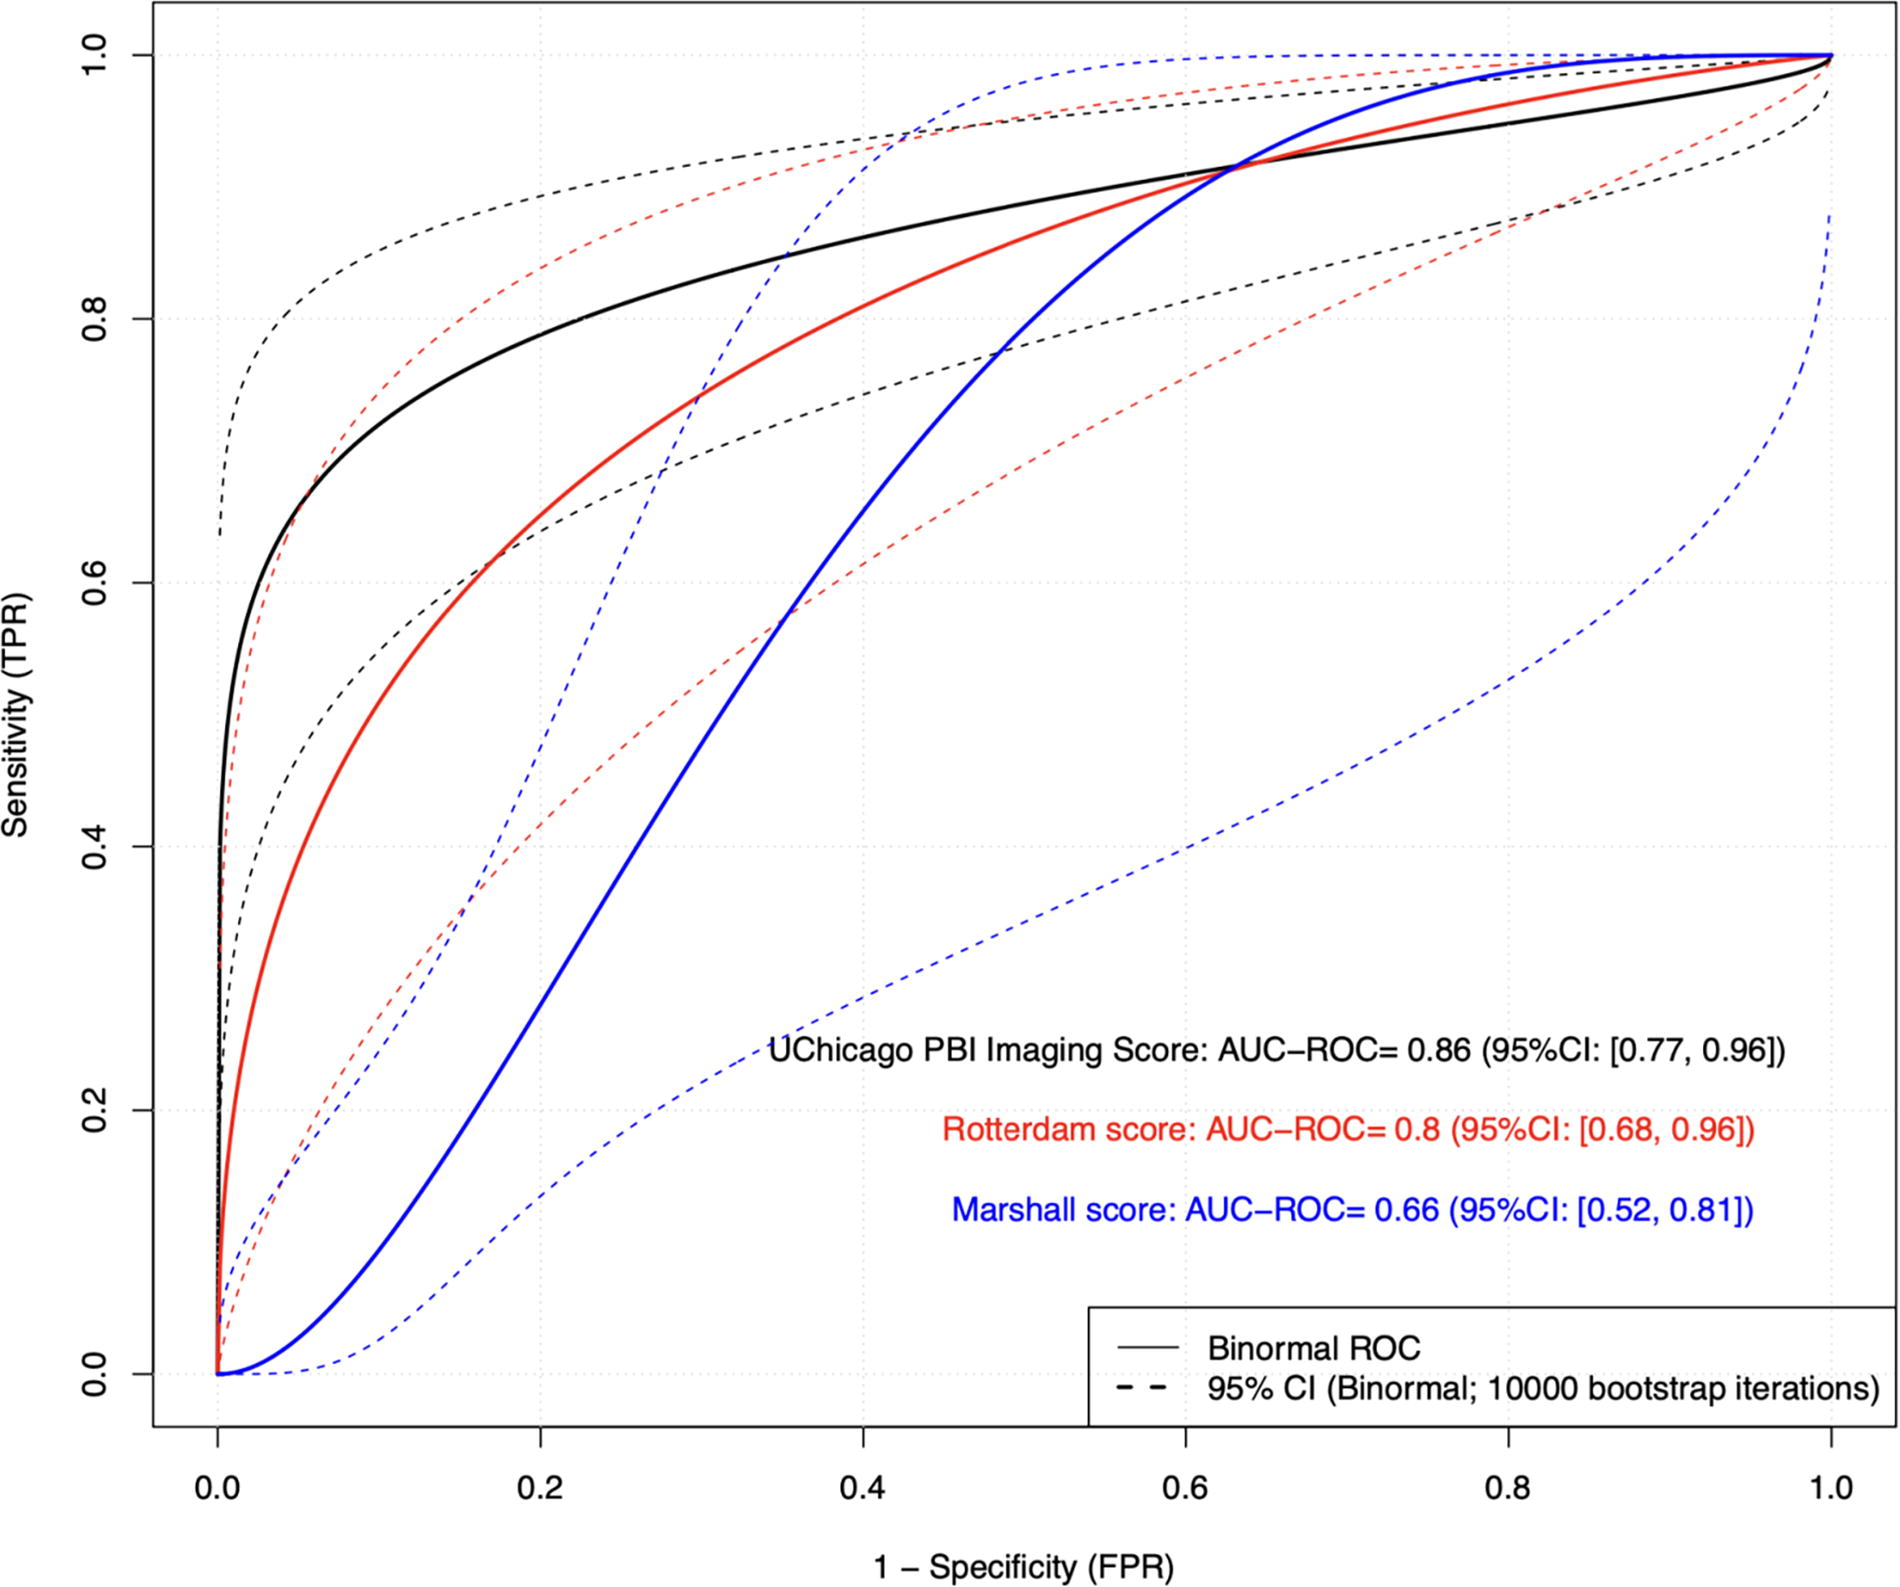
U Chicago PBI imaging score, Rotterdam, and Marshall mortality risk scores: ROC curve on holdout dataset (N = 56). PBI, penetrating brain injury; ROC, receiver operating curve.
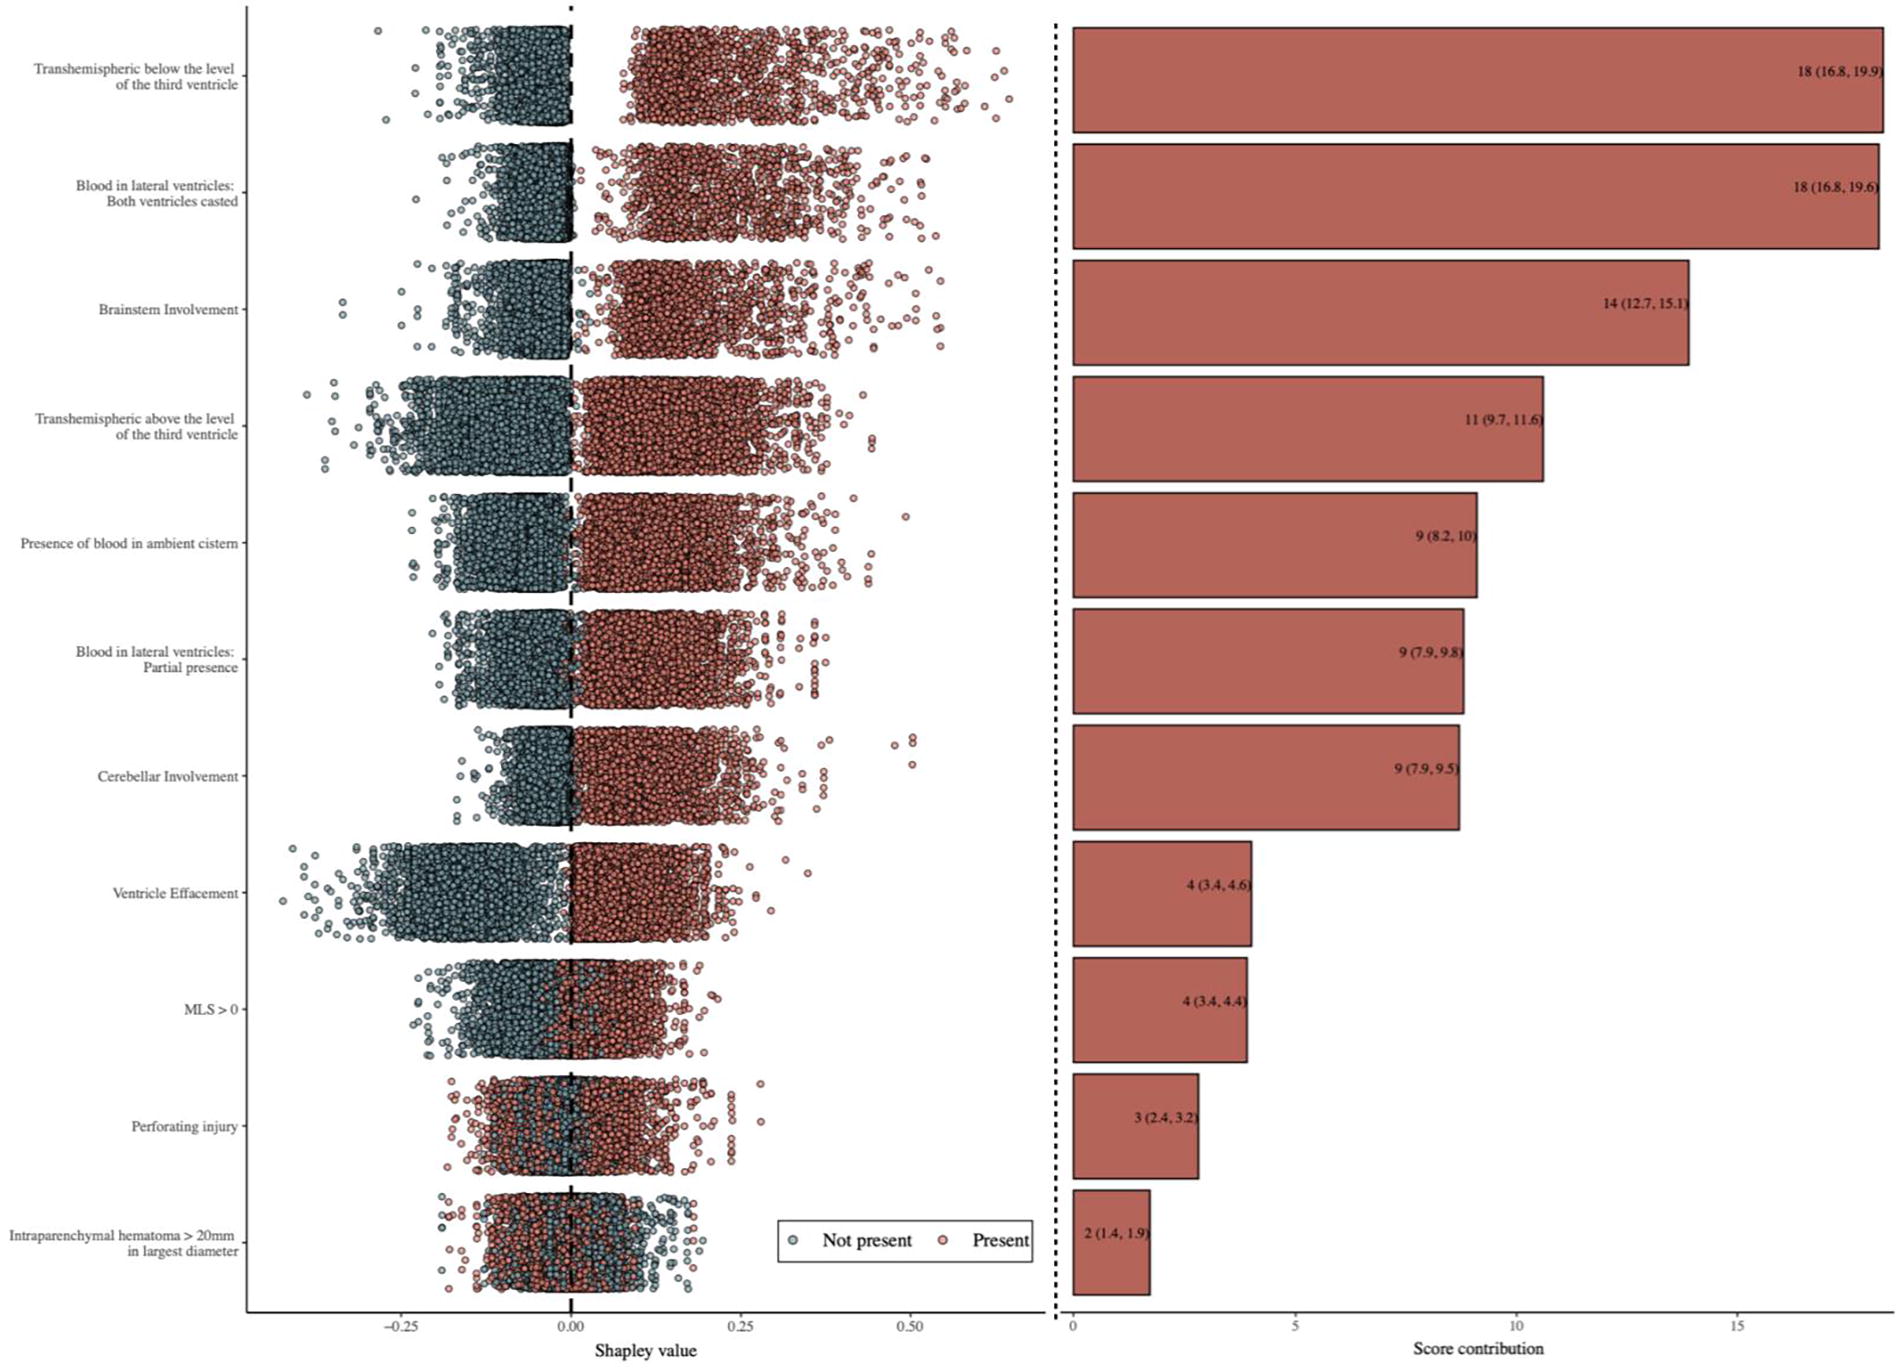
Shapley values for the SuperLearner ensemble and CT-based mortality risk score contribution (training data: N = 174; mean [95% CI]; no. bootstrap iterations = 100). CI, confidence interval; CT, computed tomography. Note: To calculate the UChicago PBI Imaging score for a given patient, we sequentially add up the weight (or score contribution) corresponding to each of the present (versus absent, in which case the contribution is zero) features included in the comprehensive model, with each weight given by the standardized Shapley value (right-hand side of Figure 3). Each standardized weight, in turn, corresponds to the average of the mortality-contributing raw Shapley values (red dots in the left side of Figure 3) normalized so that the maximum final score a given patient can get is 100 (the minimum being zero, corresponding to none of the features present).
Comparison of UChicago PBI imaging score with Rotterdam and Marshall CT scores
While acknowledging Rotterdam and Marshall CT scoring systems were developed for blunt TBI, they are extensively known and ubiquitously used in TBI research. Consequently, we compared the UChicago PBI Imaging score performance against Rotterdam and Marshall CT scores. Compared to the Rotterdam CT score, our model showed a superior performance (AUC of 0.80, 95% CI: [0.68, 0.96]). Similarly, our model outperformed Marshall CT score (AUC of 0.66, 95% CI: [0.52, 0.81]) (Fig. 2). For 15 patients with intermediate GCS scores between 5 and 9, the UChicago PBI Imaging score continues to show superior performance (AUC−ROC = 0.86, 95% CI: [0.65, 1]) compared to Rotterdam score (AUC = 0.61, 95% CI: [0.31, 1]) and Marshall score (ROC = 0.52, 95%CI: [0.21, 0.83]).
Exploring the relationship between UChicago PBI imaging score, GCS, and mortality
Figure 4 demonstrates the relationship between the UChicago PBI Imaging score and the total GCS in the test set cohort. UChicago PBI Imaging score of more than 35 was associated with mortality in all of our cohort, regardless of the total GCS or mechanism of death. A total GCS of 3–4 was associated with 100% mortality when the HCT risk score was more than 30. Four patients with GCS of 3–4 and a UChicago PBI Imaging score of <35 survived; an additional two died in the context of WOLST. Mortality in a total GCS score of 5–9 seems to be higher with higher risk CT features.
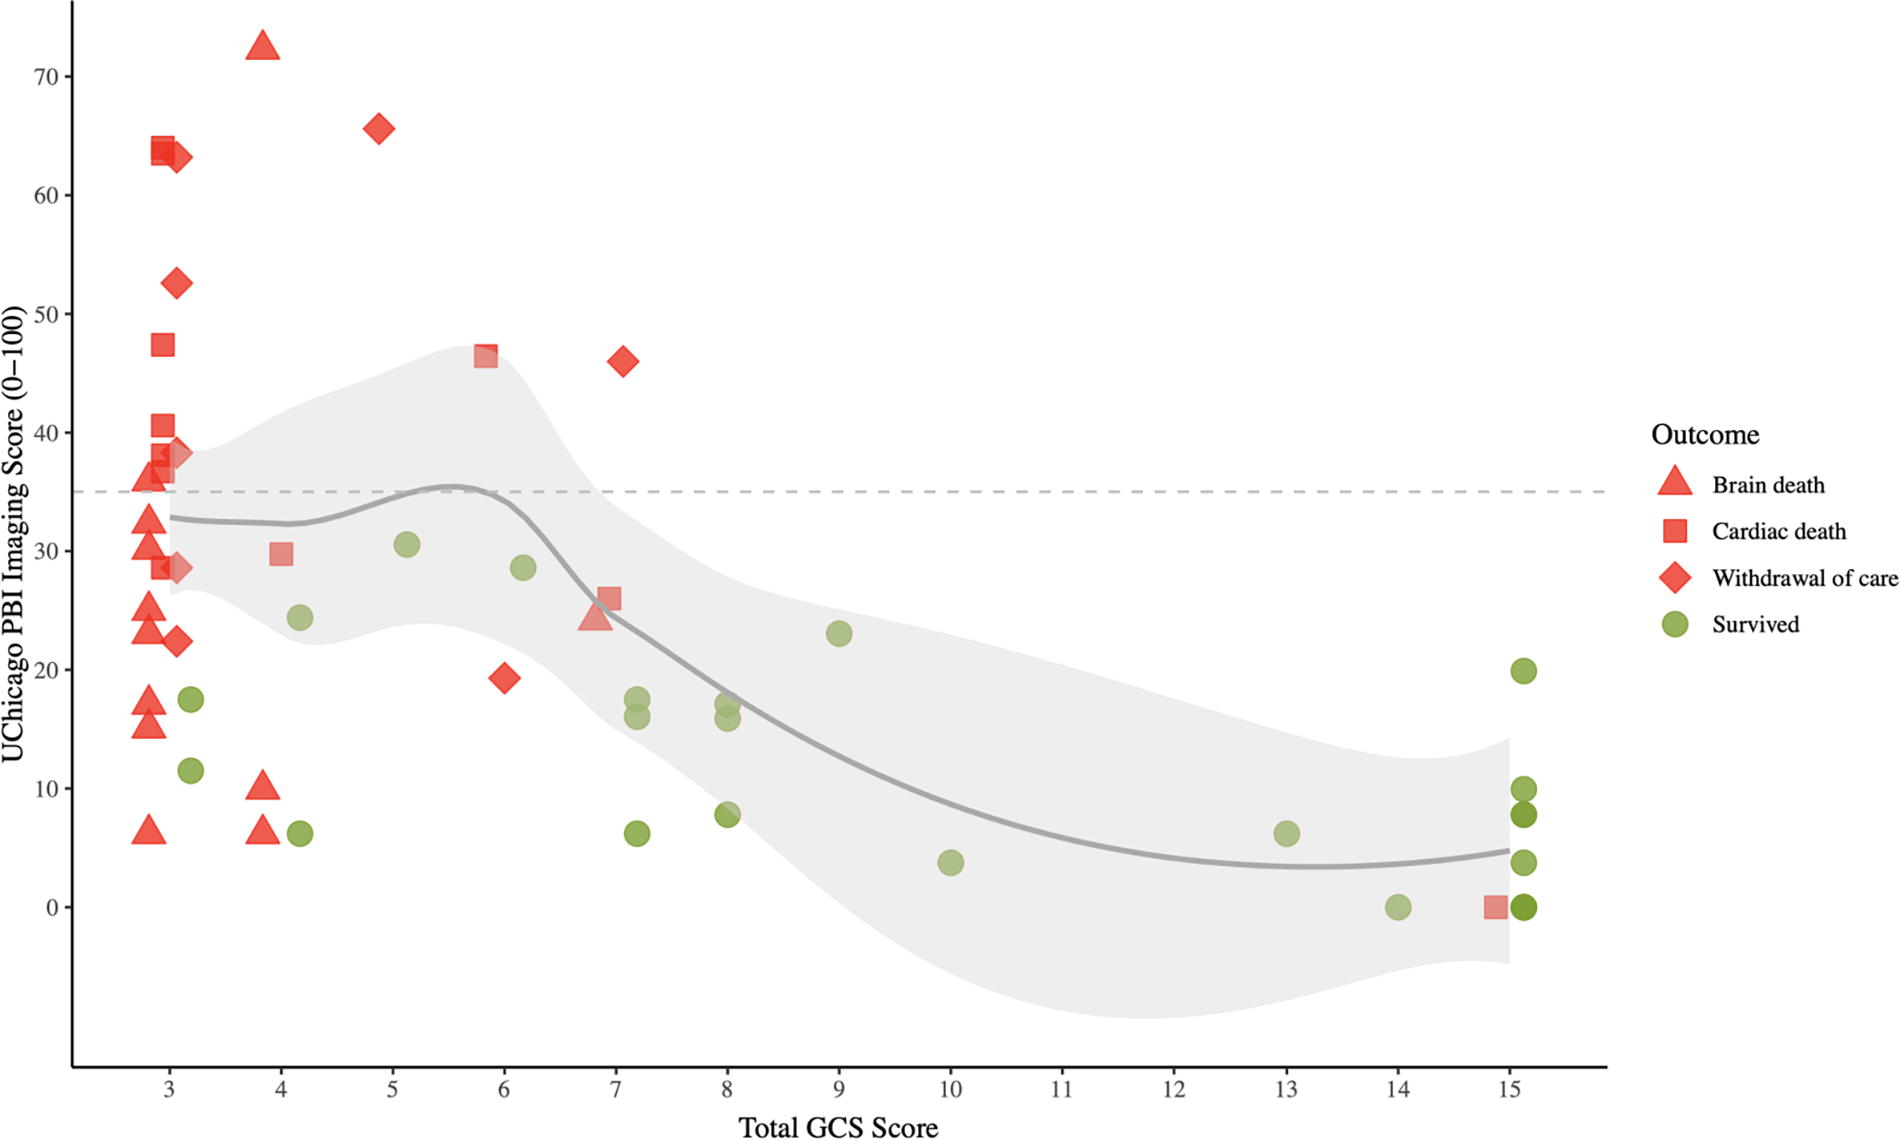
CT-based mortality risk score and total GCS by outcome (test set: N = 56). GCS, Glasgow Coma Scale.
Model performance in predicting dispositional outcome
When the 56-patient hold-test set was used to assess the model performance on favorable outcome, we observed an AUC of 0.85 (95% CI: [0.74, 0.97]).
Model performance on mortality prediction after excluding WOLST
We evaluated the model performance on a 48-patient holdout test set after patients who died from WOLST were excluded. We observed an AUC of 0.83 (95% CI: [0.72, 0.95]).
Discussion
In this observational cohort of 230 patients with PBI secondary to GSWH, we explored the association between radiographical features identified on HCT and patient outcomes. We introduce the UChicago PBI Imaging Score, a novel model, optimized for intermediate GCS at hospital arrival, designed to quantify various radiographical features extracted from initial HCT in PBI secondary to GSWH, uniquely assigning a quantitative value to each feature’s impact on mortality. To our knowledge, this study marks the first instance of such an approach in PBI, offering a comprehensive comparison of these features and their respective contributions to mortality outcomes, complementing the information already incorporated in the GCS score and its known association with mortality. A projectile bihemispheric injury below the level of the third ventricle is the most impactful prognostic feature, followed by complete casting of blood in the lateral ventricles and brainstem involvement. Meanwhile, imaging features suggesting mass effects, such as MLS and intraparenchymal hematoma are least impactful. Not surprisingly, our model outperforms imaging-specific models like Marshall and Rotterdam score, developed predominantly with blunt TBI data.
A recent comparative study of blunt versus penetrating brain injuries, propensity-matched for clinical severity indicators such as GCS scores, pupillary reactivity, and fundamental imaging features like MLS, demonstrated a higher mortality rate in patients with PBI. 20 We hypothesize that this lack of congruence in mortality, despite matched clinical severity, is largely attributable to distinct imaging characteristics unique to PBI that influence clinical decision-making. Meanwhile, current prognostic models in PBI arguably face significant methodological limitations. Many of these models, such as the SPIN score (based on data collected over 13 years) 8 and the Baylor score (based on data collected over 10 years), 13 are founded on datasets spanning several years. This temporal scope overlooks changes in treatment aggressiveness and approach, which can substantially influence patient outcomes. 14 Moreover, these models often omit imaging features crucial to the structure–function relationship, frequently selecting features in an arguably arbitrary manner (e.g., general bihemispheric involvement rather than specific locations such as bihemispheric frontal or above/below the level of the third ventricle). Furthermore, the utility of prognostic models in a disease like PBI, where therapeutic guidance is limited and disease phenotyping or subclassification is underdeveloped, remains questionable. 15,17
GCS, imaging, and the need for new classifications
In October 2007, a workshop organized by the NINDS in collaboration with the Brain Injury Association of America, the Defense and Veterans Brain Injury Center, and the National Institute of Disability and Rehabilitation Research, aimed to outline the necessary measures for creating a dependable, effective, and scientifically sound classification system for TBI. This system was envisioned to associate distinct patterns of brain and neurovascular injuries with tailored therapeutic strategies. 21 In PBI, where systematic classification efforts are notably lacking, the predominant metric for assessing initial severity remains the GCS. However, the limitations of the GCS in accurately reflecting consciousness levels, a pivotal indicator of injury severity, are increasingly recognized. 19,22 Moreover, the GCS is symptom based and biased by factors like sedation, intoxication, and hypothermia, and it does not allow for targeting of specific pathology. 23 It is important to emphasize the ∼30% of patients with a GCS of 3–4 and a UChicago CT Imaging Score of <25 that survived. This represents a patient population that could potentially benefit from continuing aggressive medical and surgical interventions despite of what it is a traditionally dismal GCS.
Imaging is routine practice in patients with TBI, enabling a pathoanatomic classification of the condition. Recent work by the collaborative European neurotrauma effectiveness research for TBI collaborators identified imaging as the first building block of their approach to reclassification of TBI. 24 –26 This classification describes the location or anatomical features of abnormalities, potentially facilitating targeted treatments. For blunt TBI, Marshall score 9 and the Rotterdam score 27 are two examples of HCT classification models. Meanwhile, despite underscoring the significance of features such as bullet trajectory, bihemispheric involvement, and cisternal effacement in prognostication, 21 PBI lacks a comparable emphasis on imaging-driven classification. Consequently, efforts to establish a structured and imaging-based classification system like those in blunt TBI are urgently needed, not to guide early prognosis but more so to potentially guide therapeutic intervention in the early stages of disease. Ultimately, an approach that integrates key imaging characteristics with demographic, clinical severity, secondary insult, and blood-based biomarker data is imperative. In blunt TBI, these initiatives have shown promising results in enhancing diagnostic accuracy and prognostic reliability, potentially paving the way for advances in clinical practice. 25
Introduction of the UChicago PBI imaging score and next steps
The UChicago PBI Imaging score, which quantifies radiographical features from HCT scans and integrates a weighted GCS, holds significant potential beyond traditional prognostic use. Unlike conventional models that predominantly focus on prognosis, our approach offers a multidimensional framework for patient classification, particularly in ranges where GCS does not clearly dictate outcome. This framework aims to guide targeted therapeutic interventions based on specific radiographical findings, acknowledging scenarios where clinical presentation diverges from imaging assessments. By emphasizing the impact of detailed radiographical characterization, such as identifying the most impactful features, our model may help optimize future trials or treatment strategies tailored to individual patient profiles. In PBI, leveraging our imaging-based model could be one step in standardizing clinical decision-making through providing early insights into injury severity and guiding proactive therapeutic interventions. This proactive approach becomes particularly crucial in cases where there is discordance between clinical symptoms and imaging findings, offering clinicians a more nuanced understanding to adjust treatment plans accordingly. Integrating key imaging features with other clinical and biomarker data holds promise in enhancing diagnostic precision and refining prognostic reliability, ultimately advancing the management of PBI in clinical practice. Furthermore, our model facilitates the development of a standardized assessment and dictation approach for PBI among radiologists, aligning with broader radiology practices.
The UChicago PBI Imaging score can serve as valuable benchmark for clinical trials. By providing a standardized imaging/structural metric, it enables consistent comparison across different studies and interventions, which can lead to more robust and reliable conclusions. For example, early decompressive craniectomy associated with more favorable outcomes in patients with PBI 28 may be evaluated in light of the UChicago PBI imaging score.
While our current model offers intuitive insights by highlighting clinically relevant radiographical features in PBI, the distinct pathophysiology of gunshot wounds introduces complexities that merit further exploration. Internally, bullets cause crushing or laceration injuries, leaving behind permanent tissue cavitation along their trajectory. The extent of this cavitation depends on factors such as bullet caliber, velocity, and deformation, which also influence the creation of a temporary cavity surrounding the primary injury site. 29 High-energy projectiles, for instance, can produce temporary cavities significantly larger than the permanent cavity, exacerbating tissue damage and complicating prognostic assessments based solely on initial imaging findings. 29
To address these challenges and advance the field, future research directions could leverage deep learning techniques to identify novel imaging biomarkers on head CT scans that are not currently integrated into our model. This approach becomes particularly critical given the limitations of magnetic resonance imaging in assessing gunshot wounds. By expanding our model to incorporate these advanced imaging biomarkers, we could enhance diagnostic accuracy and refine prognostic predictions, thereby optimizing therapeutic strategies tailored to individual patient needs.
Moreover, future developments should focus on integrating our imaging-based model into the generation of common data elements for PBI. This initiative would establish standardized criteria for data collection and analysis across clinical settings, facilitating collaborative research efforts and ensuring consistency in evaluating treatment outcomes. Additionally, incorporating clinical data and blood-based biomarkers alongside imaging features holds promise in differentiating more comprehensive patient phenotypes. These refined phenotypes could better differentiate varying responses to treatment and guide personalized therapeutic interventions based on individualized risk profiles and injury characteristics. Ultimately, these advancements aim to not only improve immediate clinical decision-making but also to pave the way for enhanced long-term outcomes in patients with penetrating brain injuries.
Limitations
The reliance on CT scans (UChicago PBI Imaging score) will not fully capture the dynamic nature of tissue damage caused by high-velocity projectiles, which can create extensive but unpredictable tissue cavitation. Moreover, the variability in clinical presentation and the limited availability of standardized imaging data elements for PBI underscore the need for further research to establish comprehensive and universally applicable diagnostic and prognostic frameworks. The data are retrospective in nature and from a single institution. The former is a fact that introduces bias inherent to retrospective analyses. Any PBI model must contend with the inherent variability in therapeutic approaches across different clinical settings, which can significantly impact patient outcomes. For instance, at least part of the low number of surgical decompressions performed in our patient cohort could represent an inherently therapeutic nihilism which could have impacted the results. The lack of strict guidance and standardized treatment protocols underscores the challenge of biasing imaging-based or any other model while highlighting the need for integrated, multidimensional approaches to enhance clinical decision-making. Lastly, the UChicago PBI Imaging score has unique features to a penetrating mechanism of injury, which do not apply to blunt injury limiting its applicability in such patients.
Conclusion
Imaging plays a pivotal role in advancing the understanding and management of PBI, offering crucial insights into the complex pathoanatomic features that influence patient outcomes. As highlighted by our study, refining the classification of PBI through detailed radiographical characterization is essential. Future efforts should focus on integrating advanced imaging techniques, such as deep learning-driven biomarkers, into clinical practice to enhance diagnostic accuracy and prognostic reliability. This approach promises to improve PBI disease classification subsequently allowing for tailoring personalized treatments based on nuanced phenotypic profiles, ultimately optimizing outcomes for patients with penetrating brain injuries.
Transparency, Rigor, and Reproducibility Summary
Our study involved data from our Level 1 trauma center to introduce the UChicago PBI Imaging score, a novel characterization of imaging features using HCT in PBI. This study was not formally registered because it is not a clinical trial. For the same reasons, the analysis plan was not preregistered, but the team member with primary responsibility of the analysis certified the analysis was prespecified. In our study, a p value of <0.05 was considered statistically significant. A consort diagram was provided. All data were acquired from our institution between the years 2018 and 2023. Specific equipment and software used to perform the analysis are publicly available. The key inclusion criteria and clinical outcomes were assessed by investigators with professional qualifications. No replication studies have been performed or are ongoing to our knowledge. Upon publication, this article will be available in the Journal of Neurotrauma.
Footnotes
Authors’ Contributions
A.M.: Conceptualization, data curation, formal analysis, methodology, and writing original draft. E.B.: Formal analysis and methodology; R.A.-D.: Conceptualization, methodology, and writing original draft; O.P.: Conceptualization and writing original draft; H.T.N.N.: Conceptualization and writing original draft; F.F.: Conceptualization and writing original draft; E.L.: Conceptualization and writing original draft; J.W.: writing of original draft; M.D.G.: Writing of original draft; M.L.: Writing original draft; J.N.: Writing original draft; H.D.: Writing original draft; W.R.: Conceptualization and writing original draft; J.F.: Conceptualization; P.H.: Conceptualization and writing original draft; P.D.: Conceptualization and writing original draft; A.S.: Conceptualization and writing original draft; T.F.: Conceptualization and writing original draft; E.C.: Conceptualization and writing original draft; S.R.: Conceptualization and writing original draft; C.L.: Conceptualization and writing original draft; M.G.: Conceptualization and writing original draft; and F.D.G.: Conceptualization and writing original draft.
Data availability
Code to reproduce the data used will be made available through a request directed to the corresponding author.
Author Disclosure Statement
The authors certify that they have no affiliations with or involvement in any organization or entity with a direct financial interest in the subject matter or materials discussed in the article (e.g., employment, consultancies, stock ownership, honoraria, and expert testimony).
Funding Information
A.M. was supported by the Department of Defense, CDMRP Log Number: TP210257, for Artificial Intelligence-Aided Head Computed Tomography Analysis to Predict Outcome in Civilian Firearm-Inflicted Brain Injury. C.L. was supported by the Department of Defense, CDMRP Log Number: TP210464, Grants.gov ID Number: GRANT13518109, for Prediction and Prevention of Intracranial Hypertension.
Supplementary Material
Supplementary Table S1
Supplementary Table S2
Supplementary Table S3
References
Supplementary Material
Please find the following supplemental material available below.
For Open Access articles published under a Creative Commons License, all supplemental material carries the same license as the article it is associated with.
For non-Open Access articles published, all supplemental material carries a non-exclusive license, and permission requests for re-use of supplemental material or any part of supplemental material shall be sent directly to the copyright owner as specified in the copyright notice associated with the article.
