
Abstract
The use of RNA interference for the manipulation of gene expression has seen great applications from basic science to clinical investigations. However, limited selectivity and the induction of off-target effects by double stranded RNA molecules have been analyzed and discussed since the discovery of this gene expression regulation mechanism. In this study, the specificity of 13 commercially available control siRNA molecules is addressed by the analysis of gene expression profiles in 2 human cell lines HT1080 and HaCaT and in the mouse cell line 3T3-L1. The off-target signatures of the transfected siRNA molecules differ greatly between the cell lines and only a small overlap was seen for the 2 human cell lines. In particular, the HT1080 cell line showed the highest number of detected gene expression differences. In these cells, several different control siRNA molecules activated a common profile of 79 deregulated genes including a reduced interleukin-1β (IL-1β) and IL-24 expression. Functional analysis of MMP1 secretion and tumor necrosis factor-α (TNF-α) induced IL-8 release revealed a reduction of NFκB signaling caused by at least 2 out of the 13 tested control siRNA molecules. Our findings strongly argue for a careful analysis of the control siRNA molecules for any given RNAi experiment.
Introduction
T
The problem of the sequence dependent off-target effects is explained by either the binding of the passenger strand of the siRNA molecule to the inverted complementary sequence of an off-target transcript or by the low stringency binding of imperfect matches between the guide strand and the off-target transcript. Both events lead to an undesired transcript degradation after incorporation of the respective siRNA derived single stranded RNA into AGO proteins. During the design process of siRNA molecules the Smith–Waterman-alignment of the siRNA sequences to the target species transcriptome can exclude matches to sequences other than the intended target transcript. However it is important to know that mainly the central positions of the guide strand of a siRNA molecule incorporated into AGO1 contributes to the recognition of the target sequence. The contribution of the nucleotides at the 5′- or 3′-end positions, which renders bioinformatic predictions difficult to interpret, can be neglected (Du et al., 2005; Dahlgren et al., 2008). Furthermore, the complementarity of as few as 7 nucleotides of a siRNA or microRNA can already determine the knock down of relevant transcripts (Lin et al., 2005; Jackson et al., 2006b), which leaves only the retrospective analysis of empirically identified off-targets for an explanation of unintended side effects (Birmingham et al., 2006).
The double stranded RNA related off-target effects can be summarized as an innate immune system reaction of the cell recognizing the presence of pathogen-associated molecular patterns (PAMPS) by host pattern recognition receptors (Meylan et al., 2006). The recognition is accomplished by cytoplasmatic, double stranded RNA binding proteins like PKR (Sledz and Williams, 2004), leading to the silencing of translation or by RIG-1 and MDA-5 (Pippig et al., 2009), which further leads to the activation of interferon regulator factor (IRF) or NFκB signaling. An additional group of membrane bound receptors also recognize siRNA molecules either as double stranded RNA like TLR3 or by the presence of a ribose-backbone in close proximity to multiple uridine residues like TLR7 (Diebold et al., 2006) or, more specifically, via GU-rich motifs like TLR7 and TLR8 (Hornung et al., 2005; Judge and Maclachlan, 2008). It is important to keep in mind that the expression of these TLR molecules is mainly restricted to cells of hematopoietic origin like dentritic cells, macrophages, or lymphocytes. The recognition of PAMPS via these Toll-like receptors again activates the NFκB and interferon signaling cascades (Robbins et al., 2009) and the markers of this activation have been described (Sledz et al., 2003). Several strategies have been developed to overcome these off-target effects (Judge and Maclachlan, 2008) by modifying the ribose backbone of the siRNA molecules. The chemical modifications avoid nuclease degradation, the incorporation of the passenger strand into RISC as well as the binding and activation of the PAMPS receptors. The strategies of chemical modifications include 2′-O-methyl modification of single (Jackson et al., 2006a) or multiple sequences positions (Czauderna et al., 2003), 2′-F-modifications (Cekaite et al., 2007), or even nonribose backbones like locked nucleic acids (Puri et al., 2008) or arabinose (Dowler et al., 2006) moieties.
Despite all these improvements, the use of silent siRNA control molecules is still essential and mandatory for the understanding and normalization of specific siRNA effects. Frequently used control siRNA molecules are targeting genes that are not expressed in the respective model system like the green fluorescent protein; however these molecules are also not free of off-target effects (Tschuch et al., 2008). Other strategies used scrambled sequences, which do not show any matches to known transcripts. The great advantage of this approach is that the molecules can generically be used in any experiment that is especially advantageous for large scale RNAi screens. In order to understand the selectivity of commercially available, nontargeting siRNA controls, we performed a gene expression analysis of different cell types following liposomal transfection of control siRNA molecules. With this approach, we were not only able to identify molecule specific off-target effects for the fibroblast cell line HT1080, but also identified gene regulation differences, which could be seen in other cell types like HaCaT (keratinocytes) or 3T3-L1 cell cultures (fibroblasts of mouse origin). On the other hand, we could describe effects, which were reproduced by other control siRNA molecules arguing for a principle RNAi off-target effect in HT1080. However, these effects were surprising since the off-targets did not increase but rather inhibit the innate immune system as shown by functional assays. Our findings strongly argue for a thorough analysis and careful choice of the control siRNA molecules for any given RNAi experiment.
Materials and Methods
siRNAs
siRNAs were purchased from Ambion, Dharmacon, or Qiagen and prepared according to manufacturer’s instructions. The siRNAs used in the study are listed in Table 1.
L
Cell culture and siRNA transfection
3T3-L1, HT1080, and HaCaT cells were maintained in DMEM (3T3-L1, HaCaT) or RPMI (HT1080) supplemented with 10% (3T3-L1, HT1080) or 5% FCS (HaCaT), respectively. All cell lines were exponentially grown at 37°C in a 5% CO2 atmosphere. For transfection experiments cells were seeded in a 6-well plate and grown overnight to a confluence of 50%–70%. All siRNAs were transfected at a final medium concentration of 20 nM. Cells were either transfected using Lipofectamine RNAiMAX (Invitrogen, Carlsbad, CA) for 3T3-L1, HT1080 or DharmaFECT1 reagent (Dharmacon) for HaCaT cells. The medium was replaced by fresh growth medium, 24 hours post-transfection. Each siRNA was transfected in 5 independent experiments for all cell lines.
RNA extraction
For the isolation of RNA, cells were washed with PBS 48 hours after transfection and lyzed using RLT buffer supplemented with 1% of β-Mercaptoethanol. RNA isolation was carried out using the RNeasy Mini Kit (Qiagen) as described by the manufacturer. In brief, genomic DNA was sheared by centrifugation of the lyzate through Qiashredder™ spin columns (10,000g, 2 minutes). The RNA was precipitated by the addition of an equal amount of 70% ethanol. The precipitate was transferred to RNeasy spin columns (Qiagen), washed with 70% ethanol, DNase treated and eluted in 80 μL DEPC-treated water. Total RNA concentration was quantified by absorbance (260 nm) measurement using an Inifinite M200 reader (Tecan). The RNA quality was characterized by the quotient of the 28S to 18S ribosomal RNA electropherogram peak using an Agilent 2100 bioanalyzer and the RNA Nano Chip (Agilent).
cRNA synthesis and hybridization of Illumina Bead Arrays
Illumina TotalPrep RNA Amplification Kit (Ambion) was used to transcribe 350 ng of the isolated total RNA. Briefly, total RNA was first converted into single-stranded cDNA with reverse transcriptase using an oligo-dT primer containing the T7 RNA polymerase promoter site and then copied to produce double-stranded cDNA molecules. An overnight (14 hours) in vitro transcription was performed using a T7 polymerase to generate single-stranded RNA molecules (cRNA). cRNA molecules were labeled by the incorporation of biotin-UTP. A total of 700 ng of cRNA was hybridized at 58°C for 16 hours to the Illumina HumanRefseq-8 v2 Expression BeadChip (HaCaT, HT1080) or the MouseRef-8 v1.1, (3T3-L1), respectively. After hybridization, the arrays were washed, blocked, and the labeled cRNA was detected by staining with streptavidin-Cy3. BeadChips were scanned using an Illumina Bead Array Reader and the Bead Scan Software (Illumina).
Data processing
Microarray data obtained from the Illumina Bead Array platform was analyzed using the R/Bioconductor package lumi (Du et al., 2008). Intensity data was log2 transformed and normalized using loess normalization.
Differential expression was analyzed for siRNA treated samples versus untreated samples. For evaluating differential expression, we applied linear models implemented in the R-package limma (Smyth, 2004) to determine P values and log ratios. Resulting P values were FDR-corrected according to Benjamini-Hochberg (Hochberg and Benjamini, 1990; Benjamini et al., 2001). The differentially expressed transcripts of all siRNAs in HT1080 cells were clustered using Spotfire® DescisionSite® 9.1.1. Hierarchical clustering was performed using complete linkage and correlation as similarity measure.
ELISA analysis of MMP1 and IL-8
Protein expression levels of IL-8 and MMP1 were determined using the human IL-8 ELISA kit (BD OptEIA™ Human IL-8 Set) and the MMP1 kit (Calbiochem® MMP1 ELISA QIA55), according to the manufacturer’s protocol.
Results
Expression analysis of cell cultures treated with control siRNA molecules
Control siRNA molecules are used in general for the normalization of specific siRNA effects. In the most optimal situation, the use of these molecules should not introduce any gene regulation or phenotype. The specificity of 13 control siRNA molecules from different vendors was compared by use of microarray expression profiling in the 2 human cell lines HaCaT (keratinocyte phenotype) and HT1080 (fibroblast phenotype) as well as in the mouse fibroblast line 3T3-L1. As a prerequisite for this experiment, the efficiencies of the transfection protocols were confirmed by using GAPDH-specific siRNAs and subsequent mRNA knock down analysis. In each cell line we obtained GAPDH knock down efficacies of more than 90% compared to untransfected cells as analyzed by qRT-PCR 48 hours post siRNA transfection (data not shown).
Next, we transfected the control siRNA molecules using the optimized conditions in 5 independent experiments. After 48 hours, the transcriptional changes introduced by these molecules were identified performing Illumina BeadChip based expression profiling. The profile of each treatment was compared with the respective untreated cell cultures. The differences in gene expression of HT1080 cultures are visualized as volcano plots in Figure 1. For further analysis and discussion, genes that revealed an expression difference of a factor of 1.5 or higher with a FDR-corrected P value of ≤0.01 were regarded as significantly regulated.

Off-target effects of 13 siRNAs in HT1080 cells identified by microarray analysis. log2 Ratios (plotted on x-axes) and P values (plotted on y-axes as negative log10 P value) of control siRNA transfected versus untreated cells are shown. All genes with a fold change ≥1.5 and a P value ≤0.01 were considered as off-target effects of the siRNA. Results represent 5 independent experiments. The P values were FDR-corrected according to Benjamini-Hochberg.
As a quantitative specificity criteria for the control siRNA molecules, we summarized the deregulated genes of each siRNA for all three cell lines (Table 2). Considering the number of differentially expressed genes, the siRNA D6 (RISC-free) shows the highest specificity among the 13 tested molecules with only 4 genes being significantly deregulated. Also, only few differences were found for the treatment with the siRNAs D1 (Nontargeting Pool), D3 and D4. Here, less than 20 genes were altered compared to untransfected cells. However, the control siRNAs A2, D5, and Q5 showed only moderate specificity with more than 20 differentially expressed genes. The lowest specificity exerted the siRNAs A1, Q2, Q4, Q1, and Q3 with the latter 2 showing several hundreds of differentially expressed genes compared to the controls. A summary of all genes that were significantly (P value < 0.01) deregulated with a fold change larger than 1.5 within the 3 cell lines is listed in Table 2 and Supplementary Table 1 (Supplementary materials are available online at http://www.liebertpub.com/).
N
Unspecific gene regulations induced by siRNA molecules can often be explained by partial sequence homologies with the respective mRNA off-targets. An important observation in this regard was that several of the gene regulations were recapitulated with other control siRNAs. Detailed analysis of the 2 human cell lines (HT1080 and HaCaT) identified 26 genes that are commonly deregulated by Q1 and also 26 by Q2, 21 by Q3, 10 by Q4, 4 and 1 by A1 and Q5 (Supplementary Table 2). However only a small intersection is observed with the murine cell line 3T3-L1. Here, only the siRNA Q1 downregulated 3 genes (SPSB1, TOB1, and PPP1CC) in all 3 cell lines.
Subsequently, we focused our analyses on the effects of the control siRNAs in HT1080 cells. Hierarchical clustering of all 595 identified genes altered after treatment with any of the control molecules clearly illustrate different degrees of similarity among the used control molecules (Fig. 2). All Dharmacon siRNAs have similar effects on gene expression and are all arranged in one subcluster structure. The closest similarity of gene regulation is observed for the nontargeting Pool D1 and the siRNA D2. Treatment with one of the other control siRNAs resulted in more heterogeneous expression patterns. However, the control siRNA molecules A1 and Q1 are grouped in one subcluster due to their overlapping, multiple, and strong effects on gene expression. A detailed analysis on commonly deregulated genes revealed that 79 genes are differentially expressed (FC >1.5, P value < 0.01) after the treatment with 2 or more siRNAs. Interestingly, we also identified a group of genes that were commonly influenced by up to 7 control siRNA molecules (Table 3).
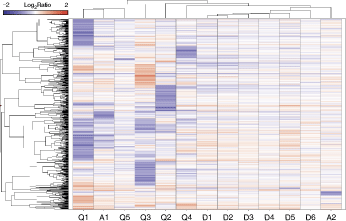
Hierarchical clustering was performed based on all off-targets identified after expression profiling in HT1080 cells. The expression patterns of the different control siRNAs reveal several intersections in gene regulation. Blue indicates decreased expression relative to untreated cells, red indicates increased expression.
L
Control siRNAs influence different levels of basal cytokine expression and MMP1 levels
The gene expression analysis clearly indicated that the mRNA levels of several well-characterized genes are altered after the transfection of the control siRNAs. Especially siRNAs A1, Q1 but also A2, Q2, Q3, Q4, and Q5 showed significant deregulations of cytokines like IL-1β or IL-24. We wanted to further understand whether the observed expression differences correlate with differences in the respective signaling pathways. Therefore, we used the well-known influence of IL-1β on the gene expression of MMP1 as a marker for the status of the IL-1β signaling pathway (Vincenti and Brinckerhoff, 2002). MMP1 levels in supernatants of control siRNA transfected cells were analyzed by ELISA and a strong MMP1 downregulation was observed after A1 (3.7-fold) and Q1 (2.5-fold) transfection. Less significant effects on MMP1 levels were measured for the siRNAs A2, Q2, Q3, and Q5. Again, the moderate effects on MMP1 release correlates with IL-1β and IL-24 expression (Fig. 3).
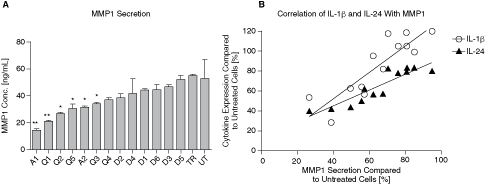
Control siRNA-dependent MMP1 protein secretion. HT1080 cells were transfected with 13 different control siRNA molecules (A1–D5). (
Control siRNAs influence TNF-α signaling
Next, we addressed whether the lack of specificity of the control siRNAs does not only reduce the basal cytokine expression levels or MMP1 secretion but also interferes with major cell signaling pathways. Since IL-1β and IL-24 both lead to NFκB activation (Borden and Heller, 1997; Klatt et al., 2006), cells were stimulated with tumor necrosis factor-α (TNF-α) for activation of the IKK/NFκB signaling cascade. IL-8, a known target gene of NFκB, showed a strong response upon TNF-α stimulation (Fig. 4). Again ELISA analysis of supernatants, derived from TNF-α treated HT1080 cultures, demonstrated a reduced sensitivity of IL-8 release in the presence of the control siRNA molecules A1 and Q1 (Fig. 4).
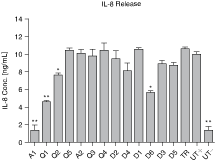
Control siRNA-dependent interleukin-8 (IL-8)release. HT1080 cells were transfected with 13 different control siRNA molecules (A1–D5). 72 hours after transfection cells were stimulated with 30 ng/mL tumor necrosis factor-α (TNF-α) for 8 hours. IL-8 release was determined by ELISA of the cell supernatants. IL-8 levels were 7.3-fold decreased after A1 and 2.2-fold decreased after Q1 treatment compared to untreated, stimulated cells. The results are representative of 2 independent experiments performed in triplicates. ∗∗P < 0.0001, ∗P < 0.01 compared to untreated cells (student t-test). All error bars indicate the standard deviation. Abbreviations: TR, transfection reagent; UT+, untreated cells with TNF-α stimulation; UT−, untreated cells without TNF-α stimulation.
Discussion
The results of scientific studies and especially biological experiments are influenced by the researchers bias, biological variations, and the assay protocol. Therefore, the use of scientific controls is a vital part of scientific methods. One can distinguish positive and negative controls, where positive controls describe the expected outcome of an experiment and negative controls can be treated as background to which the sample results can be normalized.
The aim of this work was to shed light on how different negative control siRNA molecules can influence RNAi experiments. Dependent on the used cell line we observed a wide range of differentially expressed genes after the transfection with different siRNA molecules. Overall, almost 3 times more genes were altered in HT1080 compared to 3T3-L1 cells indicating that the latter are less sensitive to the treatment with siRNAs. The transfection of siRNA Q1 resulted in a small overlap of 3 genes that are differentially expressed in all tested cell lines, arguing for a potential sequence homology of this siRNA to the respective off-target transcripts. Due to commercial reasons, the sequences of the control siRNA molecules cannot be provided but the alignment of the siRNA sequence Q1 with the respective off-targets showed a low stringency match to nearly all the identified transcripts (data not shown).
A larger overlap was found within the 2 human cell lines HT1080 and HaCaT. Here, the control siRNAs Q1, Q2, Q3, and Q4 share a common cell line independent off-target signature, suggesting that these genes are altered due to sequence similarities to the siRNA sequence. However no perfect or seed matches to the control siRNA sequences of Q1–Q4 were identified. Subsequently, we further analyzed the specific off-targets observed in HT1080 cells. Since most of these off-targets do not fall into the classical group of siRNA induced interferon response genes (Sledz et al., 2003), we anticipate that these regulations are sequence specific for the respective siRNA molecule (Birmingham et al., 2006; Anderson et al., 2008). However, among the 595 identified off-targets, 79 genes were altered by the treatment with more than 1 single siRNA. The hierarchical clustering revealed similar expression patterns for all Dharmacon siRNAs, indicating that some off-target effects are sequence independent and we speculate that these are related to chemical modification strategies of a specific manufacturer.
The cluster analysis also demonstrated strong correlation between the cells treated with the molecules A1 and Q1. In these experiments, expression of the 2 cytokines IL-1β and IL-24 is significantly altered compared to the untreated control samples. The low expression of both cytokines argued already for a reduced response of the siRNA treated cells toward an inflammation signaling through NFκB (Aggarwal et al., 2004). This hypothesis was further strengthened by the reduced level of MMP1 expression in the supernatants of these cultures (Klatt et al., 2006), which correlates with the reduced expression of both cytokines. However, not only the basal NFκB signaling cascade, but also the stimulated pathway, as shown by the activation of IL-8 secretion in HT1080 cells after TNF-α treatment, argues for a reduction of siRNA A1 and Q1 treated cells toward the inflammatory signaling.
Furthermore, the unwanted side effects are the opposite of what is described as an inflammation stimulation effect via the double stranded RNA recognition system. The specificity in terms of number of identified off-targets did not correlate with the observed reduction of TNF-α sensitivity but was probably dependent on specific sequence motifs or chemical modifications. Variations in immune stimulation activity have already been described for a GFP control siRNA (Robbins et al., 2008), but the effects were restricted to the context of primary peripheral blood monocytes. From our gene chip expression study, we found only very low expression levels of the toll-like-receptors 3, 7, and 8 in the HT1080 fibroblast cell line (data not shown). However the intracellular, cytoplasmatic double stranded RNA binding domain (DRBD) proteins like RIG-1, PKR, and MDA-5 were constitutively expressed with strong detection signals (data not shown). It remains questionable whether the control siRNA induced resistance of the NFκB pathway implicates binding to DRBD-proteins, since the interaction with these cytoplasmatic components would activate rather than silence this signaling cascade. The underlying mechanism for this observation remains obscure and will need a detailed understanding of the binding and signaling mechanisms of DRBD-proteins in general.
Our findings have some major implications on the design of target identification and validation experiments with siRNA molecules. The reduced inflammatory response described is clearly cell type specific, since only the HT1080 cell line did show the IL-1β/IL-24 effects. However, the data exemplifies that during the establishment of an assay protocol, the phenotypic analysis of the control siRNA treatment is essential. This is especially important since the identified off-target regulations are cell type specific and not a common feature of the molecules but related to the cellular background of the experiment. Although we think it is not mandatory to perform expression analysis upfront of each siRNA experiment, the impact of the control molecule on the assay system must be carefully analyzed. Therefore, only a close comparison of untreated to control siRNA treated cell cultures will help to identify the right control molecules, which show a controlled or even show no impact on the assay system and will be appropriate for the normalization of the experimental observations.
Footnotes
Acknowledgments
We want to thank Dr. Eric Simon and Dr. Karsten Quast for their great support during the bioinformatic analysis of the expression data. We gratefully acknowledge the expert technical assistance of Werner Rust and Daniela Micheler during the preparation of the Illumina bead chip hybridization, as well as Damaris Frey and Sina Roth for their help with the ELISA protocol.
References
Supplementary Material
Please find the following supplemental material available below.
For Open Access articles published under a Creative Commons License, all supplemental material carries the same license as the article it is associated with.
For non-Open Access articles published, all supplemental material carries a non-exclusive license, and permission requests for re-use of supplemental material or any part of supplemental material shall be sent directly to the copyright owner as specified in the copyright notice associated with the article.