
Abstract
Disease detection and management might benefit from external imaging of disease gene mRNAs. Previously we designed molecular imaging nanoparticles (MINs) based on peptide nucleic acids complementary to cancer gene mRNAs. The MINs included contrast agents and analogs of insulin-like growth factor 1 (IGF-1). Analysis of MIN tumor uptake data showed stronger binding in tumors than in surrounding tissues. We hypothesized that MINs with an IGF-1 analog stay in circulation by binding to IGF-binding proteins. To test that hypothesis, we fit the tissue distribution results of several MINs in xenograft-bearing mice to a physiological pharmacokinetics model. Fitting experimental tissue distribution data to model-predicted mass transfer of MINs from blood into organs and tumors converged only when the parameter for MINs bound to circulating IGF-binding proteins was set to 10%–20% of the injected MIN dose. This result suggests that previous mouse imaging trials used more MINs than necessary. This prediction can be tested by a ramp of decreasing doses.
Introduction

(
The specificity of the MINs has been demonstrated experimentally, where the MINs will distribute in the organs and tissues of the body and will remain in the tumor target while otherwise being filtered from the blood by the kidney (Tian et al., 2003, 2004, 2005a, 2005b; Wickstrom et al., 2004; Chakrabarti et al., 2007; Amirkhanov et al., 2008). The in vivo experiments record the concentration of the MINs in the organs of the mouse at a limited number of time points, because of the need to sacrifice several mice to perform each measurement. Pharmacokinetic modeling of the experimental data provides a method to extract a more complete picture of the fate of the MINs from the limited experimental data. It also provides a rational method for experimental design and optimization, as well as a promise to enable translation across species, and maybe even prediction of efficacy in humans.
We developed a pharmacokinetic model for the distribution of the MINs in the mouse and applied it to the analysis of experimental data sets. To our knowledge there is no physiologically based pharmacokinetic model for peptide–oligonucleotide chimeras in the literature. A physiologically based model has been developed for oligonucleotide pharmacokinetics in rats (Peng et al., 2001). We translated the rat model to a mouse model to describe the pharmacokinetic behavior of our MINs.
Different variants of the imaging nanoparticle have been synthesized to target specific genes, while keeping the insulin-like growth factor (IGF-1) peptide analog as the pathway to enter the cells of the tumor. The different variants whose pharmacokinetic behavior will be investigated here (Tian et al., 2003, 2004, 2005a, 2005b) are shown in Table 1, along with the targeted gene. For clarity, we refer to each dataset according to the target oncogene and year of publication (i.e., CCND1’04, MYCC’05, MYCC’03, KRAS’05) (Table 1).
IGF-1, insulin-like growth factor 1.
The data analyzed herein were obtained by injecting 0.2 ml of a saline solution containing radioactive imaging nanoparticles into immunocompromised mice bearing a human cancer xenograft carrying the KRAS, MYCC, or CCND1 mutation being targeted. At chosen times the mice were lightly anesthetized and imaged to determine accumulation of radioactivity. Following imaging, the mice were euthanized and tissues were dissected. The tissue distribution of radioactivity was originally reported as an average percentage of the injected dose per gram of tissue for five mice at each time point (Tian et al., 2003, 2004, 2005a, 2005b).
The peptide analog portion of the MINs, used to facilitate endocytosis, is based on IGF-1, which plays an active role in many illnesses and cancers (JUUL, 2003). Free IGF-1 is found in the bloodstream, as well as IGF-1 bound to a variety of insulin-like growth factor-binding proteins (IGFBPs) (Delafontaine et al., 2004), which act as transporters and storage pools (Bastian et al., 1997, 1999; Paye and Forsten-Williams, 2006; Forsten-Williams et al., 2007). Free IGF-1 not bound to IGFBPs is reported to have a short half-life in blood, ∼10 minutes, similar to insulin (Sara and Hall, 1990; Gillespie et al., 1996; Mizuno et al., 2001; JUUL, 2003). Bound IGF-1 can enter an organ's interstitial space, where upon binding proteins release IGF-1, which then enters the tissue (Boroujerdi et al., 1994, 1997). Preliminary work done on MIN tissue distribution in mice has shown that the MINs interact with the IGFBPs, showing behavior similar to that of IGF-1. On the basis of our experience to date (Tian et al., 2007; Opitz, 2008), we anticipate that only 10%–20% of the injected dose is available for distribution. The blood level of IGFBP-3 has been reported to be 45 nmol/l in humans (Baxter and Martin, 1986). We assume that a similar concentration occurs in mice, because the concentration of IGF-1 is similar in humans and mice (Crispens, 1975a; Faria et al., 1989). Despite the existence of numerous studies of oligonucleotide tissue distribution and plasma clearance, there are very few studies attempting to describe the tissue behavior quantitatively. The most relevant, physiologically based pharmacokinetic model for this study is a permeability rate-limited model for a phosphorothioate oligonucleotide targeting an initiation codon domain in the herpes simplex virus, administered to rats (Peng et al., 2001), which was shown to capture the tissue distribution of the oligonucleotide over 72 hours.
Methods
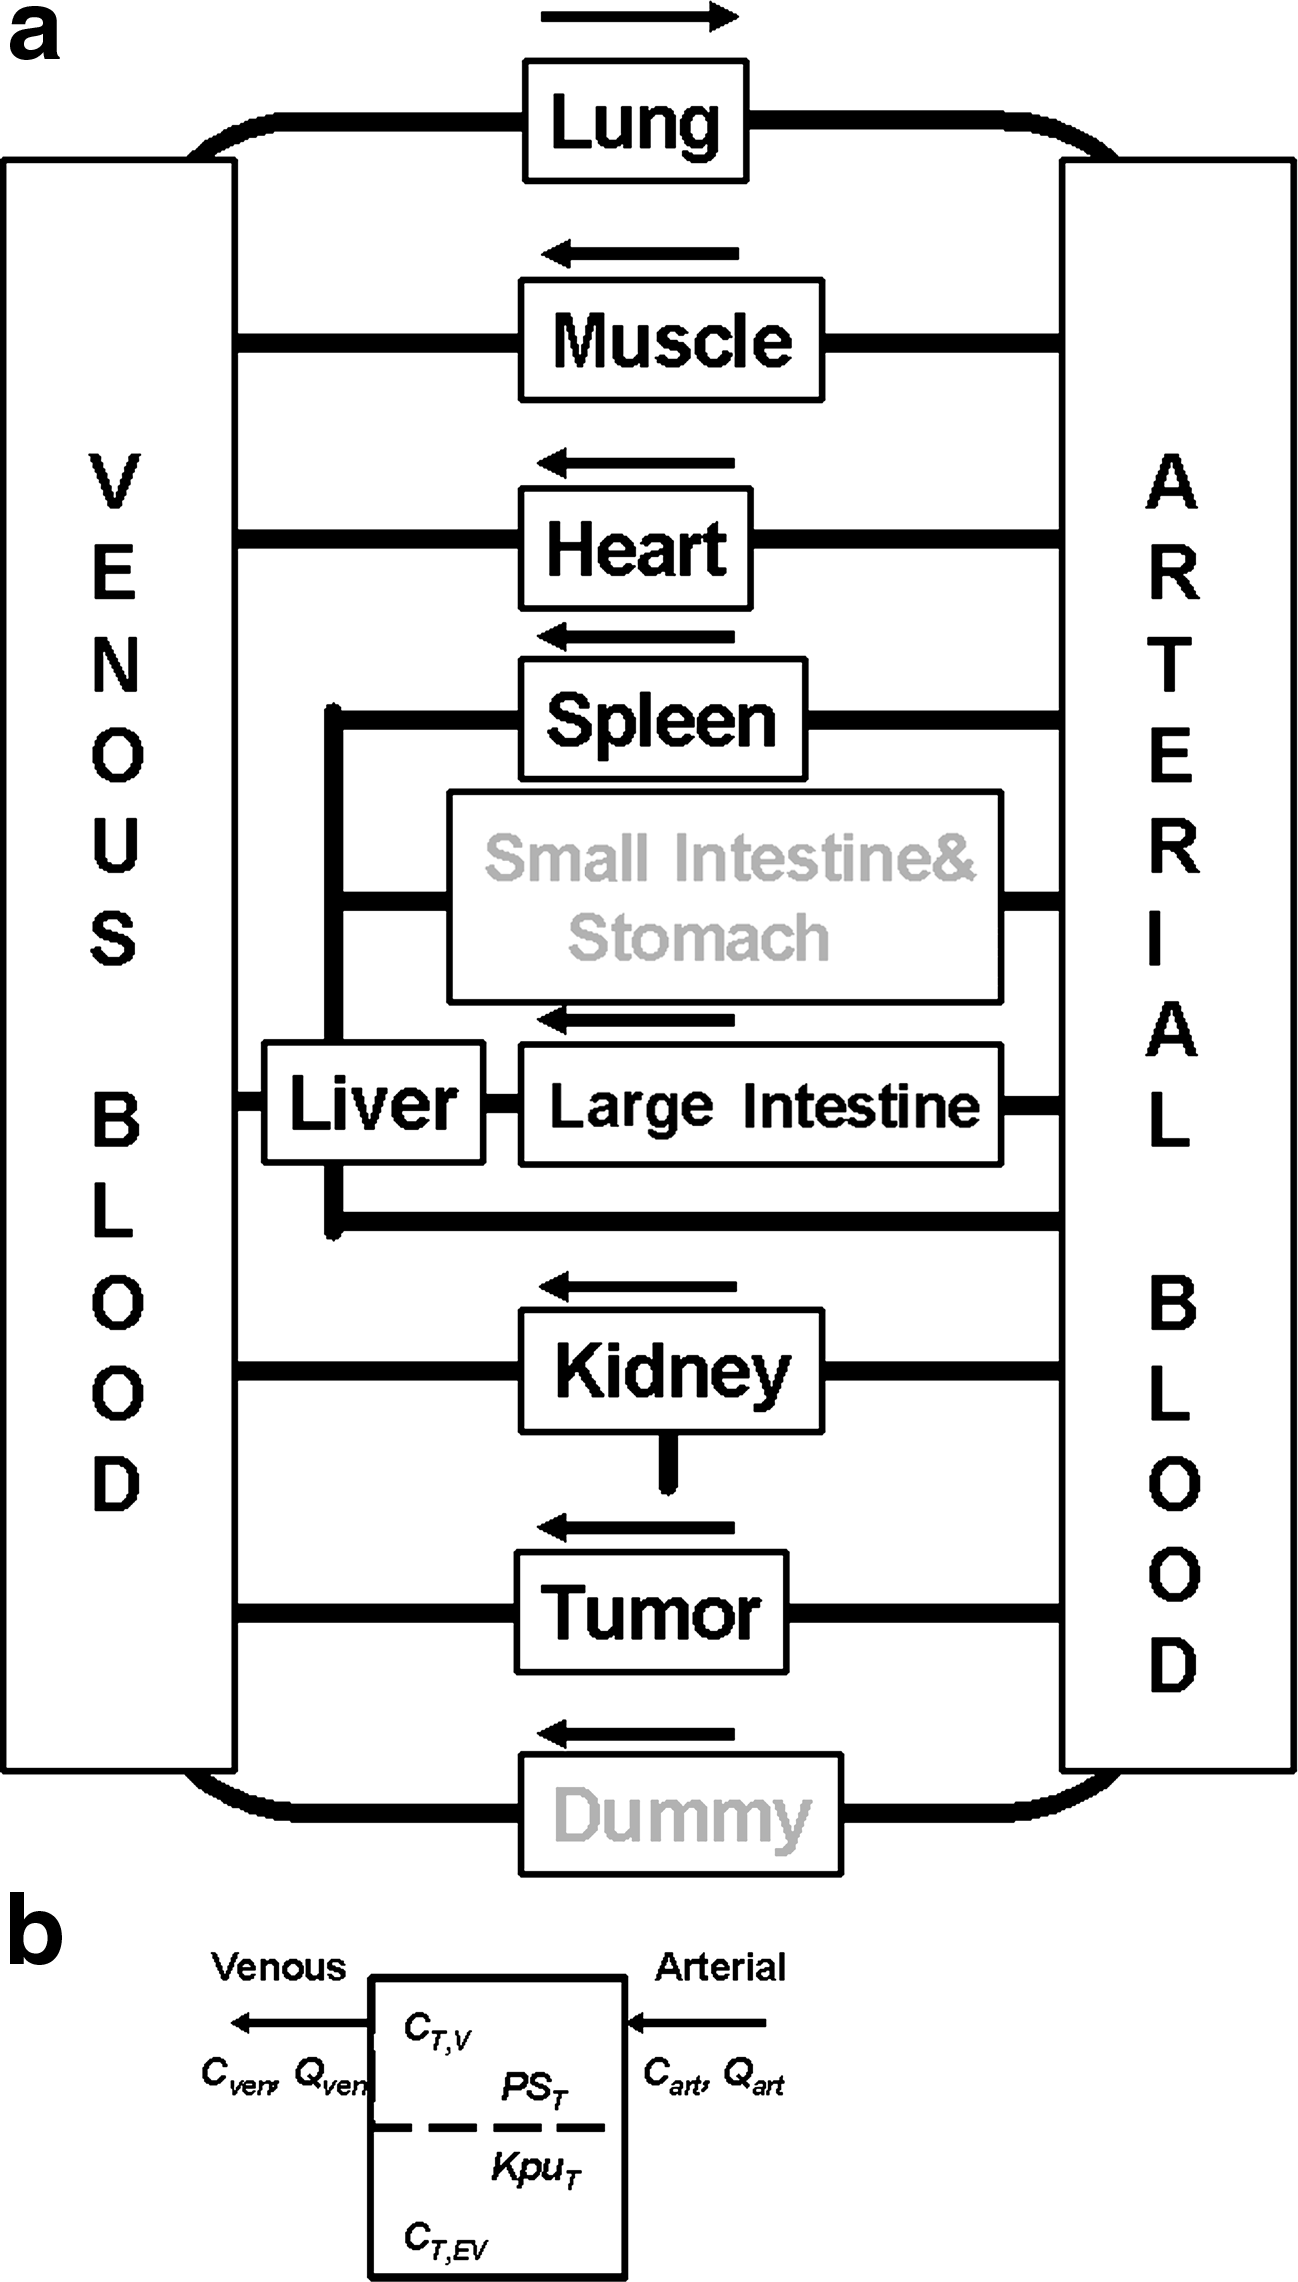
The blood compartment in the Peng model is split into venous and arterial blood compartments, while all organs are described by a vascular compartment that is attached to an extravascular compartment.
We adapted the Peng model to fit MIN tissue distribution data. The intestine was split into large and small intestine compartments. However, only the large intestine was measured in the tissue distribution studies. A tumor compartment was added. Further, the adipose tissue, skin, bone, brain, testes, and thymus were lumped together into one compartment to account for MINs that accumulated in tissues not measured in the experiment. The flow chart used for this work is shown in Figure 2.
(
Equations 1–4 describe MIN concentration in the different compartments. The variables are C, concentration of the compound (μg/g); V, volume (ml); Q, flow rate (ml/hour); PS, permeability surface area product (ml/hour); Kpu, extravascular tissue/unbound plasma partition coefficient; Kp, equilibrium tissue/plasma partition coefficient (Kp = f × Kpu); f, scaling factor from Peng et al. (2001); CLuki, renal clearance (ml/hour); T,V, vascular part of a given tissue; T,EV, extravascular part of a given tissue. The parameters KpuT and PST refer to the respective parameter for a given tissue, e.g. Kpustomach, PSstomach Kpukidney, PSstomach, and similarly for all other tissues considered here. Of particular interest to this work was Kputumor and PStumor. The parameters appearing in these equations are shown in Figure 2b, where a typical organ contains a vascular compartment that is connected to the arterial and venous blood flow, and to the extravascular compartment through a permeability parameter and a partition coefficient. Each compartment is assumed to be well mixed. The Peng model was implemented in MATLAB (The MathWorks, Inc.) using the ode15s, ordinary differential equation solver.
The tissue distribution data, published as a percentage of the injected dose per gram of tissue (Tian et al., 2003, 2004, 2005a, 2005b), were converted to micrograms of MIN per gram of tissue, accounting for the varying specific activities (Table 2). The initial blood concentrations (Table 2) upon injection were calculated from the injected doses, assuming the total mass of blood to be 1.68 g (7% of body mass).
The compound-specific parameters (Peng et al., 2001) were adjusted to fit the measured tissue distribution data, whereas the organ-specific parameters were changed to those of the mouse. The different organ sizes and flow rates that were used for the mouse are shown in Table 3, with the source of each value indicated. Venous blood mass was assumed to be twice the arterial blood mass (Gearhart et al., 1990; Quick and Shuler, 1999). To determine the mass of the large intestine, the typical length of the organ (ten Hove et al., 2002) was multiplied by a factor of mass per length for the large intestine in the mouse (Melgar et al., 2005). The mass of the small intestine was determined by subtracting the weight of the large intestine from the weight of the mouse gastrointestinal (GI) tract (Lindstedt and Schaeffer, 2002). The muscle mass of the mouse was taken from a graph detailing the body composition of mammals as a function of weight (Calder, 1984). The thymus and the testes were given the same fraction of total mass as used for the rat model (Peng et al., 2001).
The blood flow rate through the lung was set equal to the flow rate of the venous and arterial blood compartments, as for the rat (Peng et al., 2001). For the spleen blood flow rate, only the plasma flow rate could be found (Gerlowski and Jain, 1983), which was divided by 0.55 (plasma/blood ratio) (Baxter et al., 1994) to obtain the blood flow rate. The blood flow rates of the thymus, bone, and adipose tissue were set to be the same fraction of the total blood flow rate for the rat (Peng et al., 2001). The hepatic blood flow rate of the liver, the renal blood flow rate of the kidney, and the blood flow rate of the muscles were taken from the allometric relations (Lindstedt and Schaeffer, 2002). The blood flow rate of the muscle was adjusted to ensure that the sum of the blood flow rates satisfied an overall mass balance of the blood.
The fraction of extravascular space was taken from the rat model (Peng et al., 2001), which was adapted from earlier data (Everett et al., 1956; Ebling et al., 1994; Blakey et al., 1997). The vascular space of the tumor was estimated to be about 15% of the total weight of the tumor, based on an average of different literature values for various tumors (Hilmas and Gillette, 1974; JAIN, 1988; Kallinowski et al., 1989; Yuan et al., 1993). This is reasonable because the xenografts used in the experiments (Tian et al., 2003, 2004, 2005a, 2005b) formed aggressive cancers, but did not reach a size where necrosis was apparent. The values of KpuT, partition coefficient, and PST, tissue permeability surface area product, taken from the rat model (Peng et al., 2001), are shown in Table 4.
Bold values are results of the model fitting.
In total, the model has 32 tissue masses, 18 flow rates, 15 partition coefficients, and 1 clearance rate. All of the parameters except PST and KpuT for the tumor were determined from independent literature values or by direct incorporation of parameters determined for an oligonucleotide in rats (Peng et al., 2001). The tissue and blood measurements of the MINs were compared with the results of the 38 independent equations describing the different compartments to determine the quality of the prediction. The main input parameter that was varied is the fraction of the initial dose that is available to distribute in the mouse. Once the behavior of the organs was accurately described, the tumor data were incorporated. For the tumor, the PStumor and Kputumor values were varied until a satisfactory fit was accomplished.
Results
The physiologically based rat model for oligonucleotide pharmacokinetics (Peng et al., 2001) was adapted for MIN distribution in the mouse by introducing the physiological parameters aforementioned, while holding the permeation rates fixed. The prediction was compared against the MIN blood concentration of the CCND1’04 data. Using 10% of the injected dose as the concentration available for distribution in the body, based on our earlier analyses (Tian et al., 2007; Opitz, 2008) that the MINs bind to IGFBPs to stay in circulation, we were able to describe the CCND1’04 data by fitting to the 24-hour time point. The other variants of the MINs behave similarly; the KRAS’05 and MYCC’05 data have been captured well, as shown in Figure 3. However, the MYCC’05 dataset had a substantially lower injection dose (Table 5) and, hence, was fit by a larger bound fraction (20%), as hypothesized.

Normalized blood concentration predictions for all different imaging nanoparticle variants.
IGFBP, insulin-like growth factor binding proteins.
The predictions using 10%–20% of the actual injected dose capture the behavior of the different variants of the MINs in the blood. The predictions for MIN concentrations in the different organs are shown in Figure 4, for the CCND1’04 data. The data shown are representative of those for the other MIN variants; graphs for the other variants are shown in the Supplemental Material (available online at www.liebertonline.com) (Supplemental Figs. S1–S3, available online at www.liebertonline.com). Predictions for MIN concentrations in most of the organs are excellent, with the exception of the spleen and kidney. The discrepancy for the spleen is due to difficulty of determining the proper volume from the literature. The kidney is underpredicted, as it filters the unbound MINs from the blood. These results are consistent with the hypothesis that the imaging nanoparticles need to bind to the IGFBPs to remain in the blood.
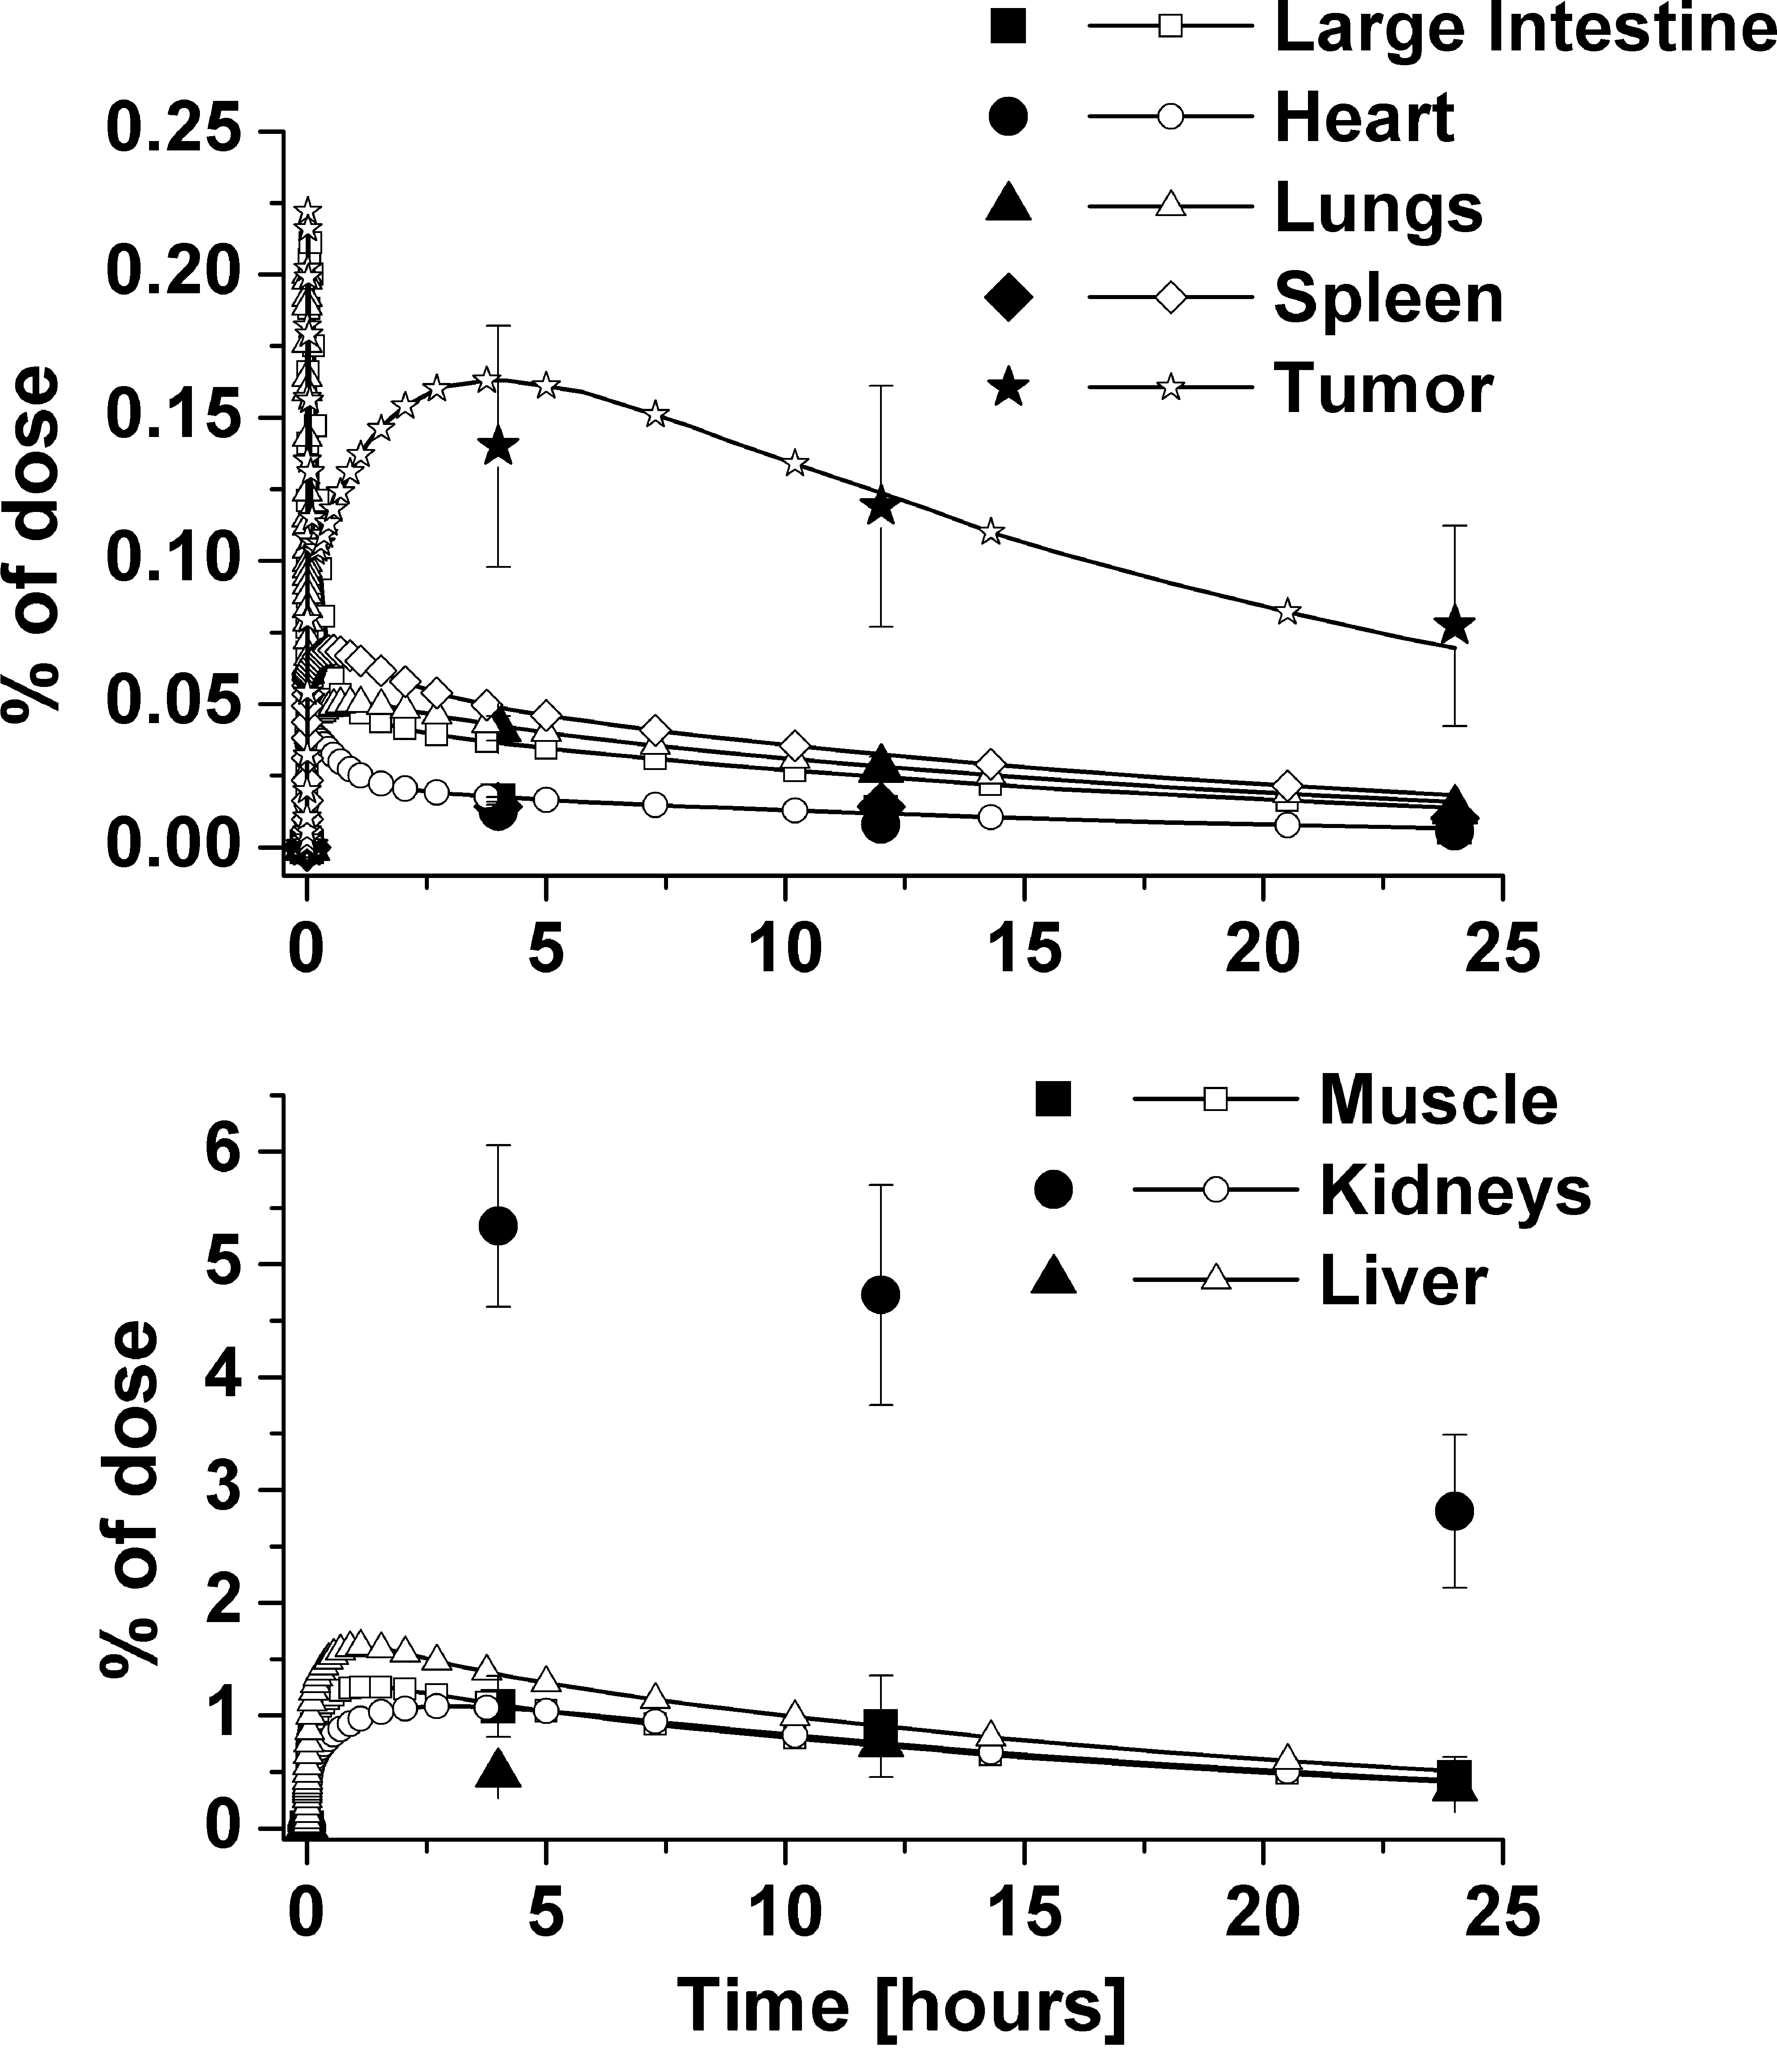
Normalized organ concentrations using CCND1’04 data, with reduced injection amount.
For the tumor, PStumor and Kputumor were fit to the experimental data. A best fit to the data was obtained with Kputumor = 20 and PStumor = 5. The predictions using these values for all the other MIN variants are shown in Figure 5. Overall, the physiologically based model can satisfactorily describe the time course behavior of the tissue, and in particular the tumor, distribution of the variants of MINs with one common set of transport and partition values. A sensitivity analysis of the fit in response to the value of the permeability surface area product, based on the work by Schmittmann and Rohr (2000), shown in the Supplemental Material, shows that the results are robust to variations in the PST values.

Normalized tumor concentration and physiological model predictions for all imaging nanoparticle variants, using reduced injection amounts. Kputumor = 20, PStumor =5 ml/hour.
One set of parameters for permeability and distribution (Table 4) can represent all four MIN variants, showing that variation in oligonucleotide sequence does not affect transport, as expected. To assess whether the parameters obtained from the best fit to the tumor concentration data are meaningful it is useful to compare them to the parameters describing other tissues. Comparing organs that have a similar value of Kpu, the distribution coefficient, such as the intestines and bone as shown in Table 4, the permeability area product is smaller for the tumor. This can be explained by a lower blood flow rate in the tumor compared to those organs. To evaluate the distribution coefficient Kpu for the tumor, it can be compared to Kpu for the muscles, as it was implanted in the muscles. The Kpu for the tumor was higher than the value for the muscles, which could indicate stronger binding in the tumor. If the MIN accumulates and binds in the tumor by the antisense modality, it would lead to a comparatively higher Kpu value. This comparison can also be made through the PST/KpuT ratio for the tumor and other organs, as shown in Table 6. Comparing the ratio for the tumor to that of the muscle, the tumor ratio is much smaller. This implies a very large distribution coefficient in relation to its permeability, which again supports the notion of the MIN binding in the tumor. We caution, however, that because the model does not explicitly account for antisense binding to the RNA, pharmacokinetic parameters derived from fitting the data are most likely compensating for this effect.
Discussion
The time course of MIN tissue distribution in mice was modeled using the kinetic and distribution parameters developed for a rat model (Peng et al., 2001), adjusted for mouse organ volumes and flow rates. To fit the blood data, the injected dose of the MINs had to be reduced by 80%–90%. This is attributed to be a consequence of the need to bind to IGFBPs to transport into the organs (Bastian et al., 1997, 1999; Paye and Forsten-Williams, 2006). The modeling suggests that the majority of the injected MINs are removed by renal clearance.
The majority of the MIN organ concentrations were predicted accurately, except for the kidney and the spleen. The overprediction of the spleen concentrations may be due to uncertainty in the estimated blood flow rate to the spleen in the mouse, as the spleen flow rate has not been reported. The concentration in the kidney was underpredicted due to the likelihood of unexcreted MINs remaining in the organ.
The parameters describing the time course of the tumor MIN concentration behaved as expected in comparison to the parameters of other organs. To determine whether the magnitude of the values obtained from fitting the tumor MIN concentration is physiologically reasonable, the values may be compared with literature values describing uptake of compounds into tumors. A pharmacokinetic model for benzoquinone anisamycin antibiotic, which is an antiproliferative agent for tumors, yielded values derived from a similar model (Xu et al., 2003). The model considered the tumor as three compartments, vascular, interstitial, and cellular space; equations 5 and 6 describe the former two compartments, which are the equivalent of equations 3 and 4 shown for the model used in this work.
Comparing the permeability term from equation 6 to equation 4, the equivalent term from equation 4 is the product of f and PStumor. Thus the value of PStumor for this work is 0.525 ml/hour, whereas the value reported for anisamycin (Xu et al., 2003) was 0.227 ml/hour. These comparisons demonstrate that our value of the permeability surface area product is physiologically reasonable.
As mentioned earlier, the specific binding behavior of the MINs in the tumor was not accounted for in the modeling. To assess whether the antisense modality plays a role in the measured distribution of the MINs, the model results can be examined for consistency. For example, a maximum concentration in the tumor can be calculated, which should not be exceeded if the MIN only binds to its mRNA target. Typical breast or pancreas cancer cells in culture contain 2000–8000 copies of CCND1, MYCC, or KRAS mRNA (Tian et al., 2005b). Taking a cell diameter of approximately 10 μm, and assuming a density of 1 g/cm3, we estimate there are 2–8 × 10¹² copies/g or 0.003–0.013 nmol/g of oncogene mRNA in the extravascular space of each tumor, for each gene targeted. The measured MIN concentrations and the total amount of MINs delivered to the tumor, as calculated from the model, are shown in Table 7. Using a molecular mass of 4.3 × 10³ g/mol, the estimated maximum binding capacity of the oncogenes expressed in the tumor is 0.014–0.054 μg/g, which is greater than both the measured MIN concentration as well as the total amount of MINs delivered during the course of the experiment (Table 7). Note that this is the amount delivered to the tumor's vascular space, not all of which is transferred into the tumor's extravascular space. Therefore, the model and this simple analysis indicate that there are ample oncogene mRNA binding copies available to accommodate the MINs delivered to the tumor.
MIN, molecular imaging nanoparticle.
Second, integrating the predicted time course up to the first experimental time point will indicate if sufficient MINs enter the tumor to account for the recorded concentration. The value of the total amount delivered into the tumor at 4 hours is indicated in Table 7, along with the amount measured experimentally in the tumor at 4 hours, the model-predicted maximum concentration at the spike, and the total possible concentration based on number of binding sites. Again, these results are consistent with the antisense binding modality of the MINs.
The tissue distribution of several variants of the MIN, an MIN with an antisense modality, was quantitatively modeled using a physiologically based pharmacokinetic model. A physiologically based oligonucleotide pharmacokinetic model in rats (Peng et al., 2001) was adapted to a mouse model to predict the tissue distribution of the MINs. This was achieved by using measured and estimated physiological parameters of the mouse with the tissue/blood distribution coefficient and the permeability constant from the rat model for an oligonucleotide probe. This resulted in a model with 64 parameters determined independent of the experimental data, and only the unknown permeability and distribution coefficient of the tumor were left as fit parameters. In fitting the model to the experimental data, it was found that only 10%–20% of the injected MINs were available for transport from the blood to the interstitial tissues. This result is consistent with the IGF-1 modality of the MINs and the known role of IGF-1-binding protein in facilitating transport. Rapid elimination of the unbound chelator–peptide nucleic acid–IGF-1 peptide analog probably occurs by first-pass kidney excretion.
This result also suggests that previous mouse imaging trials used more MINs than necessary. This prediction can be tested by a ramp of decreasing doses.
The parameters determined in this work for the tumor were shown to be consistent for all variants of the MINs investigated, as well as physiologically reasonable given other reported parameter sets for analogous probes.
This work demonstrates that a pharmacokinetic model developed for a rat model could be adapted to quantitatively model another species, which holds promise for describing the behavior of the MINs in humans. Overall, a preliminary model of MIN pharmacokinetics has been developed, which can be adapted and expanded when a more complete time course of the blood concentration and more time points of tissue concentrations are available.
Footnotes
Acknowledgments
The authors thank Professor Abraham Lenhoff for helpful discussions. This work was supported in part by DOE ER63055 and NIH contract CO27175 to E.W.
Author Disclosure Statement
Armin W. Opitz has no competing financial interests. Eric Wickstrom holds shares in GeneSeen LLC, which might ultimately benefit from the results of this investigation, but did not support the work. Mathew L. Thakur holds shares in GeneSeen LLC, which might ultimately benefit from the results of this investigation, but did not support the work. Norman J. Wagner has no competing financial interests.
References
Supplementary Material
Please find the following supplemental material available below.
For Open Access articles published under a Creative Commons License, all supplemental material carries the same license as the article it is associated with.
For non-Open Access articles published, all supplemental material carries a non-exclusive license, and permission requests for re-use of supplemental material or any part of supplemental material shall be sent directly to the copyright owner as specified in the copyright notice associated with the article.