




Abstract
Abstract
Development of molecular diagnostics that can reliably differentiate amongst different subtypes of brain tumors is an important unmet clinical need in postgenomics medicine and clinical oncology. A simple linear formula derived from gene expression values of four genes (GFAP, PTPRZ1, GPM6B, and PRELP) measured from cDNA microarrays (n = 35) have distinguished glioblastoma and meningioma cases in a previous study. We herein extend this work further and report that the above predictor formula showed its robustness when applied to Affymetrix microarray data acquired prospectively in our laboratory (n = 80) as well as publicly available data (n = 98). Importantly, GFAP and GPM6B were both retained as being significant in the predictive model upon using the Affymetrix data obtained in our laboratory, whereas the other two predictor genes were SFRP2 and SLC6A2. These results collectively indicate the importance of the expression values of GFAP and GPM6B genes sampled from the two types of microarray technologies tested. The high prediction accuracy obtained in these instances demonstrates the robustness of the predictors across microarray platforms used. This result would require further validation with a larger population of meningioma and glioblastoma cases. At any rate, this study paves the way for further application of gene signatures to more stringent biopsy discrimination challenges.
Introduction
Over the past several years, studies have demonstrated nonsignificant variation of gene expression values for a determined biological condition, across microarray experiments using various technologies (Bosotti et al., 2007; Hwang et al., 2004; Shi et al., 2006). Nonetheless, development of prediction models to discriminate between tumor types by using gene expression data from different microarray technologies does not seem to have been addressed. Such an issue appears to be crucial, prior to implementation in clinical trials of prediction models derived from microarray data (Sun et al., 2006; Wang et al., 2007).
In a previous work, we were able to distinguish glioblastoma multiforme (Gbm, n = 17) and meningothelial meningioma (Mm, n = 18) biopsies through a simple linear equation derived from the expression values of four genes (GFAP, PTPRZ1, GPM6B, and PRELP), obtained from single-labeling cDNA microarray experiments (Castells et al., 2009). We take now this proof-of-principle approach one step further to investigate the robustness of the predictor developed earlier. For this goal, we evaluated the formula by prediction of three datasets, for which the gene expression values were obtained from Affymetrix microarray experiments. The two first datasets (total n = 80) were prospectively acquired at our laboratory, whereas the last dataset corresponded to the publicly available data (n = 98).
In the present study, we evaluated whether the four genes identified previously from the cDNA microarray-based data were also selected when the predictor was generated from Affymetrix data acquired in our laboratory (total n = 80). That is, we developed a stepwise procedure on our Affymetrix dataset to select four genes that fitted an optimal predictor for Gbs and Mgs. Subsequently, we evaluated whether this predictor could discriminate Gbs and Mgs from publicly available and cDNA microarray data. In doing so, we aimed to verify whether the four genes mentioned above could be selected to discriminate glioblastomas (Gbs) and meningiomas (Mgs) when using gene expression values from another type of microarray technology.
Materials and Methods
Collection, storage and histopathology analysis of samples prospectively acquired
Collection of biopsies was carried out at different hospitals from the Barcelona metropolitan area through the European Union-funded eTUMOUR (http://www.etumour.net) and HealthAgents (http://www.healthagents.net) projects and the Spanish-funded MEDIVO2 project.
A total of 77 biopsies were collected from the Hospital Universitari de Bellvitge (L'Hospitalet de Llobregat), 2 biopsies from the Hospital Universitari Germans Trias i Pujol (Badalona), and 1 biopsy from the Hospital Sant Joan de Déu (Esplugues de Llobregat). Among the 80 biopsies included in this study, 49 were glioblastomas [Gb(s), including 1 gliosarcoma] and 31 were meningiomas [Mg(s), including 22 of meningothelial subtype, 3 of fibrous subtype, 3 of psammomatous subtype, and 3 transitional meningiomas]. The full study protocol was approved by the local Ethics Committees and informed consent was obtained from all patients.
An aliquot of tumor was snap frozen in liquid nitrogen until RNA isolation. Another aliquot was fixed in 4% buffered formalin and embedded in paraffin. For routine histological examination 4 μm-thick sections were stained with hematoxylin and eosin (HE). Both, the WHO 2000 and 2007 Nervous System Classification criteria (Kleihues and Cavenee, 2000; Louis et al., 2007) were used for diagnosis, because biopsies were collected from 2004 until 2008.
RNA isolation
Total RNA from frozen biopsies stored in liquid nitrogen was isolated following the procedure indicated by the manufacturer using the mirVana RNA isolation kit (Ambion-Applied Biosystems, Austin, TX, USA). RNA was characterized using a NanoDrop spectrophotometer (NanoDrop Technologies, Wilmington, DE, USA). Absence of protein contamination was monitored by the 260 nm/280 nm ratio of absorbance, and samples with a ratio ranging between 1.6 and 2.0 were accepted for further processing, as agreed in the consensus protocols for data acquisition in the eTUMOUR project. Integrity of the RNA was assessed by using the capillary electrophoretic system 2100 Bioanalyzer (Agilent, Santa Clara, CA, USA). Only samples producing a 28S/18S ratio equal or higher than 1.2 or an RNA integrity number (RIN) number equal or higher than 6 were used for further analysis.
Labeling and hybridization onto HG-U133 plus 2.0 Affymetrix microchips
The procedure described in this section was performed at the Affymetrix core facility of the Institut de Recerca de la Vall d'Hebron (Barcelona). Labeling was performed using the One-Cycle Target Labeling and Control Reagents kit (Affymetrix, Santa Clara, CA, USA). The starting material for the labeling protocol ranged from 0.3 to 5 μg of total RNA and the resulting labeled cRNAs were hybridized onto the HG-U133 plus 2.0 GeneChip. Fluorescence images were obtained by scanning the microchips with the software provided with the GeneChip Scanner 3000.
Publicly available data
The raw expression data of 67 glioblastomas (GDS1976) and 31 meningiomas (GSE9438) were downloaded from the Gene Expression Omnibus (GEO) repository (http://www.ncbi.nlm.nih.gov/sites/entrez?db = gds). The expression profile for glioblastomas (Gb) had been obtained from the HG-U133 A and B Affymetrix microchips. In contrast, the expression profile for meningiomas (Mgs) had been obtained from the HG-U133 plus 2.0 Affymetrix microchip.
Normalization and pattern recognition methods
Predictor from cDNA microarray data and validation on Affymetrix data
Background correction and normalization of Affymetrix data was performed using the robust multiarray average (RMA) method available in the affy package at the Bioconductor repository (www.bioconductor.org). As eTUMOUR has been a prospective project, the 80 cases used in this work were available in two batches. First, 32 Gbs and 12 Mgs (UAB1 dataset) and second, 17 Gbs and 19 Mgs (UAB2 dataset) became available. Each batch was separately normalized. Also, the two types of Affymetrix microchips from publicly available data were separately normalized using RMA. This was a must, because the number of probesets in each microchip is different. As described in our previous work (Castells et al., 2009), cDNA microarray data was normalized using the average reference loess (Edwars, 2003).
On the other hand, the gene expression values of the four discriminant genes composing the prediction formula (Eq. 1) derived from cDNA microarray data were used to compute the discriminant scores in Affymetrix datasets as described in our previous work (Castells et al., 2009).
Predictor from Affymetrix data acquired in our laboratory and validation on publicly available Affymetrix and cDNA microarray data
We normalized cDNA microarray and publicly available Affymetrix data as described in the previous subsection. In contrast, datasets UAB1 and UAB2 were normalized together using the RMA method, because both datasets were used to develop a predictor for Gbs and Mgs. The use of a dataset composed of 80 cases (UAB dataset) could provide a better estimation of the prediction accuracy in the training. The development of a predictor from datasets UAB1 and UAB2 consisted in randomly splitting the whole dataset (80 cases) in two-thirds for training and one-third for test. We maintained the frequency of each tumor type for both training and test sets and performed 200 times the random splitting. At each iteration, only training data was used to assess the statistical difference of each probeset between Gbs and Mgs. We only used those 12,145 probesets that represented genes present in the cDNA microarray (CNIO Oncochip, ArrayExpress acc. no. A-MEXP-261). We computed p-values for the probesets considered using the rank-based Wilcoxon test. These p-values were corrected to reduce the false discovery rate and we obtained the so-called q-values (Storey and Tibshinni, 2003). Among probesets with q-value lower than 0.05, the four probesets with highest absolute value of the difference of fluorescence intensity between Gbs and Mgs {abs[mean (Gbs)-mean(Mgs)]} were selected to fit a predictor based on linear discriminant analysis (LDA). We used the LDA algorithm to generate the predictors, because in a preliminary yet unpublished work of our laboratory we tested various algorithms (dLDA, k-nearest neighbor, support vector machine, and random Forest) for prediction of four types of human brain tumors (meningioma, glioblastoma, anaplastic glioma, and low grade glioma). LDA was the one that provided the highest accuracy in all pairwise comparisons. The LDA predictor was used to predict those cases left apart for test purposes.
The four genes that were most frequently selected across the 200 iterations were used to generate an LDA predictor using the whole dataset (n = 80).
Results
Validation of the predictor obtained from cDNA microarray data on Affymetrix data
We evaluated the Affymetrix probesets that correspond to the four genes described (GFAP, PTPRZ1, GPM6B, and PRELP). The GFAP, PTPRZ1, GPM6B, and PRELP genes are represented in the HG-U133 plus 2.0 microchip by 3, 1, 6, and 4 probesets, respectively. We selected the probeset for which the accession number and/or RefSeq number coincided with the one present in the annotation file of the cDNA microarray (CNIO Oncochip). We found coincidence for probeset “203540_at” of GFAP and “204223_at” of PRELP. In contrast, there was not a clear correspondence for GPM6B between the accession numbers provided by Affymetrix and the ones provided by the Oncochip's manufacturers. For this reason, we selected the probeset of GPM6B for which we could find a known protein using the accession number provided by Affymetrix. As a result, we selected the “203540_at” (GFAP), “204469_at” (PTPRZ1), “209170_s_at” (GPM6B), and “204223_at” (PRELP) probesets (see Table 1).
Biological information about the probesets representing the four genes (GFAP, PTPRZ1, GPM6B, and PRELP) selected to compute the Gbm/Mm formula is depicted. From left to right, the accession number, the Affymetrix probeset, the gene symbol, the locus link, and the unigene identifers are given. The next three columns are the Gb/Mg expression ratio for each Affymetrix dataset. Finally, the length of the mRNA sequence that each probeset represents and the length of the corresponding protein are shown. A dash indicates that the protein sequence is unknown.
From the 80 locally accrued cases and hybridized onto Affymetrix microchips, a subset composed of 44 samples (32 Gbs and 12 Mgs) was analyzed first [Fig. 1A]. As the prediction formula (Eq. 1) had been derived from cDNA microarray data (Castells et al., 2009), this first subset study was used to fine tune the prediction formula for gene expression values obtained from Affymetrix microarrays. Accordingly, the expression values of the four mentioned genes from the first batch of Affymetrix data (32 Gbs and 12 Mgs) were used to derive an optimized LDA formula. As a result, we obtained a predictor (Eq. 2) that maximized the interclass distance and minimized the intraclass distance (see Fig. 1B):
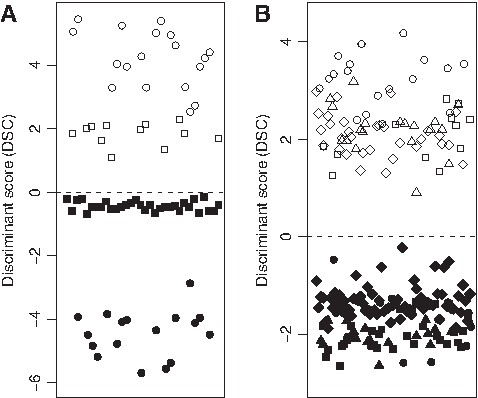
Prediction of Affymetrix-based gene profile for Gbs and Mgs. (
The cutoff point at 0 enables prediction between the two tumor types, being Gb and Mg for negative and positive values, respectively. This formula was derived from the whole dataset UAB1. To provide an estimation of the prediction accuracy of the formula, we performed a leave-one-out crossvalidation (Dupuy and Simon, 2007). An apparent 100% of prediction accuracy for a new sample was estimated from dataset UAB1.
Furthermore, to obtain the discriminant score (DSC) for a new sample, the GFAP, PTPRZ1, GPM6B, and PRELP values must be standardized using the mean (
Standardization was performed for each probeset by combining the mean, the variance, and the fluorescence value of each probeset normalized (
Such a computation increased the interclass distance and reduced the intraclass distance of both the initial UAB1 and the second UAB2 dataset composed of 17 Gbs and 19 Mgs (see Fig. 1B). Furthermore, the adjusted formula fully predicted the class of the Pubmed dataset composed of 67 Gbs and 31 Mgs, whose gene expression profile was publicly available at the GEO data repository (see Fig. 1B). As a remark, the gene expression profile of the 31 Mgs from the GEO repository (GSE9438) was obtained using the HG-U133 plus 2.0 Affymetrix microchip. In contrast, the gene profiles of the 67 Gbs in dataset GDS1976 were obtained using the HG-U133 A and B Affymetrix microchips. At any rate, a 100% of correct prediction was obtained for all samples tested.
Development of a predictor based on Affymetrix data acquired in our laboratory and validation on publicly available Affymetrix and cDNA microarray data
The development of a predictor from the UAB dataset (n = 80) was based in an iterative process. Cases were split 200 times into a group of training (two-thirds of cases) and a group of test (one-third of cases). Statistical difference between Gbs and Mgs was only computed in training samples. At each iteration, we computed the difference between the average of fluorescence intensity between Gbs and Mgs for each probeset. As the discrimination capacity would arise either from a positive or a negative difference, we computed the absolute value of such differences {abs[mean(Gbs)-mean(Mgs)]}. To fit the LDA predictor, we selected the four probesets that displayed the highest absolute difference and a q-value lower than 0.05. We estimated the prediction accuracy as the average obtained from the test samples across the 200 iterations. We obtained 99.8% prediction accuracy, 99.75% sensitivity, 99.84% specificity, and an interval of prediction from 90–100%. Across the 200 iterations, only seven different probesets were selected to fit the LDA predictors. Interestingly, the third and fourth most selected probesets corresponded to GFAP and GPM6B (see Supplementary Table 1). Moreover, the first and second most selected probesets corresponded to the same gene: SFRP2. We selected to compute a final LDA predictor the four most selected probesets that corresponded to a unique gene: SFRP2, GFAP, GPM6B, and SLC6A2. That is, we only used for the LDA predictor the most selected probeset of SFRP2 across training. We were forced to do this selection because we wanted to use this formula for cDNA microarray data. As in cDNA microarray data there is only a unique sequence represented for each gene, selection of more than one probeset from the same gene was meaningless to fit the predictor. As a result, we generated an LDA predictor (Eq. 3) using the expression values of the four probesets mentioned above (see Table 2) and those cases from dataset UAB1:
Biological information about the probesets representing the four genes (SFRP2, GFAP, GPM6B, and SLC6A2) selected to compute the Gb/Mg formula is depicted. From left to right, the accession number, the Affymetrix probeset, the gene symbol, the locus link, and the unigene identifers are given. The next three columns are the Gb/Mg expression ratio for each Affymetrix dataset. Finally, the length of the mRNA sequence that each probeset represents and the length of the corresponding protein are shown. A dash indicates that the protein sequence is unknown.
As described in the previous subsection, the cutoff point at 0 enables prediction between the two tumor types, being Gb and Mg for negative and positive values, respectively.
As it can be seen in Figure 2A, a full discrimination between Gbs and Mgs was obtained for datasets UAB1, UAB2, and publicly available data. However, some Gbs from publicly available data appeared close to the cutoff point (DSC = 0). For this reason, we generated a new LDA predictor with the same probesets but using expression values of those cases from dataset UAB2.
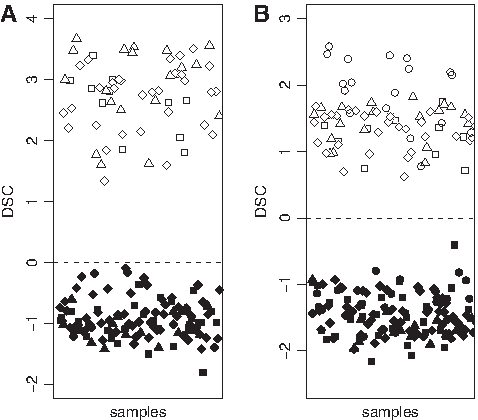
Predictor for Gbs and Mgs based on Affymetrix data. (
This new LDA predictor (Eq. 4) produced a higher separation between Gbs and Mgs than the one from Equration 3 (see Fig. 2B):
To obtain the discriminant score (DSC) for a new sample, the SFRP2, GFAP, GPM6B, and SLC6A2 values must be standardized using the mean (
Standardization was performed for each probeset by combining the mean, the variance and the fluorescence value of each probeset normalized (
To provide an estimation of the prediction accuracy of the formula, we performed a leave-one-out crossvalidation (Dupuy and Simon, 2007). An apparent 100% of prediction accuracy for a new sample was estimated from dataset UAB2.
Discussion
Reproducibility of gene expression values from microarray data for a given biological condition across technologies or platforms is a crucial consideration prior to evaluating putative predictors of cancer subtypes in a clinical investigation (Sun and Yang, 2006; Wang and Chao, 2007). Previous work has demonstrated the ability of gene signatures based on microarray data to delineate molecular types of human brain tumors (Lee et al., 2008; Nutt et al., 2003; Phillips et al., 2006). However, none of them has proposed a mathematical formula and tested it across different microarray platforms.
We demonstrate in this work that a prediction formula derived from single-labeling cDNA microarray (CNIO Oncochip) data is valid after minor tuning (see Eq. 2) to predict diagnosis of cases, for which the gene expression profile is obtained from two types of Affymetrix microchips. To verify the robustness of the four selected genes from cDNA microarray data, we evaluated whether these genes were also selected from Affymetrix data to predict Gbs and Mgs. For this purpose, we performed a stepwise procedure on the Affymetrix dataset UAB (n = 80). This was based on splitting samples in two-thirds for training and one-third for test. We performed 200 iterations and selected in each iteration the four probe sets with highest absolute value of the difference between Gb and Mg cases from the training set {abs[mean(Gbs)-mean(Mgs)]}. As it can be seen in Supplementary Table 1 and in Table 2, SFRP2, GFAP, GPM6B, and SLC6A2 were the most selected genes for classification.
This result corroborates the robustness of the genes selected from cDNA microarray data. That is, GFAP and GPM6B were selected when Affymetrix data was used to develop the predictor for Gbs and Mgs. Naturally, it may be hypothesized that complete robustness would have been corroborated if the same four genes had been selected. In our opinion, this would have been unrealistic. We expected that GFAP was selected, because it is only expressed in glial cells. In fact, the same probe set of GFAP that we chose when validating the formula obtained from cDNA microarrays was selected. In contrast, two different probesets of GPM6B (“209167_at” and “209170_s_at”) were selected across the 200 iterations (see Supplementary Table 1) and the most selected one (“209167_at”) was not the same as the one we selected for the cDNA microarray formula (“209170_s_at”). Taking all this evidence into account, our interpretation is that half of genes that were selected to fit a predictor using cDNA microarray data have also been selected when using Affymetrix data. This may suggest that either the two other genes (PTPRZ1 and PRELP) are not so relevant for prediction or there is a difference in the specificity and/or sensitivity between HG-U133 plus 2.0 Affymetrix microchip and the CNIO Oncochip. Considering that the manufacture of these two types of microarrays is very different and that there is a large amount of genes represented in gene expression microarrays, both possibilities are plausible.
To our knowledge, this is the first time that a prediction formula is proposed to predict the diagnosis of two human brain tumors through an objective method, which is based on gene expression microarray values of two sets of genes: GFAP, PTPRZ1, GPM6B, and PRELP; and SFRP2, GFAP, GPM6B, and SLC6A2. Furthermore, these two sets of genes can predict Gbs and Mgs, from which the gene expression profile has been obtained from three different types of microarray (CNIO Oncochip, HG-U133 plus 2.0 and HG-U133 A-B). A 100% of prediction accuracy can be obtained using both sets of genes (Eqs. 2 and 4, and Figs. 1B and 2B) when tested in an independent dataset. Nonetheless, it may be more realistic to state that the expected accuracy in a possible future prospective study should be some value within the interval obtained in the training process of the predictor. That is, 90–100% when the predictor is developed from Affymetrix data (see the Results section), and 70–100% when the predictor is developed from cDNA microarray data, as described in our previous work (Castells et al., 2009). Those confidence intervals are due to the still limited number of cases investigated. Accordingly, our work provides proof-of-principle to allow future implementation in the clinical routine of objective methods to identify cancer types based on gene signatures derived from microarray data. This issue has been addressed during the preceding years using microarray and other types of data (Khan et al., 2008; Tate et al., 2006; Tonini and Pistoia, 2006; Yang et al., 2009), but it remains a matter still in discussion (Sotiriou and Piccart, 2007).
Furthermore, an interesting feature of our predictors relies on the discriminative capacity of the two sets of genes selected. Both sets of genes show a high fold change across all datasets tested. In the case of cDNA microarray data, the biological meaning of the four genes selected is more coherent than when selecting genes from Affymetrix data. As expected, GFAP is the main contributor to the capacity of discrimination of Equation 2 (see Table 1), because it is specifically expressed in glial cells (Baba et al., 1997; Eng et al., 2000]. Although not specifically expressed in Gbs, PTPRZ1 shows a high expression in Gbs compared to Mgs (see Table 1). In addition, suppression of the activity of the PTPRZ1 protein with antibodies has been proposed as a therapy for Gbs (Muller et al., 2004). Similarly, the high expression of GPM6B and PRELP in Gb and Mg, respectively, can be detected along all datasets (see Table 1). Interestingly, the PRELP gene is a member of the family of the small leucine rich proteoglycans (SLRPs). Other members of SLRPs (FMOD, OMD, BGN, and OGN) were found overexpressed in Mgs when using cDNA microarray data (Castells et al., 2009). This allows identifying the apparent involvement of this gene family in the biology of Mgs, as described in our previous work (Castells et al., 2009).
Moreover, GFAP was the second gene most frequently selected when using Affymetrix data to develop the predictor for Gbs and Mgs. The gene that encodes the secreted frizzled-related protein 2 (SFRP2) was the most selected across training. In our opinion, this suggests that the specificity of the GFAP probesets represented in Affymetrix microchips may be lower compared to the full cDNA sequence of GFAP, which is spotted onto the CNIO Oncochip. Interestingly, GPM6B was the third most selected gene in Affymetrix data. This was the same position in which was ranked when using cDNA microarray data. This indicates that the expression level of this gene is stable across these two types of microarray technologies and corroborates its involvement in the biology of glioblastomas. The solute carrier family member 6A2 (SLC6A2) encodes a transporter of noradrenaline.
In Supplementary Table 1, we describe all probesets that were selected across the 200 iterations when developing the predictor using Affymetrix data. That is, we annotated at each iteration the 100 probesets with the highest absolute value of the difference of fluorescence intensity between Gbs and Mgs {abs[mean(Gbs)-mean(Mgs)]} and all probesets selected are described in Supplementary Table 1. Interestingly, PTPRZ1 displayed on average the 16th highest absolute value of the difference of fluorescence intensity between Gbs and Mgs. This would confirm the high expression value of this gene in glioblastoma, although not high enough to be ranked among the four genes with highest difference. In contrast, PRELP was not selected, but osteoglycin (OGN), another member of the SLRPs family, was selected. This may confirm the apparent relevance of SLRPs members in the biology of meningiomas that we detected in cDNA microarray data.
Taken together, our study paves the way for further application of gene signatures obtained with different microarray platforms to automate more stringent human brain tumor discrimination challenges.
Conclusions
Our study provides support for the idea that objective prediction of certain types of human brain tumors using gene signatures obtained from three types of microarrays is feasible. This result would require further validation with a larger population of meningioma and glioblastoma cases. At any rate, our findings pave the way for further application of gene signatures obtained with different microarray platforms to predict more stringent human brain tumor discrimination challenges.
Footnotes
Acknowledgments
We thank Dr. Montserrat Robles, Dr. Juan Miguel García-Gómez, and Alfredo Tomás Navarro-Muñoz for their help in the development of the optimized cDNA data-based formula to predict tumor cases, whose gene profile was obtained from Affymetrix experiments. We thank Dr. Jaume Capellades from the Hospital Universitari Germans Trias i Pujol (Badalona) and Dr. Antoni Capdevila from the Hospital Sant Joan de Déu (Esplugues de Llobregat) for their collaboration with collection of biopsies. We also thank Dr. Fátima Núñez, Dr. Ricardo Gonzalo, and Dr. Francisca Gallego from the Affymetrix core facility of the UCTS Servei de Genòmica de l'Institut de Recerca de la Vall d'Hebron. This work was funded by the EU-funded grants eTUMOUR (FP6-2002-LIFESCIHEALTH 503094), Health Agents (IST-2004-27214) and the Spanish grant MEDIVO2 (SAF 2005-03650). CIBER-BNN is an initiative of “Instituto de Salud Carlos III” (ISCIII, Spain).
Author Disclosure Statement
The authors declare that no conflicting financial interests exist.
References
Supplementary Material
Please find the following supplemental material available below.
For Open Access articles published under a Creative Commons License, all supplemental material carries the same license as the article it is associated with.
For non-Open Access articles published, all supplemental material carries a non-exclusive license, and permission requests for re-use of supplemental material or any part of supplemental material shall be sent directly to the copyright owner as specified in the copyright notice associated with the article.
