




Abstract
Abstract
Chemogenomics, the study of genomic responses to chemical compounds, has the potential to elucidate the basis of cellular resistance to those chemicals. This knowledge can be applied to improve the performance of strains of industrial interest. In this study, a collection of approximately 5,000 haploid single deletion mutants of Saccharomyces cerevisiae in which each nonessential yeast gene was individually deleted, was screened for strains with increased susceptibility toward stress induced by high-glucose concentration (30% w/v), one of the main stresses occurring during industrial alcoholic fermentation processes aiming the production of alcoholic beverages or bio-ethanol. Forty-four determinants of resistance to high-glucose stress were identified. The most significant Gene Ontology (GO) terms enriched in this dataset are vacuolar organization, late endosome to vacuole transport, and regulation of transcription. Clustering the identified resistance determinants by their known physical and genetic interactions further highlighted the importance of nutrient metabolism control in this context. A concentration of 30% (w/v) of glucose was found to perturb vacuolar function, by reducing cell ability to maintain the physiological acidification of the vacuolar lumen. This stress also affects the active rate of proton efflux through the plasma membrane. Based on results of published studies, the present work revealed shared determinants of yeast resistance to high-glucose and ethanol stresses, including genes involved in vacuolar function, cell wall biogenesis (ANP1), and in the transcriptional control of nutrient metabolism (GCN4 and GCR1), with possible impact on the design of more robust strains to be used in industrial alcoholic fermentation processes.
Introduction
Genome-wide screening of the EUROSCARF collection of S. cerevisiae BY4741-derived haploid single-deletion mutants, in which each nonessential yeast gene was individually deleted (often referred to as “disruptome”) has been successfully used as a chemogenomics tool to gain insights into the mechanisms of resistance to stress induced by a wide variety of chemical compounds, including those known to inhibit industrial alcoholic fermentation (Fujita et al., 2006; Hillenmeyer et al., 2008; Kubota et al., 2004; Teixeira et al., 2009; van Voorst et al., 2006; Yoshikawa et al., 2009). In the present work we screened the yeast disruptome for mutant strains with altered susceptibility toward 30% (w/v) glucose. Results were analyzed using computational tools for the clustering of genome-wide data. These include the Babelomics tools set (http://babelomics.bioinfo.cipf.es/) (Al-Shahrour et al., 2008), which allows, among many other things, the hierarchical grouping of genes based on shared Gene Ontology (GO) terms. Osprey tool, provided by the BioGrid database (http://www.thebiogrid.org/) (Stark et al., 2006) was also used to create and analyze the map of physical and genetic interactions occurring within the obtained dataset, as an alternative grouping method. Finally, the Yeastract information system (www.yeastract.com) (Monteiro et al., 2008; Teixeira et al., 2006) was used to identify a network of transcription factors and target genes that play a role in high-glucose stress resistance. This chemogenomics approach led to the identification of 44 determinants of yeast resistance to stress induced by high-glucose stress, most of them encoding proteins involved in vacuolar organization and biogenesis, regulation of transcription, and late endosome to vacuole transport. The deleterious effect of high-glucose stress in the maintenance of vacuolar pH and extracellular acidification ability was examined. Because yeast strains that are simultaneously resistant to the several stresses imposed during alcoholic fermentations are highly desired, genes that were found to confer resistance to high-glucose and ethanol stress were also identified, based on the intersection of our dataset to those obtained in previous genome-wide studies on ethanol stress resistance (Teixeira et al., 2009; van Voorst et al., 2006).
Materials and Methods
Strains
The parental strain Saccharomyces cerevisiae BY4741 (MATa, his3Δ1, leu2Δ0, met15Δ0, ura3Δ0) and the Euroscarf collection of derived haploid mutant strains, with all nonessential open reading frames individually deleted (http://web.uni-frankfurt.de/fb15/mikro/euroscarf/), were used for the chemogenomics analysis carried out in this study.
Genome-wide screening for deletion mutants with differential susceptibility to 30% (w/v) glucose
To screen the Euroscarf single-deletion mutant collection for sensitivity to 30% (w/v) glucose, the different strains were prepared as described elsewhere (Teixeira et al., 2009). Using a 96-pin replica platter, these cells were spotted onto the surface of MM4 agarized medium containing 2% (w/v) (Control) or 30% (w/v) glucose. MM4 liquid medium contains, per liter: 1.7 g yeast nitrogen base without amino acids or NH4+ (Difco Laboratories, Detroit, MI, USA), 20 g glucose, 2.65 g (NH4)2SO4, 20 mg methionine, 20 mg histidine, 60 mg leucine, 20 mg uracil, 40 mg tryptophan, and 30 mg lysine, all from Sigma (Spain). Susceptibility phenotypes were registered after incubation at 30°C during 3 days. At least two independent replicates were obtained for each set of mutants and results were confirmed by low-throughput spot assays. The eventual over- or underrepresentation of GO terms associated to our data set, compared to the yeast genome, was determined using FatiGO (http://babelomics.bioinfo.cipf.es/EntryPoint?loadForm=fatigo). Enrichment was considered for p-values below 0.01. The p-values were calculated using a Fisher's exact test and corrected for multiple testing by the Family Wise Error Rate (FWER) method. The interaction network predicted to be established among the determinants of yeast resistance to ethanol were obtained using OSPREY software, applied to the BIOGRID database (http://www.thebiogrid.org/), which takes into account physical or genetic associations between yeast proteins or genes, respectively.
Vacuolar pH assessment
Vacuolar pH values (pHv) were assessed by fluorescence microscopy using the pH-sensing fluorescent probe 5-(and 6-)carboxy-2,7-dichlorofluorescein diacetate, succinimidyl-ester (5(6)-CDCFDA,SE), and the labeling method described elsewhere (Teixeira et al., 2009). After fluorescent labeling, cells were centrifuged at 5,500 × g during 5 min (at 4°C), washed twice with CF buffer, and finally resuspended in 2 mL of the same buffer. Cells were immediately examined with a Zeiss Axioplan microscope equipped with epifluorescence interference filters (Zeiss BP450-490 and Zeiss LP520). Fluorescent emission was collected with a cooled CCD camera (Cool SNAPFX, Roper Scientific Photometrics, Germany). The images were analyzed using MetaMorph 3.5. In each experiment at least 500 individual cells were examined and the value of fluorescence intensity emitted by each cell was obtained pixel by pixel in the region of interest to estimate pHv. The average pHv values presented, expressed in terms of fluorescence intensity, are the means of, at least, three independent experiments.
High-glucose susceptibility assays
The susceptibility of the parental strain BY4741 and derived deletion mutants to toxic concentrations of glucose was assessed by comparing their growth curves in MM4 medium, containing 30% (w/v) compared with 2% (w/v) glucose. Cell suspensions used to prepare the inocula for growth curves were grown in MM4 medium until midexponential phase (OD600nm = 0.4 ± 0.05). Cell growth in liquid media was conducted in Erlenmeyer flasks, at 30°C, 250 rpm, and was followed by measuring culture OD600nm during batch cultivation.
Assessment of extracellular acidification promoted by yeast cells
To compare the in vivo active export of protons from energized BY4741 cells in the presence of 30% (w/v) glucose, compared to control conditions–2% (w/v) glucose—the changes occurring in external medium pH were registered during 10-min incubations. Cells were grown to midexponential phase (OD600nm 0.5 ± 0.05) in MM4 liquid medium and incubated for 1 h in fresh medium containing 2 or 30% (w/v) glucose. Each population was then harvested and washed twice with distilled water, and incubated in sorbitol (20 g/L) for 30 min to promote deenergization and deactivation of the plasma membrane H+-ATPase. These cells were then washed with water and resuspended in distilled water to obtain a dense cell suspension (OD600nm 20.0 ± 2.0). Acidification experiments were carried out in water-jacketed 10-mL cells, at 30°C. The pH of each cell suspension was ajusted to 5.0 and 1 mL of glucose solution (pH 5.0) was added to obtain final concentrations of 2% or 30% (w/v). The variation of the extracellular medium pH was followed by potentiometry using a pH microelectrode (Metrohm 6.0204.000) attached to a pH meter (Metrohm 605) for 10 min.
Results
Identification of genes conferring tolerance to 30% (w/v) glucose
The pursued chemogenomics approach allowed the identification of 44 genes as determinants of yeast resistance to 30% (w/v) glucose (Table 1). In liquid medium, sudden exposure to 30% (w/v) glucose leads to an extended period of lag-phase preceding growth resumption, when compared to growth in 2% glucose (w/v) (Fig. 1). Upon overcoming the initial period of adaptation, the presence of excess glucose ends up contributing to allow the population growing with 30% glucose to reach a higher final biomass. In solid medium, the inhibitory effect caused by 30% (w/v) glucose is relatively low, which possibly justifies the small number of identified determinants of yeast resistance to this stress, when compared to those identified for other stresses using a similar chemogenomics approaches (Ando et al., 2006; Fujita et al., 2006; Hillenmeyer et al., 2008; Kubota et al., 2004; van Voorst et al., 2006; Teixeira et al., 2009). However, it proved impossible to increase glucose concentrations in solid medium to achieve higher growth inhibition, because it would prevent medium jellification. Although this fact may reduce the number of detectable susceptibility phenotypes, it narrowed down our search to the 44 genes that are mostly required for high-glucose stress resistance. These determinants of tolerance to high-glucose concentration were first clustered according to their associated GO terms, using the FatiGO software (http://babelomics.bioinfo.cipf.es/EntryPoint?loadForm = fatigo). The most significant (p < 0.01) GO terms, enriched in this dataset relative to the yeast genome, include vacuolar organization and biogenesis, regulation of transcription, and late endosome to vacuole transport (Fig. 2). BioGrid-associated Osprey computational tool (http://www.thebiogrid.org/), which allows the clustering of yeast proteins according to the existence of physical or genetic interactions between them, was further used to identify groups of interacting genes/proteins within our dataset. The group of determinants of high-glucose stress resistance found to exhibit a higher number of interacting partners (Fig. 3), highlights the control of nutrient metabolism as an additional biological function responsible for yeast tolerance to 30% (w/v) glucose. Smaller groups of interacting proteins are also observed in Figure 3, including V-ATPase subunits (Vma1 and Vma4) and proteins involved in vacuolar protein sorting (Pep5 and Vps16).
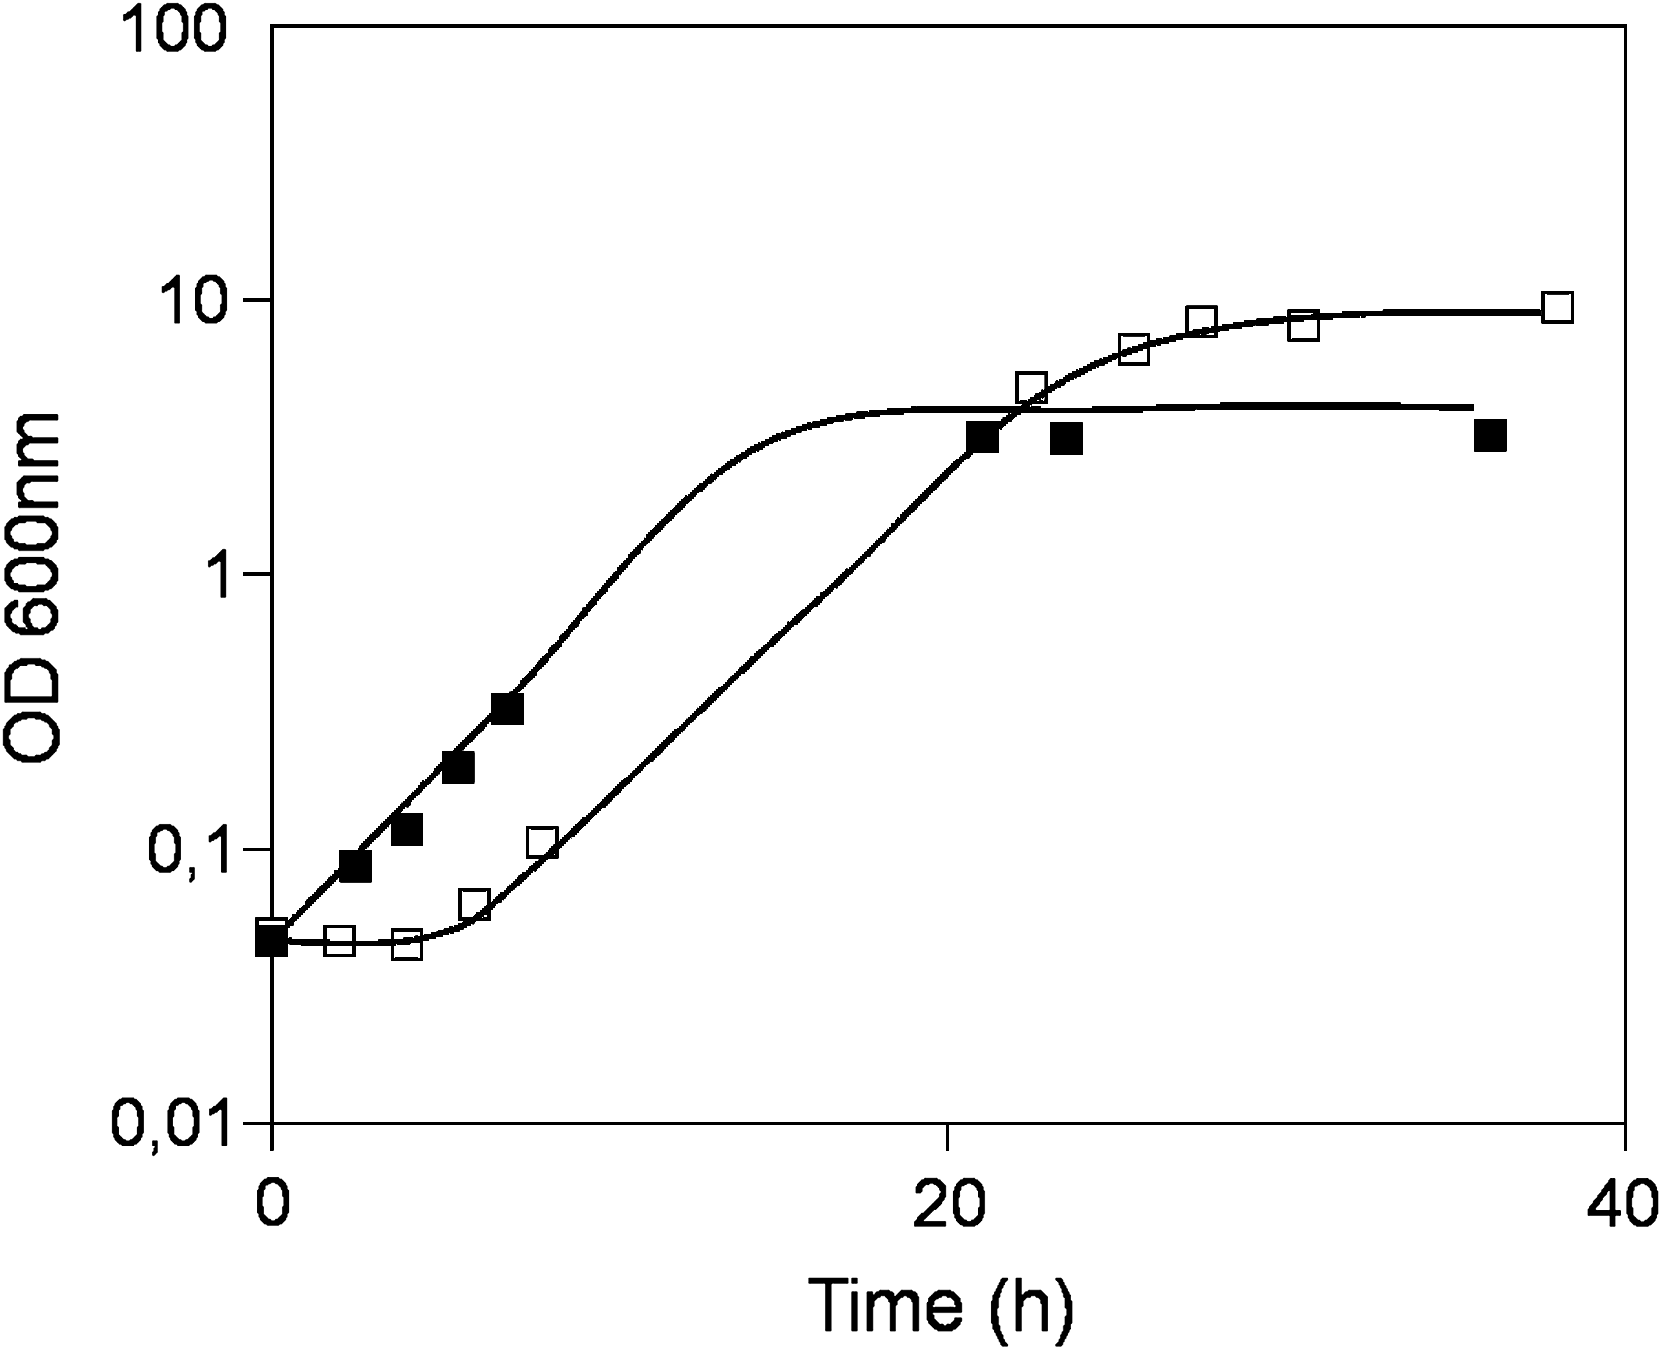
Growth curves of Saccharomyces cerevisiae BY4741 cells batch-cultivated in MM4 liquid growth media containing 30% (w/v) glucose (□), when compared to 2% (w/v) glucose (▪). Growth curves are representative of at least three independent experiments.

Categorization, based on the biological process taxonomy of Gene Ontology, of the genes required for high-glucose stress resistance. Forty-four genes were clustered using FatiGO, and only classes found to be statistically overrepresented in our dataset are displayed (p-value below 0.01, as indicated on top of each bar pair). The gene frequency within each class is indicated in black bars, compared to the frequency registered for the whole genome (white bars), gene frequency being the percentage of genes in a given list associated to a specific GO term.
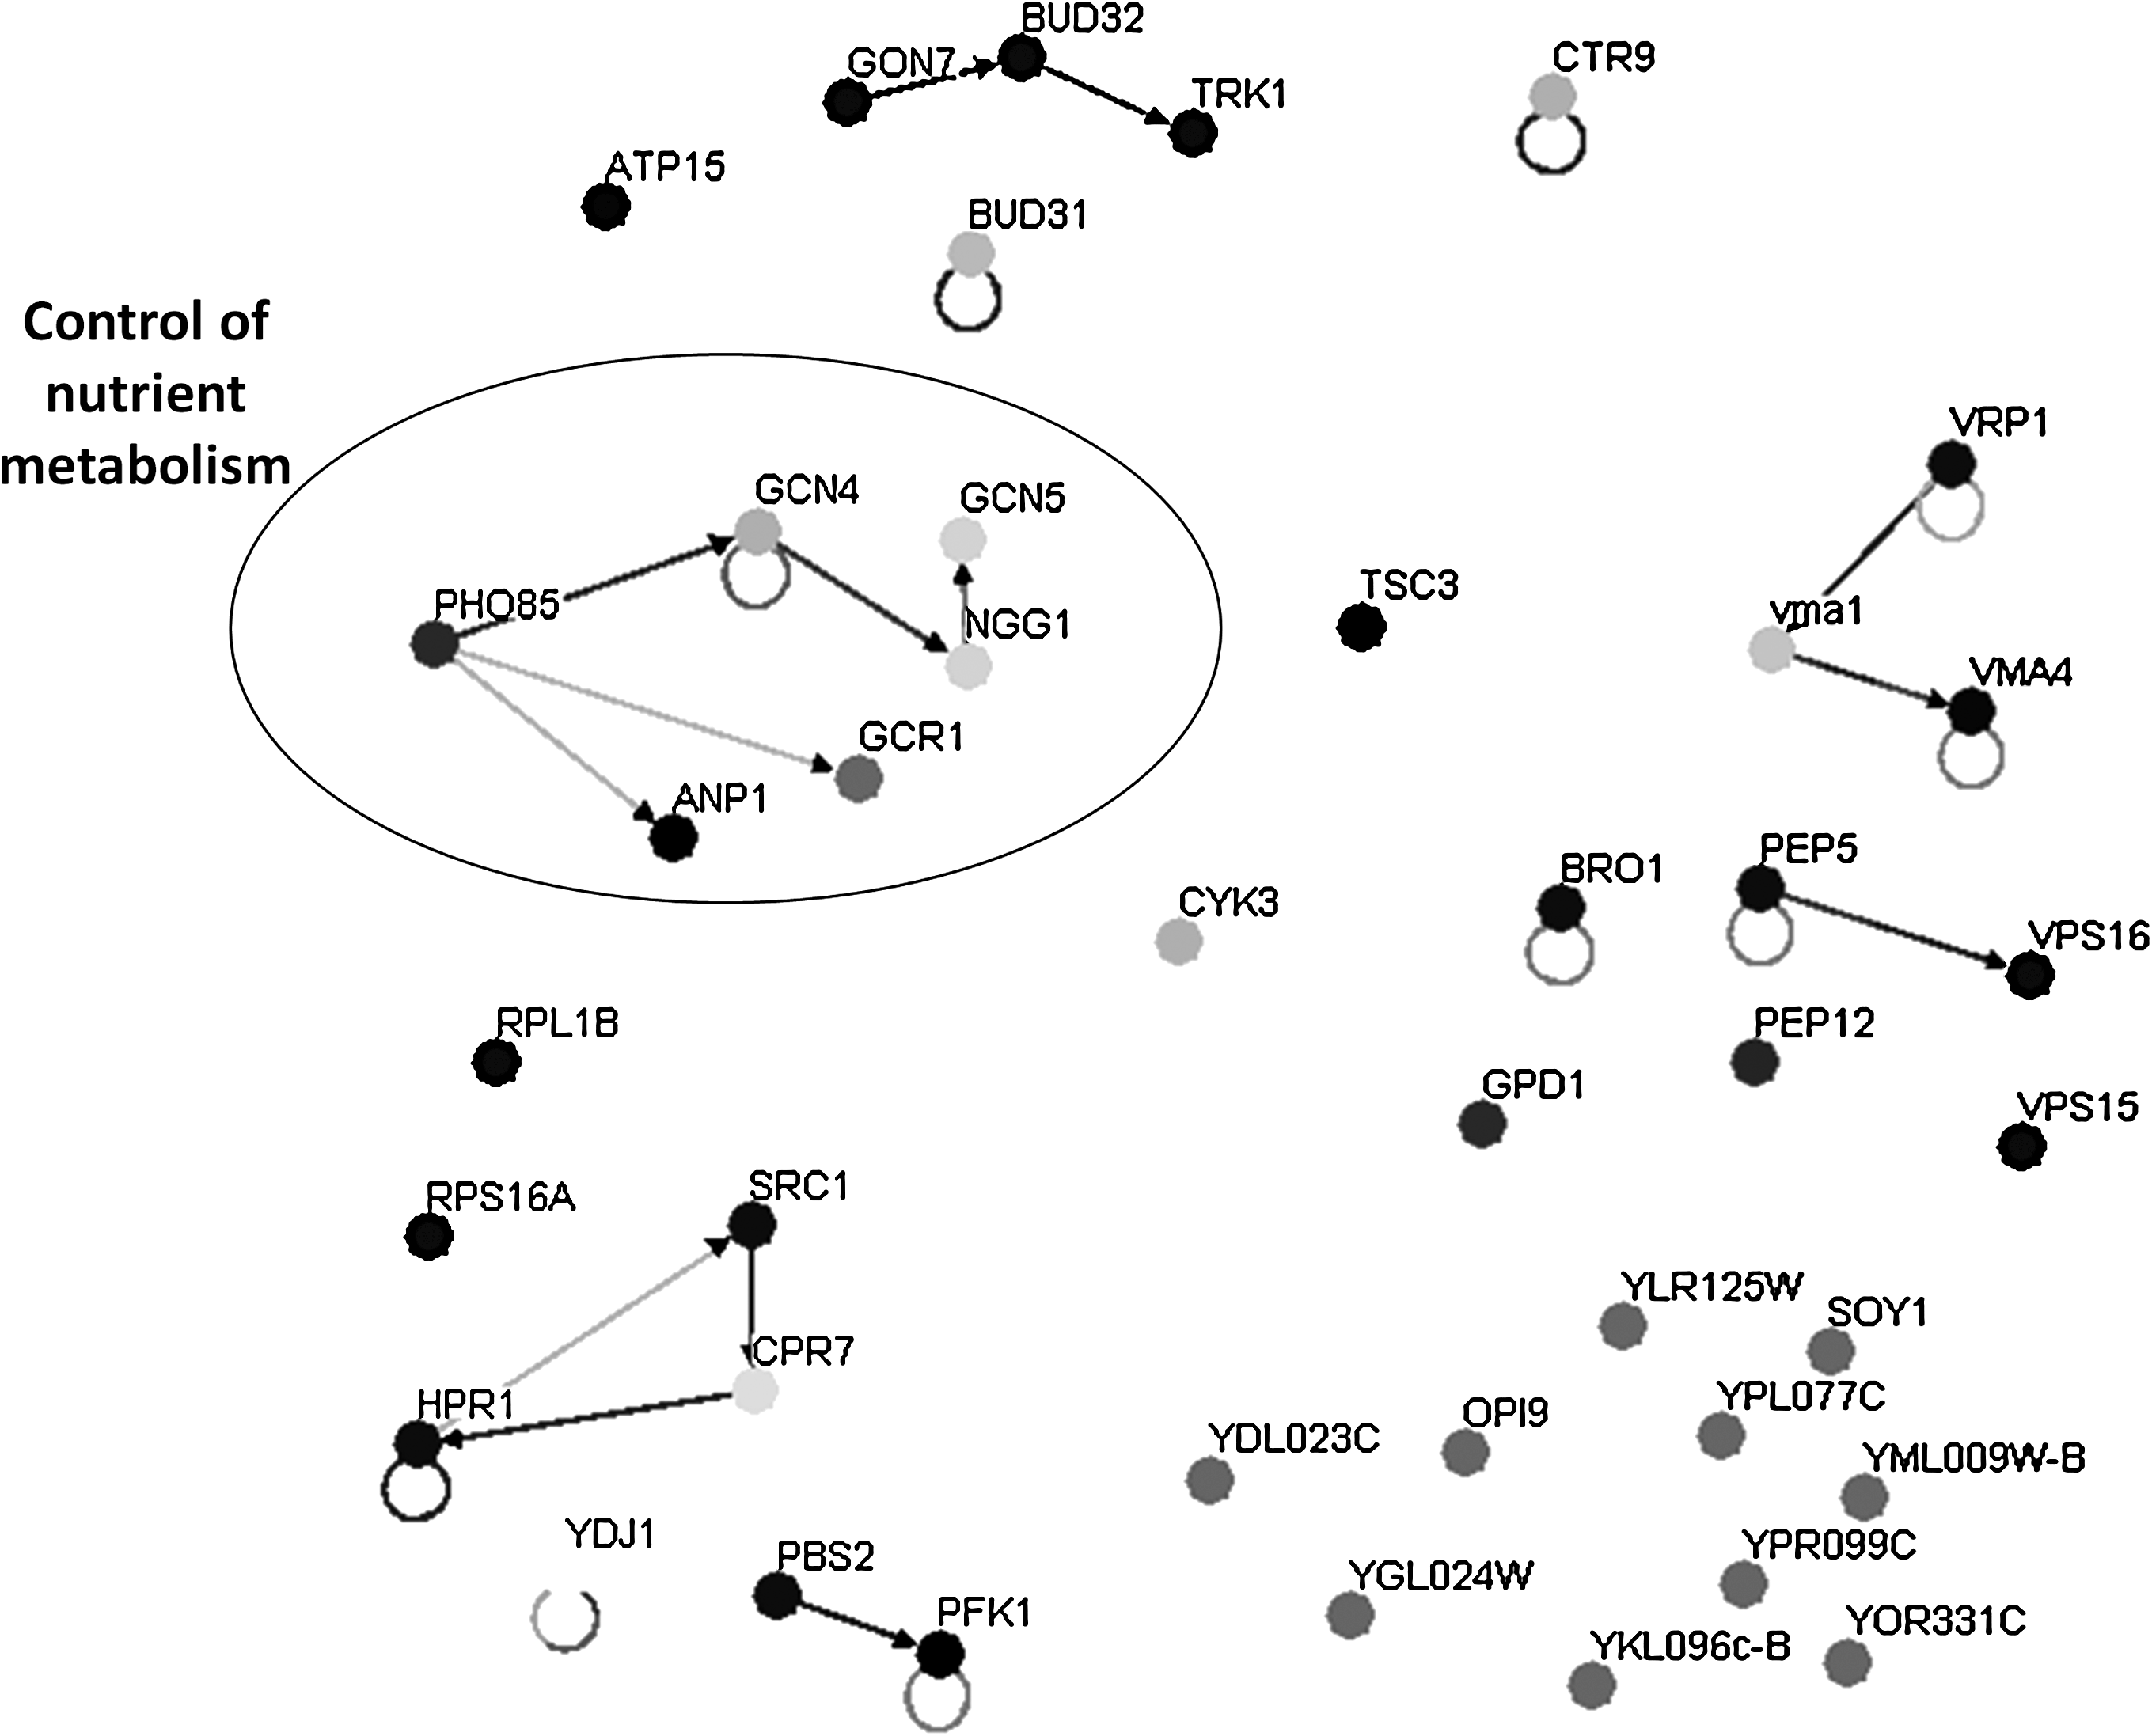
Main interaction network map of the determinants of high-glucose tolerance. The map was designed using the Osprey software and shows all known protein or genetic interactions within the 44 genes in the dataset. Each node corresponds to a different protein, represented by circles with different gray-scale levels, which indicate diverse biological functions. Connections between two nodes indicate the existence of experimental evidence showing that one protein/gene (in the origin of the arrow) was found to interact with the other (in the tip of the arrow). The group of determinants of high-glucose stress resistance observed to exhibit a higher number of interacting partners, involved in the control of nutrient metabolism, was manually highlighted inside a circle.
Gene description is adapted from SGD (www.yeastgenome.org). Gene names in bold or underlined represent those that were previously identified as determinants of resistance to ethanol (Teixeira et al., 2009; van Voorst et al., 2006) or high-sucrose (Ando et al., 2006) stress, respectively.
High-glucose stress affects vacuolar function
The important role of the H+ pumping ATPase present in the vacuolar membrane (V-ATPase) in yeast tolerance to 30% (w/v) glucose is highlighted in the present study, because mutants devoid of PPA1 and VMA4 genes, encoding V-ATPase subunits, are more sensitive to stress induced by 30% (w/v) glucose than the wild-type strain. Additionally, five genes involved in vesicular transport, VPS15, VPS16, PEP5, PEP12, and BRO1, and related to vacuolar protein trafficking were also identified as conferring high-glucose stress tolerance (Table 1). Proper vacuolar function seems, thus, to be highly significant in yeast resistance to 30% (w/v) glucose. To assess the effect of high-glucose stress in vacuolar function, vacuolar pH in yeast cells exposed for 1 h to 30% (w/v) glucose, in comparison to those growing in 2% (w/v) glucose, was determined using a pH-sensitive fluorescent probe. Results show that upon high-glucose stress yeast vacuolar pH becomes less acidic, stressed-cell vacuoles displaying higher fluorescence levels (Fig. 4). This result suggests that high-glucose stress may affect the function of the vacuolar membrane H+-ATPase (V-ATPase), a phenomenon that may explain, at least partially, the increased susceptibility exhibited by mutants devoid of V-ATPase constituents (Fig. 5). Indeed, when grown in liquid medium in the presence of 30% (w/v) glucose, the mutant strains identified in the chemogenomics analysis as being more susceptible than the wild-type exhibit not only an increased lag-phase period, but also a decrease in the attained final biomass (Fig. 5).
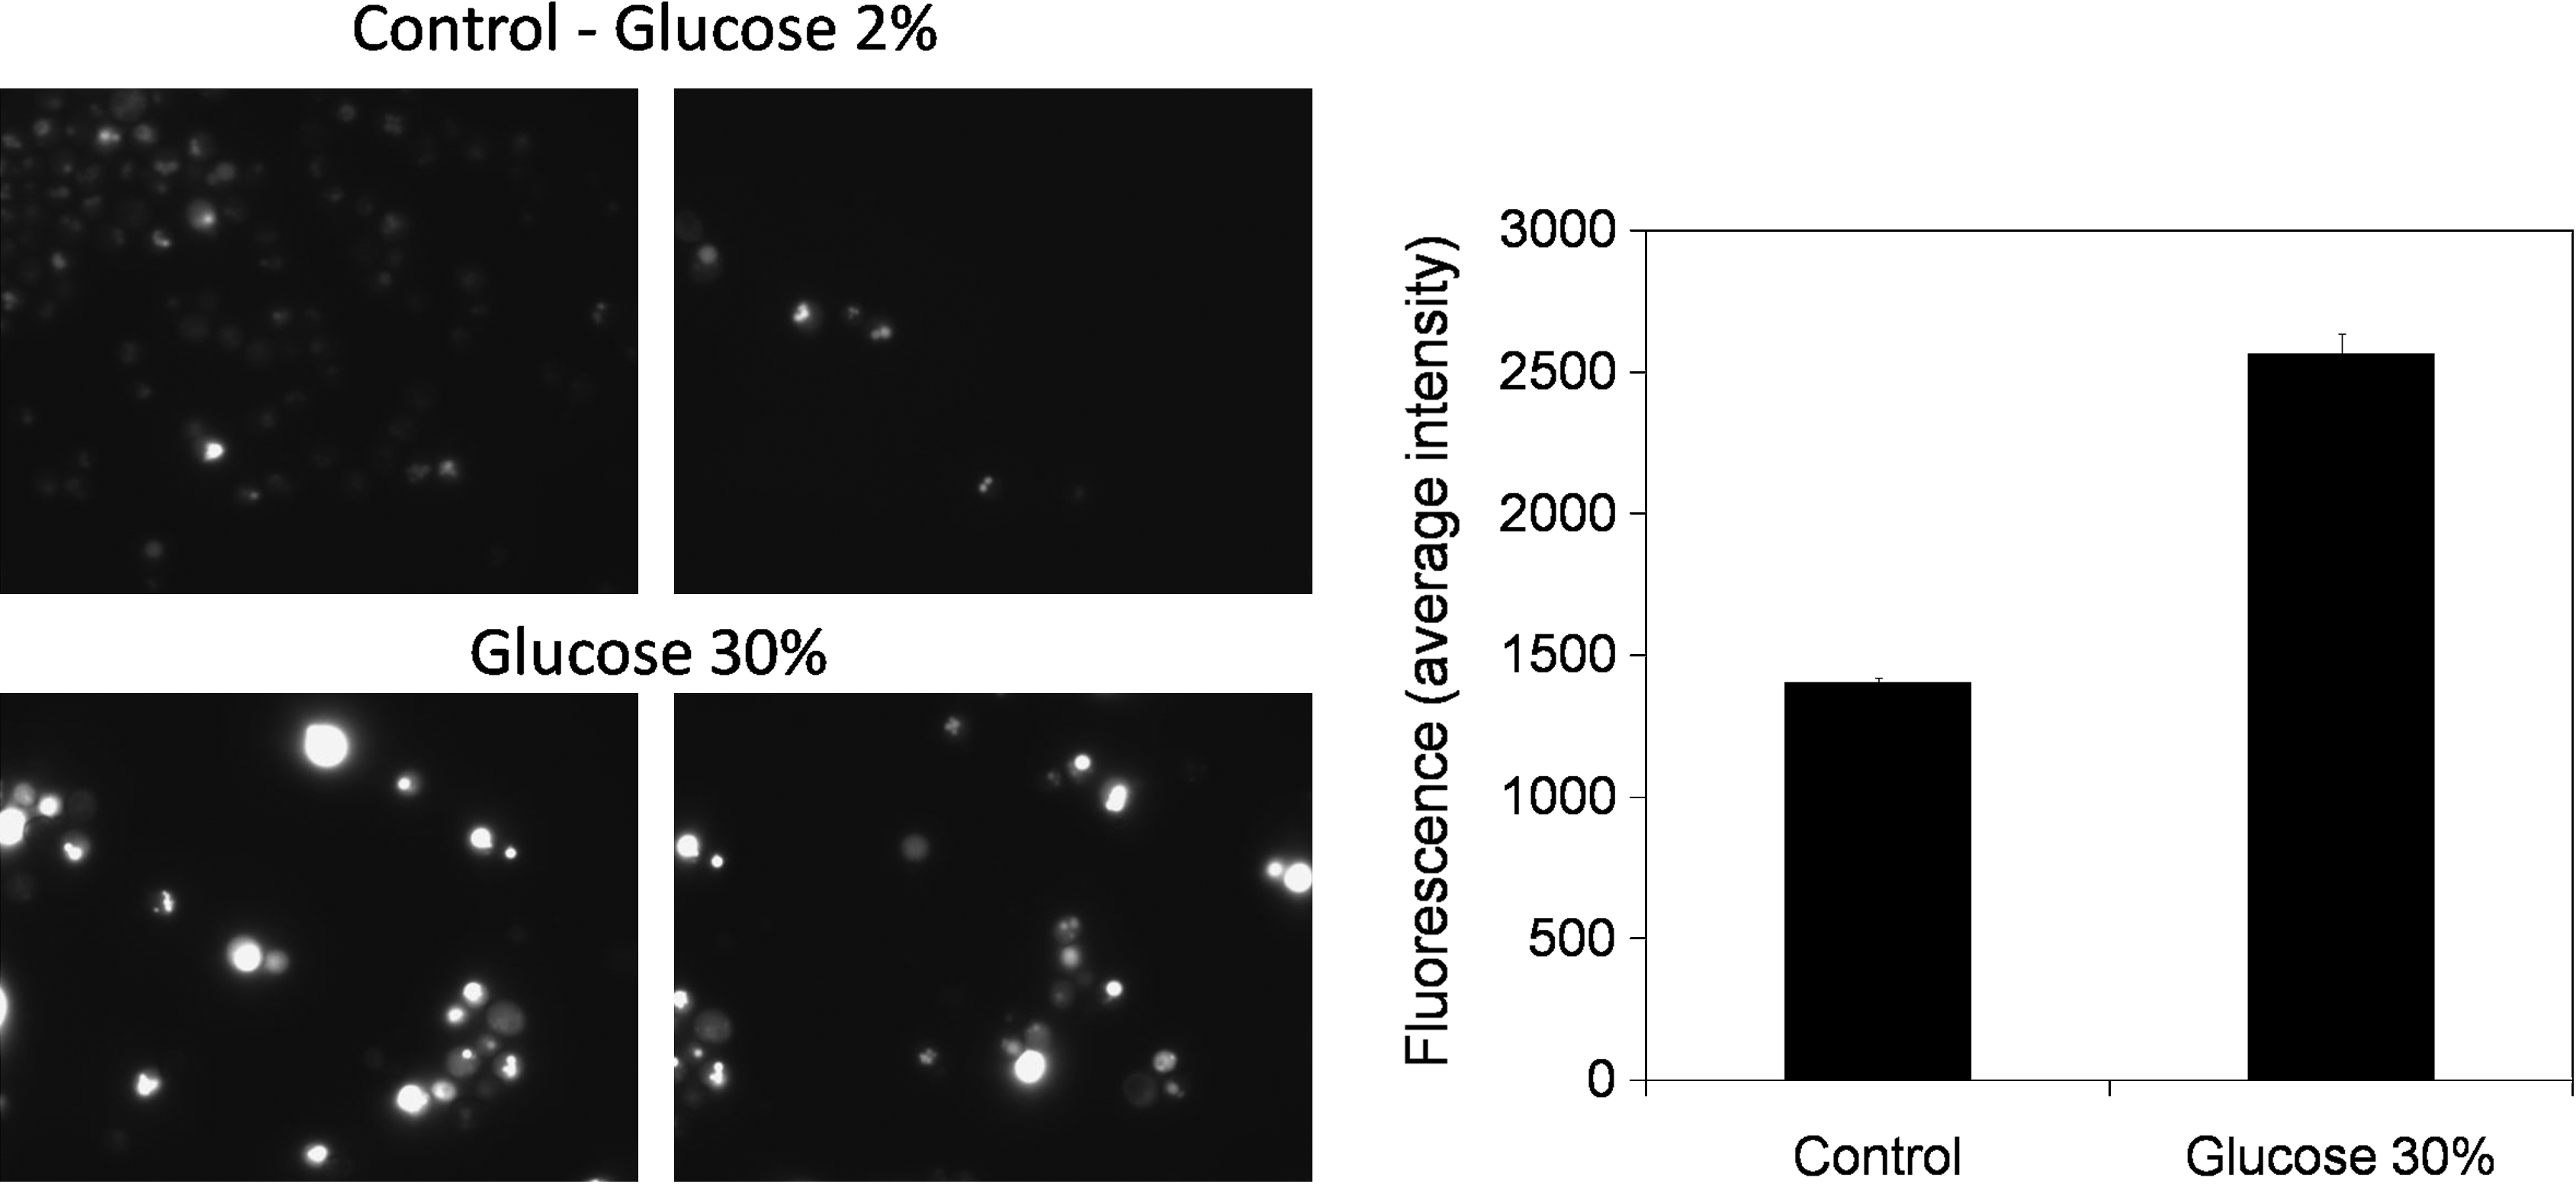
Yeast vacuolar acidification is affected under high-glucose stress. Vacuolar acidity was assessed by fluorescence microscopy following pH-sensitive probe staining. Vacuolar pH levels were associated to relative fluorescent units as displayed in the graphic on the right. Results are the means ± standard deviation, averaged from three independent experiments, each containing at least 100 cells. Stressed cells [30% (w/v) glucose] clearly exhibit higher vacuolar fluorescence than control cells [2% (w/v) glucose] as shown in representative fluorescence microscopy images (two for each condition) of cell cultures with a similar number of yeast cells, depicted on the left.
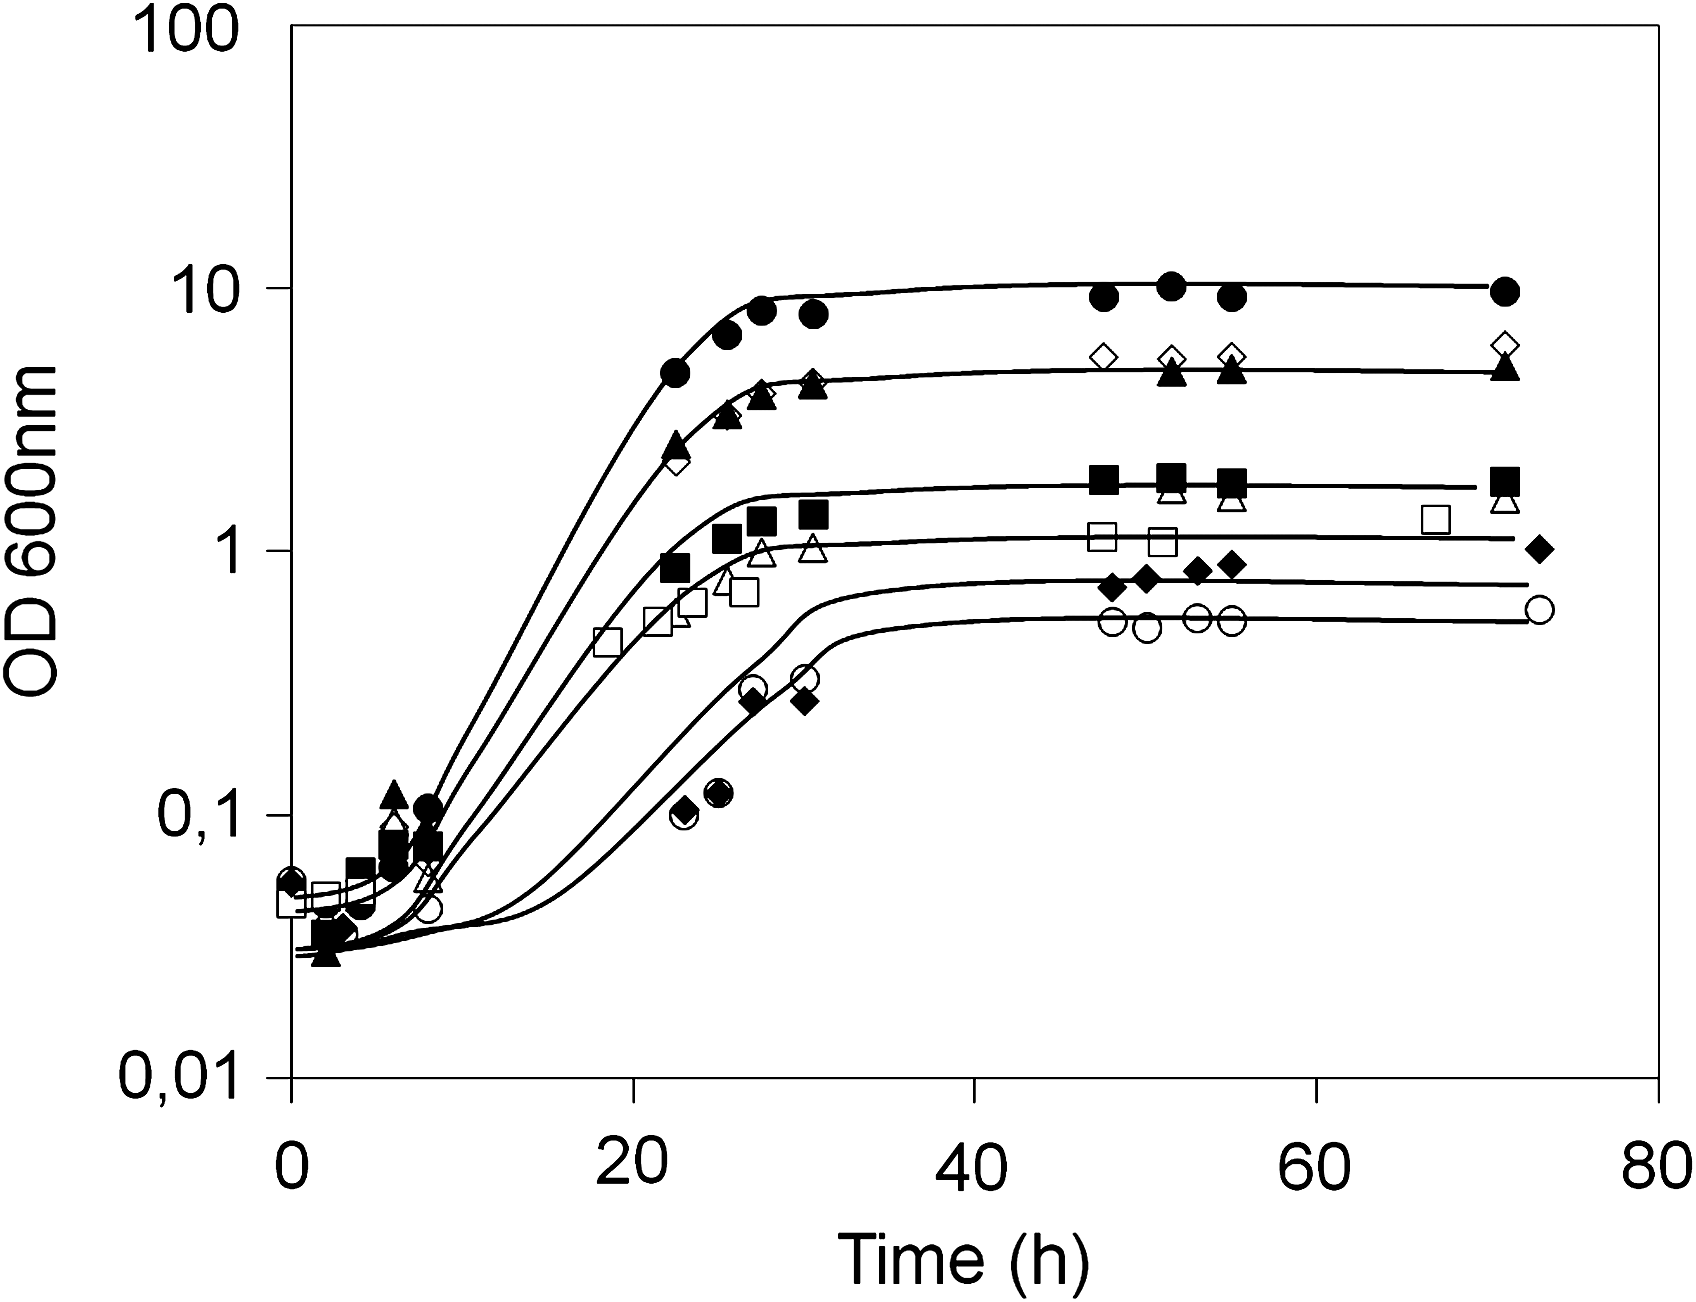
Saccharomyces cerevisiae BY4741-derived strains devoid of genes required for V-ATPase assembly and vacuolar protein sorting are more susceptible than the parental strain to high-glucose stress. BY4741 parental (•) and derived Δppa1 (◊), Δvma4 (▴), Δvps15 (○), Δvps16 (▪), Δpep5 (▵), Δpep12 (□), and Δbro1 (♦) deletion mutants were harvested in midexponential growth phase and set to grow in fresh MM4 medium supplemented with 30% (w/v) glucose. Growth curves are representative of at least three independent experiments.
High-glucose stress reduces the rate of extracellular acidification promoted by the in vivo activity of plasma membrane H+-ATPase
Altered vacuolar function is known to affect the targeting of Pma1, the major H+-ATPase in the yeast plasma membrane, through the secretory pathway (Perzov et al., 2000). Considering that the balance between the in vivo activity of Pma1 and the passive influx of H+ can be assessed by the acidification of the external medium (Portillo and Serrano, 1989), the effect of high-glucose stress in yeast ability to acidify the surrounding medium was measured. Interestingly, yeast cells grown in control conditions (2% w/v glucose) exhibit a reduced extracellular acidification rate when assayed in the presence of 30% (w/v) glucose, in comparison to cells assayed for extracellular acidification ability in the presence of 2% (w/v) glucose (Fig. 6A). Apparently, high-glucose stress exerts an immediate effect on the plasma membrane H+-ATPase, reducing its activity. Upon 1 h of exposure to cultivation in medium containing 30% glucose, yeast cells also exhibit a reduced extracellular acidification rate, either when acidification assays were carried out in the presence of 2% or 30% (w/v) glucose (Fig. 6B). Interestingly, when cells are pregrown in high-glucose stress and then assayed in the presence of only 2% (w/v) glucose, they exhibit reduced initial acidification rates and the final external pH reached at the equilibrium is above the values obtained for unstressed yeast cells. This result suggests that Pma1 activity is directly affected upon immediate exposure to 30% glucose. Furthermore, results may suggest that upon cultivation for 1 h under high-glucose stress the activity or amount of Pma1 in the plasma membrane may be reduced, because even when put back into 2% glucose cells are still unable to exhibit the same acidification ability as control cells (Fig. 6B). This may reflect a deficient targeting of Pma1 to the plasma membrane, which is known to occur in cells exhibiting affected vacuolar function (Perzov et al., 2000). Interestingly, H+-ATPase activity under osmotic stress was proposed to be important for the maintenance of the proton gradient needed to allow an increased uptake of K+ ions, to compensate high external osmolarity (Hohmann, 2002). In this context, it is interesting to point out that Trk1, the major yeast K+ importer, was also found in this work to be required for high-glucose stress resistance (Table 1). Although the effect of osmotic stress in ion imbalance has been mostly associated to high salt stress, current results suggest that cells exposed to osmotic stress induced by high glucose concentrations may also experience changes at the level of ion homeostasis.
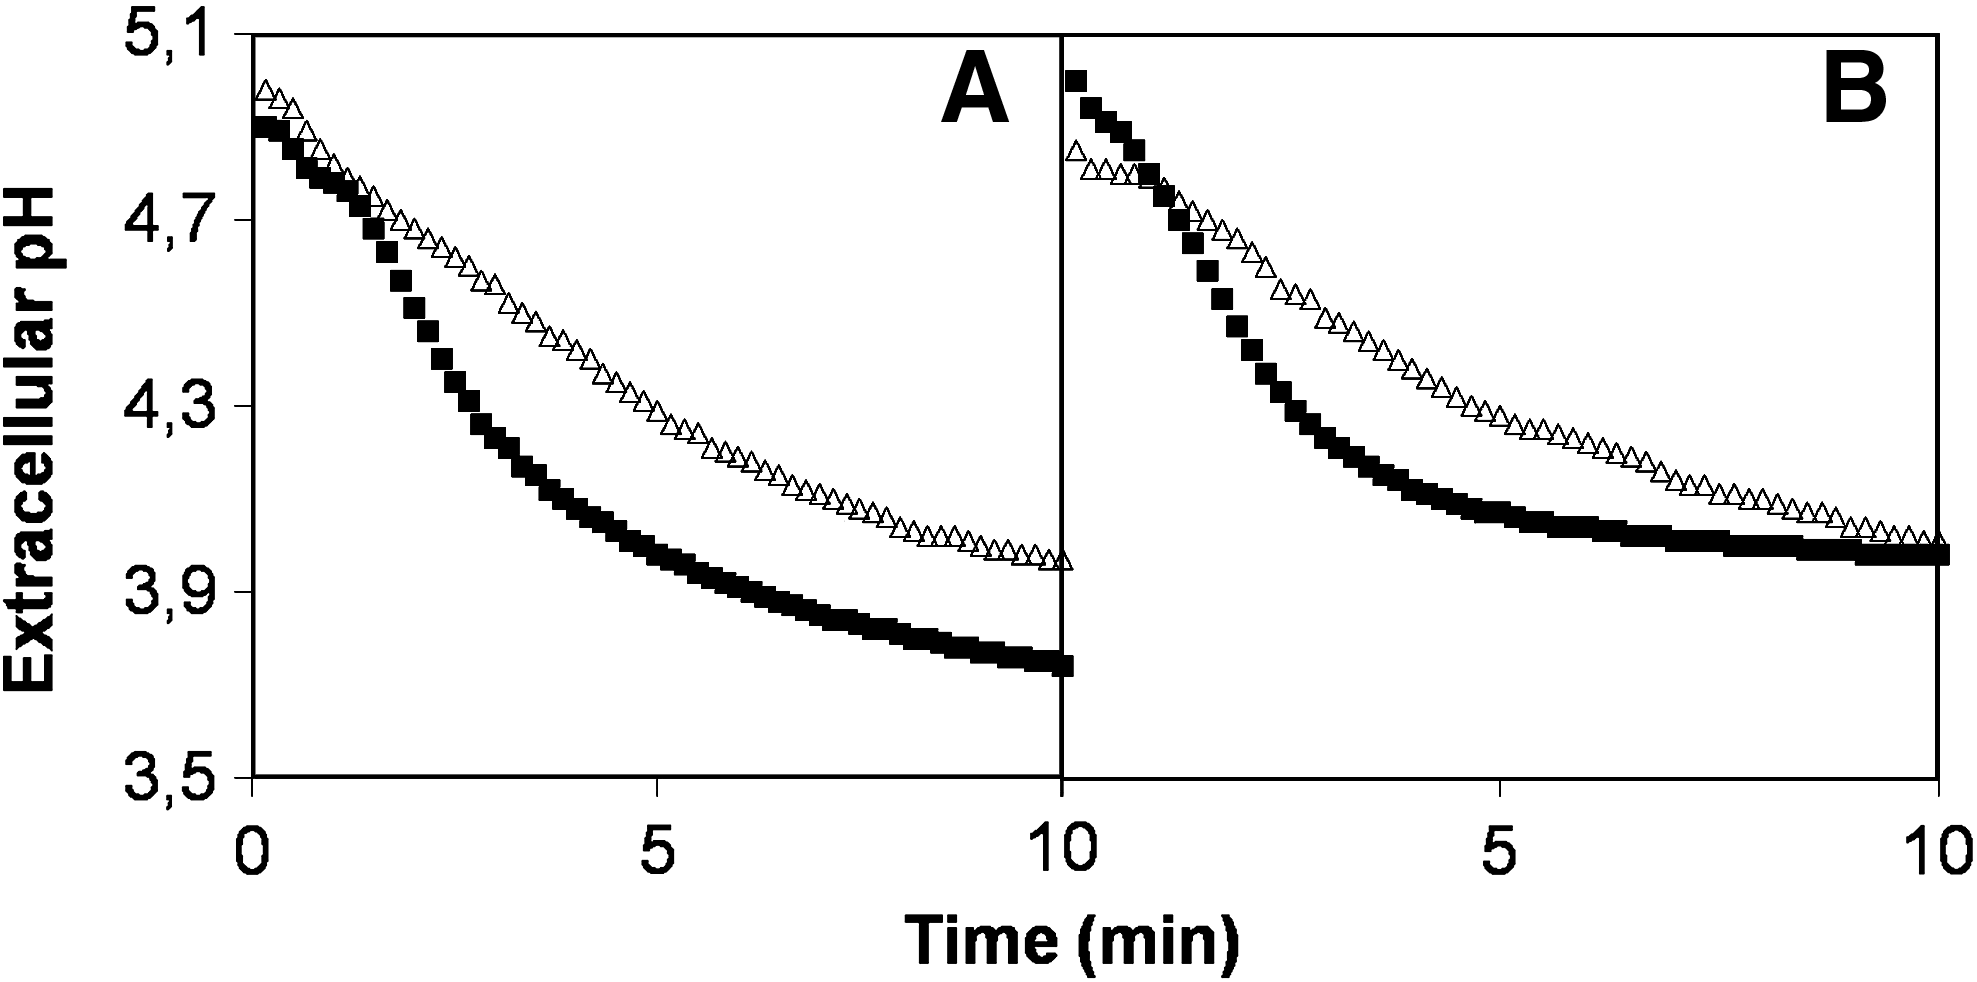
High-glucose stress decreases wild-type extracellular acidification rate and leads to higher values of extracellular pH reached at equilibrium. Wild-type yeast cells were cultivated for 1 h in medium containing 2% (
Genes involved in the control of nutrient metabolism are required for yeast resistance to high-glucose stress
Genes involved in the control of carbohydrate metabolism were identified in this work as determinants of yeast resistance to 30% (w/v) glucose (Table 1). These include GCR1 and NGG1, encoding transcription factors that control carbohydrate metabolism in the presence of glucose, inducing glycolytic gene expression and repressing Gal4-regulated genes, respectively. Moreover, two genes involved in glycolysis (PFK1) and glycerol production (GPD1) were also identified as contributing to yeast resistance to high-glucose stress. PFK1 encodes a phosphofructokinase with a role in glycolytic flux regulation. The role of these genes in high-glucose stress tolerance appears to suggest that cells exposed to 30% (w/v) glucose require a high glycolytic flux to deal with glucose excess or to increase the production of glycerol, as a compatible solute (Erasmus et al., 2003). This is consistent with the observation that most glycolytic enzymes are upregulated under high-glucose shock (Erasmus et al., 2003; Pham and Wright, 2008). Additionally, one single gene involved in mitochondrial respiration, ATP15, encoding a subunit of the F0F1 ATP synthase, was also identified as a determinant of high-glucose resistance. This process may be important to increase the production rate of ATP, which is required to fuel demanding stress response mechanisms. GCN4 and PHO85, encoding a transcription factor that controls amino acid starvation response and a kinase involved in the regulation of cell cycle and response to environmental stress and phosphate availability, respectively, were also found to confer high-glucose resistance. The role of Gcn4 in high-glucose stress response may correlate with the observed decrease in intracellular amino acid concentration found to occur in yeast cells exposed to this stress (Pham and Wright, 2008). Interestingly, a single gene involved in sphingolipid membrane composition, TSC3, was identified as conferring resistance to high-glucose concentrations. This gene is required for the regulation of sphingolipid production yield, in particular long-chain sphingolipids (Cowart and Hannun, 2007), required as signaling molecules for stress response and signal transduction through the TOR pathway in response to nutrient quantity and quality (Dickson, 2008). Furthermore, sphingolipids are required for the formation of lipid microenvironments which favor the proper folding and activity of essential nutrient transporters, particularly the general amino acid permease Gap1 (Lauwers et al., 2007).
Discussion
The chemogenomics analysis described in this work provides new information on the determinants and mechanisms of resistance to stress induced by high-glucose concentrations, known to be present in most feedstocks used in industrial alcoholic fermentation processes. Forty-four determinants of high-glucose stress resistance were identified herein. Half of these genes confer crossresistance to high-sucrose stress (Ando et al., 2006) (Table 1). Ando and coworkers identified 273 genes as required for yeast tolerance to high-sucrose stress, most of which exhibiting crossresistance to sorbitol or salt stress. Interestingly, the 22 genes conferring resistance to both high-glucose and high-sucrose stress are mostly those related to osmoprotection, including the osmosensor encoding gene PBS2 or the glycerol-3-phosphate dehydrogenase encoding gene GPD1. PBS2 encodes a MAP kinase kinase, which plays a crucial role in the osmosensing signal transduction pathway, whereas Gpd1 is a key enzyme for glycerol biosynthesis and considered essential for growth under osmotic pressure. Furthermore, genes sharing a role in high-sucrose and high-glucose stress tolerance also include those involved in cytoskeleton organization and in cell morphology (BUD31, BUD32, VRP1, and CYK3), which are also required to sustain cell structure against osmotic pressure. The identification of these genes as part of the high-glucose stress resistance determinants is not surprising, given that 300 g/L of glucose is bound to exert strong osmolarity pressure upon yeast cells (Verstrepen et al., 2004).
On the other hand, 65% of the determinants of yeast tolerance to high-glucose stress are also required for ethanol stress resistance (Teixeira et al., 2009) (Table 1). For example ANP1, encoding one of the subunits of the mannosyl polymerase complex II (M-Pol II), was herein identified as determinant of yeast resistance to high concentrations of glucose and previously shown to be required for yeast tolerance to ethanol stress (Teixeira et al., 2009). M-Pol II is responsible for the elongation of the mannose backbone (a polymer with up to 200 mannoses) in cell wall and secretory proteins (Lesage and Bussey, 2006). This mannan modification is very extensive, mannoproteins constituting up to 40% of the yeast cell wall dry weight. Mannans provide an external layer to the cell wall, which is believed to contribute to its structural integrity and to determine the permeability of the cell wall to macromolecules (Klis et al., 2002). This work further suggests that the composition and extension of this mannan backbone may be essential to increase yeast tolerance towards high-glucose induced stress.
Genes related to vacuolar function are also required for yeast resistance to both ethanol and high-glucose stress. Data obtained in this study show that high-glucose stress affects vacuolar function at the level of vacuolar pH homeostasis. This effect is consistent with the observed decrease in extracellular acidification ability exhibited by yeast cells challenged with 30% (w/v) glucose. It is known that Pma1 targeting to the plasma membrane is hampered in cells devoid of functional vacuolar H+-ATPase (Perzov et al., 2000) and mutations affecting the S. cerevisiae plasma membrane H+-ATPase induce an osmosensitive phenotype, inhibiting growth at high osmotic pressure (McCusker et al., 1987). The present study demonstrates that osmotic stress induced by high glucose concentrations leads to decreased proton extrusion rates in yeast, possibly due to the observed disturbance of yeast vacuolar function upon high-glucose stress exposure. This effect was described before for osmotic stress induced by sorbitol, xylitol, and glycerol (Martinez de Maranon et al., 2001). Consistently, the deletion of V-ATPase subunits, Ppa1, Vma4, and others, or of genes related to vacuolar organization and biogenesis also increases yeast susceptibility towards inhibitory concentrations of ethanol (Teixeira et al., 2009). Furthermore, vacuolar function was shown to be required for ethanol stress response, presumably as a means to assure proper protein trafficking toward the plasma membrane and to control cytosolic pH (Teixeira et al., 2009).
Protein trafficking, a process that seems to be affected in both ethanol and high glucose-stressed cells, is also crucial for the targeting of nutrient uptake systems to the plasma membrane. It is known that ethanol interferes with membrane lipid organization, affecting its function as a matrix for enzymes, perturbing the conformation and function of membrane transporters, increasing plasma membrane nonspecific permeability and leading to the dissipation of transmembrane electrochemical potential (Salgueiro et al., 1988; Van Uden, 1985). Besides, ethanol has been shown to inhibit crucial glycolytic enzymes (Casey and Ingledew, 1986). These toxicological effects lead to the requirement of genes involved in the control of carbohydrate and amino acid metabolism to confer yeast resistance to ethanol (Teixeira et al., 2009). Among these genes, the transcriptional regulators Gcn4 and Gcr1 were found herein to be required as well for yeast tolerance to high-glucose stress. Most significantly, changes in the expression of enzymes involved in glucose and amino acid metabolism were observed in cells suddenly exposed to high-glucose stress (Pham et al., 2006). Simultaneously, a transient decrease in the intracellular concentration of most amino acids was registered and attributed to changes exerted by osmotic stress at the level of amino acid transport through the plasma membrane (Pham and Wright, 2008). As depicted in Figure 7, these transcriptional regulators control the expression of a number of other determinants of resistance to ethanol and high-glucose stress (www.yeastract.com) (Monteiro et al., 2008; Teixeira et al., 2006). However, the genes regulated by Gcn4 and Gcr1, which were found to confer resistance to ethanol stress, do not coincide with those required for high-glucose stress tolerance (Fig. 7). This observation may suggest that Gcr1 and Gcn4 are required to confer yeast resistance to ethanol and high-glucose stress through distinct molecular mechanisms.
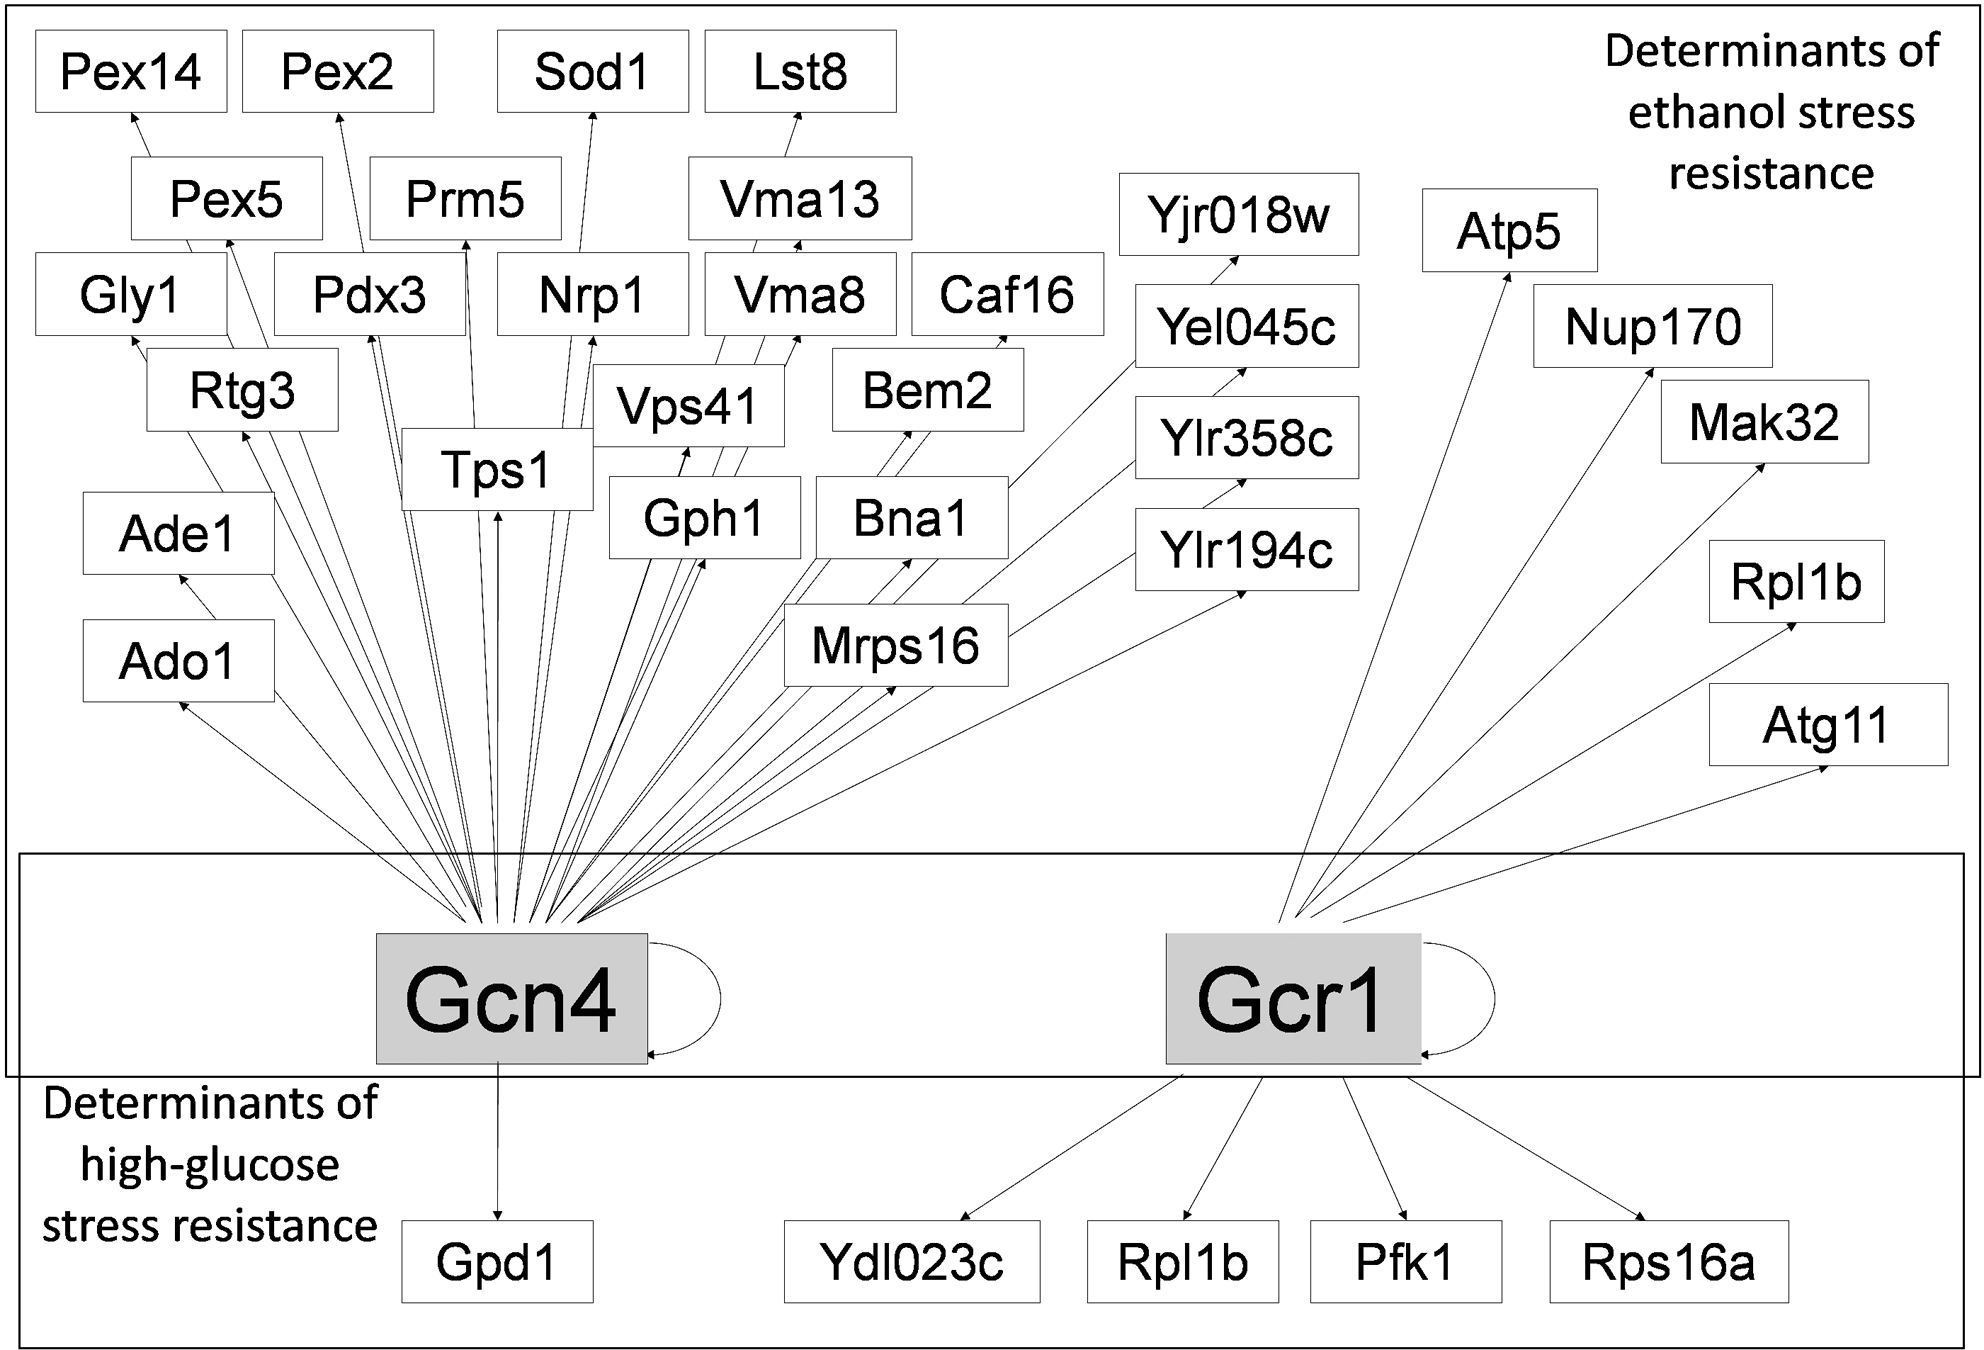
Transcription regulatory network centered on the two transcription factors required for both high-glucose and ethanol stress resistance: Gcn4 and Gcr1 (in gray text boxes). Displayed target genes are those found to be required for high-glucose (this work) or ethanol (Teixeira et al., 2009) stress tolerance. Among these target genes, only Rpl1b is also a determinant of resistance to both stresses. The network was obtained using the Yeastract information system (www.yeastract.com) (Monteiro et al., 2008; Teixeira et al., 2006).
Altogether, the exploitation of the information gathered in this study is very promising, envisaging the manipulation of the expression or activity of the determinants of resistance to high-glucose and ethanol stress to obtain yeast strains with increased performance in both the beginning and the end of industrial alcoholic fermentation.
Conclusions
Stress induced by high-glucose concentrations is a severe problem during alcoholic fermentation, occasionally leading to stuck or sluggish fermentations (Brosnan et al., 2000; Rossignol et al., 2003; Verstrepen et al., 2004). The chemogenomics analysis carried out in this work is the first approach to this problem in a genome-wide perspective and identified 44 high-glucose stress resistance determinants in yeast. The intersection of this dataset with the previously identified genes required for ethanol stress resistance (Teixeira et al., 2009) narrows down to 29 the determinants of resistance to both stresses. In particular, the maintenance of vacuolar function through the expression of V-ATPase activity, of the cell wall mannan backbone and of robust regulation of nutrient metabolism (to increase glycolytic flux and deal with intracellular amino acid fluctuations) are among the most important biological processes required for yeast tolerance to high-glucose and ethanol stress. We believe that this small group of genes deserves special attention in the context of genetic engineering of strains and the delineation of strategies to overcome the major challenges faced by the producing yeast during alcoholic fermentations in industrial processes.
Footnotes
Acknowledgments
Research described in this article was financially supported by FEDER and “Fundação para a Ciência e a Tecnologia” (FCT) (Contract PTDC/BIO/66151/2006 and PhD grant for M.P.; SFRH/BD/27663/2006).
Author Disclosure Statement
The authors declare that no conflicting financial interests exist.