




Abstract
Abstract
Vacuum fermentation is utilized in a wide range of life science industries and biomedical R&D. Little is known, however, on the effects of the vacuum on the yeast, and in particular, on the yeast lipidome that plays a central role in maintaining cell membrane and other vital (yeast) cell functions. The present study evaluated the adaptive responses of Saccharomyces cerevisiae to repeated vacuum fermentation by lipidomic analysis. We employed gas chromatography coupled to time-of-flight mass spectrometry (GC-TOF-MS) and liquid chromatography electrospray ionization tandem mass spectrometry (LC-ESI/MSn) to quantify a total of 13 intermediate sterols and 139 phospholipid species of yeast cells. Principal components analysis found that the PI (phosphatidylinositol) 26:0, PI 28:0, PE (phosphatidylethanolamine) 32:1, and PE 34:1 were potential biomarkers to distinguish the vacuum fermentation process. Quantitative analysis showed that vacuum fermentation increased the synthesis of PI and the PC (phosphatidylcholine) species with short saturated acyl chains. The synthesis of PC via CDP–choline and turnover of PC were enhanced, instead of formation via methylation of PE. Additionally, increased PI at the expense of PE and PG (phosphatidylglycerol) was associated with enhancement of ethanol productivity. Vacuum fermentation caused eburicol accumulation, suggesting that vacuum can activate the branch of the ergosterol biosynthesis pathway. Eburicol decrease and PI increase contributed to recovery of cellular activities with oxygenating treatment. Ethanol productivity was increased by sixfold in vacuum-treated cells. These observations may allow the development of future mechanistic approaches to optimization of yeast fermentation under vacuum for bioindustry and life science applications. In particular, our findings on changes in lipid molecular species and the ergosterol biosynthesis pathway elucidate the defense responses of yeast cell membranes during the repeated vacuum fermentation, which by extension, provided an important lead insight on how best to protect the cell membranes from the extreme long-term stress conditions.
Introduction
Yeast cells exhibit complex stress responses and adapt to different kinds of stress conditions that are less than physiologically ideal (Querol et al., 2003). These responses include cell sensing, synthesis of protective molecules, and modulation of protein/enzyme activities by posttranslational modifications (Rodrigues-Pousada et al., 2004). It was found that the expression level of phosphatidylinositol/phosphatidylcholine transfer protein (Sec14p), involved in regulating PtdIns, PtdCho, and ceramide metabolism, was significantly downregulated during vacuum fermentation and high inoculation size (Cheng et al. 2009a, 2009b). Enhancements of phosphatidic acids and phosphatidylethanolamines conversion into phosphatidylinositols and phosphatidylcholines resulted in their lower levels during yeast cells responding to inhibitors (e.g., furfural, phenol, and acetic acid) (Xia and Yuan, 2009). The roles for sphingolipids in major transcriptional changes in response to heat stress were also reported (Cowart and Hannun, 2005). Metabolic analyses revealed that the total content of phospholipids in yeast cells was significantly reduced under low-temperature winemaking fermentations (Beltran et al., 2006). The esters of long-chain unsaturated fatty acids coming from membrane phospholipids were excreted by yeasts following a pressure stress (Guerzoni et al., 2007). Therefore, ways in which cells respond and adapt to vacuum, particularly in terms of their membranes, are of great interest. However, the adaptive mechanisms to the extreme vacuum condition have not yet been intensively studied using lipidomic approach.
It was demonstrated that glycerol, myo-inositol, trehalose, and glutamate were taken as the protective molecules involved in adaptative evolution of yeast cells to vacuum fermentation (Ding et al., 2009). The membrane stability plays a key role in adaptation of the yeast cell to different external conditions. Eukaryotic membranes contain diverse lipid molecular species, and the lipid composition changes in response to both internal and external cues. Sensitivity of the S. cerevisiae cells to heat and oxidative stress is dependent on membrane lipid composition (Steels et al., 1994). Moreover, compositional changes of both the acyl chains and the polar head groups can alter the packing arrangements of the lipids and can thus affect the bilayer stability and fluidity, sometimes even the lipid–protein interactions (Russell et al., 1995). It was also reported that yeasts can incorporate a wide variety of exogenous sterols under strict anaerobiosis (Deytieux et al., 2005).
Research on the ergosterol biosynthetic pathway in fungi has focused on the identification of the specific sterol structure required for normal membrane structure and function and for completion of the cell cycle (Lees et al., 1995). Ergosterol is required for adequate anaerobic growth during fermentation. A noticeable increase in ergosterol contents was detected after preoxygenation treatment (Verbelen et al., 2009). Genes related to ergosterol synthesis were downregulated during industrial bioethanol fermentation (Li et al., 2010). Sterols can also regulate the membrane fluidity and permeability (Van Der Rest et al., 1995). However, the adaptive and tolerant mechanisms of S. cerevisiae to multiple stresses (e.g., negative pressure, absence of oxygen) under vacuum fermentation condition were still unclear, in particular, at the lipidomic-level responses.
We herein investigated the profiles of phospholipid and ergosterol in the industrial S. cerevisiae under the vacuum fermentation condition, respectively, by liquid chromatography electrospray ionization tandem mass spectrometry (LC-ESI/MSn) and gas chromatography coupled to time-of-flight mass spectrometry (GC-TOF-MS). We also present a method to recover the cell damage from vacuum conditions. Our observations on changes of lipid molecular species and variations in ergosterol biosynthesis pathway elucidate the defense responses of yeast cells membranes during the repeated vacuum fermentation, which provide knowledge on how to protect the cells membranes from the extreme long-term stress conditions.
Materials and Methods
Yeast strain and precultivation
The industrial S. cerevisiae strain, Angel thermal-tolerant alcohol active dry yeast (Product No. 80000012), was obtained from Angel Yeast Co., Ltd in China. The dry active yeast was precultured aerobically in shake flasks containing 20 g/L glucose for 20 min at 35°C.
The two-round repeated vacuum fermentation
The repeated vacuum fermentation consisted of two rounds. The first round (VF I) was conducted continuously for 420 h (30 cycles), as shown in Figure 1A. The second round (VF II) was performed for 60 h (10 cycles), as illustrated in Figure 1B. The vacuum fermentation system was previously described by our group (Cheng et al., 2009a). It was maintained at 35°C with 50 ± 5 mbar pressure.
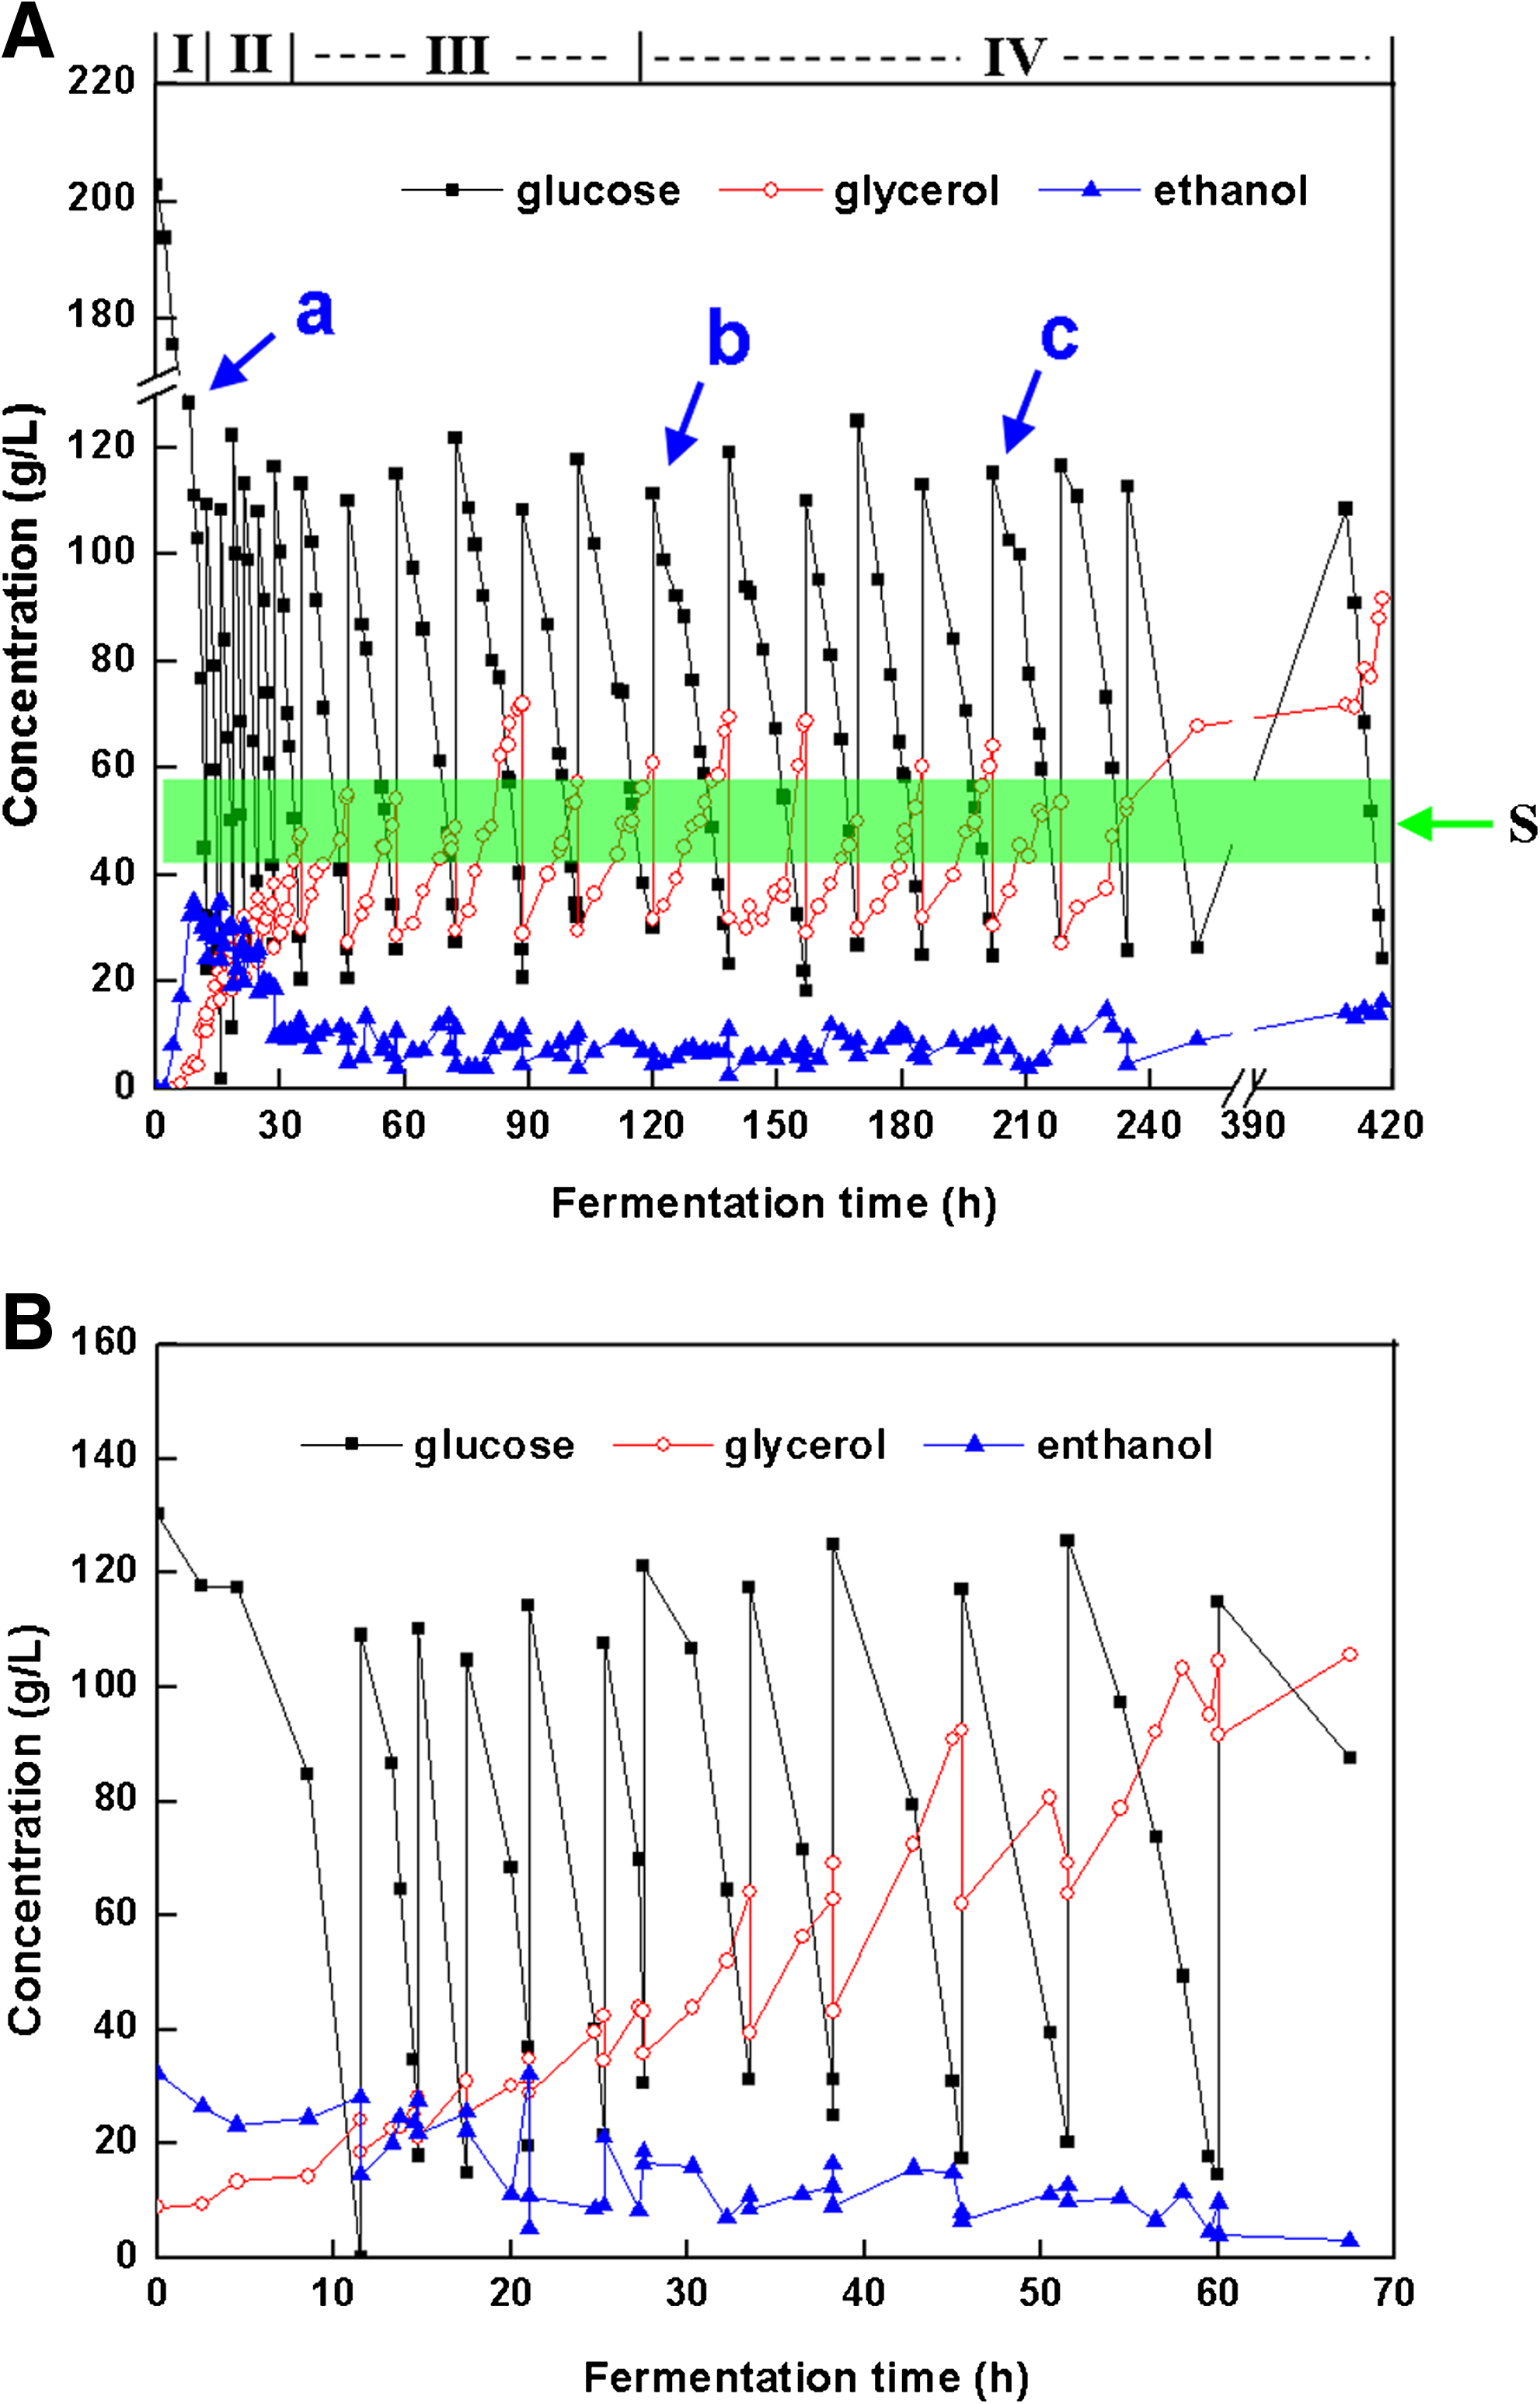
Changes of glucose, glycerol, and ethanol during the repeated vacuum fermentation.
For the VF I, industrial yeast cells (5 g/L) was transferred into a 10-L fermentor with a 5-L high-sugar yeast extract peptone dextrose (YPD) medium, containing 10 g/L yeast extract, 20 g/L peptone, and 200 g/L glucose. Vacuum pressure was initiated when the residual glucose in the broth decreased to about 100 g/L at point a in Figure 1A. When the residual glucose dropped to about 20 g/L, fresh YPD medium was fed until appropriately 100 g/L with a fixed working volume at 5 L. One cycle was defined as when glucose content decreased from 100 g/L to about 20 g/L.
To further investigate the response of cell membranes under vacuum fermentation, the vacuum-treated yeast cells were recovered from negative pressure. The vacuum-treated yeast cells at 120 h in VF I were collected and inoculated aerobically in fresh YPD medium (10 g/L yeast extract, 20 g/L peptone, and 20 g/L glucose) for 5 h under atmospheric pressure. Subsequently, cells were transferred into the fermentor with high-sugar YPD medium (10 g/L yeast extract, 20 g/L peptone, and 200 g/L glucose) and cultivated for 20 h under atmospheric pressure at 35°C. VF II was performed at a starting cell density of about 9.4 g/L with the same conditions of VF I.
To investigate the cell membranes under the long-term vacuum conditions, yeast cells in different fermentation phases were harvested for lipidome and sterol analysis, separately at cycles 0, 1, 4, 7, 13, 18, and 30 (R0, R1, R4, R7, R13, R18, and R30) during VF I, as well as cycles 1 and 10 (RR1 and RR10) during VF II when residual glucose decreased to about 50 g/L.
Analysis of ethanol and glucose in medium
Glucose, ethanol, and glycerol concentrations in the sample were determined by HPLC (Waters Corporation, Milford, MA, USA) at the following conditions: RI detector (65°C), Aminex HPX 87-H column (BioRad, Hercules, CA, USA) and 5 mM sulphuric acid as eluent.
Identity of cell viability
Cell viability was determined by the methylene blue staining technique. Briefly, 200 μL of sterile methylene blue was mixed with 200 μL of a yeast suspension diluted to reach an O.D. of 0.4–0.7 at 600 nm. The number of stained (inactive) and unstained (active) cells were counted.
Sterol extraction and analysis by GC-TOF-MS
Yeast cells were separated from the medium through centrifugation immediately after sampling and were then washed by deionized water twice. Samples (10 mg dry weight) were frozen and stored in liquid nitrogen with 20 μL cholesterol (0.5 g/L) as the internal standard. Saponification was carried out by dissolving samples in 1.5 M KOH/methanol at 85°C for 90 min. Sterols were then extracted by adding 1 mL of hexane.
Sterol analysis was carried out on a GC-TOF-MS system as described previously (Ding et al., 2009). A total of 1 μL sample was injected with a split ratio of 1:1 by Agilent 7683 autosampler into GC (Agilent 6890), which was equipped with a fused-silica capillary column (30 m × 0.25 mm, 0.25 μm DB-5MS stationary phase, J&W Scientific, Folsom, CA, USA). The injector temperature was 280°C. It was operated on constant pressure mode at 91 kPa. Helium was used as the carrier gas. The column temperature was held at 70°C for 2 min, and then increased to 250°C at 15°C per min. It was then held for 11 min, and then increased to 300°C at 2°C per min. The temperature was then kept at 300°C for 3 min. The transfer line and ion source temperatures were 280 and 250°C, respectively. Ions were generated by a 70-eV electron beam at an ionization current of 40 μA. Two spectra were recorded per second in the mass range of 50–800 m/z with dynamic range extension (DRE) function.
Phospholipids extraction and analysis by LC/ESI/MSn
Phospholipid extractions were carried out as described previously (Xia and Yuan, 2009). Yeast cells were separated from the medium through centrifugation immediately after sampling and were then washed by deionized water three times. After that, the cells were transferred into a fresh glass tube containing 1.5 mL extraction buffer and 0.6 mL acetic acid solution (0.05%). Afterward, another 3 mL of extraction buffer was added to the mixture and the tube was centrifuged to get a three-layer system with the cells in the middle. The bottom layer was then removed and the extract was washed by 1 ml of 1 M KCl and 1 ml water in turn. The extract was dried by vacuum evaporation. The residue was stored in a chloroform methanol (1:1, v/v) mixture containing 0.01% BHT at − 20°C.
Phospholipid analysis was performed on a Finnigan Surveyor HPLC with quaternary gradient pumps coupled with LCQ Advantage Max ion-trap mass spectrometer (ThermoFisher Scientific, Fremont, CA, USA). A BETASIL Silica-100 normal phase column (150 mm × 2.1 mm, 5 μm, ThermoFisher Scientific) was used to separate the extracted phospholipids (PLs). The column temperature was kept at 25°C. A 5-μL solution was injected with an autosampler and washed out (Yang et al., 2007). The flow rate was 0.2 mL/min. Before each run, the column was equilibrated for 25 min.
The MS full scan and data-dependent MS2/MS3 scan were carried out under the negative ESI ionization mode. The MS full scan range was 450–950 m/z. Spray voltage was 4.8 kV and ion transfer capillary temperature was 300°C. Nitrogen was used as the sheath. Flow rates of nitrogen and the auxiliary gas were set to 35 and 5 units, respectively. For PG and PE, the normalized collision energy for MS/MS experiments with an isolation width of 1.5 U was 35%. For other PLs, the energy was 40%. To trap the produced ions, q value was set to 0.25. The intensity thresholds of the ions in MS2 and MS3 stages were 1 × 10⁵ and 5 × 10⁴, respectively. The mass resolution was 0.6 Da at the half peak height and the isolation width was ±0.5 Da.
Results
Fermentation behavior of S. cerevisiae during the two-round vacuum fermentation
Changes of glucose, ethanol, and glycerol during VF I were shown in Figure 1A. Based on the fermentation duration time in each cycle, VF I process consisted of four phases (I, II, III, and IV) as described in Figure 1A. In phase I (0–10 h) fermentation was performed under atmosphere for one cycle. In phase II (10–30 h), phase III (30–70 h), and phase IV (70–400 h) fermentation was processed under vacuum for 30 cycles. As fermentation progressed, the consumption of glucose and production of ethanol became slow, and the duration times in these four phases were 3–4, 10–12, and 16–20 h, respectively. At the end of phase IV, fermentation duration was changed back to 12 h. Through the process of long-term vacuum fermentation, viability of yeast cells in VF I dropped rapidly and less ethanol was produced. To recover the viability of S. cerevisiae, cells at 120 h of VF I were taken out from phase III and cultivated aerobically in fresh medium. These treated yeast cells were applied in VF II to investigate their fermentation capacity. Figure 1B described the changes in glucose, ethanol, and glycerol during VF II. Treated cells in VF II showed an obvious resistance to vacuum stress with a 10-h arrest when exposed to vacuum pressure. After that, the treated cells encountered a continuous rapid fermentation for 60 h with 10 cycles. In these cycles, accumulation of glycerol increased rapidly and reached 100 g/L at 60 h in VF II, which was twice more than in VF I.
Cell growths in VF I and VF II were described in Figure 2. During VF I, cells concentrations reached up to 30 g/L exponentially during the first two phases, and kept stable in phase III; finally, it dropped gradually to 15 g/L during phase IV. When treated cells at 9 g/L were applied in VF II, no obvious exponential growth occurred and cells concentration stayed around 9–12 g/L.

Growth curve for two rounds of repeated vacuum fermentation.
Variations of viable cells, ethanol productivity, and ethanol yield of yeast cells during the two-round repeated vacuum fermentation were shown in Table 1. The viability of yeast cells gradually dropped from 95 to 60% in the first 120 h of VF I; however, viability of treated cells remained at 98% for 60 h in VF II. Results showed that treated cells had even better resistance to vacuum conditions. The average ethanol productivity in VF II was 39.48 g/(L · h), which was about twice than the maximum in VF I and six times than that of batch fermentation (not shown in this study). In addition, even though less growth was observed in adapted yeast, the specific ethanol productivity reached 3.948 g/(L · h) per cell unit, which was six times higher than 0.548 g/(L · h) per cell unit in VF I.
Responsive pathway in ergosterol biosynthesis of S. cerevisiae to the two-round repeated vacuum fermentation
Ergosterol, the main sterol in yeast, is responsible for structural membrane features, such as fluidity and permeability. The knowledge of the ergosterol biosynthesis route in S. cerevisiae, may be useful in the study on resistance mechanisms of cells to environment stress. The dynamic ergosterol profile of S. cerevisiae is illustrated in Figure 3, and 13 sterols were quantified by GC-TOF-MS. Among the possible pathways to produce the ergosterol, the main one was from squalene via lansterol, 4,4-dimetheyl zymosterol, zymosterol, festerol, episterol to ergosterol. In this way, squalene was found to continuously accumulate until the 18th cycle in VF I, whereas ergosterol and fecosterol decreased from the 1st cycle to the 18th cycle. However, at the 30th cycle (g point) in VF I, fecosterol and ergosterol abruptly rose with a decrease of squalene. Lanosterol, 4,4-dimethy zymosterol and ergosta-5,7-dien-3β-ol reached their maximum at the first cycle, whereas ergosta-8-en-3β-ol, ergosta-7,22-dien-3β-ol, and ergosta-7-en-3β-ol had a abrupt reduction at first cycle. Zymosterol, fersterol, and episterol passed a gradual reduction during VF I. However, ergosta-5,7,22,24(28)-tetra-en-ol remained at a stable level. This might be mainly due to the lack of oxygen in the vacuum process; squalene could not be converted to ergosterol easily. We also found 24-methylene-24, 25-dihydrolanosterol (eburicol) in a branch way, a C-31 derivative that is usually present in fungi (Harmouch et al., 1995). It accumulated as the fermentation processed, and then decreased in the 30th cycle. The presence of eburicol suggested that the effect of vacuum environment on ergosterol biosynthesis was inhibiting lansterol 14α-demethylases.
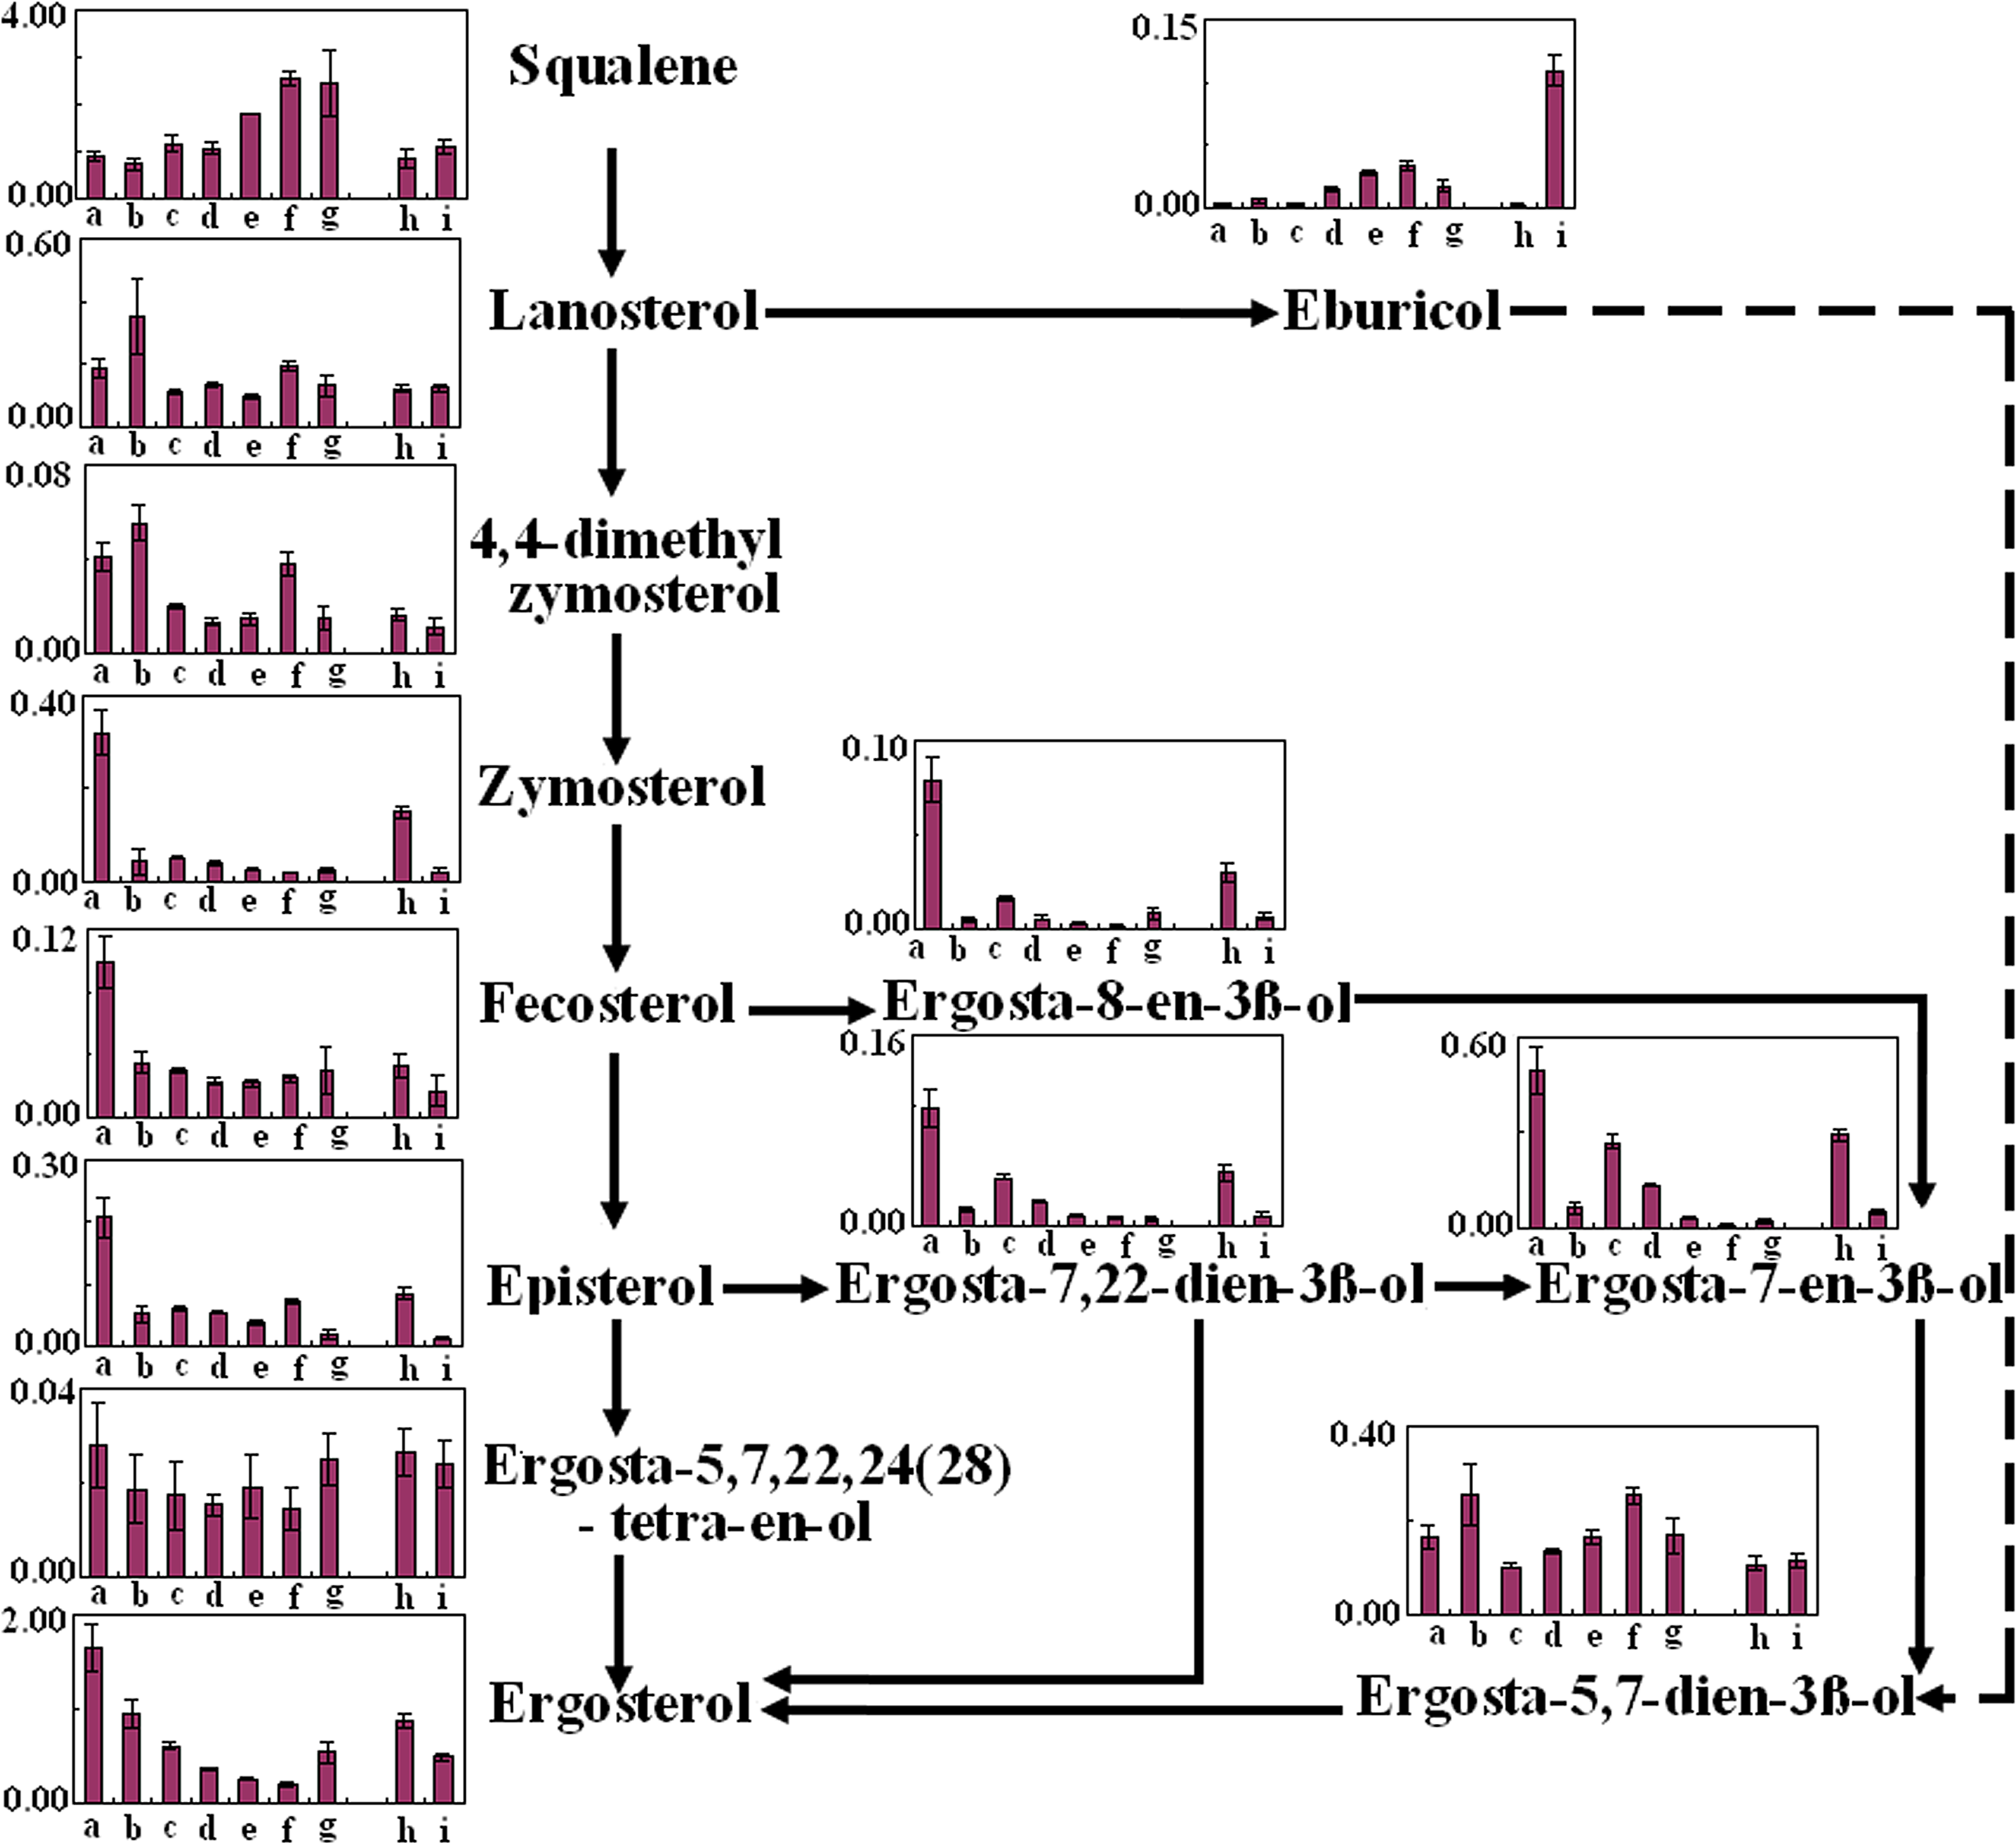
Biosynthetic pathways from squalene to ergosterol in S. cerevisiae during VF I and VF II. Samples a, b, c, d, e, f, g, h, and i are corresponding to R0, R1, R4, R7, R13, R18, R30, RR1, and RR10. Error bars represent standard deviations; where not seen, they lie within the symbol (n ≥ 3).
A similar sterol profile was also observed in VF II. The contents of sterols in treated cells at RR1 of VF II were recovered close to those in industrial yeast cells at R0 of VF I. However, during VF II, little variations of squalene, lanosterol, 4,4-dimethy zymosterol ergosta-5,7,22,24(28)-tetra-en-ol, and ergosta-5,7-dien-3β-ol could be observed. Except for the fact that eburicol had great acuumulation in VF II, other sterols including zymosterol, fecosterol, episterol, ergosta-7-en-3β-ol, ergosta-8-en-3β-ol, ergosta-7,22-dien-3β-ol, and ergosterol were reduced as those in VF I.
Phospholipids profile of S. cerevisiae during the two-round repeated vacuum fermentation
Six groups of phospholipids (PLs) including phosphatidylglycerol (PG), phosphatidylethanolamine (PE), phosphatidylcholine (PC), phosphatidylinositol (PI), phosphatidylserine (PS), and phosphatidic acid (PA), were analyzed by LC-ESI/MSn. A total of 139 species were identified, including 12 species of PG, 20 species of PE, 31 species of PC, 24 species of PI, 32 species of PS, and 20 species of PA. Quantitative analysis of the six groups of PLs revealed that PE, PI, and PC were the predominant PLs in S. cerevisiae, and PA, PS, and PG followed. The different changing trends for these phospholipids are described in Figure 4. As VF I proceeded, the relative abundance of PE, PG, and PS decreased as vacuum fermentation, then increased gradually. However, the content of PI reached its maximum level at the 13th cycle, which is the edge between phase II and phase III. Additionally, the content of PC gradually decreased to a low level during VF I. During VF II, the abundances of PI and PA increased, whereas all other PL decreased.
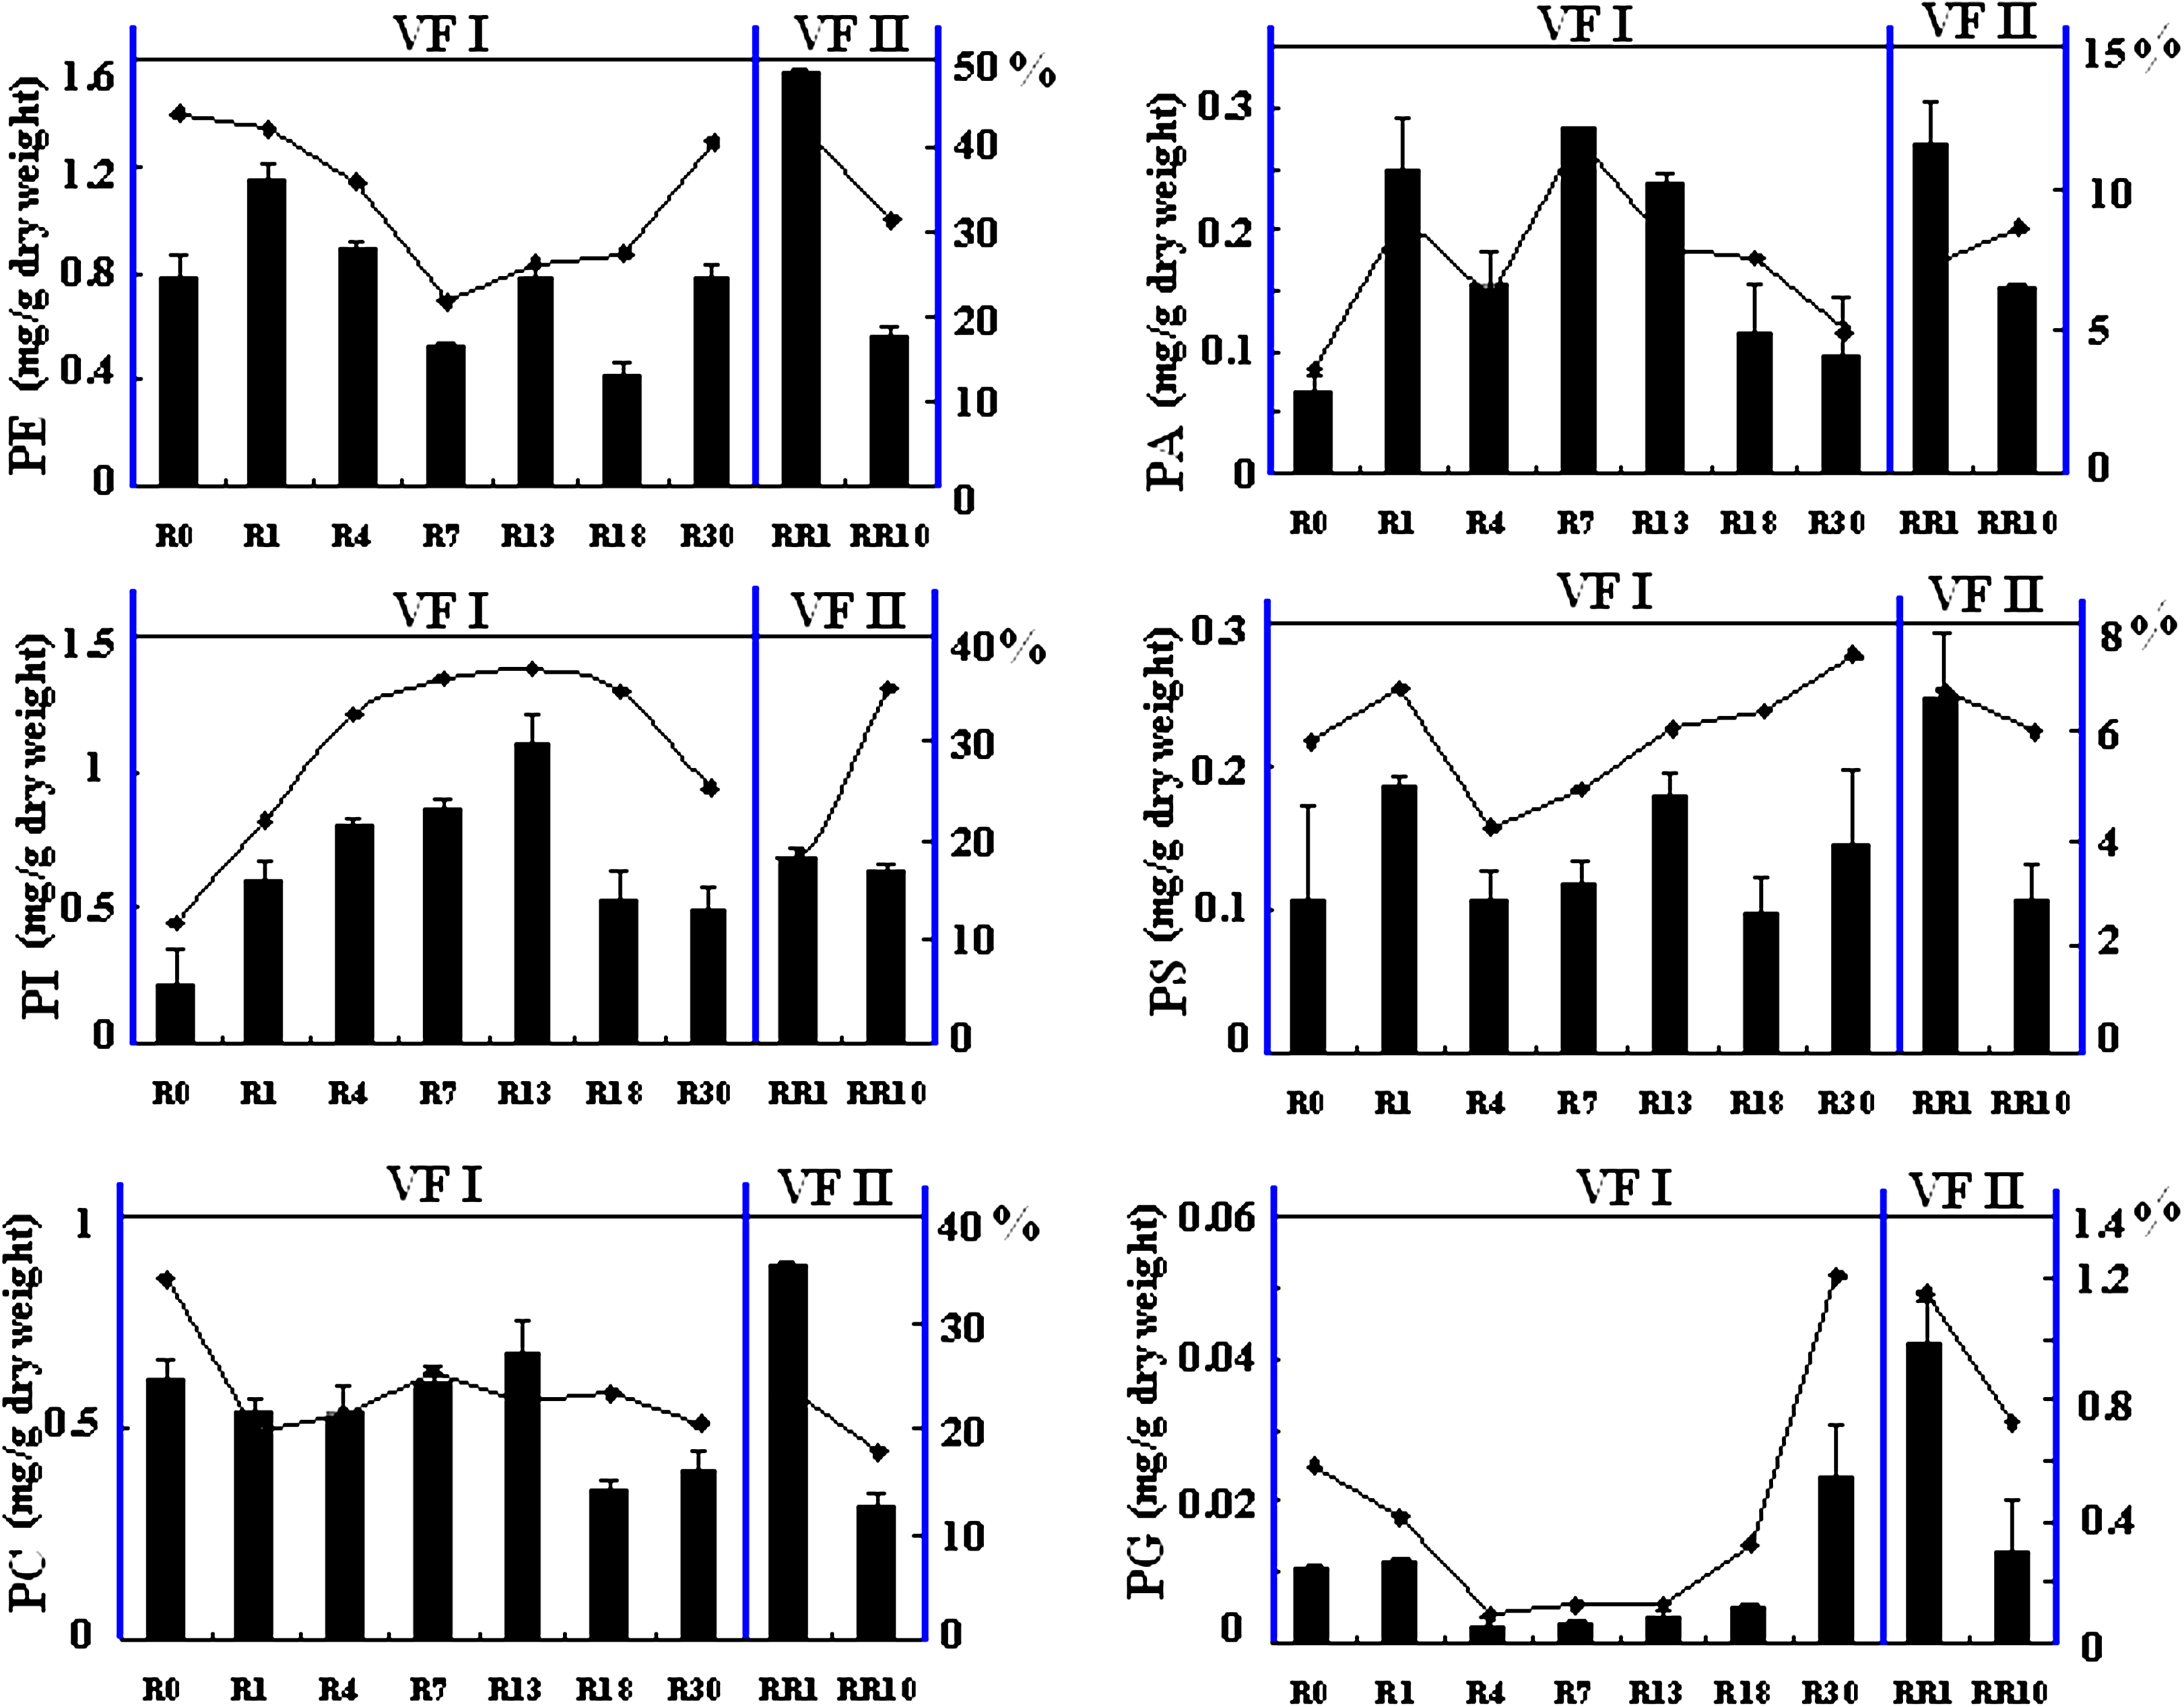
Profiles of different phospholipid species in S. cerevisiae during VF I and VF II. Left axis indicates the amounts of phospholipid, and right axis shows the relative abundance of them. Sampling time of R0, R1, R4, R7, R13, R18, R30, RR1 and RR10 are indicated in Figure 1. Error bars represent standard deviations; where not seen, they lie within the symbol (n ≥ 3).
Myo-inositol as the direct precursor of phosphatidylinositol (PI) in S. cerevisiae (Nikawa and Yamashita, 1997) was found to decrease from R0 to R13, then kept stable until R30 during VF I (Ding et al., 2009). In the analysis of phospholipids compositions as shown in Figure 4, PI showed the corresponding changes that were continuously synthesized until the 13th cycle in VF I and then they dropped to a stable level; however, PC was steadily synthesized until the 13th cycle, and after that decreased to a much lower level. PG was decreasing at the 4th cycle, but started to increase at the 30th cycle in VF I. The contents of PE, PA, and PS were varied during VF I. After recultivated, the synthesis of PE, PA, PS, PC, and PG in the treated cells were enhanced, and they all decreased during VF II. However, during VF II, no obvious changes happened to the synthesis of PIs. This was in accordance with the study carried out by Chi et al. (1999), in which yeast cells with a higher content of PI, can produce ethanol much more rapidly and yeast cells with a higher concentration of PI lost their viability much more slowly.
Multivariate statistical analysis on phospholipids in S. cerevisiae during the vacuum fermentation
To investigate the metabolic difference of phospholipids species, a PCA model was established to analyze the lipidome data under vacuum fermentations. The score plot from the lipidome data of VF1 in Figure 5A showed the similarities and differences of samples among the different cycles. Projection of the resulting sample scores for the first and second principal components, which accounted together for 80.7% of the total sample variances, separated the three groups. Furthermore, the discrimination of different phospholipids species under vacuum fermentation was mainly realized by the first principal component (which contributed 55.1% to the total variances). Although there was no significant difference between the contributions of first and second principal component, samples at R0 and R1 were gathered together, whereas samples at R30 were discriminated from other samples at R4, R7, R13, and R18. The difference made by the phospholipids was similar to the discrimination of different fermentation performance under vacuum fermentation. The changing trends of the phospholipids in yeast cells from VF I also suggested that the effect of vacuum fermentation on phospholipids in yeast cells was not instant after vacuum began, whereas a gradual variance was detected until R30. The corresponding loading plot (Fig. 5B) showed several possible biomarkers for distinguishing various samples were minor PI, PE, and PC. The biomarkers for the discrimination of all the samples were complex, but PI 26:0, PI 28:0, PE 32:1, and PE 34:1were the predominant biomarkers.
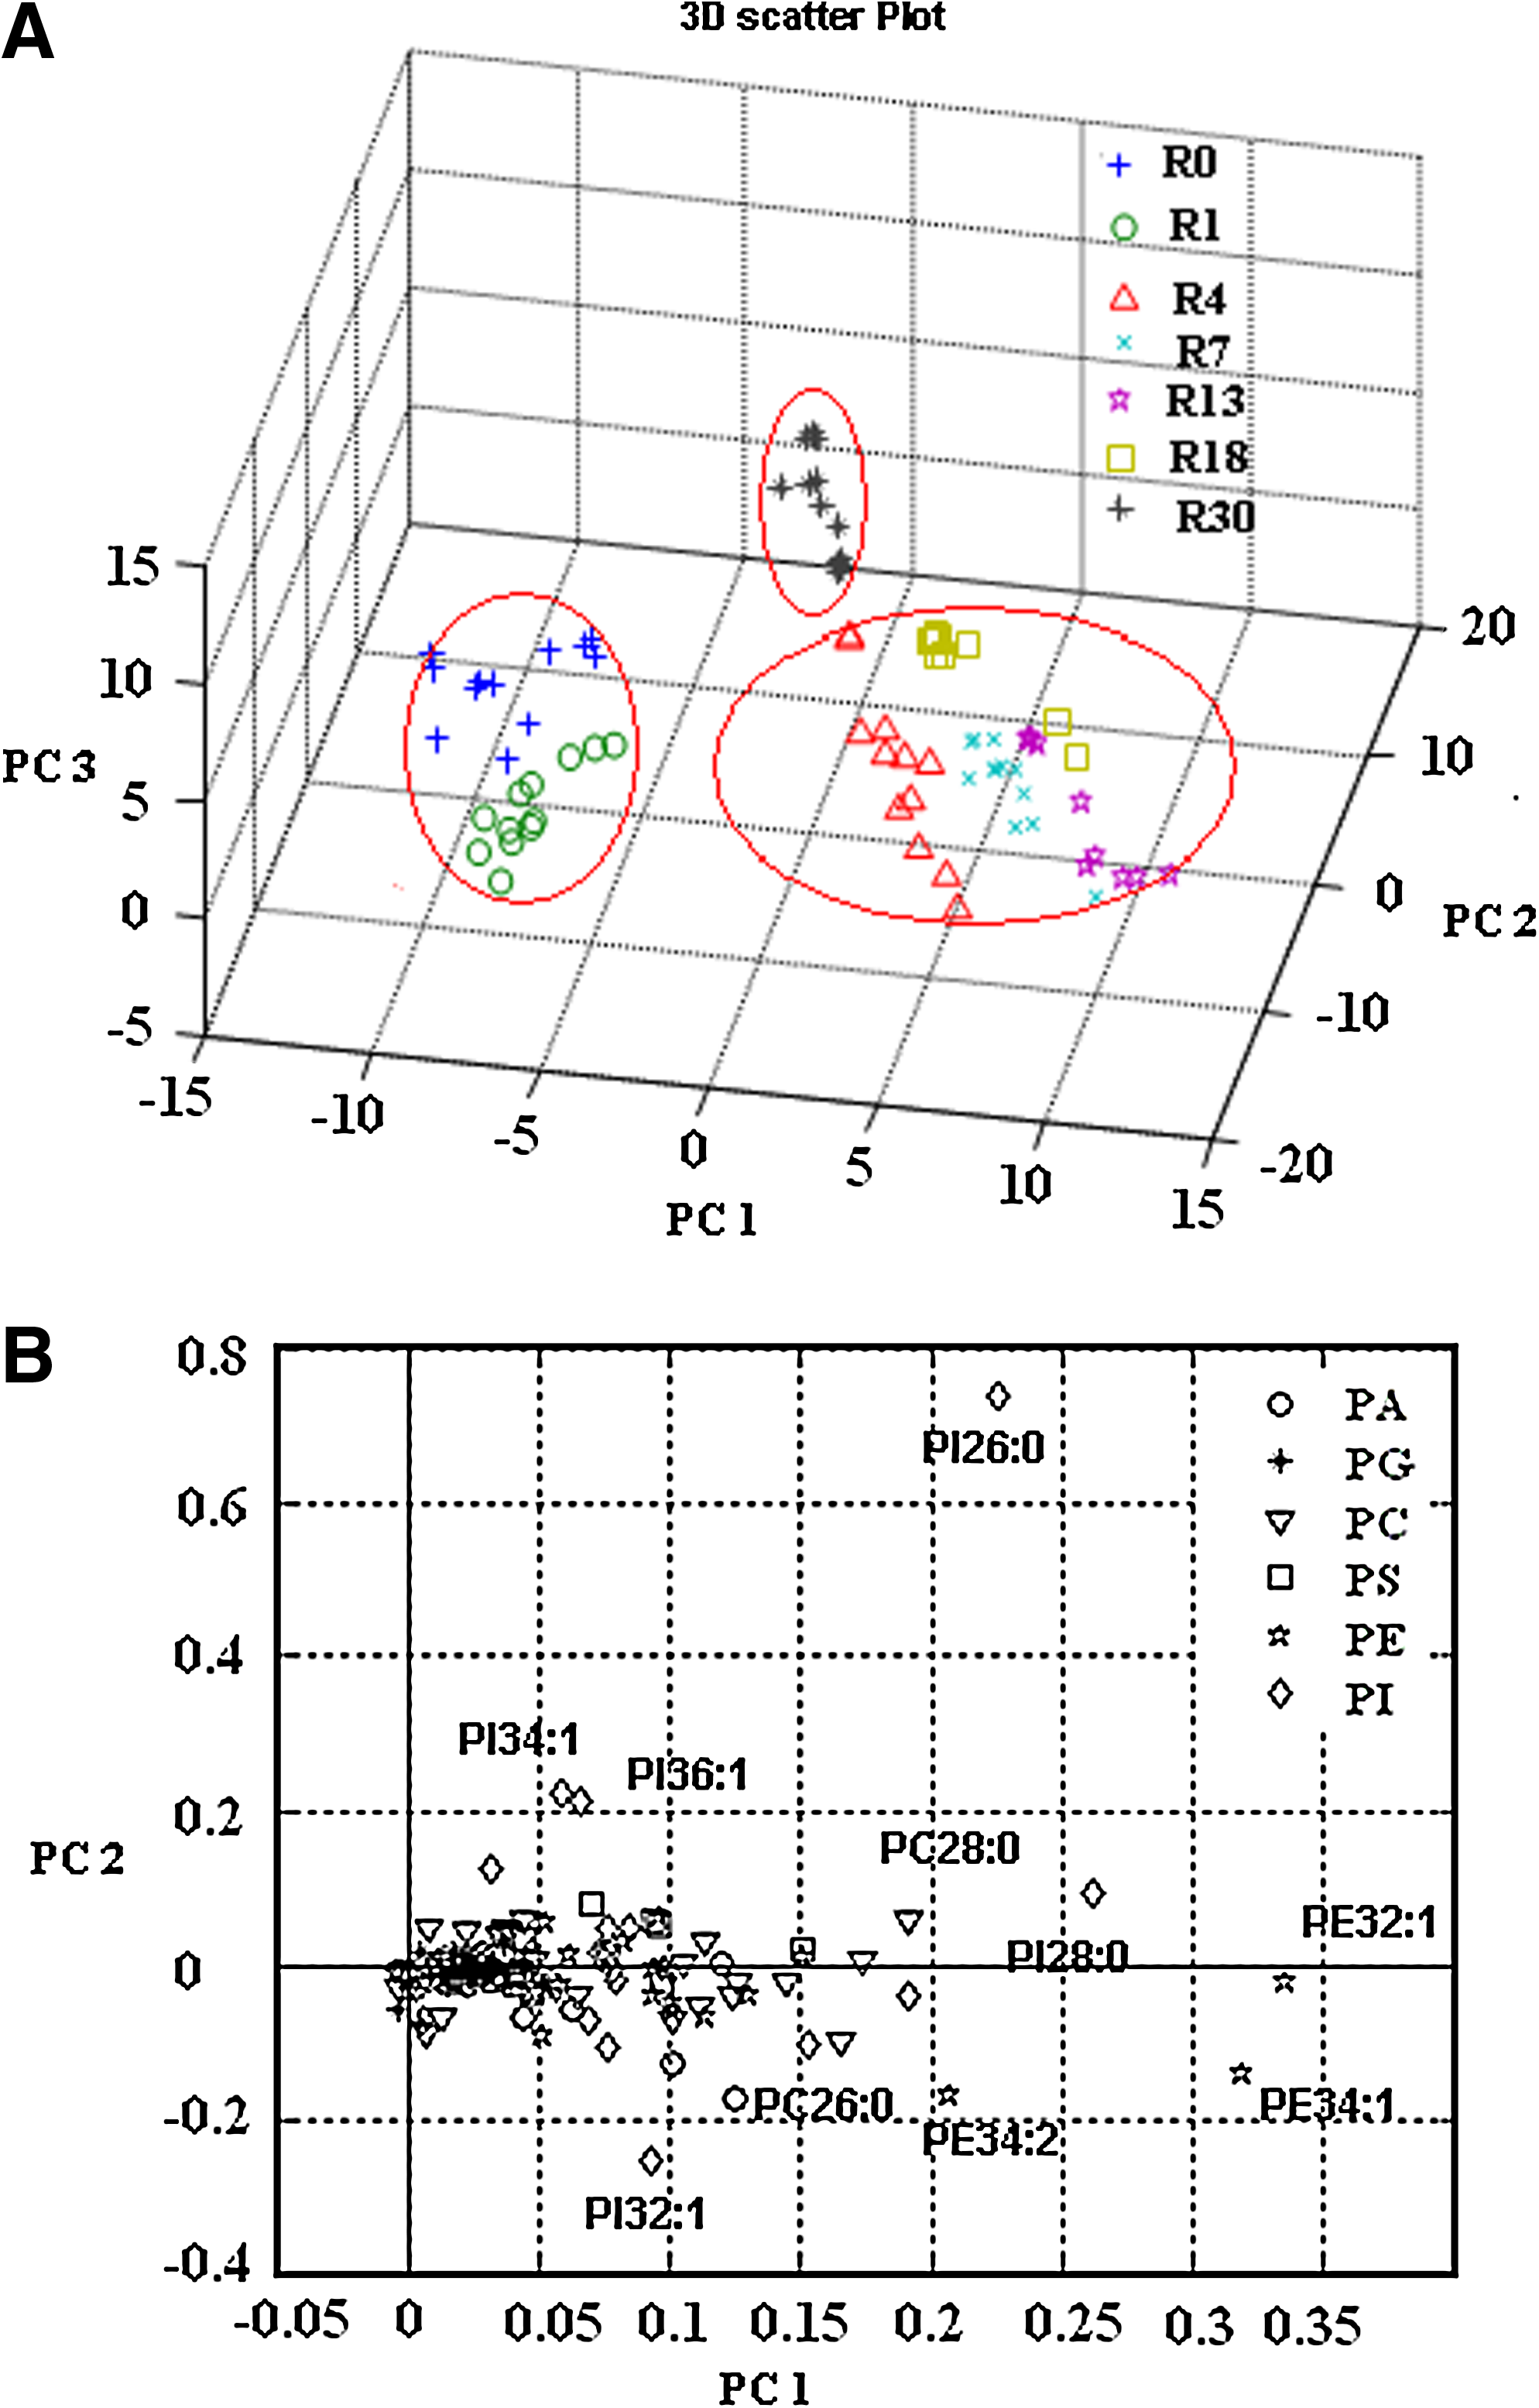
Multivariate statistical analysis of lipdome for S. cerevisiae cells in VF I.
PE, which has a smaller head groups than acyl chains, is cone shaped. It may induce a locally high membrane curvature and membrane-packing defect when it is at high concentration (Van der Rest et al., 1995). In our research, high amounts of PE 32:1, PE 34:1, and PE 34:2 were observed in Figure 6. It indicated that the palmitic acid (C16:0) and stearic acid (C18:0) were the most predominant carbon chains in PE, whereas palmitoleic acid (C16:1) and oleic acid (C18:1) were the major unsaturated species. As vacuum fermentation processed, the unsaturated PE species (PE 32:1, PE 32:2, PE 34:1, PE 34:2, PE 36:1, and PE 36:2) were decreased and then increased in VF I. All PE species in treated cells were elevated after recultivated, and then dropped during VF II. For the PI groups (Fig. 6), high amounts of PI 26:0, PI 28:0, and PI 34:1, together with low amounts of PI 24:0, PI 30:0, and PI 32:1, were detected. In addition, for the PC groups, PC 26:0, PC 28:0, and PC 34:1 were the major ones. PIs, with short chains, such as C24, C26, and C28, first increased and then decreased during VF I, whereas those with long chains showed totally opposite changes. However, except for the fact that the biomarks of C26:0 and C28:0 were increased in VF II, other species all tended to be reduced. Similarly, PC (Fig. 6) with short chains were observed to increase first, followed by a decrease, for example, C26, C28, and C30, whereas species with long chains conversely varied during VF I. As well, biomarkers PC26:0 and PC28:0 tended to increase in VF II, which were different from other PC species. These results suggested the effects of vacuum fermentation on PE, PI, and PC with different chain lengths were varied.
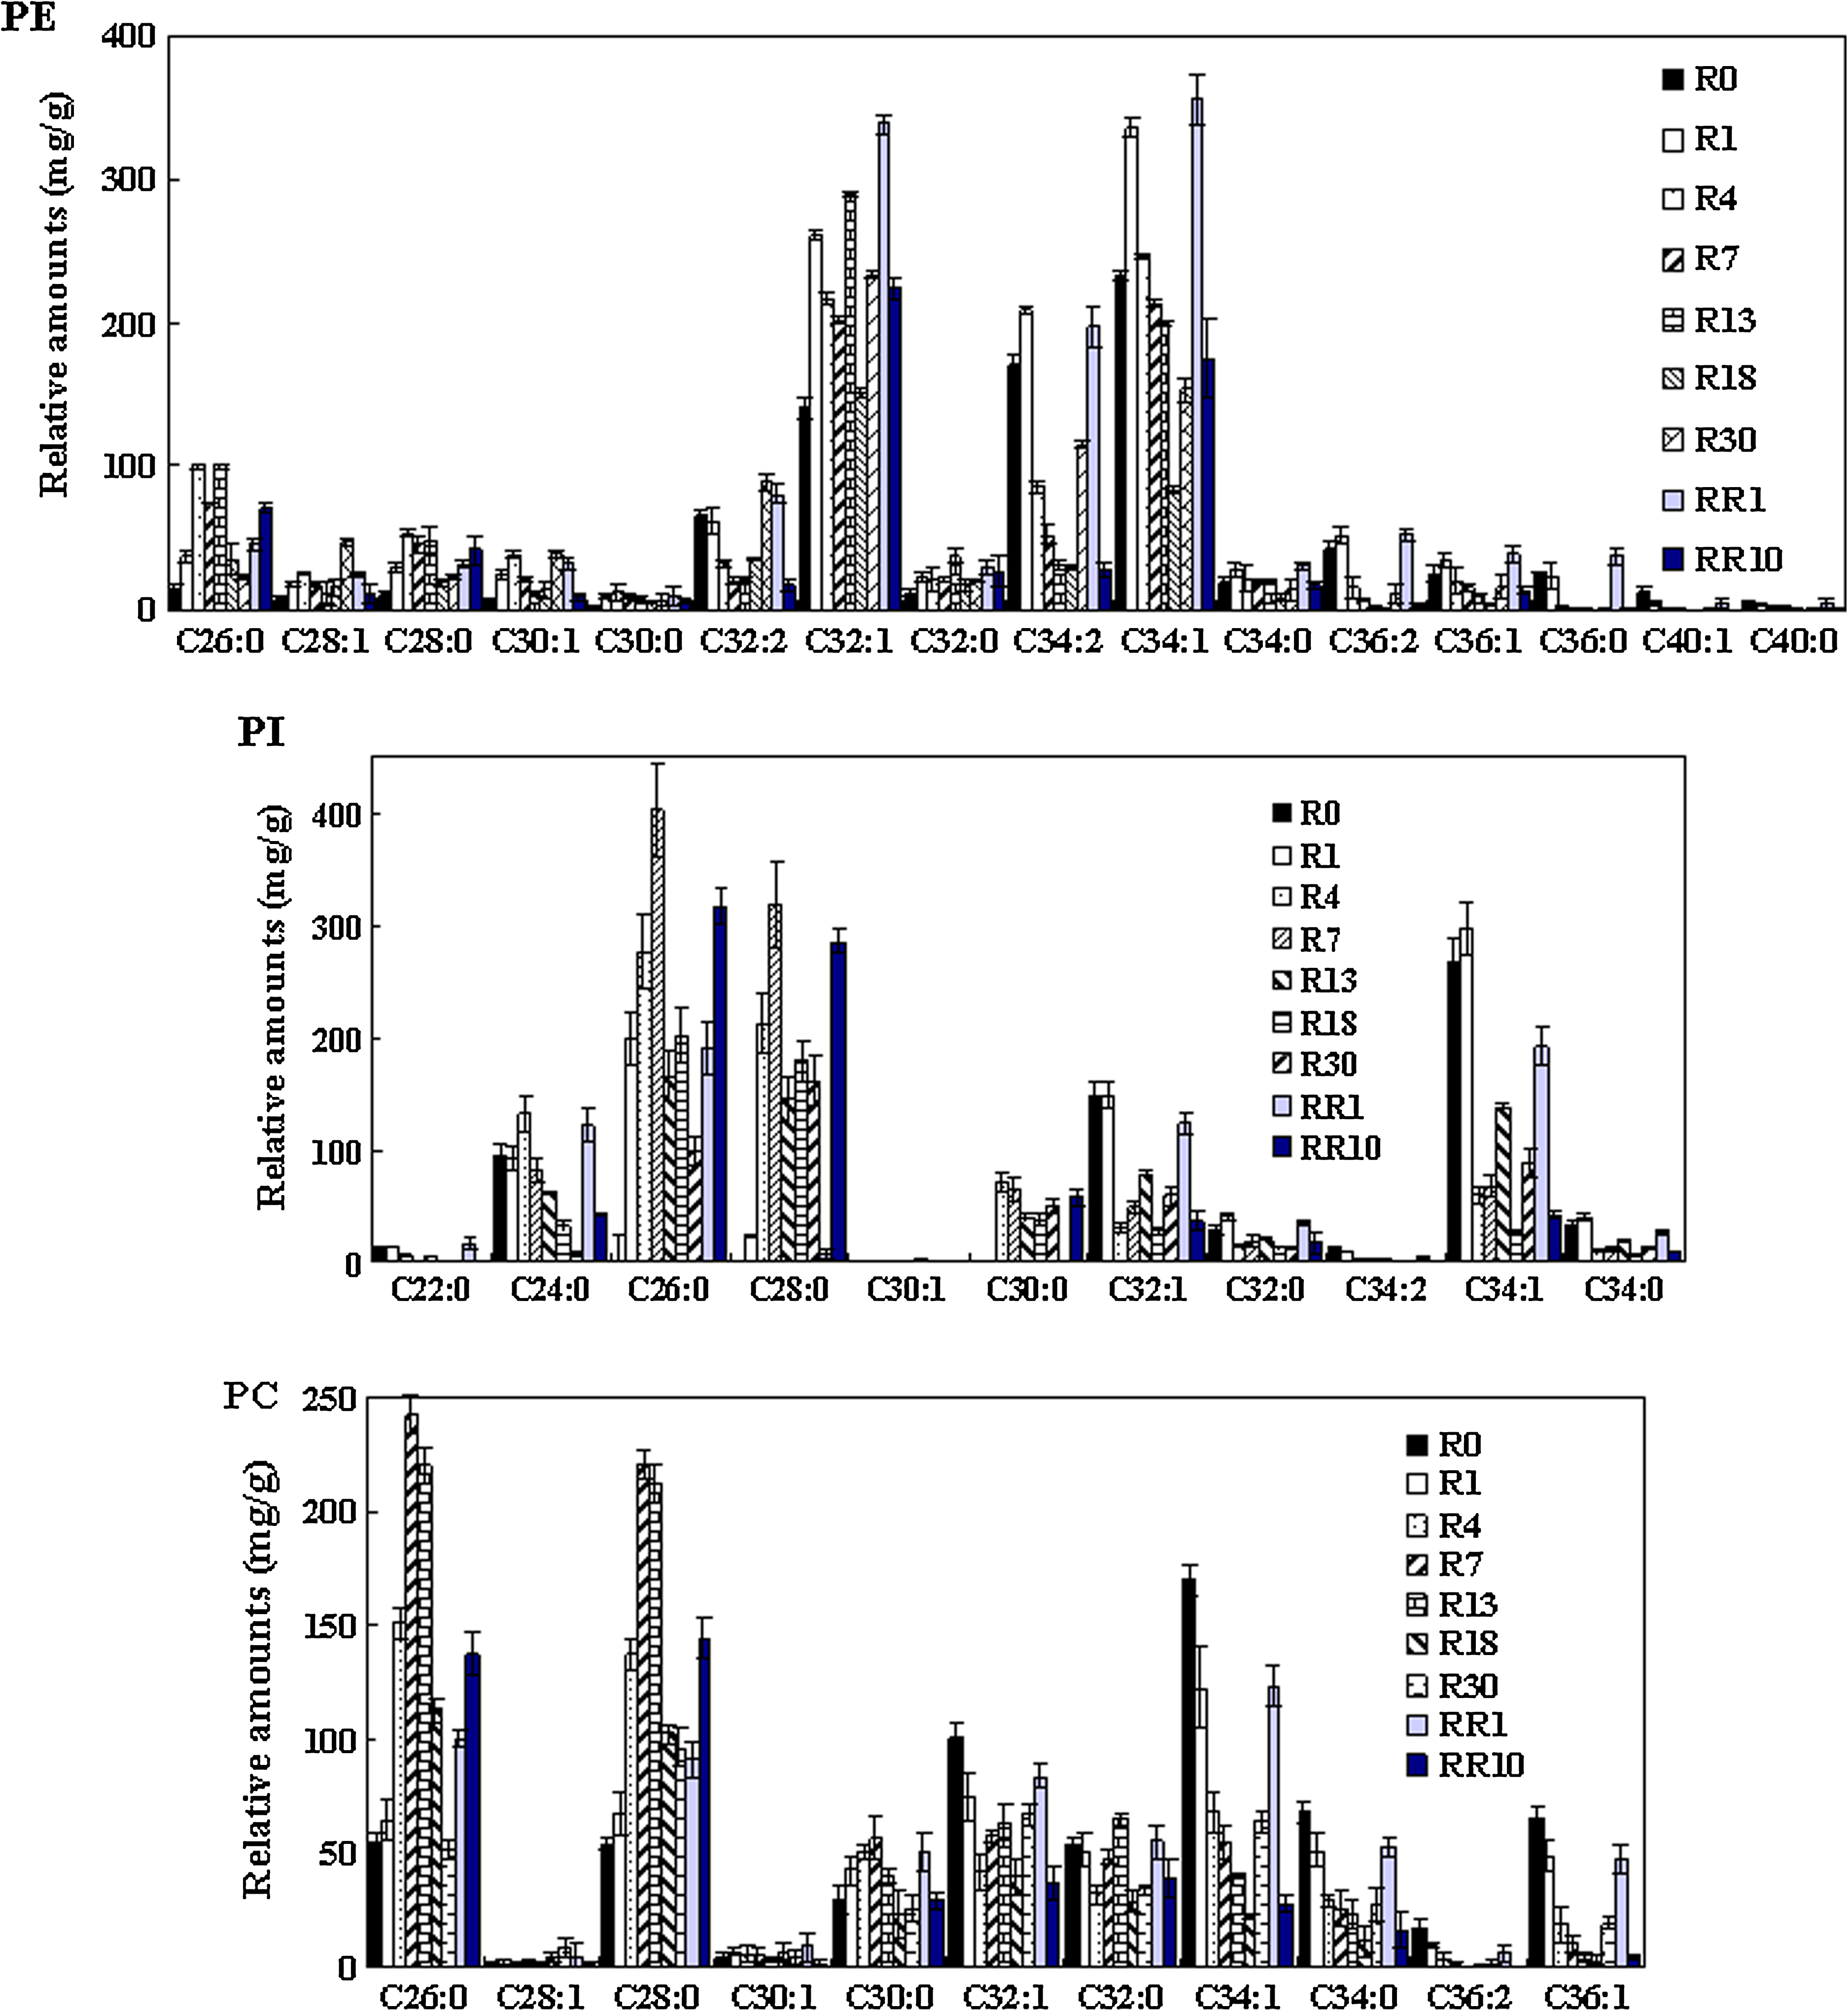
Relative abundance for different PE, PI, PC, molecules during VF I and VF II. Error bars represent standard deviations; where not seen, they lie within the symbol (n ≥ 3).
Variations of chain length and degree of unsaturation in phospholipids
Chain length and degree of unsaturation in phospholipids have a strong impact on membrane fluidity, which is the prerequisite for specific membrane proteins to maintain their biological activity (Wriessnegger et al., 2009). Unsaturation degrees in these phospholipids during VF I and VF II were investigated. Figure 7A indicated that the saturated PLs firstly increased from the 1st to the 13th cycle in VF I, and then decreased until the 30th cycle. Both mono-unsaturated and di-unsaturated PLs showed an opposite trend to saturated PLs. This might be due to the absence of oxygen during this process. The changes of saturation levels in PLs will result in the decrease of membrane fluidity, the subsequent loss of membrane integrity, and the reduction in the total phospholipid level. After being treated with recultivation aerobically, the increase of saturated PLs with a decrease of mono-unsaturated and di-unsaturated PLs was observed during VF II.

Further analysis of the distributions of the hydrocarbon chains in Figure 7B showed that during VF I, PLs with short chains (C26, C28, and C30) were elevated and then dropped, whereas those with long chains (C32, C34, and C36) decreased first, then increased as vacuum fermentation was performed. As a result, the difference between the relative abundances of PLs with short chains and those with long chains was lessened. After being treated with aerobic recultivation, PLs with the long chains were enhanced in VF II and tended to drop as VF II proceeded. The changes of PLs with short chains exhibited opposite trends. The changes in phospholipids in the two-round repeated fermentation suggested membrane fluidity may be related with the adaption of yeast cells to vacuum fermentation.
Discussion
The most attractive and powerful aspect of “omics” approaches was their ability of profiling all or as much as possible molecules or substances simultaneously. In this article, lipidomics, a branch of metabolomics strategy, was carried out to offer sterols and phospholipids profiling information for the S. cerevisiae membrane during repeated vacuum fermentation. Our research attempted to elucidate the defense responses of yeast cells membranes under the extreme long-term stress conditions.
Two routes in ergosterol biosynthesis under vacuum environment
Ergosterol is known as the main sterol in yeast cells and responsible for structural membrane features, such as fluidity and permeability (Parks and Casey, 1995). In the postsqualene ergosterol biosynthetic pathway, the enzymatic transformation of squalene to ergosterol takes place (Mantzouridou et al., 2009). A previous study found that oxygen deficiency directly resulted in a decrease of ergosterol and an accumulation of squalene and lanosterol (Maczek et al., 2006). In fact, sterol analysis in our study revealed ergosterol was the predominant sterol only at the beginning of VF I, whereas there was a prevalence of sterol intermediates lanosterol, ergosta-5,7-dien-3ß-ol, and eburicol in S. cerevisiae as VF I was performed. Furthermore, lanosterol did not keep increasing as expected, but an accumulation of eburicol with a great decrease of ergosterol was detected in the first 18 cycles of VF I. A similar relationship between eburicol and ergosterol had been reported in filamentous fungi and plants, such as Venturia inaequalis (Shirane et al., 1996) and Cryptococcus neoformans (Nes et al., 2009), suggesting that the transmethylation process on the C-24 may occur directly on lanosterol and not only on zymosterol. This also implied that two routes exist from lanosterol to ergosterol under vacuum conditions: the classical one via a direct C-14, C-4 demethylation of lanosterol, and the second one via the formation of eburicol followed by demethylations.
An increased conversion of lanosterol to eburicol at the expense of conversion to 4,4-dimethyl zymosterol (illustrated in Fig. 3) was also found, as well as an enhanced conversion of episterol to ergosta-7,22-dienol and ultimately ergosta-7-enol at the expense of ergosta-5,7,24 (28) trienol. By altering the pathway at this particular point, ergosterol biosynthesis was inhibited and the cell would lose susceptibility to vacuum fermentation. Barker et al. (2004) showed that the overexpression of the ergosterol biosynthesis genes ERG5, ERG6, and ERG25 in Candida albicans might support the conversions of lanosterol to eburicol.
As a specific responsive sterol intermediate to vacuum fermentation, eburicol greatly increased the permeability and fragility of the membranes, and it was unable to support cell growth, even disturbed membranes, because its two methyl groups at C-4 would grossly perturb membrane function (Vanden Bossche et al., 1993). Therefore, during VF II, greater accumulation of eburicol might predominately be attributed as the cause of treated cell growth arrest. Thus, analysis of sterol content in the S. cerevisiae suggested that the effect of vacuum fermentation on yeast cells be the accumulation of sterol intermediates consistent with inactivation of lanosterol demethylase.
The synthesis of phospholipids in S. cerevisiae under vacuum fermentation
As an essential phospholipid for yeast, PI has many physiological functions in cell morphology, metabolic regulation, and signal transduction. Studies showed that PI synthesis was increased at the expense of cellular pools of CDP-DAG when inositol was added into the growth medium (Carman and Henry, 2007; Loewen et al., 2004). However, inositol directly inhibited the activity of the CHO1-encoded PS synthase, which resulted in the decrease of PS and PC. PI synthesis enhanced in zinc-depleted cells, due to the Zap1p mediated induction of PIS1 gene expression (Han et al., 2005), whereas the effects of zinc depletion on phospholipid composition involved a decrease in PE but no significant change in PC (Iwanyshyn et al., 2004). Moreover, Carman and Henry (2007) showed that regardless of whether cells were supplemented with inositol or were depleted of an essential nutrient, an increase in PI synthesis resulted in a decrease in the PA level, as well as a loss of Opi1p association with the nuclear/ER membrane, followed by Opi1p translocation into the nucleus. Our results found that an increase of PI synthesis occurred from R0 to R13 and decreased at the end of VF I. No continuous reduction in PA level was observed. On one hand, PA synthesis might be affected under vacuum conditions, which related with PC synthesis. On the other hand, instead, PI synthesis increased due to a loss of competition between PI synthase and PS synthase for their common substrate CDP–DAG.
The de novo pathways for the synthesis of phospholipids in S. cerevisiae showed that PI, PS, PE, and PC are primarily synthesized from PA via the CDP–DAG pathway (Carman and Han, 2009). Alternatively, PE and PC can be synthesized from the CDP–ethanolamine and CDP–choline branches, respectively, of the Kennedy pathway (Boumann et al., 2003). Under vacuum fermentation, PE, PS, and PG synthesis were reduced. Interestingly, PC synthesis was not significantly affected before R13. Maintenance of a normal PC content might be attributed to the PC synthesis via the Kenndey pathyway. It was previously reported that in S. cerevisiae, the methylation of PEs produced predominantly the diunsaturated PC species PC32:2 and PC34:2, and the CDP–choline-derived PCs are enriched in the monounsaturated species PC32:1 and PC34:1 (Boumann et al., 2003). However, during VF I the most prominent PE species were the 34:1 (composed of either C16:0 and C18:1 or C18:0 and C16:1) and 32:1 (composed of C16:0 and C16:1) species (Fig. 6). The diunsaturated species 32:2 PE (two C16:1 acyl chains) and 34:2 (containing a C16:1 and a C18:1 acyl chain) were also detected. Compared with PE, the steady-state species profile of PC was strikingly different, with a high content of 26:0, 28:0 and a reduced content of 32:1, 34:1. The relatively high amounts of PC32:1, PC34:1 offered us a clue that yeast cells under vacuum condition mainly got its PCs from the CDP–choline pathway.
Our group found that the expression level of phosphatidylinositol/phosphatidylcholine transfer protein (Sec14p), involved in regulating PI, PC, and ceramide metabolism, was significantly downregulated during vacuum fermentation (Cheng et al., 2009a). McGee et al. (1994) demonstrated that Sec14p had a negative regulatory effect upon the rate-limiting step in the CDP–choline pathway, catalyzed by phosphocholine cytidylyltransferase. This result suggested that the downregulated Sec14p function might be related to regulation of the CDP–choline pathway to the turnover of PC. Moreover, during VF I, increased contents of PC26:0 and PC 28:0 with short saturated acyl chains occurred. These species were not directly produced either from the PE or Kennedey pathyway, but might be due to the turnover of PC. Therefore, PC species under vacuum conditions accelerated the synthesis and turnover of CDP–choline-derived PC but not of PC formed via methylation of PE.
Unsaturated phospholipids under vacuum fermentation
Consequently, in levels of unsaturated phospholipids in S. cerevisiae, their physical properties such as fluidity and permeability were subjected to a variety of stressors. When cells were subjected to temperature shifts they adapted by increasing the level of unsaturated fatty acids in membranes (Guerzon et al., 1997). Cells under anaerobiosis had a lower level of unsaturated fatty acids and higher membrane fluidity (Mauricio et al., 1998). Due to lack of oxygen, reductions of unsaturated lipids in yeast cells were found from R0 to R18 in VF I. It was strange that unsaturated lipids began to increase from R18 to R30 at the end of VF I. This result cannot support Guerzon's hypothesis that a high unsaturated fatty acid relative content is not a prerequisite for withstanding sublethal temperature stress in yeast but is the result of oxygen-consuming desaturase activation (Guerzon et al., 1997). It was also found that once cells were taken out from R13 of VF I and recultured aerobically, the unsaturated lipids were largely enhanced again, whereas the reduced unsaturated lipids occurred in VF II. It implied that the unsaturated lipids gave a clue to the adaption of cells to a suboptical environment.
Fermentative behavior and lipidomics during the adaptation to vacuum fermentation
Fermentative behavior, lipidomic profiling, including sterol metabolism and phospholipids biosynthesis, showed the coherent adaptation to vacuum fermentation. PI, PC, and PS were found to be in connection with fermentative activity and ethanol tolerance (Arneborg et al., 1995; Chi et al., 1999; Hayashida and Ohta, 1980; Mishra and Kaur, 1991; Shin et al., 1995). A high content of PI was related with the high ethanol production and high ethanol tolerance (Arneborg et al., 1995; Chi et al., 1999).Our results indicated a rapid increase in PI content at the expense of PE and PG from R0 to R13 and then decreased at the end of VF I. It was also found that high ethanol productivity was obtained with an increased PI level during the rapid phases (from R0 to R7) of VF I. However, although PI content kept increasing, vacuum fermentation slowed down ethanol productivity during the cycles from R7 to R13. The slow fermentation and low ethanol productivity might be caused by reduced cell viability. As the PI synthesis dropped during the end of VF I, the percentage of PI decreased and less ethanol was produced.
Through a long adaptation to vacuum fermentation, sterols and phospholipids decreased as fermentation slowed down. Low cell viability and ethanol productivity were obtained at the end of VF I, although yeast cells at R30 showed an adaption to long-term vacuum environment by opposite changes in sterols and phospholipids, as well as the faster fermentation rate. Interestingly, loss of sterols and phospholipids were recovered in treated yeast cells of VF II by aerobically reculturing. The contents of phospholipids species can reach at least higher than them at both R0 and R13 of VF I except PI contents. Therefore, it can explain that the treated cells still had similar membrane features. The larger increase of PI level in VF II might be link to a sixfold specific ethanol productivity in treated cells. Additionally, content of sterol was elevated higher than that at R13 but still lower than R0 of VF I except eburicol contents, which could explain the low growth in treated cells.
Conclusion
Findings on changes in lipid molecular species and the ergosterol biosynthesis pathway elucidate the defense responses of yeast cell membranes during the repeated vacuum fermentation. Reduction of unsaturated lipids, synthesis, and distribution of phospholipids, and accumulation of eburicol in ergosterol biosynthesis were caused by vacuum fermentation. Moreover increased PI contents were associated with the enhancement of the ethanol productivity during the repeated vacuum fermentation. Treatments by recultivating aerobically were useful to recover the yeast cells under vacuum fermentation and obtain higher specific ethanol productivity.
As a new and emerging important omics field, lipidomics is not only helpful to uncover the biological components and events that occur, but good to obtain a quantitative description during the industrial and agricultural processes. This information will be extremely valuable for protection of the cell membranes from the extreme long-term stress conditions. Global analysis of molecular components and states will be further extended to relative integrative biology including transcriptomics and metabolism, and these findings are expected to be to valuable during industrial and agricultural processes.
Footnotes
Acknowledgments
The authors are grateful for the financial support from the National Natural Science Foundation of China (Key Program Grant No. 20736006), the National Basic Research Program of China (“973” Program: 2007CB714301), and Key Projects in the National Science & Technology Pillar Program (No. 2007BAD42B02).
Author Disclosure Statement
The authors declare that no conflicting financial interests exist.