
Abstract
Abstract
Systems biology proposes a multidisciplinary approach of biological systems, in order to obtain global and quantitative models of their functioning. This review presents an overview of 10 years of systemic analyses of the cellular responses to environmental stresses, using one of the favorite postgenomics models: the budding yeast Saccharomyces cerevisiae. These analyses include the global reconstruction and the dynamic modeling of the regulatory networks involved in the adaptation of the cells to environmental fluctuations and the extension of these approaches to other yeast species, to provide insights in the mechanisms that drive the evolution of the biological network properties.
Introduction
The yeast Saccharomyces cerevisiae has been at the forefront of these postgenomics changes. The simplicity of its genome and the high quality of its functional annotation made this yeast a valuable eukaryotic benchmark for all the recent postgenomics technologies (Goffeau, 2000; Pena-Castillo and Hughes, 2007). More recently, the sequencing of the genomes of a dozen of other yeast species and of more than 70 Saccharomyces cerevisiae strains has placed yeasts at the forefront of genomic evolutionary studies (Dujon, 2005; Souciet et al., 2009).
Cellular responses to external stress are particularly attractive models for the analyses of the functioning of biological networks. They are fast, highly dynamic, plastic, and complex, involving the temporal coordination of many different cellular pathways at all known levels of regulation, from transcriptional to posttranslational modifications (Nevitt and Rodrigues-Pousada, 2006). Moreover, they are directly responsible for the cell adaptation to the fluctuations of the environment, and therefore potentially very informative in terms of biodiversity of genetic circuits in different ecological niches, and of genome/environment relationships along evolution (Gasch, 2007). The aim of the present review is to summarize how the study of the stress responses in yeasts came from a rather focused point of view made of independent, specialized pathways in one model species (S. cerevisiae), to the systemic analyses of the structure and of the dynamic of large cellular networks in an evolutionary perspective. Although most of the works mentioned below focused on transcriptional regulations, the methods used can also be applied to posttranscriptional and posttranslational events. This is why we will use the ambiguous but general terms of “regulatory” or “biological” networks in this review.
The Structure of the Regulatory Networks Involved in Stress Responses: a Story of Edges and Arrows
Stress responses entered the postgenomics era in 2000, when Audrey Gasch and her colleagues analyzed the kinetic transcriptome responses of yeast cells to a large battery of environmental changes (Gasch et al., 2000). They observed that stress responses are global, fast, and made of many different functional modules, the largest and most obvious of them being the Environmental Stress Response (ESR), a group of genes whose expression is modulated by virtually every condition tested. This study was a great source of inspiration for those who were beginning to think about stress responses as cellular networks. Since then, hundreds of publications analyzed the global topology of the genetic networks involved in the yeast response to environmental fluctuations, that is, to establish the functional relationships that connect all the genes involved in the cell response to a particular stress. Examples of such studies include the analyses of the cellular networks involved in carbon source shifting (Ideker et al., 2001b), DNA damage (Tan et al., 2008; Workman et al., 2006), antifungal treatment (Fardeau et al., 2007; Lucau-Danila et al., 2005) or exposure to toxic metalloids (Haugen et al., 2004; Salin et al., 2008). Most of these works used a more or less similar rationale, which can be divided into four steps presented below (summarized in Fig. 1).
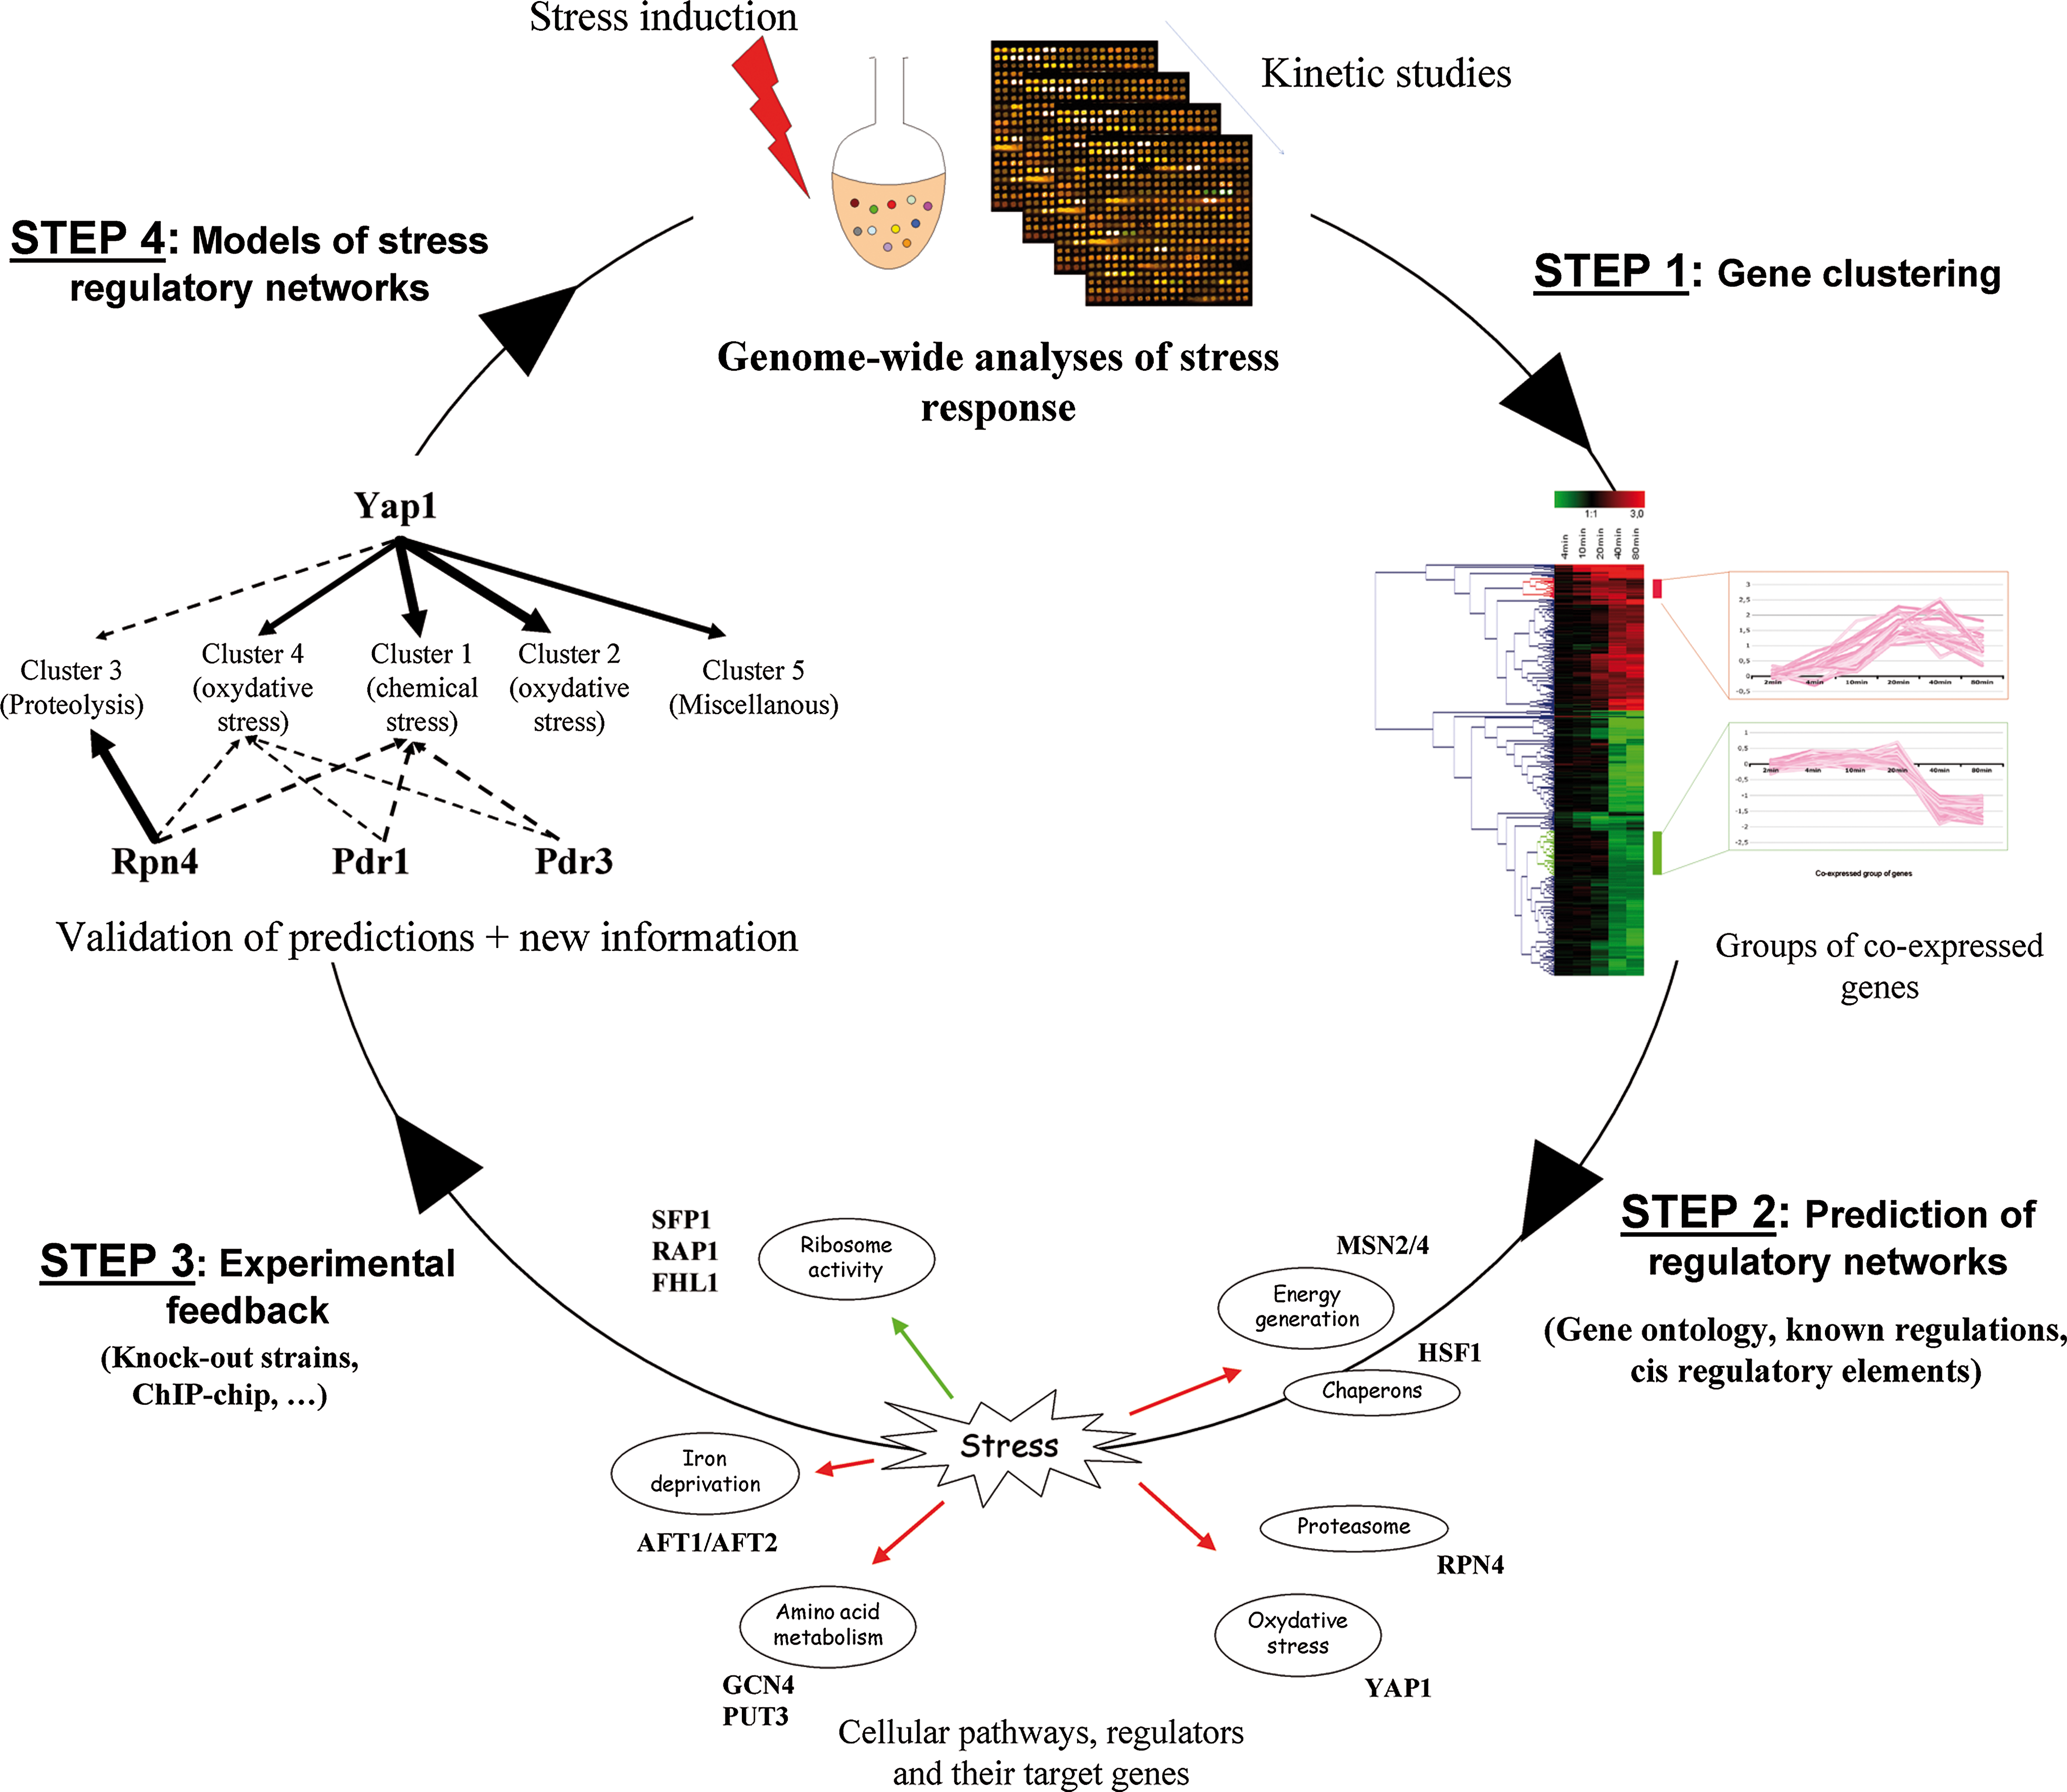
The virtuous circle of stress regulatory networks reconstruction. See main text for detailed descriptions of the four steps illustrated here.
Step 1: Gene Clustering from Kinetic Transcriptome Experiments
Gene clustering is one of the most popular methods to analyze expression data (Ihmels et al., 2002; Segal et al., 2003; Spellman et al., 1998; Wang et al., 2002). It is based on the assumption that genes with similar expression profiles, that is, genes that exhibit a significant correlation between their expression variations in response to a given stress, are likely to participate to the same functional module and to have similar regulations (Hughes et al., 2000; Segal et al., 2003). The aim of clustering methods is therefore to identify clusters of genes that exhibit both internal cohesion (the intracluster variability is low) and external isolation (the intercluster distances are high). In the literature, two major types of clustering methods are proposed, that is, hierarchical and partitioning. Hierarchical methods start with each gene considered as a separate cluster. At each successive step in the clustering procedure, two of the clusters are merged together, until only one cluster, comprising the entire dataset, remains. This results in a hierarchical tree, in which the proximity of the genes reflects the similarity of their expression profiles. Partitioning methods produce distinct, nonoverlapping, clusters. Each gene is allocated to the cluster with which it is most similar, using a correlation criterion between gene expression measurements.
Step 2: Prediction of the Regulatory Networks Connected to Gene Clusters
Clustering approaches represent the basic level of regulatory network structure inference. The next step is to identify the parameters (regulatory proteins or RNAs, cellular pathways, experimental conditions) that are responsible for the observed gene expression profiles. Gene clustering can identify the regulators of a particular module, provided that this regulator is itself regulated at the level of RNA expression (Segal et al., 2003). However, in many cases, the key regulators are “hidden variables,” which means that their activity is not regulated at the level of transcription and therefore cannot be predicted from mRNA profiling data only. Then, it is necessary to combine gene expression clustering with other experimental approaches (Ideker et al., 2001b) and bioinformatic tools that mine the various data (Gene Ontology, protein–protein, and genetic interactions, transcriptional and posttranscriptional regulations, subcellular localization of the corresponding proteins, known cis-regulatory motifs, etc.) available on each gene composing a module (Bussemaker et al., 2007a, 2007b) or that identify transcriptional and posttranscriptional cis-regulatory elements enriched in a particular gene cluster (Foat et al., 2005, 2006). The data mining tools used in the literature provide simple compilations of the available information (e.g., YEASTRACT for transcriptional regulations) (Teixeira et al., 2006) or statistically relevant scores of the categories of information that are enriched in a gene cluster [e.g., SGD GO term finder for Gene Ontology, T-profiler for transcriptional regulatory interactions) (Boorsma et al., 2005), FUNSPEC for protein protein interactions (Robinson et al., 2002), etc.]. More sophisticated softwares, like Cytoscape, provide a general framework to model, visualize and query global biological networks based on any source of available experimental data (Cline et al., 2007; Shannon et al., 2003).
Step 3: Experimental Feedback
Step 2 usually results in predictions of the regulatory networks underlying the observed gene expression changes. These predictions are generally accompanied by statistical scores quantifying the possible error rate, but in fine only experimental approaches can formally validate and refine the regulatory interactions actually occurring in vivo. The predicted regulators can be genetically engineered into gain of function mutants, to reveal their target genes (Devaux et al., 2001), or the transcriptome response of strains knocked out for these regulators can be characterized, to quantify their role in the stress response (Hu et al., 2007). However, these two approaches do not distinguish between the direct and indirect effects of a regulator. The power of the experimental analyses of the structure of regulatory networks has therefore been considerably increased by the development of protocols for the global Chromatine immunoprecipation (ChIP–chip) and the global RNA immunoprecipitation (RIP–chIP), which identify the genome-wide location of a transcription factor (Lee et al., 2002) and the whole set of RNA targets of a RNA binding protein (Gerber et al., 2004; Hogan et al., 2008), respectively.
Step 4: Causal Models of the Structure of Stress Regulatory Networks
Back to the in silico part, the results of step 3 will help to refine the network, by establishing the connections between gene expression and the presence/absence of one or several regulators, under the form "gene (or the experimental condition) i activates (or inhibits) the expression of gene j" (Friedman, 2004). At this step, mathematical models like Bayesian networks, can be used to establish causal links between experimental conditions and gene expression changes (see, i.e., Zhu et al., 2006).
What Did We Learn from the Structure of Stress Regulatory Networks?
The analyses mentioned above have considerably increased the number of regulatory interactions known to be involved in stress responses, resulting in large atlases of complex combinatorial networks (Cline et al., 2007; Hannum et al., 2009 ; Perocchi et al., 2006; Zhu et al., 2008). These global analyses (1) pointed out the large variety (autoregulation, feed forward loops, multiinput motifs, regulator chains, etc.) (Lee et al., 2002) and the versatility (stress enabled, stress enlarged, constitutive) (Harbison et al., 2004) of the regulatory interactions that are involved in stress response networks; (2) revealed the extremely high degree of interconnection between stress response pathways that were previously studied independently; (3) revealed unexpected regulatory roles for many transcription factors, previously thought to respond to one particular physical or chemical feature; (4) put forward complex combinatorial regulations as being the general rule for any stress responding gene; and (5) have shown the high crosstalks between the stress regulatory pathways and other cellular pathway, thus making the frontier between “stress-inducible responses” and “housekeeping processes” obsolete.
The Case Study of the Pleiotropic Drug Response (PDR) in Saccharomyces cerevisiae
The points mentioned above can be exemplified by the recent advances in the characterization of the PDR pathway, which was initially described as a pathway ensuring drug export from the plasma membrane. Two major regulators of PDR, named Pdr1 and Pdr3, had been shown to control the expression of a handful of ABC transporters (Balzi and Goffeau, 1995). Genetically engineered gain of function versions of Pdr1, Pdr3, and related transcription factors considerably enlarged the PDR network, up to 10 different regulators, controlling about 40 target genes with a high level of functional redundancy (Fig. 2A) (Akache and Turcotte, 2002; Akache et al., 2001, 2004; Devaux et al., 2001; Hellauer et al., 2002; Hikkel et al., 2003; Le Crom et al., 2002; Lucau-Danila et al., 2003). Knock-out experiments quantified the relative contribution of Pdr1 and Pdr3 in drug response (Fig. 2B) (Banerjee et al., 2008; Fardeau et al., 2007; Lucau-Danila et al., 2005). The analysis of the functional modules predicted from a large compendium of microarray experiments (Hughes et al., 2000), together with global genetic screens (Hallstrom and Moye-Rowley, 2000), identified a new functional connection between PDR and the mitochondrial oxidative phosphorylation, which was shown to be specific of Pdr3 (Fig. 2B) (Devaux et al., 2002; Hallstrom and Moye-Rowley, 2000). Finally, global analyses of yeast responses to metalloids and oxidants, identified a role for Pdr1 and Pdr3 in the modulation of the oxidative stress response, in tight interconnection with the oxidative stress response factor Yap1, the proteasome regulator Rpn4, the PDR regulator Yrr1, and the heat-shock factor Hsf1 (Fig. 2C) (Hahn et al., 2006; Salin et al., 2008; Teixeira et al., 2008).

The case study of the pleiotropic drug response in Saccharomyces cerevisiae. (
The Dynamics of Stress Regulatory Networks: Being Quantitative or Being Global?
The knowledge of the structure of biological networks is necessary but not sufficient to understand their functioning. As illustrated in Figure 3A, the same negative feed back loop of gene B on gene A can either result in a metastable state with constant concentrations of A and B, or in anticorrelated oscillations, depending on the dynamic of the retroaction of B on A. It is therefore important to combine methods of network topology reconstruction with approaches that model the dynamic of these networks, that is, to define mathematical equations in which each component of the network is represented by a parameter, whose value is a function of time. The variables are most often mRNA or protein concentrations. The parameters can include all aspects of biological regulations, that is, synthesis rates, protein–protein or protein–DNA affinities, etc.

Quantitative dynamic modeling of regulatory networks. (
Quantitative Dynamic Models of Biological Networks
Quantitative dynamic models are based on the precise estimation of most of the kinetic parameters of a biological network (Fig. 3B). This estimation requires an important amount of experimental data of high quality and so is, to date, restricted to small networks, with a limited (usually less than 50) number of components (Kim et al., 2009). Such models have been proposed for the SOS DNA damage response in bacteria and the osmotic stress response in yeast. Using GFP reporter genes, Uri Alon and his collaborators measured with a high-temporal resolution, the activity of eight promoters among the 30 operons involved in the SOS DNA repair system, first in averaged population and more recently in single living Escherichia coli cells (Friedman et al., 2005; Ronen et al., 2002). Edda Klipp, Stefan Hohmann, and their colleagues proposed a dynamic model of the yeast osmotic stress response, which integrates all levels of regulation, from the sensor stimulation, to the adaptation of the cellular metabolism (Klipp et al., 2005).
These studies and many others have shown that it is possible to get relevant, quantitative, dynamic models for biological networks made of tens of components, when accurate time-course experimental data are available.
Dynamic Modeling of Stress Regulatory Networks and Synthetic Biology
Quantitative dynamics models provide valuable basis to analyze in silico the effects of perturbations of the cell functioning. The goal is to gain information on their fundamental properties and also to predict their behavior in case of environmental conditions or genetic modifications never tested experimentally. This allowed for instance to challenge the osmotic stress response of yeast with internal and external perturbations and to reveal potential instability as an intrinsic feature of the corresponding network (Krantz et al., 2009).
An interesting way of coupling quantitative models and experimental analyses is synthetic biology, in which biological regulatory circuits are considered the same way as electronic circuits, that is, networks that change a given input into the desired output signal. This approach can be used to understand the properties of natural networks and to manipulate the cellular features to create new functions. For instance, by turning a natural transient on/off switch into a synthetic bistable inducible switch, Andy Murray's group created yeast cells that keep the molecular memory of a stimulus, far after the end of the stimulation (Ingolia and Murray, 2007). The design of synthetic promoters in yeast is also coming out as a promising approach to test quantitative models of combinatorial cis- and trans-regulations (Lu et al., 2009 ; Murphy et al., 2010) and to predict their outputs in terms of gene expression in different environmental conditions (Gertz and Cohen, 2009; Gertz et al., 2009).
Another original way of considering biological network dynamic is to design them entirely in silico (Haseltine and Arnold, 2007). In that respect, Paul François and Vincent Hakim created an algorithm which, knowing the biological output that one wants to obtain (i.e., oscillation of the expression of a gene), randomly creates regulatory circuits and mimics iterative evolution and selection steps, so that the final network will be as close as possible to the desired behavior (Francois and Hakim, 2004). Such in silico reconstruction of regulatory circuits, given a detailed logic of the state transitions for each component of the network, provide valuable information to explain the behavior of “real” biological networks (Francois et al., 2007).
Qualitative Dynamic Models of Global Networks
There is a discrepancy between getting accurate and quantitative kinetic data and obtaining global, dynamic pictures of large networks, made of hundreds of components. Indeed, the genome-wide approaches are poorly quantitative. Series of microarray experiments usually have few time points and microarray measurements have a low dynamic range. Moreover, microarray results only measures an average expression of thousands of cells, and miss the heterogeneity of response that exists in the population. This is an important limitation, considering the importance of noise and stochasticity in the biological systems (Elowitz et al., 2002; Maheshri and O'Shea, 2007; Swain et al., 2002).
However, many methods have been developed to obtain “qualitative” dynamic models of large networks from kinetic microarray data (Bussemaker et al., 2007a; Kim et al., 2009). The simplest ones were already mentioned in the first part of this review. They assign genes to context dependent transcriptional modules, thus providing a rough picture of the physiological conditions in which the activity of a module is on (Boorsma et al., 2008; Ihmels et al., 2002; Segal et al., 2003). The team of Ziv Bar-Joseph established global dynamic regulatory maps by using input–output hidden markov chain models (Ernst et al., 2007). From the limited number of time points available, “bifurcation points” are determined, which are times at which a significant amount of genes exhibit changes in expression. The transcription factors or cis-regulatory motifs responsible for this bifurcation are predicted from the regulatory interactions known to exist at the promoters of the corresponding genes, thus providing a picture of when and on which gene a particular transcription factor will be active. Lelandais et al. (2009) developed a method that is based on a different mathematical approach but with a similar rationale. From kinetic microarray data, “model patterns” are defined using simple mathematical functions. Each experimental gene expression profile is then considered as a mixture of the model patterns, using an optimization procedure. Cluster of genes are finally defined according to the model patterns that account the most in the expression dataset. cis-Regulatory motifs or ChIP–chip and RIP–chip data are used to annotate the clusters, resulting in a dynamic picture of the activity of transcriptional regulators and RNA binding proteins (Fig. 4). Other promising methods in this field are the dynamic Bayesian networks, which can simultaneously infer the structure of a regulatory network and how this structure changes over time (Lèbre et al., submitted; Perrin et al., 2003).

Qualitative global dynamic modeling: the example of the cell response to metabolic synchronization. From global kinetic gene expression data obtained from metabolically synchronized cells (Tu et al., 2005), six clusters of genes (noted A to F), corresponding to different temporal phases of the metabolic cycle, have been defined, using the approach described in the main text. The regulatory network behind these clusters has been predicted from cis-regulatory motifs searches and from information on the spatial localization of the corresponding mRNAs (MLR = mitochondria localized mRNAs). This led to a dynamic view of the complex transcriptional and posttranscriptional events that ensure the proper spatiotemporal regulation of mitochondria biogenesis and functioning. See Tu et al. (2005) for detailed definitions of the R/B, R/C, and Ox metabolic phases and Lelandais et al. (2009) for more information on the approach used.
Experimental, Quantitative Measurements of Stress Responses at the Single Cell Level
In support to the modeling side of the problem, the recent years have seen significant progress in our ability to accurately, experimentally measure gene expression in single cells and/or in real time. The GFP reporter technique, which has drawbacks based on the lag in the GFP maturation, has been revived by the use of microfluidic devices, which allow to precisely control the timing and the intensity of the stress applied to the cells while being able to determine the age, the pedigree, and the physiological state of each cell. These techniques already resulted in impressive real time measurements of the kinetic of MET promoter induction following methionine starvation (Charvin et al., 2008) or of the nucleocytoplasmic shuttling of stress responsive regulators (Hersen et al., 2008). A more direct approach of the dynamic of gene transcription in response to stress is provided by the MS2–GFP detection of mRNA, improved at Robert Singer's laboratory, which precisely and directly detects nascent mRNAs at the site of transcription in living cells (Darzacq et al., 2009; Shav-Tal et al., 2004). Finally, an improved FISH method (Garcia et al., 2007) allows the precise measurement of the number and localization of individual mRNA molecules in a whole cell population (Zenklusen et al., 2008). Although using fixed cells, this method can measure the number of nascent RNA at the transcription site, therefore allowing the extrapolation of transcription dynamic (Larson et al., 2009).
What Did We Learn from the Dynamics of Stress Response Networks?
Quantitative dynamic modeling has three main aims. The first one is to obtain mathematical descriptions, which fit as perfectly as possible the experimental observations. The second is to provide new information on the dynamic of the studied network. The third is to predict the behavior of the network in physiological conditions, which were not experimentally addressed, thus providing a tool for hypothesis driven studies. Because the experimental data adapted to quantitative dynamic modeling are just emerging, few general rules can be extracted from the published works. They are summarized below.
The capacity of the stress response networks to faithfully translate the dynamic of the environmental stress into faithful biological responses is limited. For instance, it was demonstrated that the Hog1 nucleocytoplasmic shuttling in response to hyperosmolarity behaves as a low-pass filter, which integrates successive stimulations when their frequency is too high (Hersen et al., 2008).
Stress regulatory networks seem to be more subjected to stochastic variations than other cellular networks. This has been observed at the level of single gene transcription, for which stress inducible genes exhibit sudden bursts in individual cells, even in the absence of any obvious external stress (Zenklusen et al., 2008). Single-cell analyses in Escherichia coli have shown that the transient, single peak of SOS response observed in an averaged E. coli population, is actually composed of structured series of gene expression peaks, with different timing in the different cells (Friedman et al., 2005).
Mathematical modeling of gene expression data also illustrated the highly controlled temporal cooperation between posttranscriptional and transcriptional levels of regulation, for instance, in the response of nuclear mitochondrial protein encoding genes to the metabolic synchronization of yeast cells (Fig. 4) (Lelandais et al., 2009).
Finally, these works have shown that predictive models of complex drug and chemical stress responses can be achieved, with gains in terms of fundamental knowledge and biomedical applications (Airoldi et al., 2009; Friedman et al., 2005; Geva-Zatorsky et al., 2010; Klipp et al., 2005).
Evolution of the Stress Regulatory Pathways: The Robustness of Being Variable Comparative genomics in Yeasts
Hemiascomycetae is the phylum for which the largest number of complete genomic sequences is available. More than 15 different species have been sequenced and this number is expected to increase rapidly (Dietrich et al., 2004; Dujon et al., 2004; Jones et al., 2004; Kellis et al., 2004; Souciet et al., 2009). Therefore, yeasts are particularly interesting models for comparative genomics (Dujon, 2005). Although being morphologically homogeneous, yeast species span an evolutionary period equivalent to the evolution of chordates. Their genomes have encountered a complex evolution, with many segmental duplications and a whole genome duplication (WGD) (Fig. 3), followed by massive gene losses and genome rearrangements (Fig. 5) (Fischer et al., 2006; Kellis et al., 2004; Wolfe and Shields, 1997). For instance, segmental duplications resulted in Kluyveromyces lactis into 12 copies of genes similar to the unique Mch2 of Saccharomyces cerevisiae. More generally, S. cerevisiae retained 8% of paralogous pairs (about 450 genes) arising from the WGD, including several pairs of transcription factors, whereas another post-WGD species, the human pathogen Candida glabrata, kept only 2% of those (Dujon, 2005). Finally, some yeast species present unique and intriguing genomic features, like the GC rich region of the left arm of the third chromosome in Lachancea kluyveri (Payen et al., 2009). Interestingly, despite these significant genomic variations, yeasts have a similar number of protein encoding genes, composed of about 3,300 protein families that are shared by all lineages (Souciet et al., 2009). The fact that yeast species developed specific genomic features and conserved common properties make them valuable models to estimate the impact of environmental changes and genome evolution on the topology and the functioning of regulatory networks. Careful examination of the synteny in yeast genomes led to accurate orthology tables, which is an important prerequisite to the analysis of gene regulation conservation (Wapinski et al., 2007). Standard comparative genomics approaches have been used to identify the cis-regulatory motifs evolutionary pathways and to predict the evolution of the corresponding regulatory pathways (Gasch et al., 2004; Kellis et al., 2003; Mazurie et al., 2005). However, the information on sequence evolution alone does not reflect the actual functioning of the underlying cellular networks, and a more “functional” approach of genome evolution was required (Tirosh et al., 2007).

Evolutionary history of the yeast species mentioned in this review. The general phylogenetic topology of the yeast species used in this review is represented by this tree. Note that the length of the branches does not reflect any evolutionary distance. Accurate and quantitative phylogenetic trees of yeast species can be found elsewhere (Fitzpatrick et al., 2006; Souciet et al., 2009). WGD = whole genome duplication. CTG = yeast species that translates the CTG codon as serine rather than leucine.
Interspecies Comparison and Comparative Functional Genomics
Regulatory networks are in direct connection with phenotypic diversity, and the study of their evolution is essential to understand the subtle balance that exists between the conservation of important functions and the emergence of new properties (Levine and Tjian, 2003). The flexibility of the second generation of commercial microarrays allowed the scientists to easily design affordable DNA chips for any newly sequenced genome (Sussman et al., 2009). This opened the way to multispecies comparative analyses of the transcriptome responses to many different physiological conditions. However, such comparisons raised major difficulties. In a first step one must choose the proper stress conditions to use in each species. Normalizations of these experimental conditions are required to obtain a similar physiological impact on the different species (Lelandais et al., 2008). Some overcome this problem by using large sets of heterogeneous experiments, hopefully merging eventual discrepancies between the experimental conditions (Ihmels et al., 2005a, 2005b). The second question is how to compare expression measurements obtained in different species? The most intuitive way is to calculate a similarity measure between expression profiles of orthologous gene pairs using more or less elaborated metrics (Banerjee et al., 2008; Rustici et al., 2007; Roetzer et al., 2008; Tirosh et al., 2006, 2008). Alternatively, the Naamai Barkai's team developed the Differential Clustering Algorithm (DCA) to evaluate the coexpression conservation between groups of genes (Ihmels et al., 2005a, 2005b). Finally, some groups have performed multispecies ChIP–chip experiments, to get a direct comparison of the set of promoters bound by orthologous regulators in different yeast species (Borneman et al., 2007; Tuch et al., 2008a, 2008b).
The Gold Mine of Intraspecies Variability
The study of the intraspecies variability of regulatory networks rapidly emerged as a valuable way to get insight into the evolutionary dynamic of these networks over smaller time periods. Early analyses have shown that significant differences in the global gene expression profiles exist between different vinyard and laboratory strains of S. cerevisiae (Dunn et al., 2005; Fay et al., 2004; Hauser et al., 2001; Landry et al., 2006a. 2006b; Townsend et al., 2003). The sequencing of more than 70 different S. cerevisiae strains and the multiplication of global analyses of S. cerevisiae population structure is contributing to the rapid development of global analyses of gene expression in different S. cerevisiae isolates (Liti et al., 2009; Schacherer et al., 2009). For instance, the group of Audrey Gasch conducted phenotypic analyses of stress response of 52 yeast strains in 14 environmental conditions, and performed comparative transcriptome analyses for 18 of them (Kvitek et al., 2008). Another fascinating way of addressing this question is to consider gene expression as a quantitative trait and to apply the powerful methods of quantitative genetics on a genome-wide scale (Brem et al., 2002; Yvert et al., 2003). The aim is to identify quantitative trait loci (eQTL), which would explain the differences in gene expression regulations observed in different strains. One obvious advantage of this approach is to take into account the polygenic and combinatorial nature of both genomic mutation events and regulatory network functioning (Smith and Kruglyak, 2008).
Experimentally Controlled Evolution of Regulatory Networks
A limitation of the inter- and intraspecies comparative functional analyses mentioned above is that they provide photos of the existing genome and network differences, and then try to reconstitute the past events, which led to the present situation. Therefore, they do not address the question of the mechanisms and the dynamic of genome and gene network evolution in real time. Then, several groups have developed experimental systems to follow the evolution of yeast populations in a laboratory, under various selective pressures. These tools were used to analyze both adaptive changes in the genome sequence, and in gene expression patterns (Dunham et al., 2002; Gresham et al., 2008). Moreover, the Saccharomyces sensu stricto species present the interesting possibility to mate and to form viable, although sterile, diploids individuals (Greig et al., 2002). These hybrids have been valuable tools to analyze the complex relationships between phenotypic variability and changes in the cis- and trans-regulatory features (Bullard et al., 2010; Tirosh et al., 2009).
What Did We Learn from the Evolution of Stress Regulatory Networks?
The biological networks connected to the adaptation to environmental changes evolved much faster than genomic sequences (Tirosh et al., 2006). A study of the genome-wide location of Ste12 and Tec1, two transcription factors involved in yeast mating and pheromone response, in three Saccharomyces sensu stricto species, have shown that, even between closely related species (Fig. 5), the binding sites of the two transcription factors have significantly diverged, resulting in modifications in the target gene selection in response to different physiological conditions (Borneman et al., 2007). This study apparently questions the numerous and convincing results obtained by phylogenetic footprint, which identified conserved DNA binding motifs in closely related yeasts, based on cross-species comparison (Kellis et al., 2003). Actually, this is a false paradox: the sequence of the Tec1 and Ste12 DNA binding motifs are highly similar in the three species examined and, at least for Tec1, the number of promoters that exhibit this motif in all three species is still high enough to explain the success of the phylogenetic footprint approach (Borneman et al., 2007). On a larger phylogenetic scale, the Naama Barkai's team demonstrated a dramatic rewiring of the regulation of cytosolic and mitochondrial ribosomal protein encoding genes in response to general stress, which is correlated with the WGD, the massive loss of a cis-regulatory motif in hundreds of coregulated promoters and the acquisition of new metabolic functions (Ihmels et al., 2005b).
However, dramatic changes in gene regulatory circuits can just result in identical gene expression outputs. This was illustrated by analyses of the evolution of the sexual type determination and the related Mcm1 regulon in yeasts (Tsong et al., 2006; Tuch et al., 2008a). These works have shown that the structure of the regulatory network responsible for a and alpha-specific gene regulation diverged in different yeast species. However, the gene expression patterns of these genes are highly similar, indicating that the regulatory logic of the network was robustly conserved, despite the large cis- and trans-regulatory changes observed (Tsong et al., 2006). More generally, a global phenotypic analysis of Candida albicans strains individually knocked out for 143 transcription factors encoding genes in 55 experimental conditions, suggested that phenotypes of orthologous transcription factors are largely conserved with S. cerevisiae, despite the large evolutionary distance and genome rewiring between these two yeast species (Homann et al., 2009).
Moreover, the evolutionary divergence rate differs between regulators. For instance, beyond the MATa/MATalpha specification mentioned above, Mcm1 exhibits different combinatorial associations with other transcription factors in different species, which resulted in the appearance of new functions (Tuch et al., 2008a). Although Mcm1 properties seem to have diverged very fast, the Rpn4 transcription factor, controlling proteasome response to stress, has a conserved role among ascomycetes, with only subtle coevolution of Rpn4 structure and of its DNA binding site (Gasch et al., 2004). In between these two examples, the oxidative stress response regulator Yap1 has conserved roles and properties between S. cerevisiae and C. albicans, but exhibit significantly different DNA binding preferences and regulations in C. glabrata (Lelandais et al., 2008). The ESR is another interesting example of a group of genes with a complex evolutionary fate (Gasch, 2007). The ESR has been studied in S. cerevisiae (Gasch et al., 2000), C. glabrata (Roetzer et al., 2008), C. albicans (Nicholls et al., 2004), and the archiascomycetae, Schizosaccharomyces pombe (Chen et al., 2003). The genes induced during ESR, which are mainly controlled by the Msn2/Msn4 pair of transcription factors, are similar in S. cerevisiae and S. pombe (Chen et al., 2003). Surprisingly, the inducible ESR is very different in C. albicans, whereas C. albicans is more closely related with S. cerevisae than S. pombe (Fig. 5). In C. albicans, ESR is composed of only a limited number of core stress responsive genes and is independent on Msn2/Msn4 (Enjalbert et al., 2006; Nicholls et al., 2004). The frontier between Msn2/Msn4 dependent and Msn2/msn4 independent ESR was located between Saccharomycetaceae and the “CTG” group (Fig. 5) (Roetzer et al., 2008). The evolution of the regulation of genes repressed during ESR is different. The repression pattern is particularly well conserved between post- and pre-WGD species, despite of the duplication of the regulators of those genes (Wapinski et al., 2010). The only known exception is Candida glabrata, in which the loss of a repressor following WGD has led to the loss of negative regulation of the ribosomal protein encoding genes during the ESR (Wapinski et al., 2010).
The examples cited above illustrate the complexity of the relationships between the structure of the regulatory networks and the gene expression patterns. Apparently, no global correlation exists between promoter divergence and gene expression patterns (Meireles-Filho and Stark, 2009; Tirosh and Barkai, 2008; Tirosh et al., 2008).
What Are the Mechanisms for Regulatory Network Evolution?
Quantitative biology and comparative functional genomic analyses of intraspecies variations in gene expression, suggest that few single nucleotide polymorphisms (SNPs) at few QTL can result in significant changes in gene expression. Experimental evolution experiments have shown that cell populations can rapidly adapt to new environmental conditions, due to the emergence of new genomic features, which impacts on gene expression and regulatory networks (Dekel and Alon, 2005). A synthetic biology approach in which the authors have put the HIS3 gene, involved in histidine biosynthesis, under the control of the GAL pathway, which is responding to galactose, has shown the high plasticity of the S. cerevisiae regulatory networks, which changed their shape and properties to adapt to the new situation (Stern et al., 2007). One convenient explanation of these properties is the functional redundancy, especially between paralogous regulators, which could serve as a reservoir of alternative trans-regulatory links, to balance genomic changes (Ihmels et al., 2007; Schacherer et al., 2009; Wohlbach et al., 2009). Noteworthy, stress-response genes exhibit a high rate of duplications and losses events all along the Hemiascomycetes phylogeny (Wapinski et al., 2007), and divergence in trans-regulations are more tightly connected with differential environmental responses than cis-regulatory modifications (Tirosh et al., 2009). Although exhibiting few differences in their biochemical properties, paralogous gene pairs rapidly diverge in their regulatory control, thus provoking a rapid modularization of the stress response networks (Ihmels et al., 2007; Tirosh and Barkai, 2007; Wapinski et al., 2007). There are many examples of this phenomenon. For instance, the Pdr1/Pdr3 pair of PDR regulators present in S. cerevisiae (Fig. 2B), is represented in C. glabrata by only one Pdr1 orthologue, which fulfills the functions of both Pdr1 and Pdr3 (Salin et al., 2008; Tsai et al., 2006; Vermitsky et al., 2006). In C. albicans, no orthologue for Pdr1 could be identified, but a related zinc-finger regulator, Tac1, mimics the regulatory properties of Pdr1 on a limited number of PDR responsive genes, which apparently represent a core PDR common to most yeast species (Balkova et al., 2009; Banerjee et al., 2008; Coste et al., 2004; Liu et al., 2007; Thakur et al., 2008).
In conclusion, stress responses to environmental changes can be conserved among hemiascomycetes, even if the combination of cis- and trans-regulatory interactions, which are responsible for these responses rapidly diverged. This apparent discrepancy relies on two major phenomena: first, the coevolution of cis-regulatory motifs sequences and of the DNA binding properties of the transcription factors (Gasch et al., 2004), and second, the fast evolution of regulatory combinations of transcription factors that occurs at the promoters (Borneman et al., 2007; Tuch et al., 2008a). This highly dynamic picture of the evolution of gene network structures results in the observation that the history of almost each promoter is unique. This was illustrated by a comparison of Yap1 properties between S. cerevisiae and C. glabrata, in which the oxidative stress response was almost similar, whereas the regulatory logic behind this conservation differed for each of the promoters examined (Lelandais et al., 2008).
Perspectives–Conclusion
The way we study environmental stress responses has considerably changed this last 15 years, and so did the scientists involved in the field. Today, people working on stress responses have to consider several kind of stresses, combinations and interactions between many previously unrelated regulators, carrying out experiments in multiple species, thinking about stress responses in a quantitative and dynamic way, elaborating models with colleagues as weird as mathematicians and physicists (Fig. 6) … and enjoying it! This has been an exciting period, which has seen many barriers breaking down, especially between transcriptional and posttranscriptional levels of regulation, between the previous reductionism of molecular biology and the new holistic views brought about by global approaches and between the genetic of cells and molecules and the genetic of populations and genomes. The next years will be even more exciting. The up-coming of new generation sequencing technologies will not only provide more accurate measurements of gene expression (Nagalakshmi et al., 2008) and unravel new populations of regulatory RNAs (Drinnenberg et al., 2009; Neil et al., 2009; Thiebaut et al., 2008; Xu et al., 2009), but it will also exponentially increase our capacity to analyze the global genomic and transcriptomic variability present in natural populations and in laboratory-evolved strains (Araya et al., 2010; Bullard et al., 2010). An astonishing aspect of stress responses is their capacity to adapt to highly variable and complex environments and to react properly to environmental stress previously unseen. The works mentioned in this review open doors to a global and dynamic models of stress regulatory networks that would account for the complex combinatorial nature of stress in natural environments (Kim et al., 2009; Ruderfer et al., 2009). The concepts and the technologies to achieve this challenge already exist, but the amount of work is huge and will certainly require a coordination of scientific efforts of the same extent than the sequencing programs in the nineties.
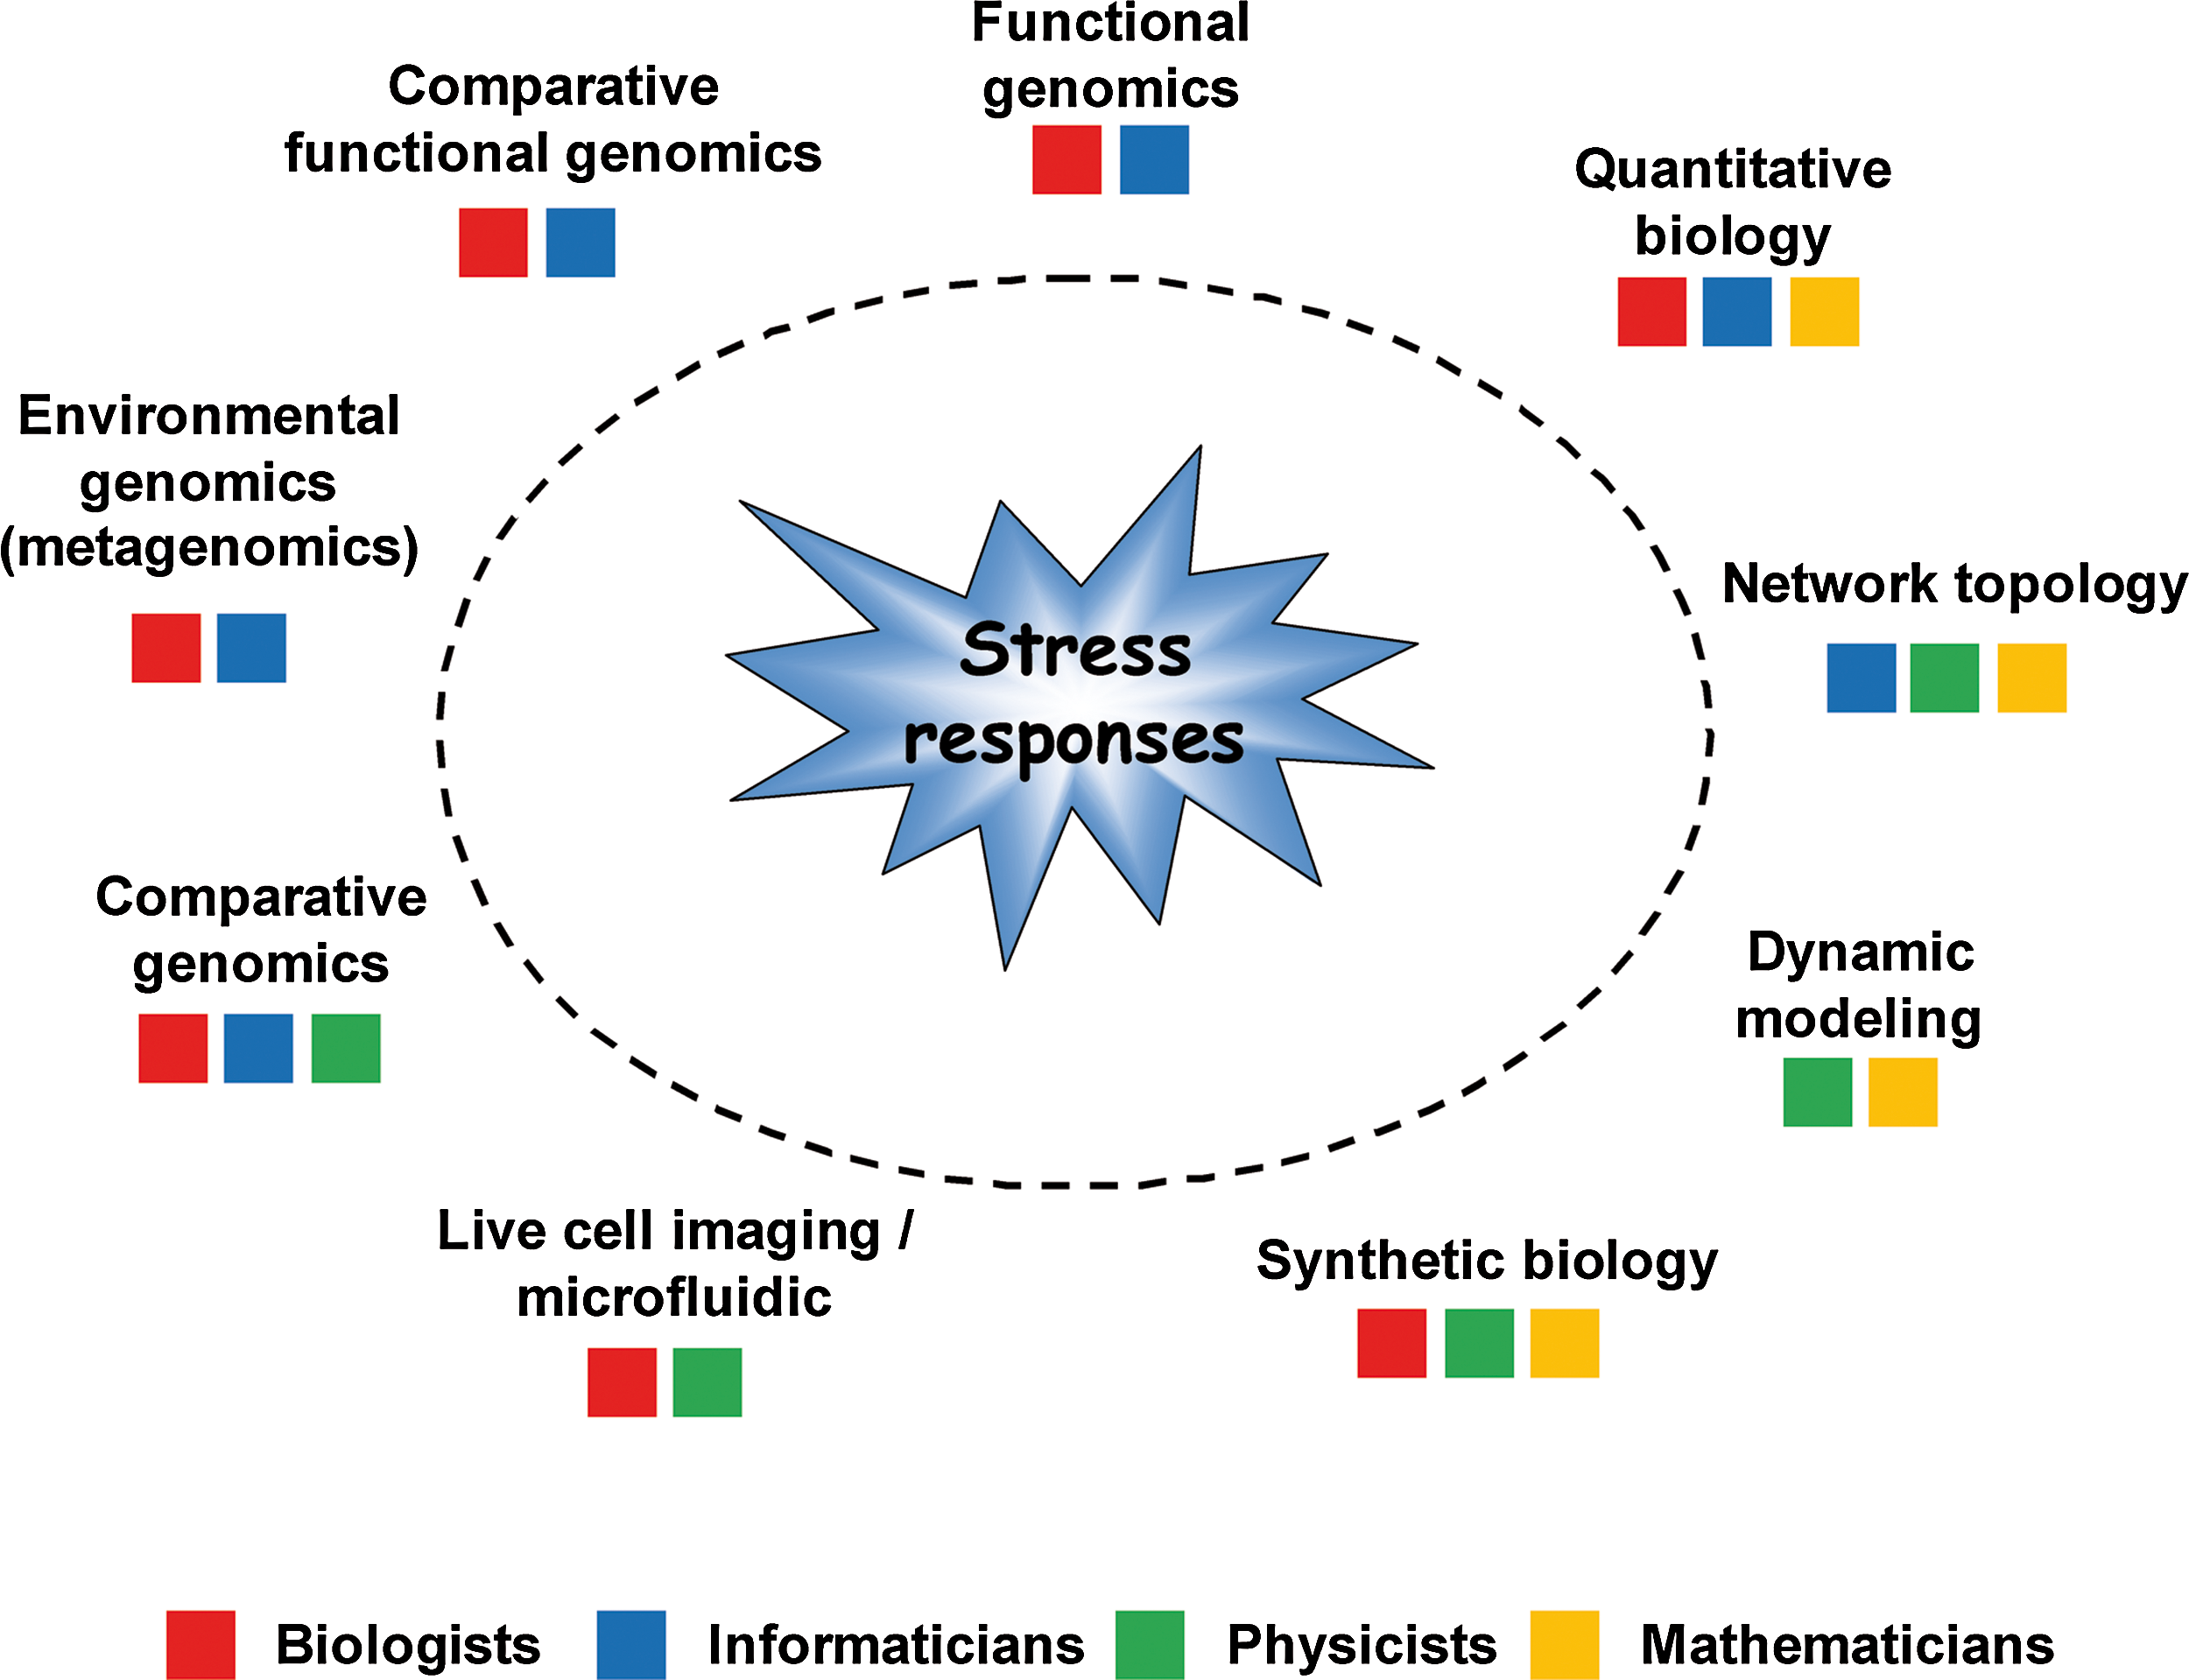
Interdisciplinary studies of stress responses. The main disciplines that are involved in the study of stress responses, and the relative contributions of biologists, physicists, informaticists, and mathematicians, are represented. This figure does not pretend to be exhaustive.
Footnotes
Acknowledgments
We acknowledge Isabel Sà Correia for kindly inviting us to write this review. We thank Claude Jacq, who introduced us to the functional genomics of drug response in yeasts, some, not so few, years ago.
Author Disclosure Statement
The authors declare that no conflicting financial interests exist.