




Abstract
Abstract
Prostate-specific antigen (PSA) two-dimensional electrophoresis (2-DE) subforms (F1–F5) have been described to be altered in prostate cancer (PCa) compared to benign prostatic hyperplasia (BPH). To understand their molecular differences, characterization of these subforms from PCa serum and seminal plasma, namely, at the glycan level, was performed. PSA 2-DE subforms from two serum PCa samples and seminal plasma were analyzed by N-glycan sequencing using high-performance liquid chromatography (HPLC) combined with exoglycosidase array digestions and by mass spectrometry. F1, F2, and F3 subforms showed the same N-glycan pattern, which contained higher levels of sialic acid than the F4 subform, whereas the F5 subform was unglycosylated. When comparing PSA subforms from PCa with seminal plasma, a decrease in sialylation was observed. Furthermore, the analysis of F3, the more abundant PSA subform, showed a higher proportion of alpha 2–3 sialic acid and a decrease in core fucosylated glycans in the PCa sample. These N-glycan changes in PCa PSA subforms highlight the importance of glycosylation as an indicator of PCa disease.
Introduction
PSA is a glycoprotein produced by the prostatic epithelium and it is secreted as a proenzyme (proPSA) into the lumen of the prostate gland where it is activated. It is a normal component of seminal plasma where it is present at relatively high concentrations (0.5–3 mg/mL) (Diamandis, 1998). In prostate disease, the basement membrane can be disrupted, and PSA can access the peripheral circulation and be detected in the blood. The predominant molecular PSA form found in blood is complexed with protease inhibitors, mainly alpha-1-antichymotrypsin (ACT) (Balk et al., 2003). The remaining PSA forms are inactive and circulate as free PSA (fPSA). These include proPSA forms and internally cleaved PSA such as BPSA (BPH associated PSA) (Mikolajczyk et al., 2002).
Measurements of complex PSA (Brawer et al., 1998), fPSA (Catalona et al., 2000), specific free PSA forms such as proPSA (Mikolajczyk et al., 2004) and BPSA (Linton et al., 2003) have been studied to improve the specificity of PCa detection. However, only the percentage of PSA circulating in the free form (%fPSA) has been widely used by clinicians as a diagnostic tool in patients with low tPSA levels (Loeb and Catalona, 2008).
Other studies to improve the specificity of PSA in PCa diagnosis have focused on some of the biochemical characteristics of PSA. For example, glycosylation of PSA has been reported to be altered in the presence of tumors. In fact, secreted glycoproteins can reflect the changes in glycosylation pattern that usually take place on the tumor cells surface (Peracaula, 2007; Varki et al., 2008). Several authors have described modifications in the sialylation pattern of PSA derived from malignant origins compared with that from healthy individuals (Huber et al., 1995; Ohyama et al., 2004; Peracaula et al., 2003; Tabares et al., 2006). Sialic acid is a negatively charged carbohydrate. An increase or decrease in the content of this monosaccharide on a PSA N-glycan chain can modify the PSA's isoelectric point (pI). Two-dimensional gel electrophoresis has been used to evaluate sialic acid variations in PSA from different sources (Charrier et al., 1999; Isono et al., 2002; Jung et al., 2004; Tabares et al., 2007). Most of these studies have focused on fPSA 2-DE subforms, which represent only 10–30% of the total serum PSA. To enable the analysis of all serum PSA subforms, we developed a sensitive and precise method to evaluate PSA 2-DE subforms from PCa and BPH sera, which included an initial ethanolamine treatment step to release PSA bound to ACT. Five individual PSA 2-DE subforms (called F1, F2, F3, F4, and F5) were detected and some were significantly altered between BPH and PCa patients. Compared to BPH, the relative percentage of F3 (%F3) negatively correlated with the stage of cancer, while the relative percentage of F4 (%F4) correlated positively with the stage of cancer. %F3 demonstrated a tendency for higher specificity and sensitivity than the currently used tPSA and % fPSA tests to distinguish between the two groups of patients (Sarrats et al., 2010).
The aim of the present study has been to unravel the biochemical differences among these PSA subforms (F1, F2, F3, F4, and F5) to develop future clinical assays to directly measure %F3. Thus, we have analyzed PSA 2-DE subforms from two prostate cancer patients' sera and also from seminal plasma from a healthy donor using N-glycan sequencing and mass spectrometry. Unfortunately, the biochemical analysis of PSA 2-DE subforms from a BPH patient was not possible due to the fact that BPH sera do not reach high enough PSA levels to allow N-glycan sequencing analysis. Seminal plasma was therefore taken as a source of healthy PSA.
These analyses have enabled us to characterize differences among the PSA 2-DE subforms (F1–F5) in each of the samples and to compare the glycosylation pattern between the samples originating from healthy and malignant origins.
Materials and Methods
PSA samples
Sera from two PCa patients (PCa A and PCa B) with high tPSA content (above 2.5 μg/mL) and seminal plasma from a healthy donor (∼0.5 mg/mL fPSA) were obtained from Hospital Universitari, Dr. J. Trueta (Girona, Spain) following the standard operating procedures of its Ethics Committee. PCa patients were diagnosed by the Urology unit using transrectal ultrasound-guided biopsy and both showed multiple bone metastases detected by positron emission tomography and axial computed tomography.
PSA sample pretreatments and analyses are summarized in Figure 1.

Schematic illustration of workflow used in this work to obtain and characterize PSA 2-DE subforms (
Serum sample pretreatment
Serum PSA complexed to ACT was released using a previously published method with modifications (Peter et al., 2000). A solution of 2,565 μL phosphate-buffered saline (PBS) and 265 μL 2 M ethanolamine (pH 12) was added to 2,850 μL of serum (up to a final pH of 10.3) and incubated at 25°C for 24 h. Before PSA isolation, the mixture was neutralized with 0.5 M HCl.
Total PSA was isolated by modification of a previously described direct immunoadsorption method (Peter et al., 1999). A suspension of 6 mL of 0.72 g/L streptavidin-coated magnetic beads was washed three times with 6 mL of washing buffer (50 mM Tris, 150 mM NaCl, pH 7.4, 1% Triton X-100) using magnetic separation. The beads were then incubated for 30 min at room temperature with slight shaking with 3 mL of the biotinylated mouse monoclonal antibody anti-tPSA M-36 (Roche Diagnostics, Germany), in a final concentration of 33.3 μg/mL dissolved in incubation buffer (50 mM Tris, 150 mM NaCl, pH 7.4, 0.1% Tween-20, 1% BSA). Then, the beads were washed as mentioned above and incubated for 1 h with 5,700 μL of neutralized treated serum (containing 2,850 μL of original serum). Afterward, the beads were washed as already described and the immunoadsorbed PSA was eluted with 360 μL of 2-DE rehydration buffer (8 M urea, 0.5% Triton X-100, 13 mM DTT, 1% Pharmalite 3-10 (Amersham Pharmacia Biotech, Germany), traces of Bromophenol blue) for 1 h.
Seminal plasma sample pretreatment
PSA from seminal plasma for MS analysis purposes was isolated using the procedure described above with some modifications: 4 mL of 0.72 g/L streptavidin-coated magnetic beads solution were washed three times with 4 mL of washing buffer and incubated with 2 mL of the biotinylated mouse monoclonal antibody anti-tPSA M-36 (Roche Diagnostics) (33.3 μg/mL in incubation buffer). Then, the beads were washed as mentioned above and incubated for 1 h with 4 mL of 1/20 diluted seminal plasma (in incubation buffer). Afterward, the beads were washed as already described and the immunoadsorbed PSA was eluted with 360 μL of 2-DE rehydration buffer for 1 h.
One milliliter of 1/10 diluted seminal plasma was also immunoadsorbed for phosphorylation analysis using the same protocol as above but the elution step was performed with 50 μL of 1 × gel-loading buffer (30 mM Tris-HCl pH 6.8, 10% (v/v) glycerol, 2% SDS, 1.25% β-mercaptoethanol, 0.01% Bromophenol blue).
Two-dimensional electrophoresis (2-DE)
2-DE was performed according to the procedure we previously described (Sarrats et al., 2010). Active in-gel rehydration was effectuated with Immobiline dry strips pH 3–10, 18 cm (GE Healthcare, Sweden) using the 360 μL of the immunopurified PSA samples eluted in 2-DE rehydration buffer or 50 μL of seminal plasma diluted in 360 μL of 2-DE rehydration buffer. Following electrophoresis, 2-DE gels were stained by Coomassie blue and PSA spots were excised, cut into 1 mm3 pieces and kept at −20°C until analysis (Royle et al., 2006).
The pI assignment to each PSA spot was calculated by measuring the spot distance to the anodic edge and transforming it into a pI value according to the relation between distance and pI supplied by the manufacturer.
N-glycans analysis
N-Glycans release, extraction and 2-aminobenzamide (2-AB) labeling
N-Glycans were released and extracted from the 1-mm3 gel pieces of PSA spots according to the procedure described by Royle et al. (2006). Briefly, the gel pieces were washed and treated with PNGaseF to release the N-linked glycans. Afterward, N-glycans were fluorescently labeled with 2-aminobenzamide (2AB) by reductive amination (Bigge et al., 1995) (LudgerTag 2-AB labeling kit LudgerLtd, Abingdon, UK).
Simultaneous oligosaccharide sequencing by exoglycosidase digestions
The 2AB-labeled glycans were digested in 10 μL of 50 mM sodium acetate buffer, pH 5.5 for 18 h at 37°C, using arrays of the following enzymes (all purchased from Prozyme, San Leandro, CA, USA) at the indicated concentrations: ABS—Arthrobacter ureafaciens sialidase (EC 3.2.1.18), 0.5 U/mL; NAN I— Streptococcus pneumoniae sialidase (EC 3.2.1.18), 1.7 U/mL; BTG—Bovine testes β-galactosidase (EC 3.2.1.23), 1 U/mL; SPG—Streptococcus pneumoniae β-galactosidase (EC 3.2.1.23), 0.1 U/mL; BKF—bovine kidney alpha-fucosidase (EC 3.2.1.51), 1 U/mL; GUH—Streptococcus pneumoniae β-N-acetylglucosaminidase, recombinant in Escherichia coli (EC 3.2.1.30), 8 U/mL. After incubation, enzymes were removed by filtration through a protein-binding EZ filters (Millipore Corporation, Bedford, MA, USA) (Royle et al., 2006).
Normal-phase high-performance liquid chromatography (NP-HPLC)
Undigested and digested 2-AB-labeled N-glycans were subjected to NP-HPLC using a TSK-Gel Amide-80 4.6 × 250 mm column (Anachem, Luton, UK) on a 2695 Alliance separations module (Waters, Milford, MA, USA) equipped with a Waters temperature control module and a Waters 2475 fluorescence detector. Solvent A was 50 mM formic acid adjusted to pH 4.4 with ammonia solution. Solvent B was acetonitrile. The column temperature was set to 30°C. Gradient conditions were a linear gradient of 20–58% A, over 152 min at a flow rate of 0.4 mL/min. Samples were injected in 80% acetonitrile. Fluorescence was measured at 420 nm with excitation at 330 nm. The system was calibrated using an external standard of hydrolyzed and 2AB-labeled glucose oligomers to create a dextran ladder. Glycans were analyzed on the basis of their elution positions measured in glucose units (GU) (Royle et al., 2006).
Matrix-assisted laser desportion/ionization-time of flight (MALDI-TOF) mass spectrometry
Seminal plasma PSA 2-DE spots were in-gel digested with trypsin (sequencing grade modified, Promega Biotech Iberica, Spain) in the automatic Investigator ProGest robot (Genomic Solutions, Holliston, MA, USA). Briefly, excised gels spots were washed with ammonium bicarbonate buffer (50 mM NH4HCO3) and acetonitrile. Proteins were reduced with 10 mM DTT solution during 30 min, and alkylated with a 55 mM solution of iodine acetamide. After the washings with buffer and acetronitrile, proteins were digested overnight, at 37°C with 0.27 nmol of trypsin. Tryptic peptides were extracted from the gel matrix with 10% formic acid and acetonitrile; the extracts were pooled and dried in a vacuum centrifuge.
Proteins were analyzed in a MALDI-TOF/TOF (4700 Proteomics Analyzer, Applied Biosystems, IL, USA) mass spectrometer. The digests were redissolved in 0.1% trifluoroacetic acid in 50% acetonitrile. Typically 0.5 to 1.0 μL of sample was mixed with the same volume of a matrix solution (2–5 mg/mL α-cyano-4-hydroxycinnamic acid in 50% MeCN, 0.1–0.2% trifluoroacetic acid) and spotted to the MALDI plate. MS spectra were acquired in positive reflector mode (voltage of 20 kV in the source 1 and laser intensity ranged from 5,800–6,200). Typically, 500 shots per spectrum were accumulated. MS/MS spectra were acquired using collision-induced dissociation with atmospheric air as the collision gas. A MS-MS 1-kV positive mode was used.
MS and MS/MS spectra from the same spot were merged in a single mascot generic file (mgf) file prior to submission for database searching. Mgf files were submitted for database searching in a MASCOT search engine against nonredundant SwissProt database. The search parameters were: human taxonomy, one missed cleavage allowed, carbamidomethyl of cystein as fixed modification, oxidation of methionine and deamidation of asparagine or glutamine as variable modifications. Peptide tolerance was 100 ppm and 0.25 Da, respectively, for MS and MS/MS spectra. Only proteins with scores above significant Mascot level were considered as positive hits.
O-Glycosylation analysis
To investigate the presence of O-glycans attached to PSA, glycoproteins from seminal plasma (healthy donor) were digested with ABS plus O-glycosidase. ABS is used to release sialic acid residues which block O-glycosidase to access to the oligosaccharide chain. ABS digestion and a negative control without digestion (buffer without enzymes) were also performed. Both enzymes were purchased from Roche.
A total of 4.5 ng of PSA (9 μL of 1/1,000 diluted seminal plasma) were incubated in 10 μL of 0.1% SDS for 10 min at 70°C. Then, the solution was cooled down for 3 min at 4°C. After that, ABS (1 U/mL) or ABS (1 U/mL) with O-glycosidase (50 mU/mL) digestions were performed in 20 μL of 100 mM sodium acetate buffer, pH 5.5, 1% Triton X-100 for 18 h at 37°C. For the negative control of the digestion the volume of enzymes were substituted for water.
The products of the digestions were run on a 15% SDS-PAGE gel and then transferred to a PVDF membrane. PSA was immunodetected as previously described (Sarrats et al., 2010).
Phosphorylation analysis
Analysis of phosphorylation was performed using the ProQ-Diamond phosphoprotein gel stain (Molecular Probes, Invitrogen Corporation, Carlsbad, CA, USA), which detects phosphate groups attached to serine, threonine, and tyrosine residues of proteins (Schulenberg et al., 2004). A total of 25 μg of PSA was immunopurified and electrophoresed together with 1 μL of PipermintStick phosphoprotein molecular weight standards (Molecular Probes, Invitrogen), which contains a mixture of two phosphorylated and four nonphosphorylated proteins. Thus, the standards serve both for as molecular weight markers and as positive and negative controls for the phosphoprotein gel stain. The gel was stained according to the standard protocol for minigels supplied by the manufacturer and visualized by a UV transilluminator. Then, the gel was Coomassie stained to detect all protein bands present.
Results
N-Glycan analysis of PSA 2-DE subforms
PSA from seminal plasma (healthy donor) and from two serum samples (PCa A and PCa B) was separated by 2-DE and stained with coomassie to obtain PSA 2-DE subforms. The serum samples were previously subjected to ethanolamine treatment to release PSA bound to alpha-1-antichymotrypsin (ACT), and then immunopurified. Five spots corresponding to F1, F2, F3, F4, and F5 subforms of PSA could be observed. Their experimental pIs were: 6.4, 6.6, 6.8, 7.0, and 7.2 respectively. However, F5 could not be detected in any of the serum samples analyzed (Fig. 2).

PSA 2-DE subforms of seminal plasma from a healthy donor (
These spots were excised from the 2-DE gels and treated with PNGaseF. N-Glycans released were 2-AB labeled and subjected to NP-HPLC. Four main peaks (3–6) were present in the N-glycan profiles from the seminal plasma PSA and the PCa A serum PSA sample (Fig. 3). N-Glycan assignments of these peaks were performed by exoglycosidase digestions (data not shown). Relative areas and structures assigned to each peak are summarized in Table 1. Peak glucose units (GUs) corresponded to those previously described for the whole PSA N-glycans from seminal plasma and a PCa patient (Tabares et al., 2006). Spots F1, F2, and F3 contained mono- and disialylated complex biantennary structures, F4 contained mainly monosialylated complex biantennary structures and F5 was found not to be N-glycosylated (Fig. 3). This is in agreement with the lower molecular weight that F5 showed in the 2-DE gel (Fig. 2A) and with previous data from Isono et al. (2002). In this article, spots corresponding to F1 to F4 positively stained with Periodic acid-Schiff (PAS) carbohydrate stain, whereas spot F5 did not stain, consistent with its unglycosylated status.
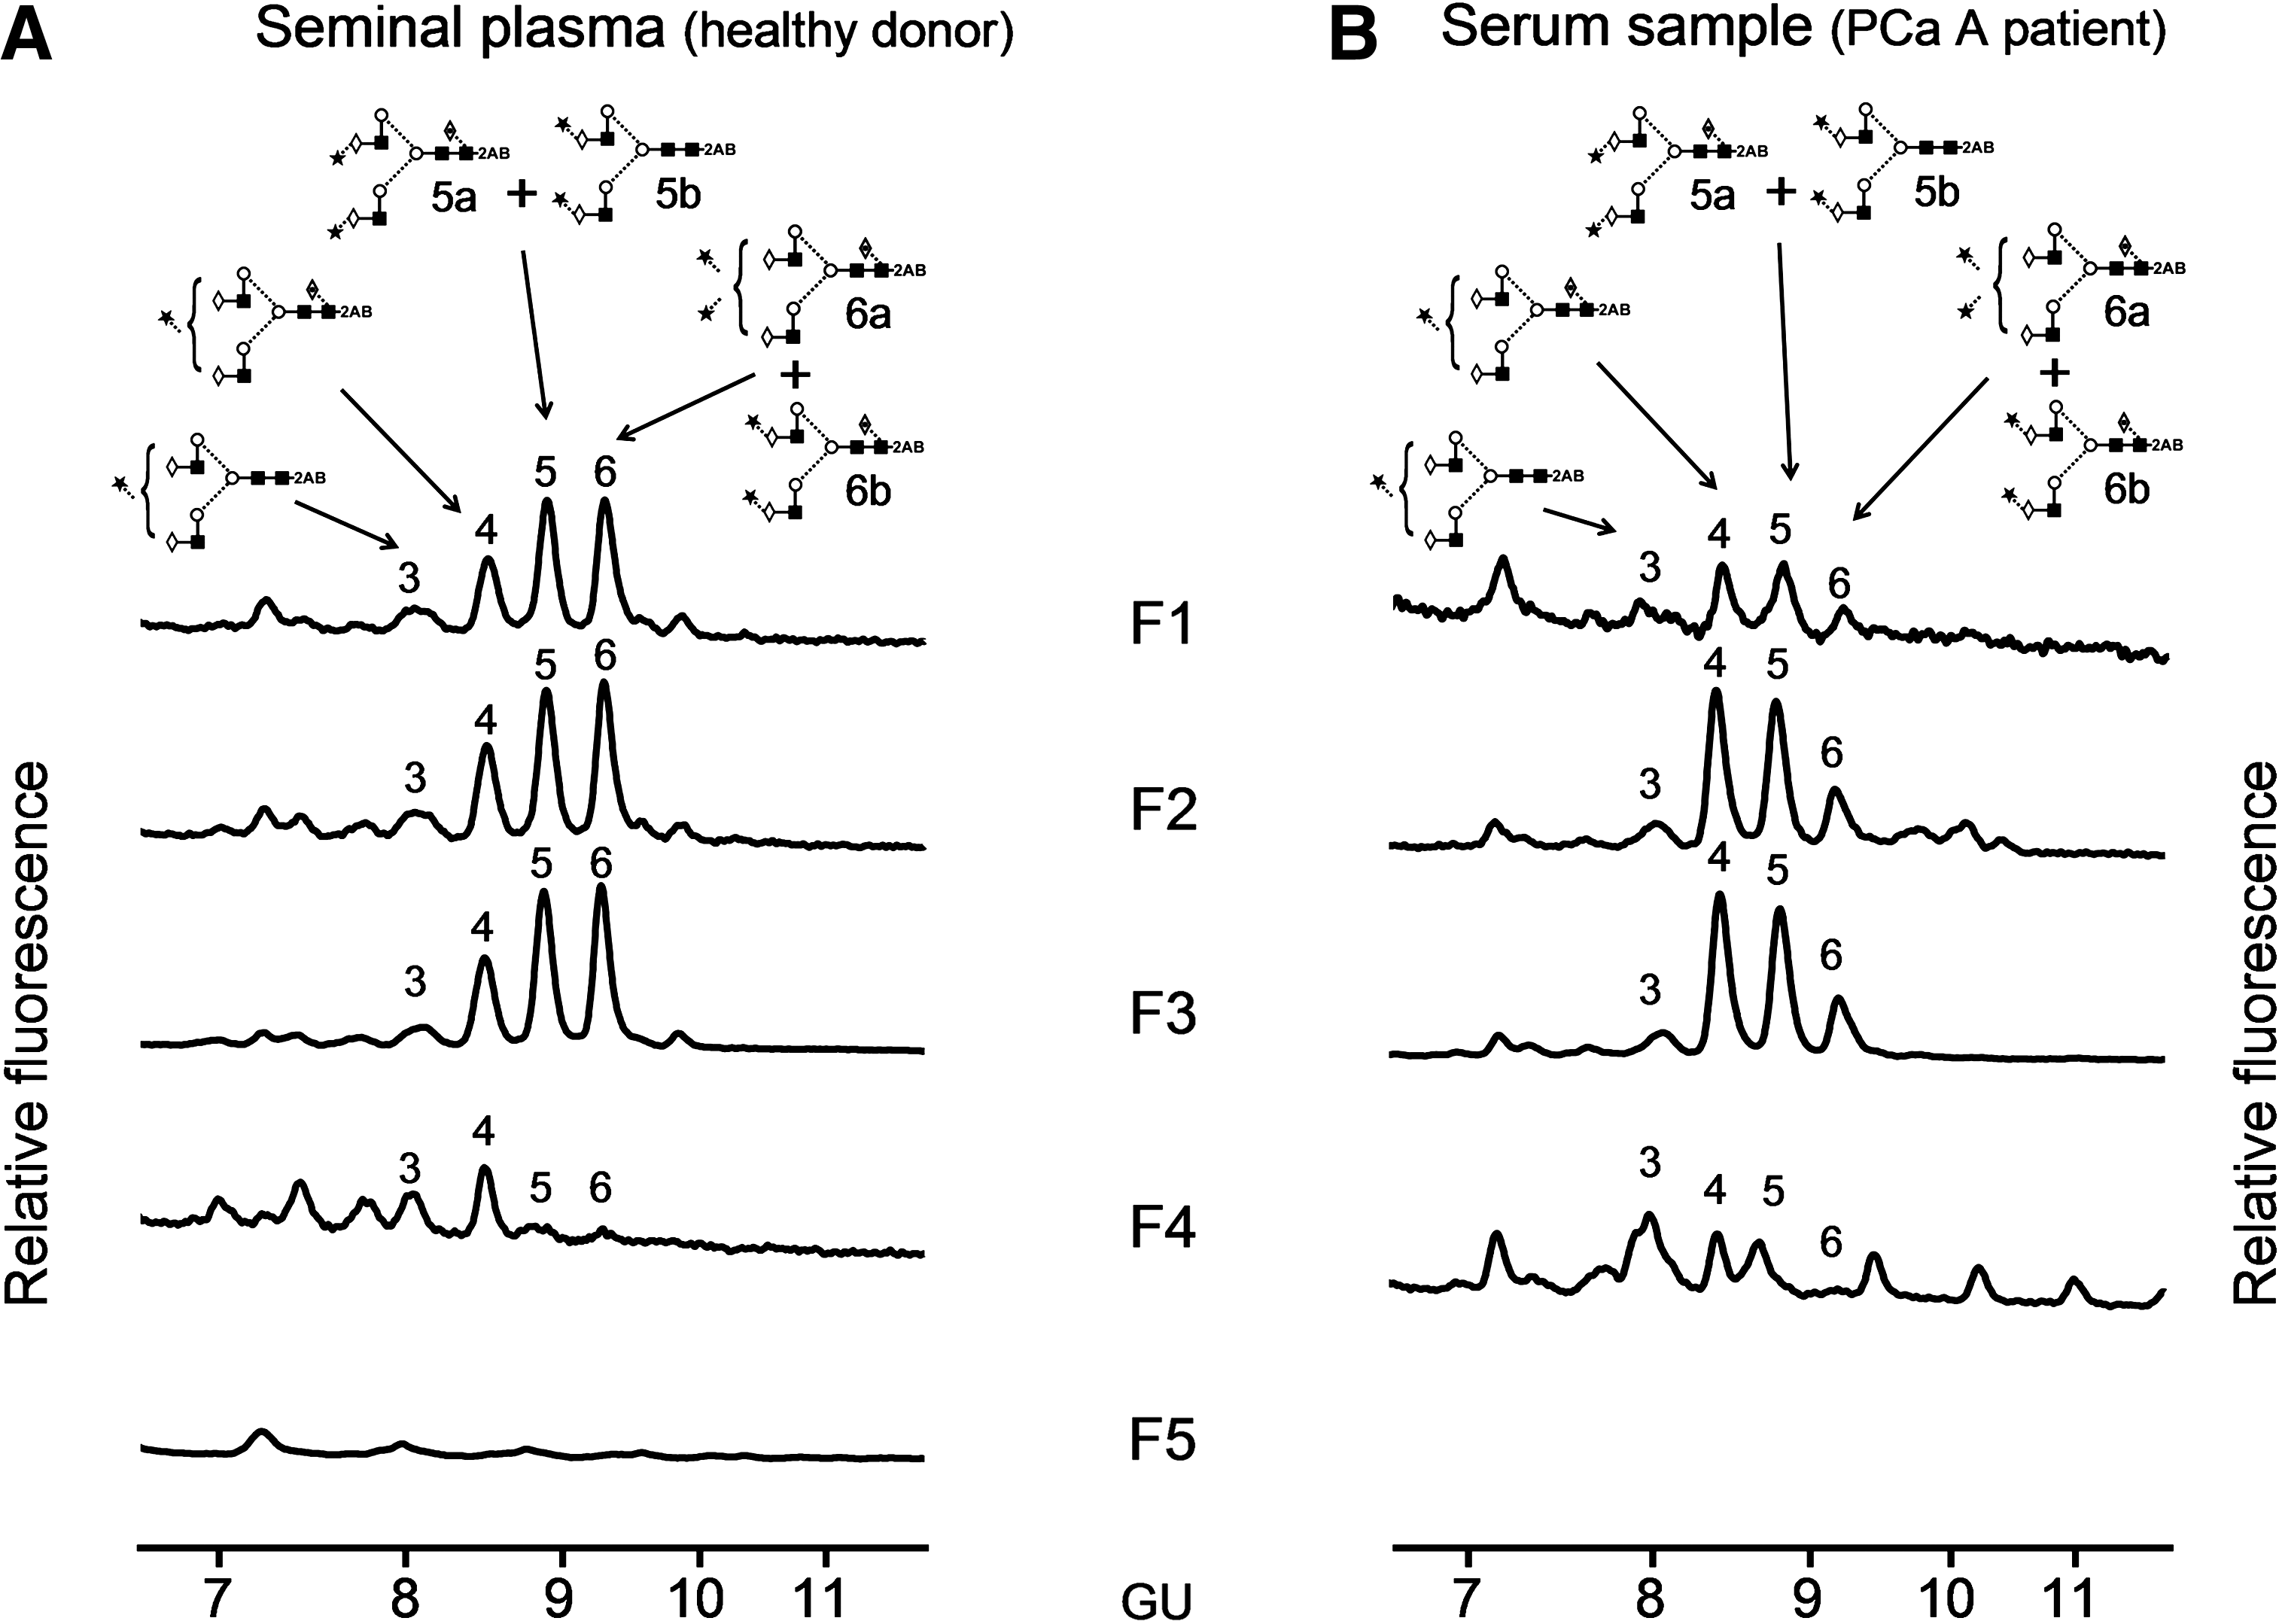
NP-HLPC chromatograms of N-glycans released from each PSA subform (F1–F5) of (

A2 biantenary; G(4), galactose (β1–4 linked); F(6) at the start of the abbreviation indicates fucose linked α1–6 to core GlcNAc; M, mannose; S, sialic acid; sialic acid linkage: (3), α2–3 and (6), α2-6.
Symbol representation of glycans for this table and Figures 3 and 4: GlcNAc, filled square; mannose, open circle; galactose, open diamond; fucose, open diamond with a dot inside; sialic acid, filled star; beta linkage, solid line; alpha linkage, dotted line; unknown linkage, ∼ ; the linkage itself is indicated by the angle linking adjacent residues, thus 1–4-linkage, horizontal line (-); 1–3-linkage, angled line (/); 1–6-linkage, angled line (\); 1–2-linkage, vertical line (|).
GU values of are shown as means ± SD of all spots.
F1, F2, and F3 had basically the same peak areas, and consequently, the same proportion of mono- and disialylated structures. Therefore, the sialic acid content in the N-glycan chains of F1, F2, and F3 cannot account for their different pI. The proportion of mono- and disialylated structures varied between the seminal plasma and the serum samples. F1, F2, and F3 seminal plasma subforms had a higher proportion of disialylated structures (∼70%) compared to serum ones (∼50%) (Table 1).
PCa B serum sample contained less amount of PSA and F2, F3, and F4 could only be analyzed by ABS digestion (data not shown). F2 and F3 had the same profile and contained a higher amount of sialylated glycan structures than F4 in agreement with the above results obtained for PCa A serum and seminal plasma subforms.
The more abundant subform F3 was studied in more detail to investigate the type of sialic acid linkage and its core fucose content, because these have been reported to differ in PSA from benign and malignant origins (Peracaula et al., 2003, Tabares et al., 2006). Thus, F3 from PCa A and from seminal plasma was digested with NANI and ABS (Fig. 4) to study sialic acid linkages and core fucosylation, respectively. The digestion with NANI showed a higher proportion of alpha 2–3 sialic acid in F3 from the prostate cancer sample compared to that from the seminal plasma one (53 vs. 22%).
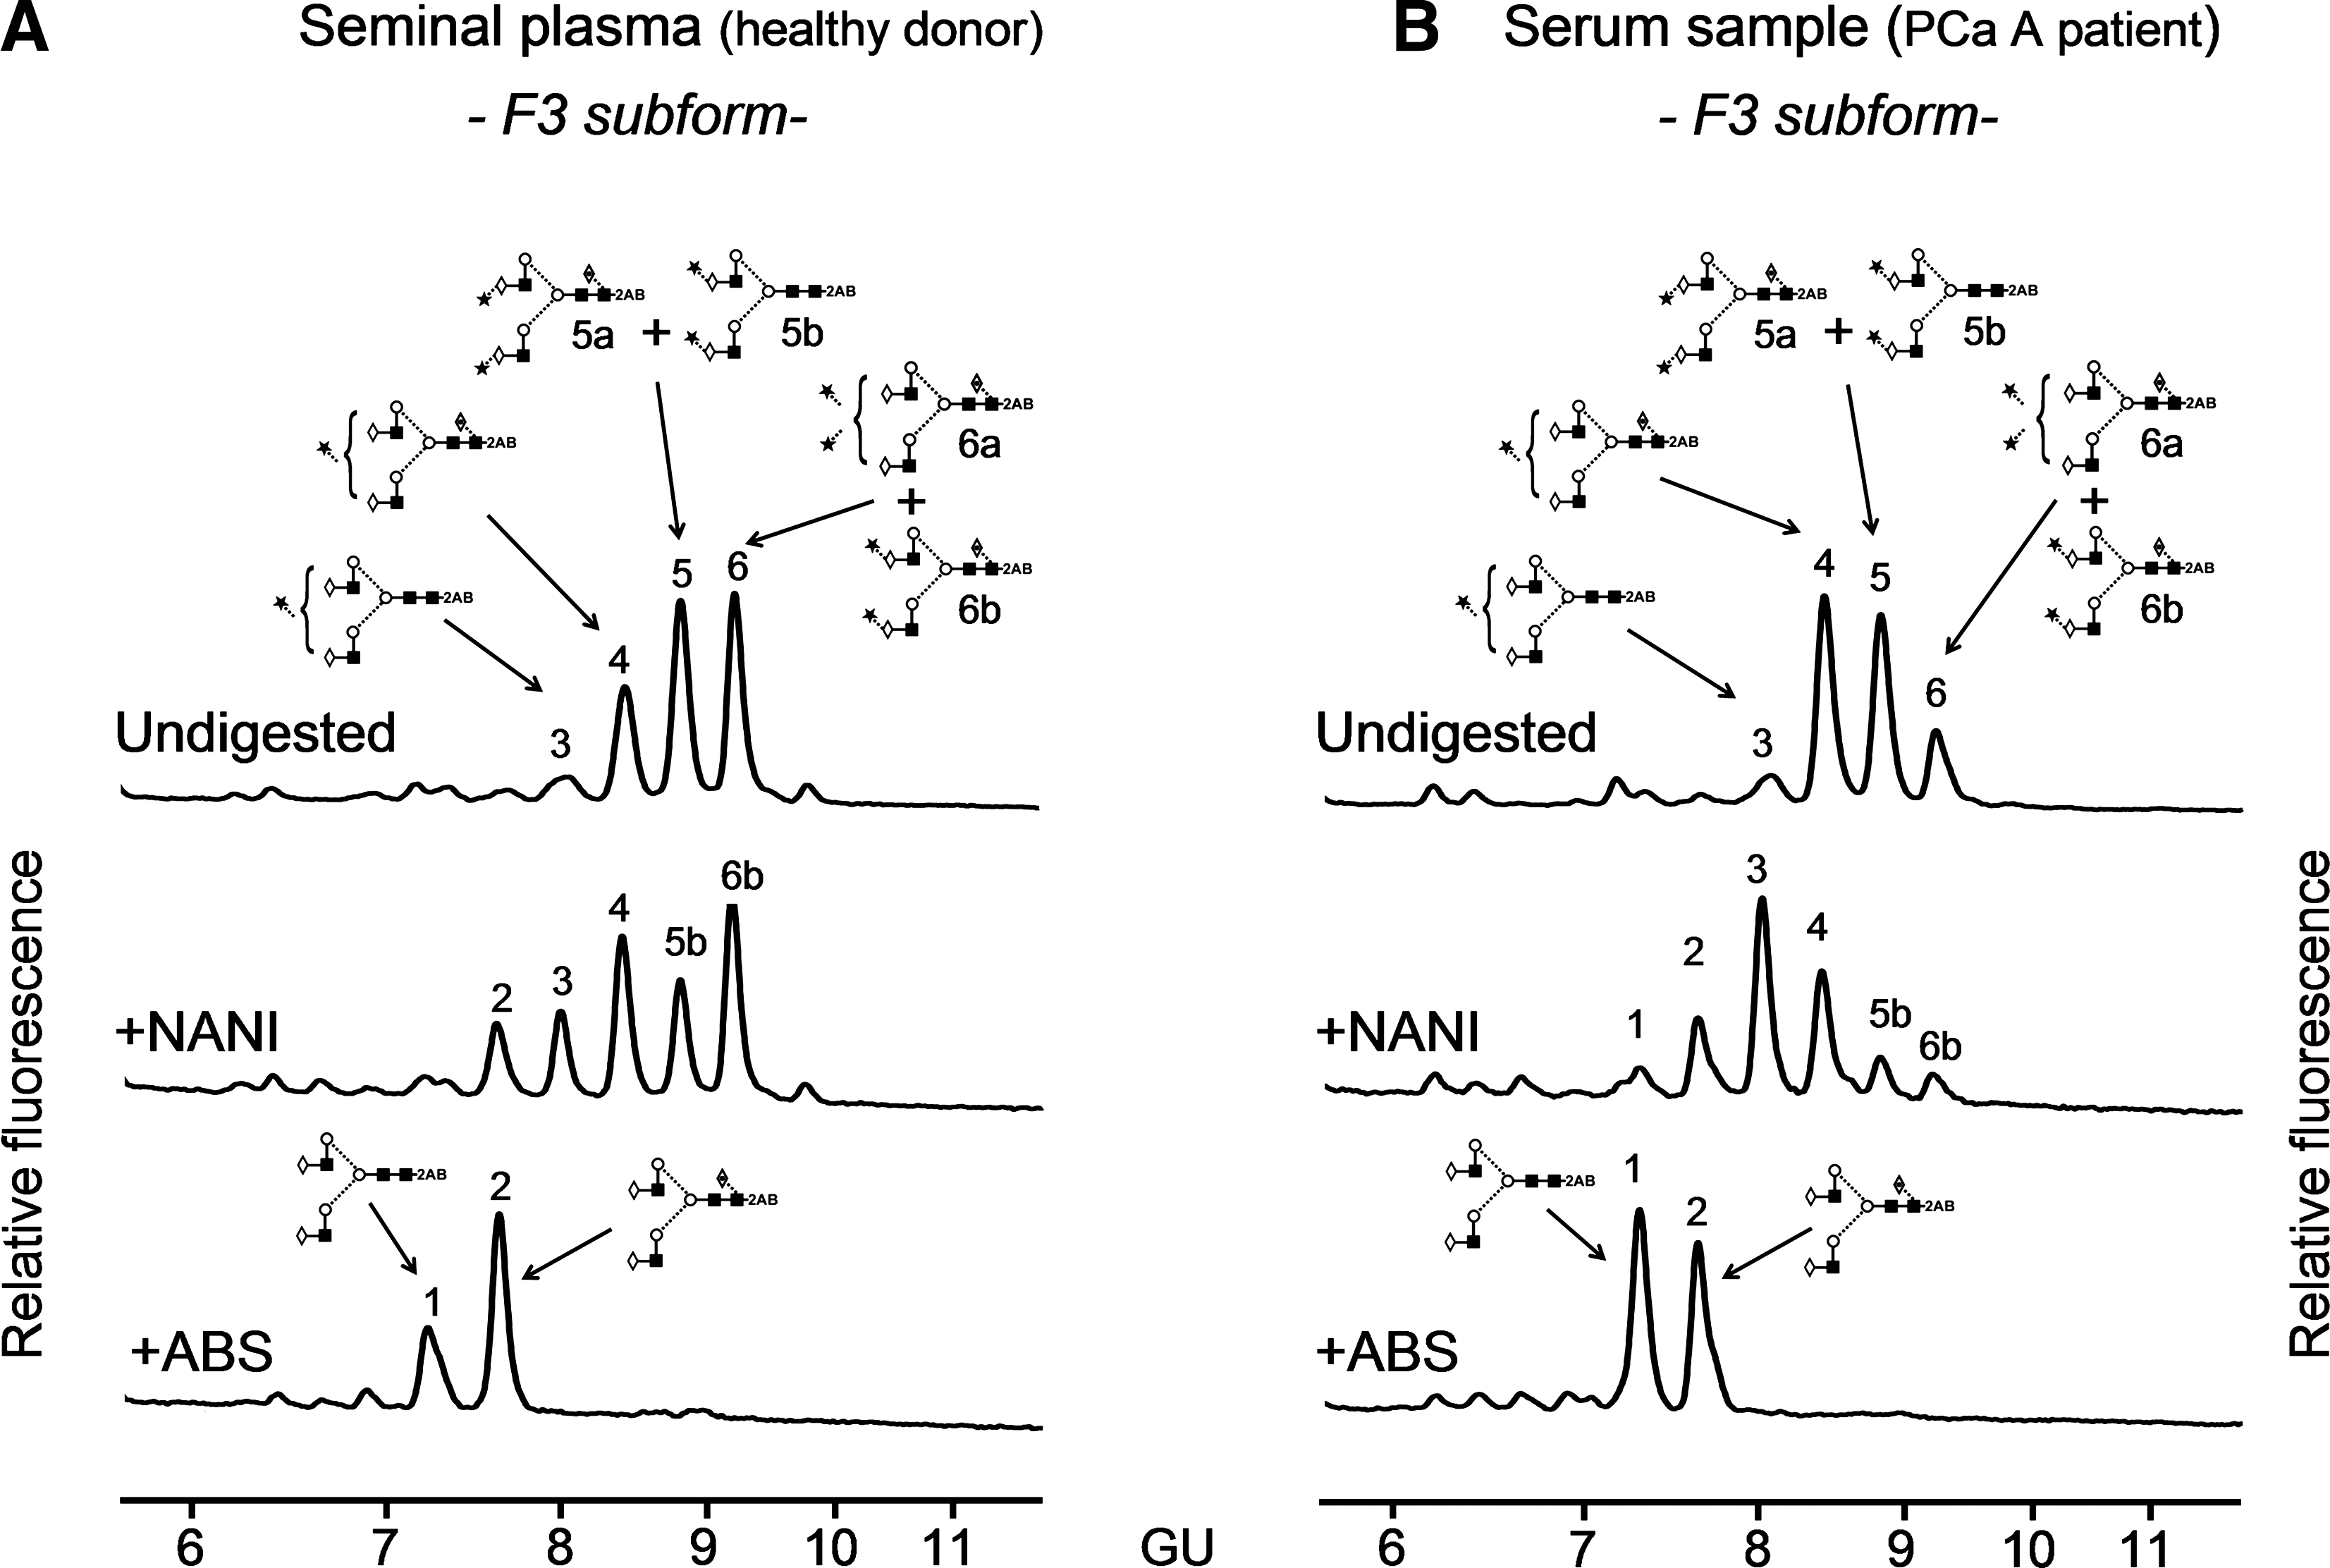
NP-HPLC chromatograms of N-glycans after sialidase digestions with NANI and ABS from the F3 PSA subform of (
ABS, at the working concentration, may partially digest O-acetylated sialic acids. In our analyses all the peaks in the NP-HPLC profile of N-glycans extracted from the PSA subfoms were digested after ABS treatment; therefore, we could say that is likely that PSA N-glycans do not contain O-acetylated sialic acids, although MS analysis would be necessary to confirm it.
After ABS digestion, two peaks were observed and could be assigned to A2G(4)2 (peak 1) and to F(6)A2G(4)2 (peak 2) after a complete set of exoglycosidases (Fig. 4). The relative area of peak 2 (F(6)A2G(4)2) was taken as measure of core fucosylation content. In the seminal plasma sample, core fucosylated structures were more abundant than in the PCa sample A (66 vs. 46%).
MALDI-TOF MS analysis of PSA 2-DE subforms
Analysis of peptide mass fingerprints was performed on the protein spots of the 2-DE seminal plasma gel after N-glycans release. Data confirmed that PSA was the only glycoprotein significantly present in any of the spots and so it was assumed that all N-glycans released were exclusively from this glycoprotein.
Further MS analysis of the PSA spots was performed to investigate possible modifications in the primary PSA sequence that could explain the distinct pI of the different PSA subforms, namely, for F1, F2 and F3. For this purpose, PSA from seminal plasma was first immunopurified and then separated in a 2-DE gel. PSA spots were excised from the gel and analyzed by MALDI-TOF/TOF. PSA was the only protein identified in each spot and neither modifications of the primary sequence nor deamidations of asparagines or glutamines were detected. PSA peptides identified in each spot are shown in Table 2. Peptides containing asparagines or glutamines did not show any shift of mass from the calculated one, and most of them were sequenced by MS/MS confirming that no deamidations had taken place.
1 trypsin miss cleavage is indicated with *.
Calculated mass of the peptides with carbamidomethylated cysteines and oxidated methionines.
Observed mass of the peptides in the MALDI-TOF analysis. Peptides sequenced by MS/MS are marked with †.
O-Glycan analysis of PSA
PSA N-glycosylation has been investigated by different authors (Okada et al., 2001; Peracaula et al., 2003; Tabares et al., 2006; Tajiri et al., 2008). However, no evidence of O-linkages has been reported. To investigate whether O-glycans could be attached to PSA and thereby contribute to the observed differences in subforms pI, a Western blot of PSA from seminal plasma digested with a combination of sialidase (ABS) and O-glycosidase was performed and compared to that digested with sialidase only. The bands of PSA observed for the two digested samples showed the same molecular mass, which was lower than the undigested PSA sample (data not shown). The fact that O-glycosidase did not contribute to the decrease of PSA molecular mass suggests that O-glycans are most likely not present in PSA from seminal plasma.
Phosphorylation analysis of PSA
Analysis of phosphorylation was performed using the ProQ-Diamond phosphoprotein gel stain following electrophoresis of immunopurified PSA. Neither PSA nor negative controls stained positively for the presence of phospho-forms, whereas positive controls did, as expected. All control proteins and PSA bands were subsequently visualized using Coomassie staining. The intensity of Coomassie stained PSA was higher than any of the phosphoproteins controls, suggesting that the absence of signal for phosphorylated PSA was not due to limitations in the amount of protein sample (data not shown).
Discussion
Analysis of PSA glycosylation from sera is a challenging work as some of the differences between BPH and PCa serum PSA could be due to a different glycosylation pattern of this molecule and could therefore be exploited to improve specificity in PCa diagnosis. The low amount of PSA in sera is, however, the limiting step to fully characterize the glycan structures of PSA. So far, few groups have reported the detailed glycan structures of serum PSA from PCa patients (Tabares et al., 2006; Tajiri et al., 2008). Taking into account that the PSA 2-DE subforms (F1–F5) show different proportions between BPH and PCa sera (Sarrats et al., 2010), in this work we have characterized by N-glycan sequencing these 2-DE spots of PSA samples from PCa patients' sera. We also performed the N-glycan analysis of the corresponding F1–F5 PSA subforms from seminal plasma to compare them with those originating from PCa.
Characterization of PSA 2-DE subforms
The N-glycan analysis of PSA subforms from both seminal plasma and PCa patients' sera showed that F1, F2, and F3 exhibited the same N-glycan pattern, which differed from F4 and F5. This may account for some of the differences in F1–F5 pI. The different content of sialic acid in the N-glycans from F3, F4, and F5 PSA subforms correlated with their different experimental pI detected by 2-DE. The subform F5 did not appear to be glycosylated and had a pI of 7.2, which corresponds to the theoretical one for PSA (7.26). F4 had a lower pI (7.0), which can be explained by the presence of mainly monosialylated N-glycans that contain negative charge. The F3 subform showed an even lower pI (6.8). It contains a much higher proportion of disialylated N-glycans, which would again contribute to this further decrease in pI. However, F1, F2, and F3 subforms all showed the same N-glycosylation pattern despite having different pI values (6.4, 6.6 and 6.8, respectively). Therefore, it seems likely that factors other than N-glycosylation may be modifying the theoretical pI of PSA (7.26), such as changes in the primary sequence or different posttranslational modifications (PTM). Deamidation of asparagines or glutamines have been suggested as modifications responsible for the spot trains of some serum proteins obtained in a 2-DE gel (Sarioglu et al., 2000). The deamidation process generates negatively charged aspartic and glutamic acid residues, which can modify a protein's pI. However, in the MS analysis of the seminal plasma PSA subforms, neither modifications of the primary sequence nor deamidations were detected. O-glycosylation was investigated as a possible contributing factor to the differences in the subforms pI. However, in our hands, O-glycan modifications were not detected in PSA. Phosphorylation has also been described (along with glycosylation) as one of the most common PTM that can contribute to changes in a protein's pI (Gorg et al., 2004). The phosphorylation status of PSA was therefore analyzed, but no phosphorylated residues were detected. Other authors have suggested that the presence of proPSA forms are constituents of the total free PSA subforms detected in the serum by 2-DE. Tabares et al. (2007) reported the presence of proPSA forms in some of the free PSA serum 2-DE subforms. However, in our PSA 2-DE subforms from serum, the contribution from proPSA would be quite small as the majority of the PSA analyzed corresponded to active PSA previously bound to ACT. In addition, it is well known that PSA from seminal plasma does not contain proPSA forms (Mikolajczyk et al., 2002) and we detected the same five PSA subforms (F1–F5) that in serum. Taken together, the contribution of proPSA to the detected spot pattern can be ruled out.
In summary, differences in N-glycosylation partially explain the different isoelectric points observed for the PSA subforms, although the modifications that lead to different pIs between F1, F2, and F3 remain unknown.
N-Glycosylation of PSA 2-DE subforms in prostate cancer: Changes in sialylation and fucosylation
In the present study we describe a decrease of disialylated N-glycans in F4 compared to those in F3 for both seminal plasma and serum samples. Taking into account that the pIs of these subforms are the same for PSA samples from PCa serum, BPH serum, and seminal plasma (Sarrats et al., 2010) the decrease in sialylation described for the PSA F4 subform is likely to occur also in the corresponding F4 subform from BPH serum. When comparing the percentages of these subforms in BPH and PCa sera, a decrease in F3 and an increase in F4 in PCa patients sera compared to BPH patients sera has been reported (Sarrats et al., 2010). Taken together, a reduction in sialylation of serum PSA in PCa patients compared to that in BPH patients is suggested. In support of this hypothesis, PSA from BPH was described as possessing increased sialylation when compared with that from PCa and LNCaP in the work by Huber et al. (1995). The latter used chromatofocusing techniques combined with sialidase digestion. Recently, Meany et al. (2009) developed five lectin immunosorbant assays to analyze sialylation of total and free serum PSA. SNA and MAA lectin assays for total PSA showed higher electrochemiluminescence intensities in BPH patients than PCa patients, suggesting a higher sialylation of total serum PSA in BPH than in PCa patients.
Our previous results indicated a negative correlation between the percentage of F3 and a positive correlation between the percentage of F4 and the PCa stage (Sarrats et al., 2010). Thus, the potential decrease in PSA associated sialylation might be more marked as the cancer becomes more advanced. In fact, in the prostate cancer cell line LNCaP, which was derived from a node metastasis, a complete absence of sialylated structures was reported for PSA (Peracaula et al., 2003). A decrease in SNA reactivity on free PSA oligosaccharide chain has also been reported in PCa patients with metastatic tumors compared to those with localized tumors, suggesting a relationship between the progression of this cancer and the level of sialic acid (Kosanovic and Jankovic, 2005).
A general decrease in sialic acid content can be observed when comparing the percentage of mono/disialylated structures between PSA spots from PCa patient serum with those from healthy donor's seminal plasma. Seminal plasma PSA contains a greater proportion of disialylated structures in the F1, F2, and F3 subforms compared with those from PCa serum PSA (Table 1). We further examined the specific sialic acid linkage and observed an increase in alpha 2–3 linked sialic acid in the F3 PSA subform for the PCa patient (53%) compared with that from the healthy donor's seminal plasma (22%). These changes in this major subform may be considered representative of the whole PSA, as F3 accounts for 50–70% of all PSA subforms. The percentage of alpha 2–3 sialic acid in seminal plasma PSA was consistent with our previous analyses (25%) (Tabares et al., 2006) and with studies by Ohyama and coworkers (∼20%) (Ohyama et al., 2004). In the same study, we observed a different proportion of alpha 2–3 linked sialic acid in the PSA present in patients, which was decreased in relation to that from healthy seminal plasma (15 vs. 25%) (Tabares et al., 2006). However, our present results are more consistent with the observations made by other authors (Ohyama et al., 2004; Tajiri et al., 2008).
The percentage of core fucosylation in the main PSA subform, F3, from a PCa patient's serum (46%) was lower than that present in the same subform from healthy donor's seminal plasma PSA (66%). This result is consistent with our previous work with serum PSA from a different PCa patient, although there, the decrease in core fucosylated structures in PCa compared to seminal plasma was more pronounced (16 vs. 80%) (Tabares et al., 2006). In agreement with these results, recently a decrease in the core fucosylated biantennary structure has also been reported in seminal plasma PSA from PCa patients compared to seminal plasma from healthy and BPH patients (White et al., 2009). These data suggest that this N-glycan modification might be used for detecting tumour related PSA.
These changes in PSA N-glycan chain are likely to occur within the prostate cell, throughout the secretory pathway, and these will probably include changes in alpha 2–3 and 2–6 sialyltransferases and in fucosyltransferases expression. Changes in the expression of some glycosyltransferases have been described in prostate tumor cells compared to normal prostate tissue (Barthel et al., 2008). The study of the molecular mechanisms involved in the glycosylation changes in prostate tumor tissues, such as alteration in the glycosyltransferase expression pattern, would be required to explain PSA N-glycan changes.
Conclusions
N-Glycan analysis of each PSA subform (F1–F4) from both prostate cancer sera and seminal plasma revealed differences in N-glycan sialylation for F3 and F4 subforms. F3 (which is decreased in PCa patient sera compared to BPH) showed both mono and disialylated N-glycans, whereas F4 (which is increased in PCa patient sera) showed mainly monosialylated glycans in all samples analyzed. Assuming that these N-glycan changes between F3 and F4 would also be present in the PSA subforms from BPH serum, the degree of PSA sialylation might be exploited to distinguish PCa from BPH. However, the development of assays to directly measure sialylation and/or core fucosylation of PSA serum is required to analyze a large set of samples and to determine whether these PSA N-glycan changes could help to discriminate between benign and malignant conditions of the prostate.
Footnotes
Acknowledgments
A.S. acknowledges University of Girona for a pre-doctoral fellowship and for a short-term mobility fellowship. We thank Dr Marion Boland for careful reading of this manuscript, the UCD Conway Mass Spectrometry Resource (NIBRT, University College Dublin), and the Proteomics Platform of Barcelona Science Park (University of Barcelona) for the Mass Spectrometry analysis. This work was supported by EUROCarbDB ( ) RIDS Contract No. 011952, the Spanish Ministerio de Ciencia e Innovación (grant BIO 2007-61323, awarded to R.P), La Marató de TV3 foundation (grant 050932, awarded to R.P), and the Government of Catalonia (grant 2005SGR00065, awarded to R.L.).
Author Disclosure Statement
The authors declare that no conflicting financial interests exist.