




Abstract
Abstract
Transcription factors (TFs) are crucial modulators of gene regulation during the development and progression of tumors. We previously reported the activation of TFs in nasopharyngeal carcinoma (NPC) cell lines. In this study, we explored the activity profiles of TFs in Protein/DNA array data of a 12-tissue independent set and a 13-tissue pooled set of NPC that included different clinical stages. TFs associated with tumor progression were revealed using a generalized linear model-based regression analysis. Immunohistochemical analysis of clinical NPC samples was used to validate the results of array analysis. We identified 26 TFs that showed increased activities. Of these 26 TFs, 16 were correlated with clinical stages. Activity changes of AP2 and ATF/CREB were confirmed by electrophoretic mobility shift assay (EMSA), and increased expression of AP2α, β, γ, ATF2, and ATF1 in nuclei of tumor cells was associated with clinical stages. In addition, the expressions of AP2α, ATF2, and ATF1 were correlated with those of their target genes (epithelia growth factor receptor (EGFR) and matrix metalloproteinase 2 (MMP-2), respectively). This study provides data and valuable clues that can be used to further investigate the laws of gene transcription regulation in NPC and to identify suitable targets for the development of TF-targeted antitumor agents.
Introduction
Transcription factors (TFs) that execute abnormal signal instructions from upstream molecules play critical roles in carcinogenesis. Many molecules in signaling pathways, especially those that are tissue specific, overactivated, or inactivated successively, may cause abnormal TF activation and gene expression and thereby promote the development and progression of NPC. Some TFs overexpressed or overactivated in NPC tissue and cell lines have been reported (Chen et al., 2001; Huang et al., 2006; Hui et al., 2002; Oneil et al., 2008; Rayet and Gelinas, 1999; Thornburg et al., 2003; Tsai et al., 2006), but systematic data revealing dynamic changes in activity patterns of TFs during progression of this tumor are lacking. The relationship between activity changes in TFs and the expression patterns of their target genes in NPC remains largely unknown, but increasing knowledge about the functions of TFs and their target genes provides opportunities to understand the laws of gene regulation during tumor progression via integration of information about TF activity profiles with information about gene expression profiles. In this study, we used protein/DNA arrays to screen for TFs activated at different clinical stages of NPC. We discovered differentially activated TFs that showed kinetic changes in concert with the progression of this neoplasm.
Materials and Methods
Tissue specimens
Before collecting specimens, written informed consent was obtained from each patient at the Second Affiliated Hospital of Central South University and the Tumor Hospital of Hunan Province who underwent epipharyngoscopy during the initial diagnosis. Each biopsy sample with primary NPC was divided into two sections: one was submitted for routine histological diagnosis for NPC, and the other was flash frozen and stored in liquid nitrogen until analysis or fixed in formalin and embedded in paraffin. NPC specimens were classified according to the 1997 UICC/AJCC TNM staging system (Chan et al., 2002). All specimens were utilized in accordance with an institutional review board-approved protocol.
To rule out activity changes of TFs due to stromal cell contamination, we first confirmed that each tumor specimen used for protein/DNA array detection contained >70% cancer cells by analyzing representative sections from each case. Because most of the specimens were too small to extract sufficient nuclear proteins, we selected 25 samples classified as WHO grade II to use for array detection. These samples were divided into two experimental sets: an independent set of 12 relatively massive samples, each of which was independently applied to array detection, and a set of 13 relatively small samples that were pooled according to clinical staging. Table 1 lists clinical data and staging information.
For immunohistochemical staining, two cohorts of samples were used. One contained a total of 133 cases (87 NPC and 46 normal nasopharyngeal epithelia) that were used for immunohistochemical analysis of AP2α, AP2β, AP2γ, and EGFR expression. The other contained a total of 131 cases (80 NPC and 51 normal nasopharyngeal epithelia) that were used for immunohistochemical analysis of ATF2, ATF1, and MMP-2 expression. Clinical data and staging information are provided in Table 2.
Protein/DNA array analysis
Nuclear extraction and the protein/DNA array have been described previously (Carson and Khan, 2006). The array analysis procedure was performed according to the manufacturer's instructions (Panomics Inc., Redwood City, CA, USA). Nuclear proteins from samples were prepared using the Panomics nuclear extraction kit (Catalog No. AY2002) following the manufacturer's instructions, and proteins then were analyzed using the protein/DNA combo array with spin column preparation (Catalog No. MA1215) (http://www.panomics.com). Ten micrograms of nuclear extract from tissue samples were incubated with 10 μL of TransSignal probe mix (Panomics) containing 345 biotin-labeled double-stranded oligonucleotides for 30 min at 15°C. TFs bound to the double-stranded oligonucleotides were recovered using the Panomics spin column. The biotin-labeled oligonucleotides specifically bound to the TFs were eluted and hybridized to the TransSignal array membrane containing oligonucleotides (representing 345 consensus binding sites for TFs) overnight at 42°C. The blots were then washed and incubated with a horseradish peroxidase (HRP)-conjugated streptavidin according to the manufacturer's instructions. Hybridization signals on the array were detected using standard chemiluminescence procedures with ECL film (Hyperfilm ECL, Amersham Pharmacia Biotech, Uppsala, Sweden), and densitometric analysis of the images was conducted using ImagequantTM software (Amersham). The data were normalized using a previously described method (Saban et al., 2007).
Array data analysis
To identify the TFs for which activities were differentially altered among different clinical stages of NPC, we first analyzed data from the 12-case independent data set using one-way analysis of variancde (ANOVA) (two-sided, p < 0.05) to extract the TFs that showed statistically significant differences. To identify the TFs that are characteristic of the presence or absence of lymph node metastasis and those that are characteristic of stage I versus stage II/III/IV, we selected TFs on the basis of statistical difference between mean activity values of stage I versus stage II/III/IV (two-sided t-test, p < 0.05) in the independent set. We next used clustering software (Cluster 3.0) to compare the independent set and the pooled set to find the TFs that showed the same activity changes in both sets. To identify TFs correlated with tumor progression, we used a generalized linear model-based regression analysis to analyze the data from the independent set (Durbin and Rocke, 2003). This model reduces the relationship between an explanatory variable X (the activity value of the TF) and a response variable Y (the four categorized stages) into a linear relation: Y = α + β X, where α is the intercept and β is the regression coefficient. We applied this method to each of the TFs that we found to be differentially activated on the basis of the analysis described above, and then we extracted those for which the p-value of β was <0.05.
Electrophoretic mobility shift assays (EMSAs)
EMSAs were performed according to the instructions provided with the Chemiluminescent Nucleic Acid Detection Module (Pierce, Biotechnology, Inc, Rockford, IL, USA.). Briefly, 5 μg of nuclear extract (NE) from tissue samples described above were mixed with 1 × binding buffer (10 mM Tris-HCl pH 7.5, 50 mM KCl, 1 mM DDT, 1 μg poly dI–dC, 2.5% glycerol, 5 mM MgCl2, 1 mM EDTA), with or without 200 × unlabeled cold probe. Next, 20 fmol/μL of biotin-labeled probe were added and the sample was incubated at room temperature for 30 min. Free probe (without NE) was used as a negative control. A sequence identical to the TranSignalTM Protein/DNA combo array sequence was used as a probe. The consensus probe sequence for AP2 was 5′-GATCGAACTGACC
Immunohistochemical analysis
Immunohistochemical analysis was performed as described previously (Oyama et al., 2002). Paraffin-embedded NPC tissue sections from different clinical stages were deparaffinized in xylene and hydrated through graded alcohols and distilled water, followed by antigen retrieval by heat treatment in 10 mM sodium citrate buffer (pH 8.0). Slides were incubated in 3% H2O2 in ethanol to quench the endogenous peroxidase. After incubation with 10% normal goat serum, sections were incubated with primary antibodies at 4ºC overnight. Positive signals were developed with peroxidase-conjugated secondary antibody (Boster Biological Technology, Wuhan, China) using 0.5% diaminobenzidine/H2O2 followed by counterstaining with Mayer's hematoxylin, dehydration, clearing, and mounting. The slides treated with normal goat serum rather than primary antibody were evaluated as negative controls. The primary antibodies used in this study were AP2α (sc-12726), AP2β (sc-8976), AP2γ (sc-12762), ATF2 (sc-187), ATF1 (sc-270) (Santa Cruz Biotechnology, Santa Cruz, CA, USA), EGFR (Cell Signaling Technology, Danvers, MA, USA), and MMP-2 (Maixin Biological, Fuzhou, China). All antibodies were used at a working dilution of 1:100.
All slides were evaluated independently by two investigators who were blinded to the patient's clinical data. Any discrepancies were resolved following discussion between the two investigators. Nuclear staining for TFs and membranous staining for EGFR were observed in tumor cells. The percentage of tumor cells showing positive staining was scored for each antibody under study. Staining intensity was not considered in our scoring method because we noted that it was more or less constant. The following grading system was used to score the number of positive stained cells in the tumor or normal nasopharyngeal epithelia (Hui et al., 2002): 0, no staining; + /–, very occasional single cell positive; + , few positive cells either in foci or scattered; + + , moderate numbers either in foci or scattered; + + + , large numbers of positive cells.
Western blot analysis
For Western blot analysis, cytoplasmic and nuclear proteins were extracted from biopsy samples of different clinical stages of NPC using NE-PER nuclear and cytoplasmic extraction reagents according to the manufacturer's instructions (Pierce). Total protein extracts were prepared from tissues by incubation in a lysis buffer containing 50 mM Tris-HCl pH 8.0, 150 mM NaCl, 0.02% sodium azide, 0.1% SDS, 1% Nonidet P-40, 0.5% sodium deoxycholate, 1 mM NaF, 1 mM Na3VO4, and complete protease inhibitor cocktail (Roche, Mannheim, Germany). The total lysates were then centrifuged at 12,000 rpm for 10 min. Protein contents were determined using a BCA protein assay kit (Pierce). Protein extracts (40 μg) were resolved on 10% SDS-polyacrylamide gels. The proteins were transferred onto PVDF membranes, incubated with 5% skim milk at room temperature in TTBS (20 mM Tris-HCl, pH 7.5, 500 mM NaCl, 0.1% Tween-20), and then incubated at 4°C for 12 h with primary antibody against AP2α, AP2β, AP2γ, ATF2, and ATF1. AP2α and ATF2 were each diluted to 1:200; AP2β, AP2γ, and ATF1 were diluted to 1:100. The mouse monoclonal antihuman β-actin antibody sc-47778 (Santa Cruz Biotechnology) was used at a dilution of 1:200. After being washed with TTBS, the membranes were incubated at 37°C for 1 h with goat antirabbit IgG and goat antimouse IgG secondary antibodies diluted at 1:1000 (Boster Biological Technology). The membranes were developed using the chemiluminescent substrate ECL detection system (Amersham), and bands were visualized on X-ray film (Kodak).
Real-time reverse transcription-polymerase chain reaction (RT-PCR)
Total RNA was isolated from biopsy samples of different clinical stages of NPC using TRIzol reagent (Invitrogen, Carlsbad, CA, USA). Reverse transcription was conducted using the RT-PCR system (Promega, Madison, WI, USA). Real-time PCR analysis was performed in a 20 μL final reaction volume using SYBR Green I Supermix (Takara, Dalian, China) according to the manufacturer's protocol. All reactions were run in triplicate on an iCycler IQ multicolor Detection System (Bio-Rad, Hercules, CA, USA) with the following cycling parameters: 95°C for 10 s, 40 cycles of 95°C for 5 s, annealing at 60°C for 15 s, and final extension at 72°C for 20 s. All quantitations were normalized to the level of GAPDH RNA in the reaction. The comparative threshold cycle (CT)(Δ Δ CT) method, which compares differences in CT values between common reference RNA and target gene RNA, was used to obtain the relative fold changes in gene expression. Primers for PCR were designed using Primer 3.0 online. Primer sequence were as follows: EGFR forward: tgcgaaggcgccacatcgtt, reverse: tacaccgtgccgaacgcacc; MMP-2 forward: atgacagctgcaccactgag, reverse: atttgttgcccaggaaagtg; and GAPDH forward: gagtcaacggatttggtcgt, reverse: ttgattttggagggatctcg. The results are expressed as mean ± SE.
Statistical analysis
All statistical analyses were performed using the statistical package SPSS 13.0 (SPSS, Inc., Chicago, IL, USA). We used one-way ANOVA or Student's t-test to analyze activity differences among groups. A generalized regression model was used to determine whether NPC progression (from stage I to stage IV) depended on intranuclear activity alterations of tumor-related TFs. Pearson's χ2 test or Fisher's exact test was used to analyze expression differences of TFs and their target genes between normal nasopharyngeal epithelia and tumor samples. Correlation analysis was performed using Fisher's exact test and Spearman's rank test. Expression analyses were performed in at least three independent experiments. All results are presented as mean ± SD or SE. For all tests, a two-sided p < 0.05 was considered significant.
Results
The activity profiles of TFs in clinical stages of NPC
As shown in Figures 1 and 2, numbers of activated TFs increased gradually from stage I to stage IV, concomitant with enhanced positive signal intensity. However, signal intensity of some TFs fluctuated among stages, whether in the pooled set or the independent set. In addition, individual variations among samples within each clinical stage also were observed (Fig. 1). The analysis detected 52 TFs with significant differential activities in the independent set (p < 0.05). The most conspicuous changes in activities occurred between stages I and III/IV. Therefore, we extracted nine TFs that each showed a significant difference (two-sided t test, p < 0.05) in activity between stages I and II/III/IV in the independent set. Of these nine TFs, six (AP1, GAS/ISRE, AP2, C/EBP, LXRE1, and stat5b) were also among the 52 TFs described above; the remaining three (Elf-1, CEA, and Oct-1) were new. Of the total 55 TFs, the change in activity patterns of 26 TFs were similar between the pooled set and the independent set. The activities of these TFs showed dynamic changes, and all of their activities increased during tumor progression (Fig. 3). To identify TFs for which activities increased in correlation with the clinical stage, we used regression analysis to analyze the 26 TFs. The analytic results showed that 16 TFs were upregulated in association with the progression of clinical stages (Table 3).

Chemiluminescence images of the protein/DNA combo array probed with nuclear proteins extracted from biopsy tissues of patients in the independent set. A full listing of the binding elements present on the array is available from the Panomics Web site (http://www.panomics.com). Clinical staging for samples:

Chemiluminescence images of the Protein/DNA combo array probed with nuclear proteins extracted from biopsy tissues of patients in the pooled set. Clinical staging for samples:
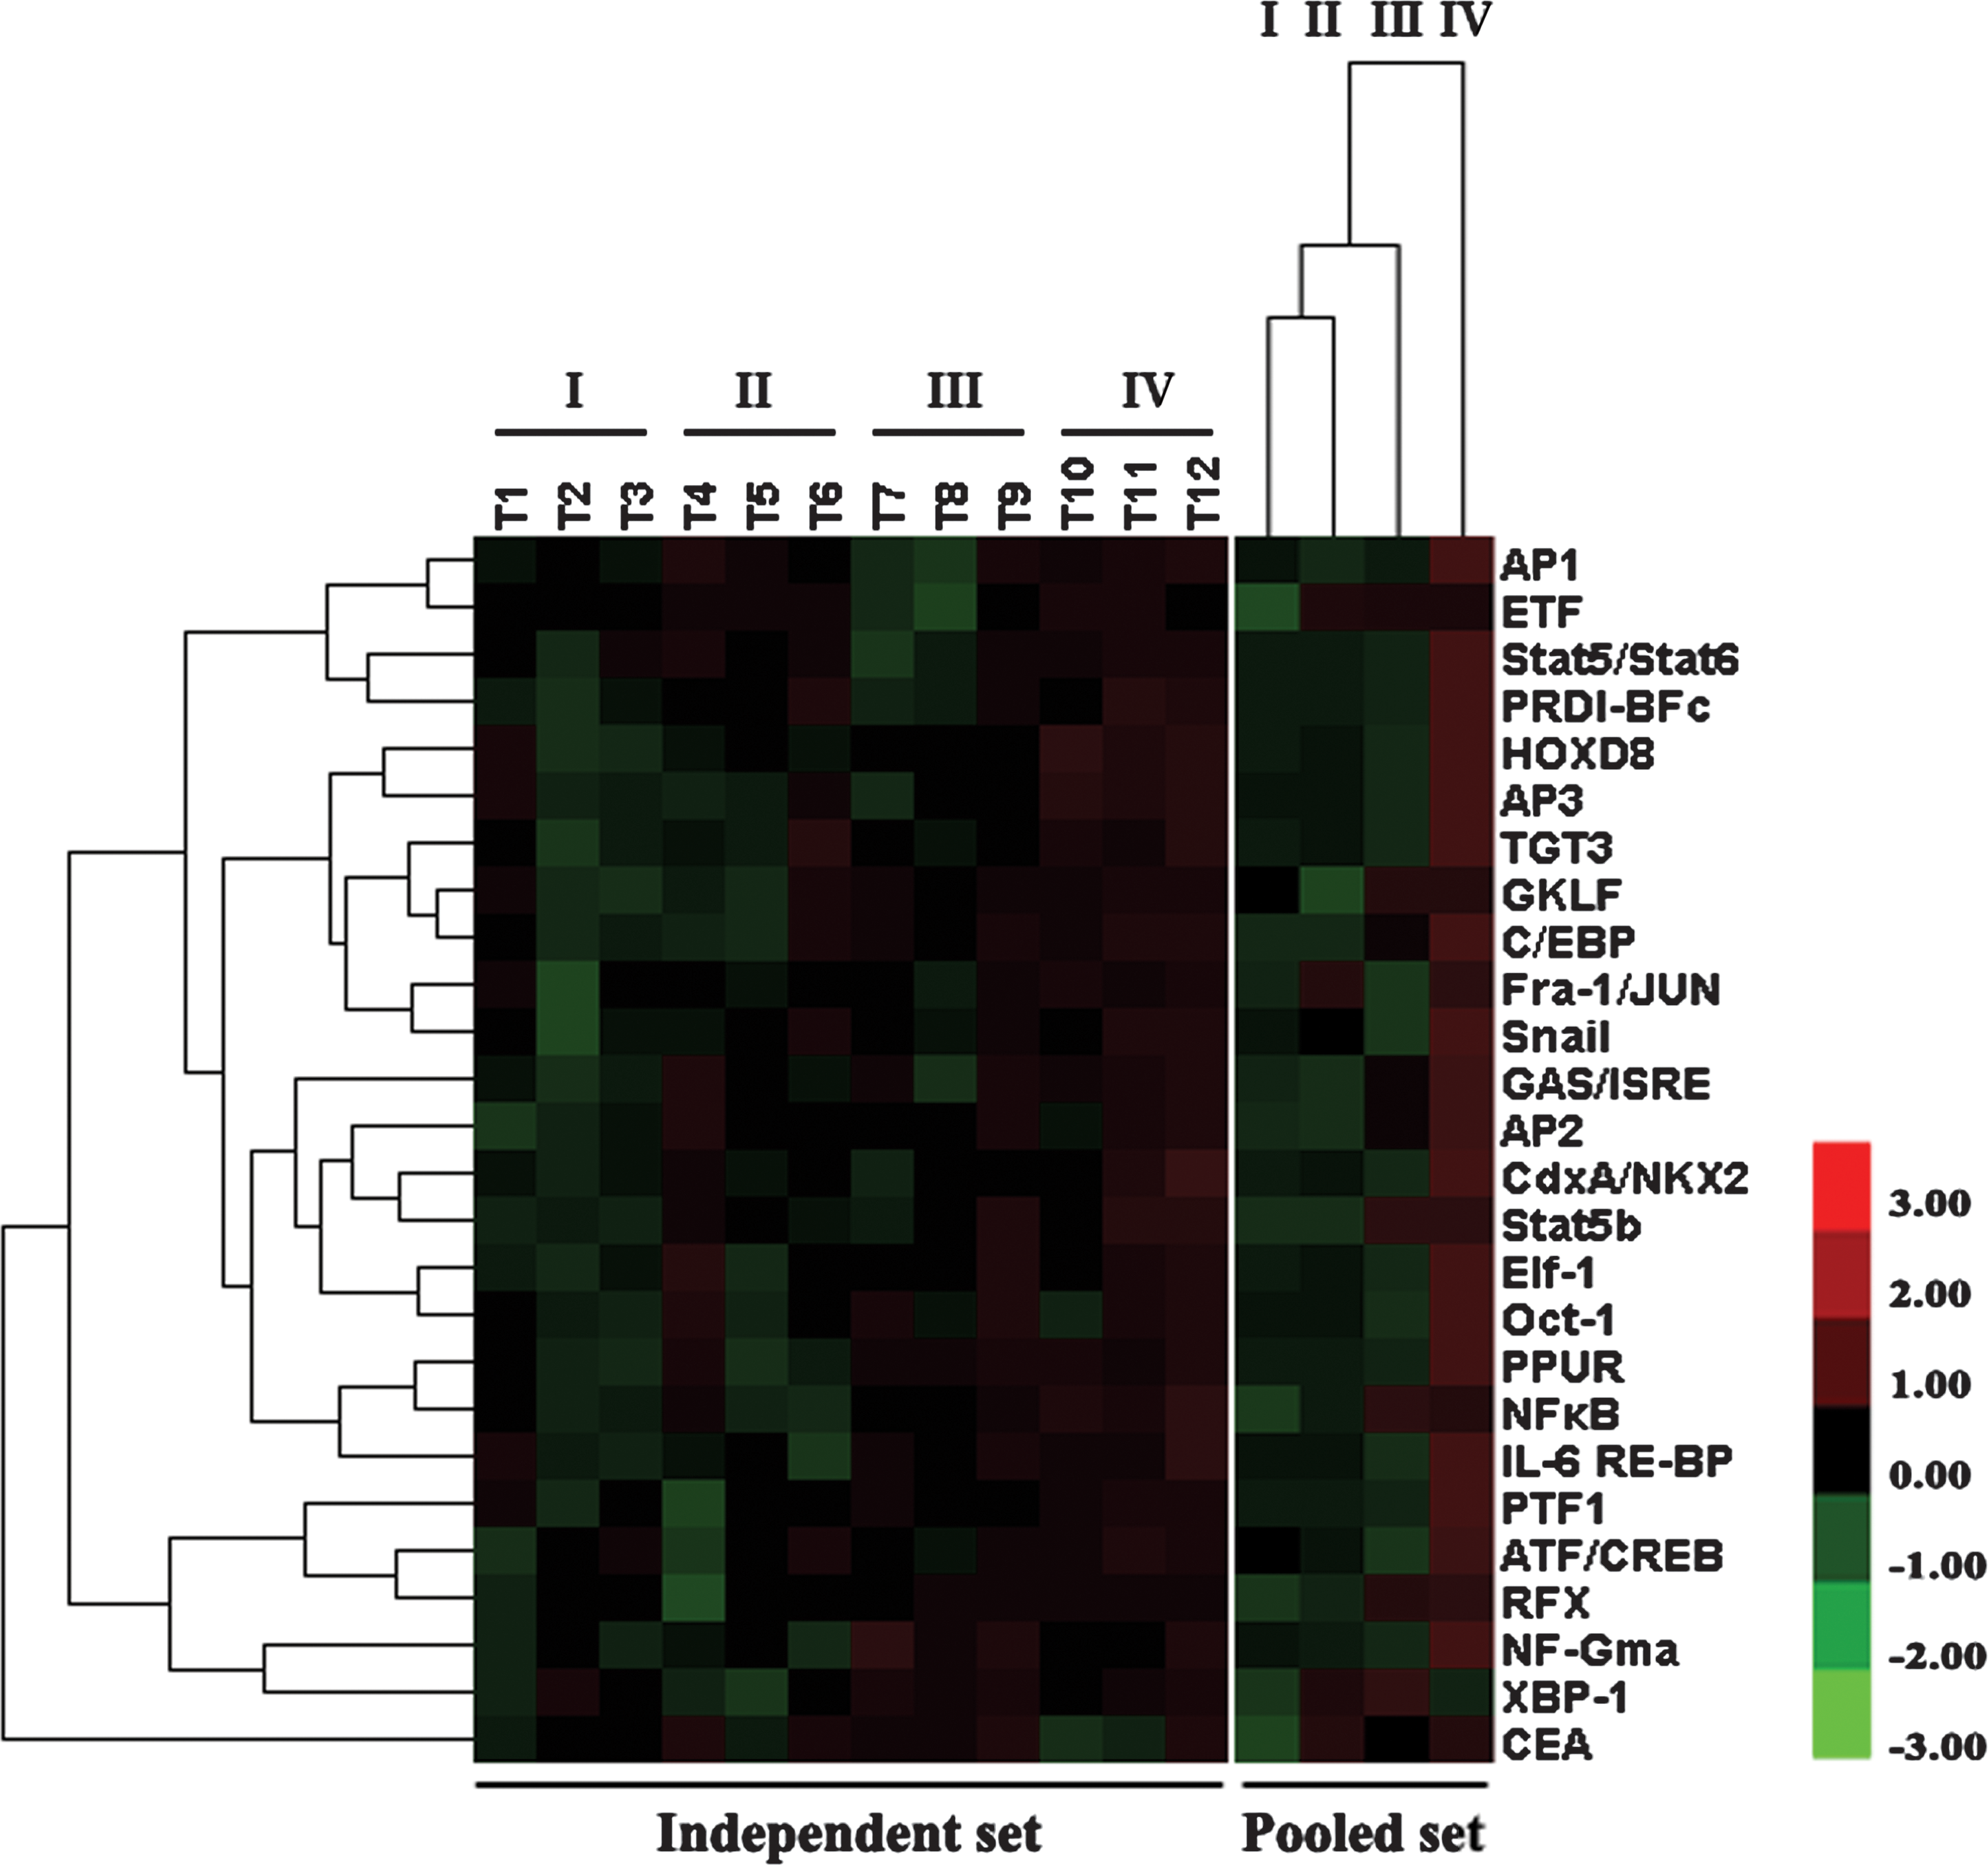
Activity changes of TFs correlated with tumor progression (clinical stages). A supervised hierarchical clustering analysis based on 55 TFs showing significant difference in the independent set revealed that the 26 TFs showed similar activity changes in the dependent set and the pooled set. The 26 TFs were further classified by clustering analysis according to the relative activity levels in each clinical stage. The image array on the left shows a color plot of TFs of the relative activity level clusters in the independent set. The sample identities are as follows: T1–3 (stage I); T4–6 (stage II); T7–9 (stage III); T10–12 (stage IV). The image on the right shows a color plot of the array clusters based on the relative activity level of TFs in the pooled set. The color bar is shown on the right of this figure. Pseudocolors indicate differential activity (red, activity levels > median; black, activity levels = median; green, activity levels < median).
TF name cited from combo array annotation.
β-value: standardized regression coefficient.
Identification of AP2 and ATF/CREB activity changes by EMSA
Our previous results showed that the AP2 and ATF/CREB families exhibited high activities in NPC cell lines (Su et al., 2010). In this study we found that the activities of the AP2 and ATF/CREB families increased as NPC progressed through the different clinical stages, especially in stage IV (Figs. 1 and 2). Thus, we examined activity changes of AP2 and ATF/CREB using EMSA to validate the array analysis results (i.e., that their activities increased in cancer cells from NPC tissues). Both AP2 and ATF/CREB exhibited higher activity in the late stages of NPC than in the early stages (Figs. 4A and B). These changes were in line with the array analysis results. To identify which of the members of the two families were overexpressed in NPC tissues, to further establish the clinical relevance of this information, and to correlate TFs with expression of their target genes, we used histological analysis. Table 2 provides clinical information about the samples from patients with NPC.

Confirmation of DNA binding activity of the AP2 and ATF/CREB families of nuclear extracts from the samples at different clinical stages using EMSA.
Correlation between AP2α, AP2β, AP2γ, and EGFR expression and clinical stages of NPC
Immunohistochemical analysis showed higher expression of AP2α, AP2β, AP2γ, and EGFR in tumor cells than in normal epithelial cells (p < 0.001 for all). AP2α expression was observed in normal epithelia, but it was concentrated at the bottom of a layer of epithelium (Fig. 5). Its expression gradually increased in nuclei of tumor cells from stage I to stage IV. Compared to AP2α, relatively low expression of AP2β was detected in normal epithelia. Its expression increased in the cytoplasm in stage I, and typically higher expression in nuclei was observed in stages II, III, and IV. Low expression of AP2γ was observed in normal epithelia. AP2γ proteins increased in both the cytoplasm and the nucleus of tumor cells in stages I and II, and higher protein levels in the nuclei were present predominantly in the late stages. Compared with normal epithelial cells, the expression of EGFR in tumor cells increased slightly in stage I and obviously increased in stages II, III, and IV. Spearman's rank test revealed that clinical stages correlated significantly with AP2α expression (correlation coefficient, 0.541), AP2β expression (correlation coefficient, 0.451), AP2γ expression (correlation coefficient, 0.454), and EGFR expression (correlation coefficient, 0.554) (p < 0.001 for all). In addition, AP2α expression correlated with EGFR expression (correlation coefficient, 0.628; p < 0.001).
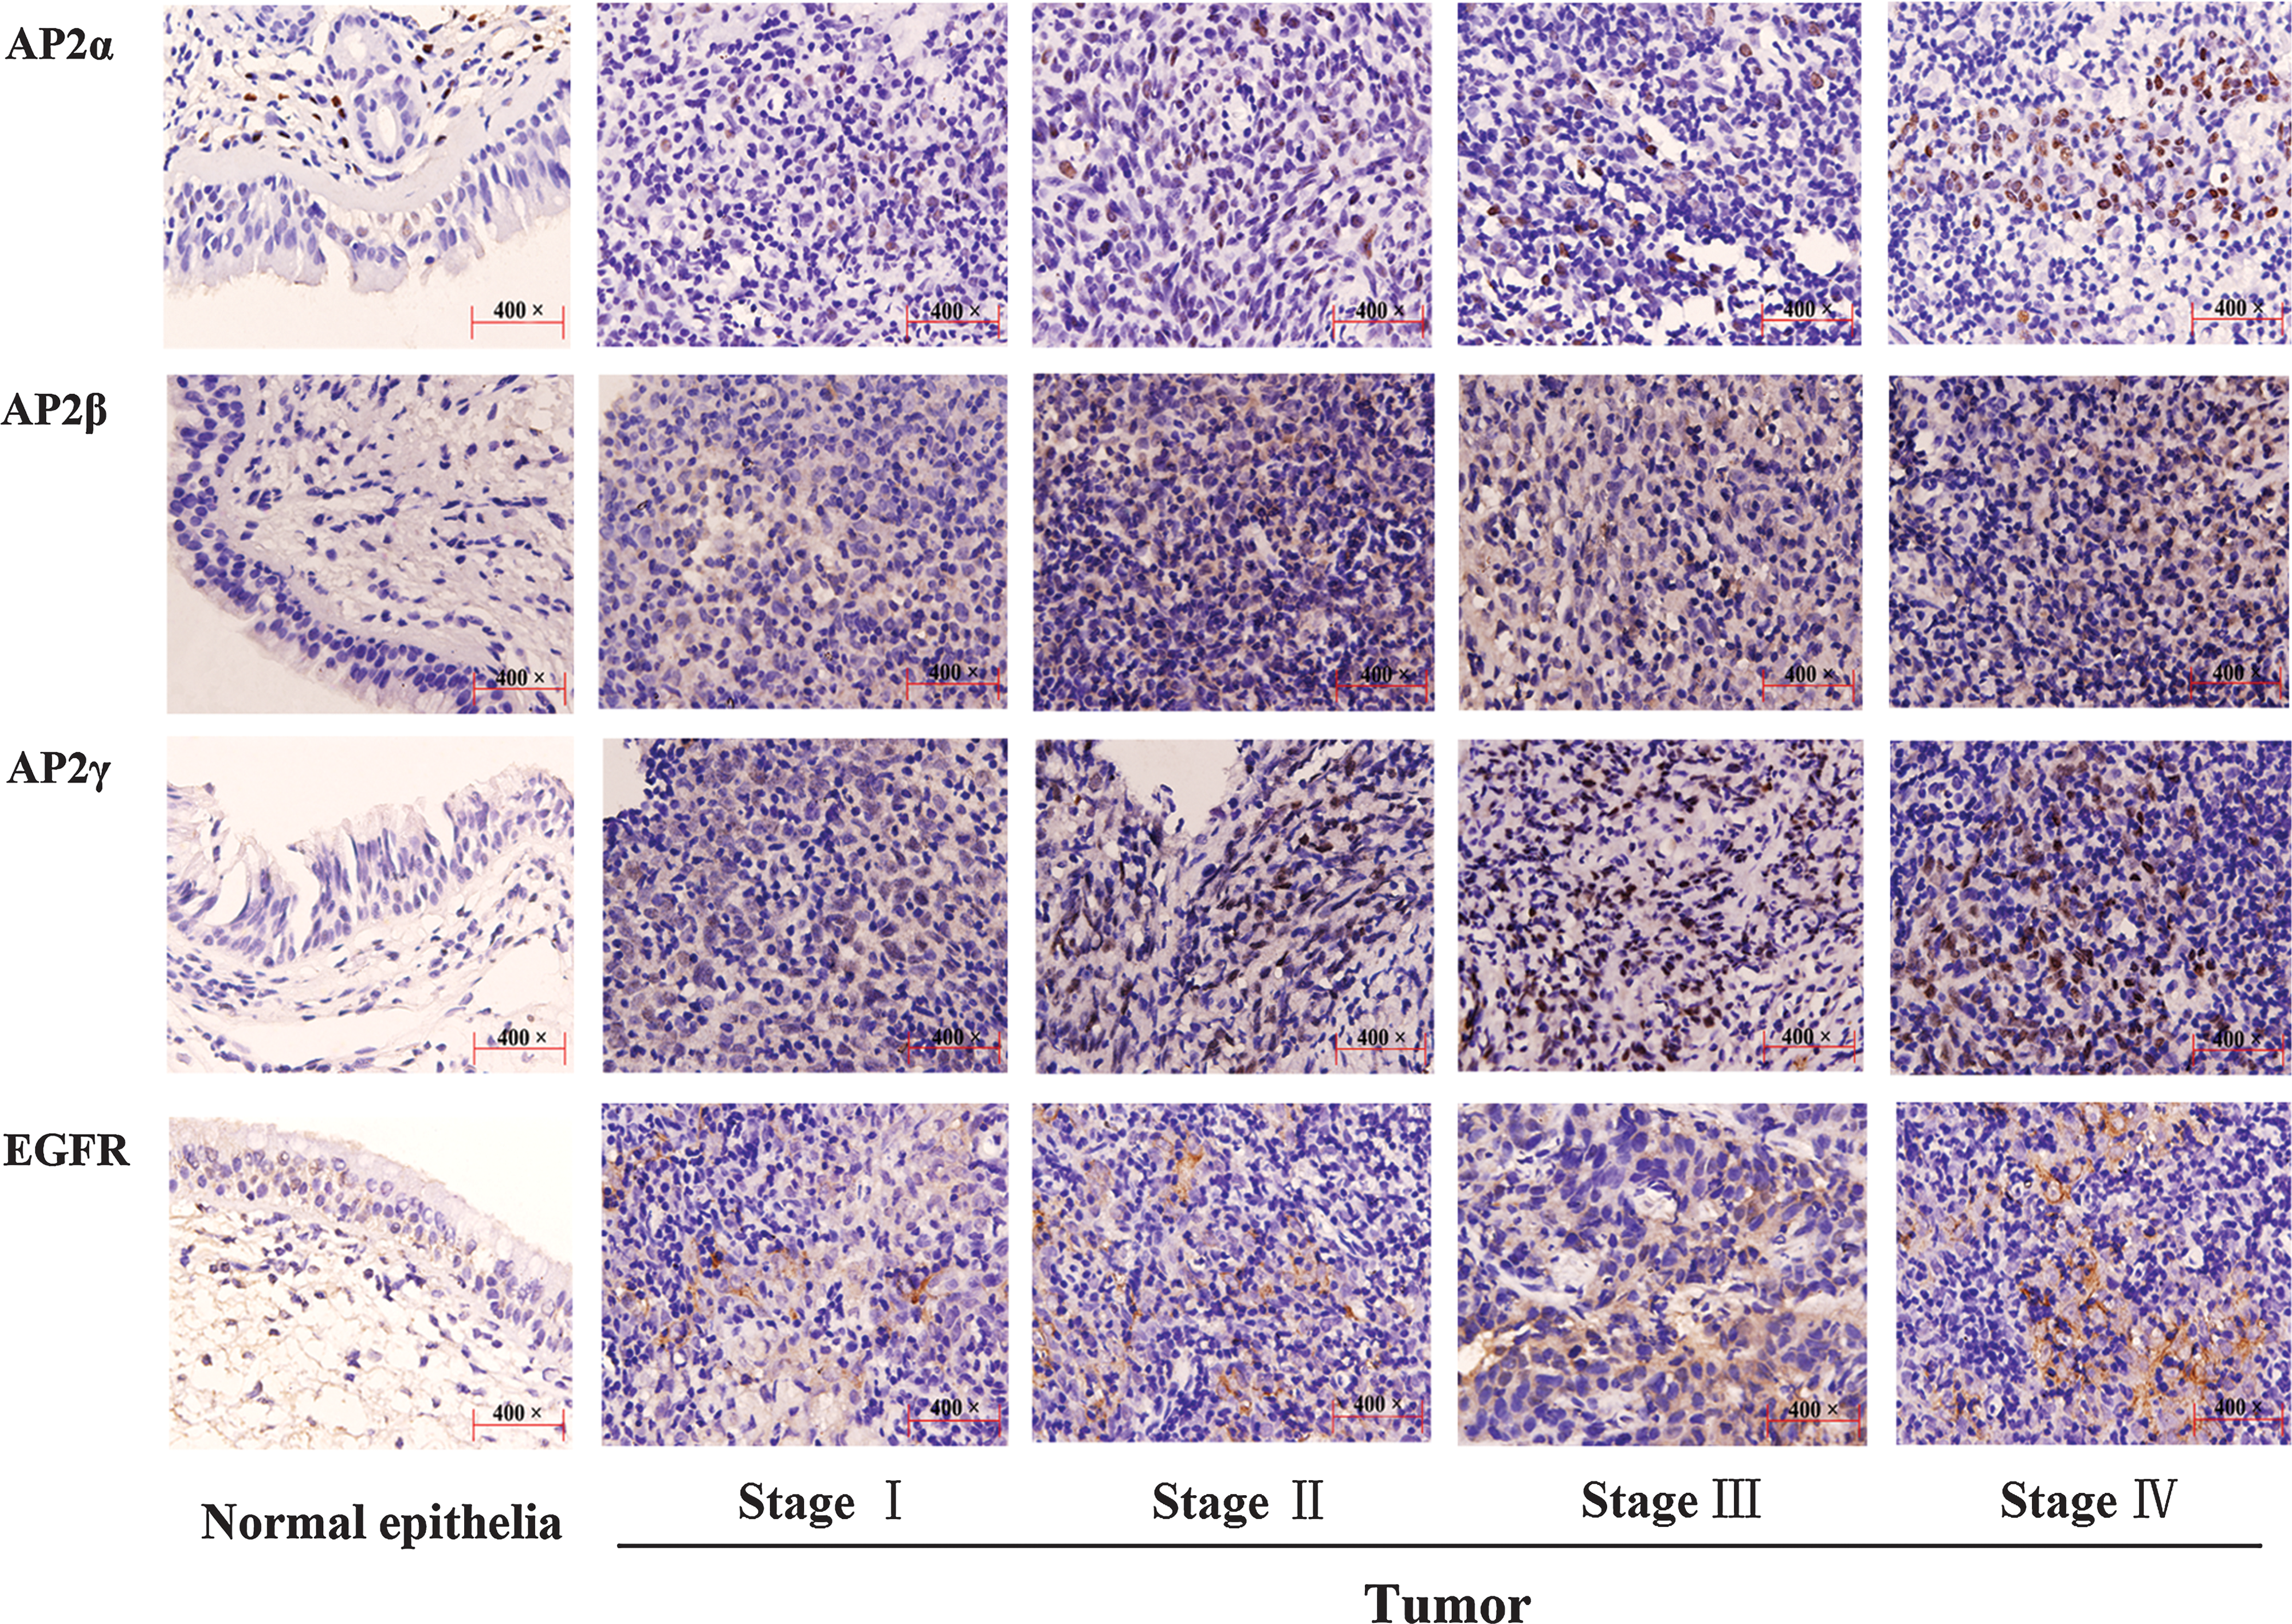
Immunohistochemical analysis of AP2α, AP2β, AP2γ, and EGFR expression in normal epithelia and tumor samples. The panels in each of row are arranged as follows from left to right: normal epithelia, stage I, stage II, stage III, and stage IV ( × 400 original magnification). Immunoperoxidase staining was performed using diaminobenzidine, with hematoxylin counterstain.
Correlation between ATF2, ATF1, and MMP-2 expression and clinical stages of NPC
Immunohistochemical analysis illustrated higher expression of ATF2, ATF1, and MMP-2 in tumor cells than in normal epithelial cells (p < 0.001 for all). ATF2 expression was predominantly located at the bottom of a layer of epithelial cells (Fig. 6). Compared with normal epithelial cells, tumor cells exhibited elevated expression in both the cytoplasm and the nucleus, and nuclear staining of ATF2 increased gradually from stage II to stage IV. Compared with normal epithelial cells, ATF1 proteins in nuclei increased by degrees from stage I to stage IV. MMP-2 also showed high expression associated with clinical stages. Spearman's rank test showed that clinical stages correlated significantly with ATF2 expression (correlation coefficient, 0.529), ATF1 expression (correlation coefficient, 0.412), and MMP-2 expression (correlation coefficient, 0.567) (p < 0.001 for all). Moreover, the expressions of ATF2 and ATF1 were correlated with that of MMP-2 (correlation coefficient, 0.633; p < 0.001; correlation coefficient, 0.553; p < 0.001, respectively).
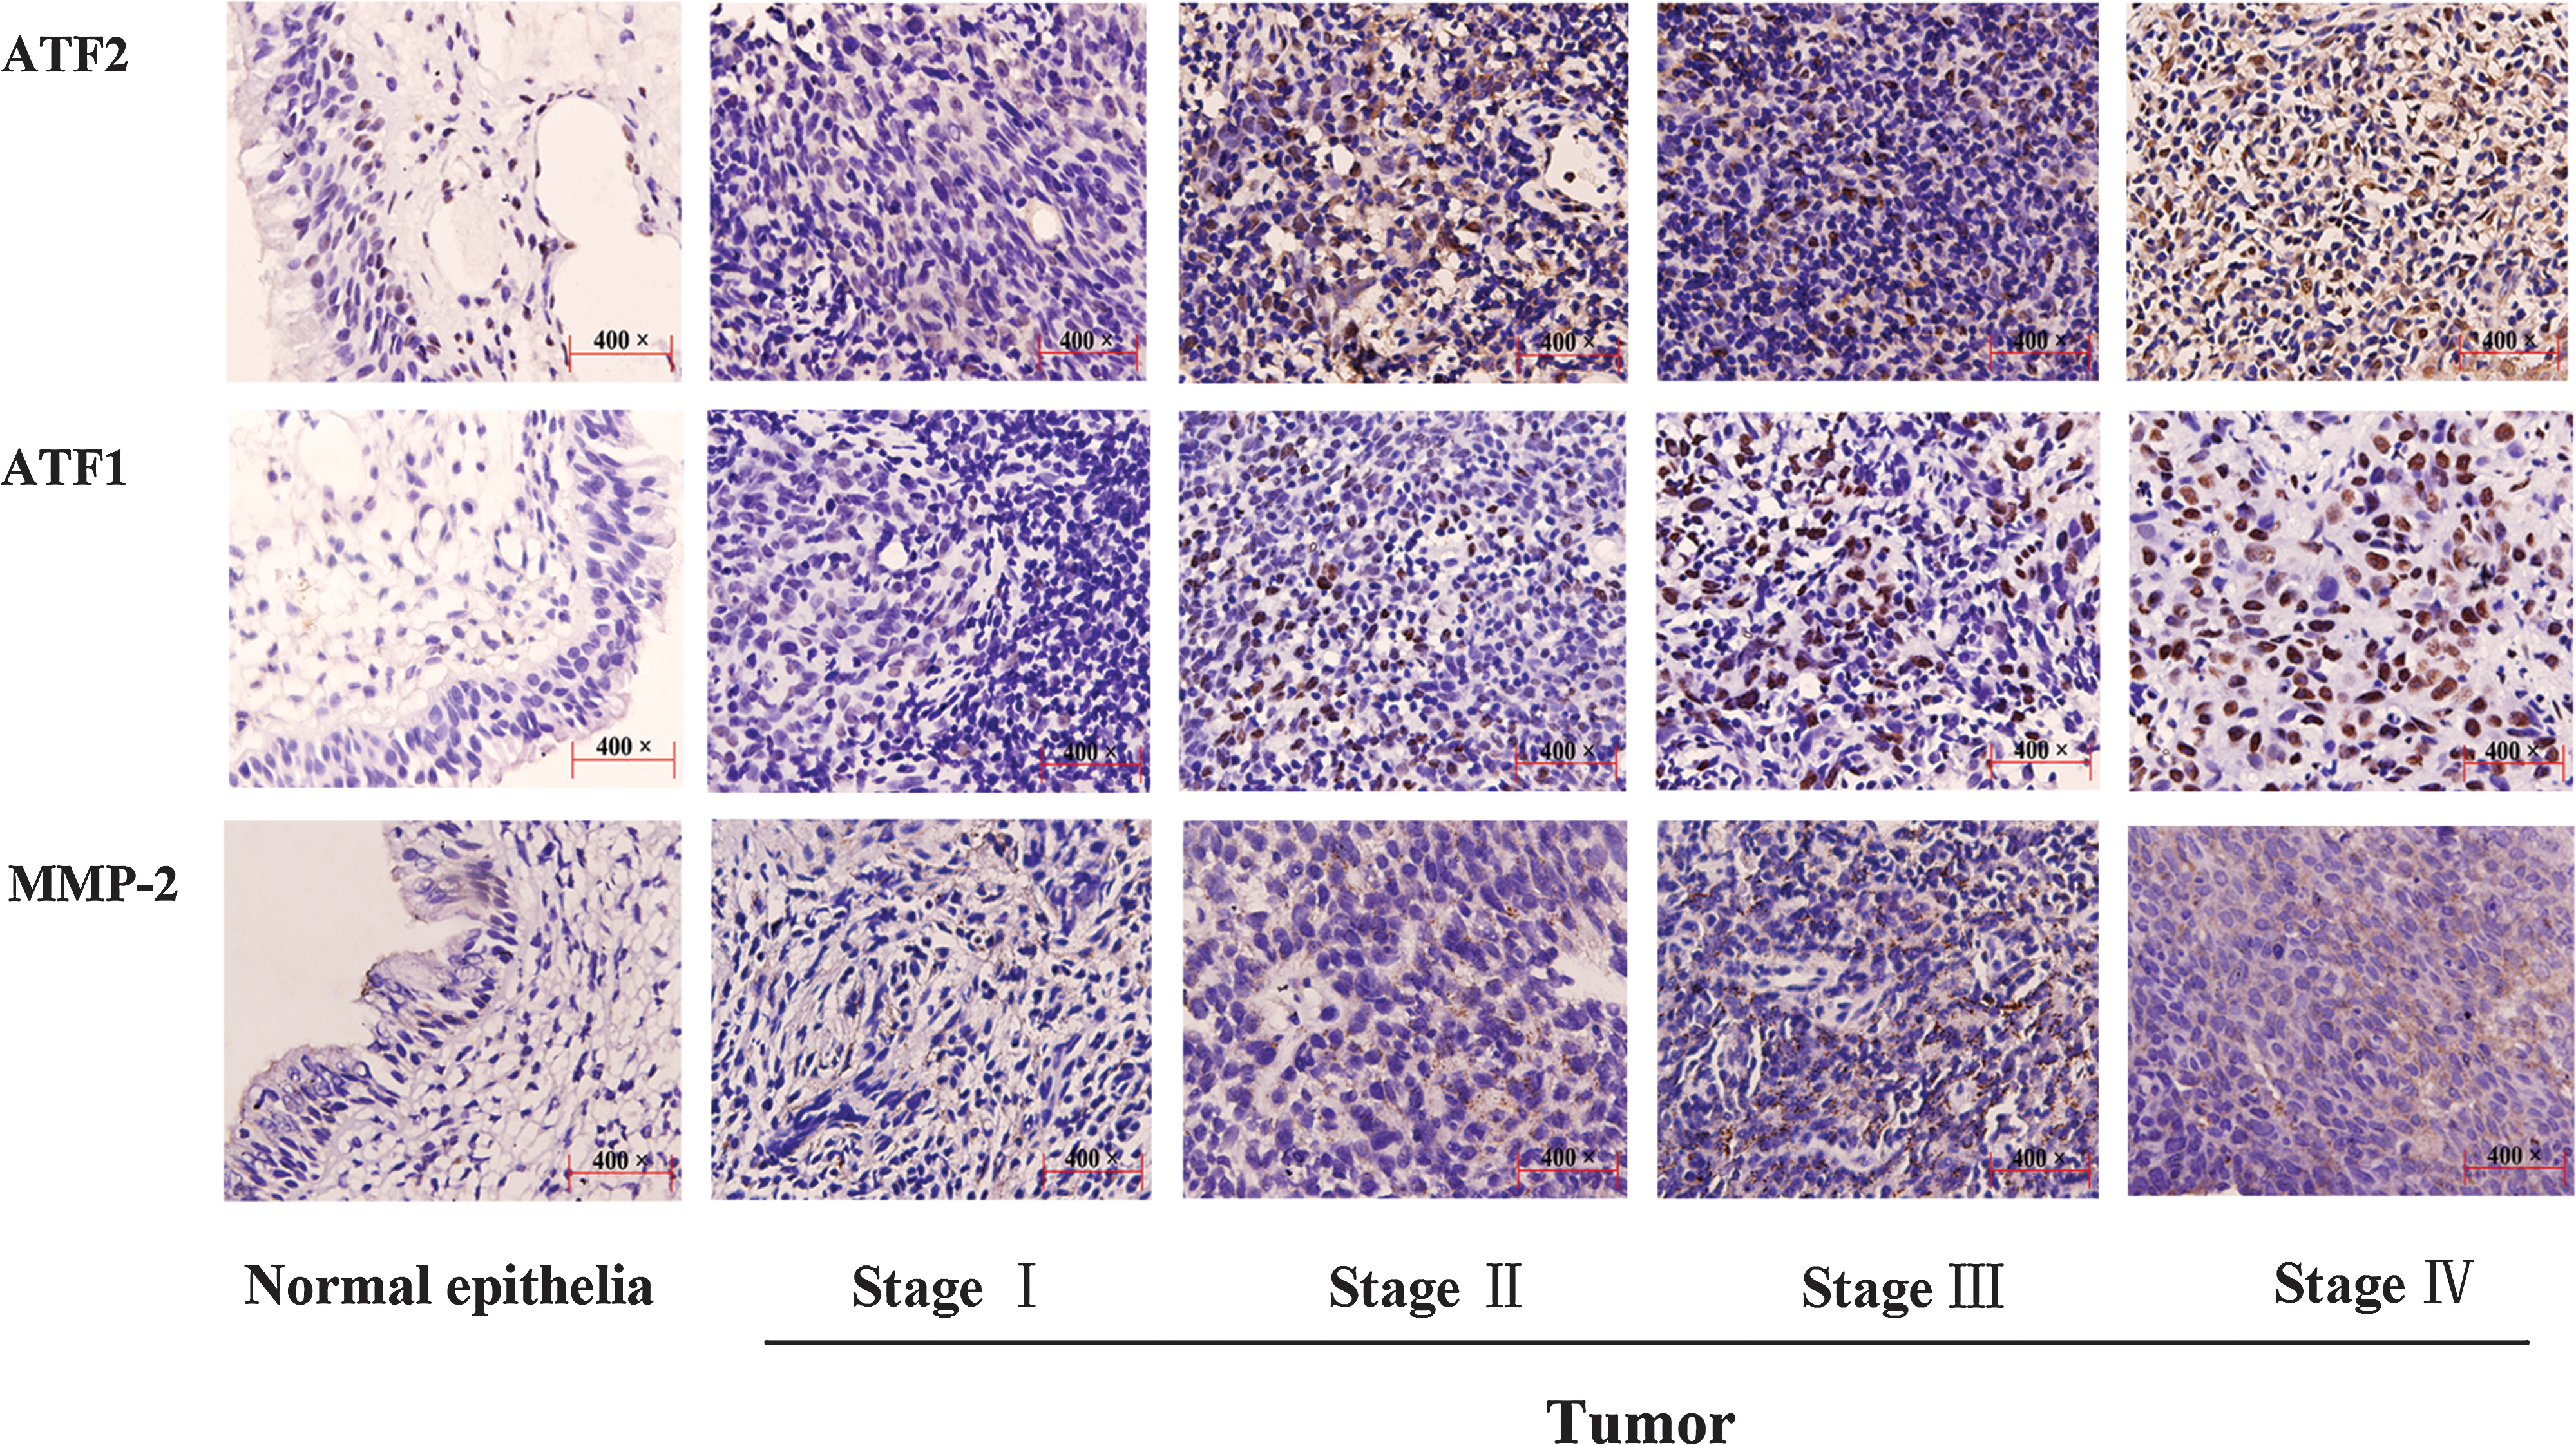
Immunohistochemical analysis of ATF2, ATF1, and MMP-2 expression in normal epithelia and tumor samples. The panels in each of row are arranged as follows from left to right: normal epithelia, stage I, stage II, stage III, and stage IV ( × 400 original magnification). Immunoperoxidase staining was performed using diaminobenzidine, with hematoxylin counterstain.
Identification of AP2, ATF, EGFR, and MMP-2 expression in clinical stages of NPC
To further confirm the results of the analysis described above, we detected AP2α, AP2β, AP2γ, ATF2, and ATF1 protein expression in clinical stages using Western blot. The total proteins, cytoplasmic proteins, and nuclear proteins were extracted from biopsy samples of different clinical stages of NPC. AP2α protein in the cytoplasm and the nucleus was upregulated in stages II and III compared with stage I (Fig. 7A). AP2α protein in the nucleus increased more significantly in stage IV than in stages II and III. The total AP2α protein was elevated concomitant with stage progression. AP2β, AP2γ, ATF1, and AFT2 in the cytoplasm, nucleus, and total protein also were overexpressed along with stage progression. In addition, RT-PCR revealed higher mRNA expression of EGFR and MMP-2 in stages III and IV compared with stages I and II of NPC (Fig. 7B). These results were consistent with those from array detection and immunohistochemical analysis.
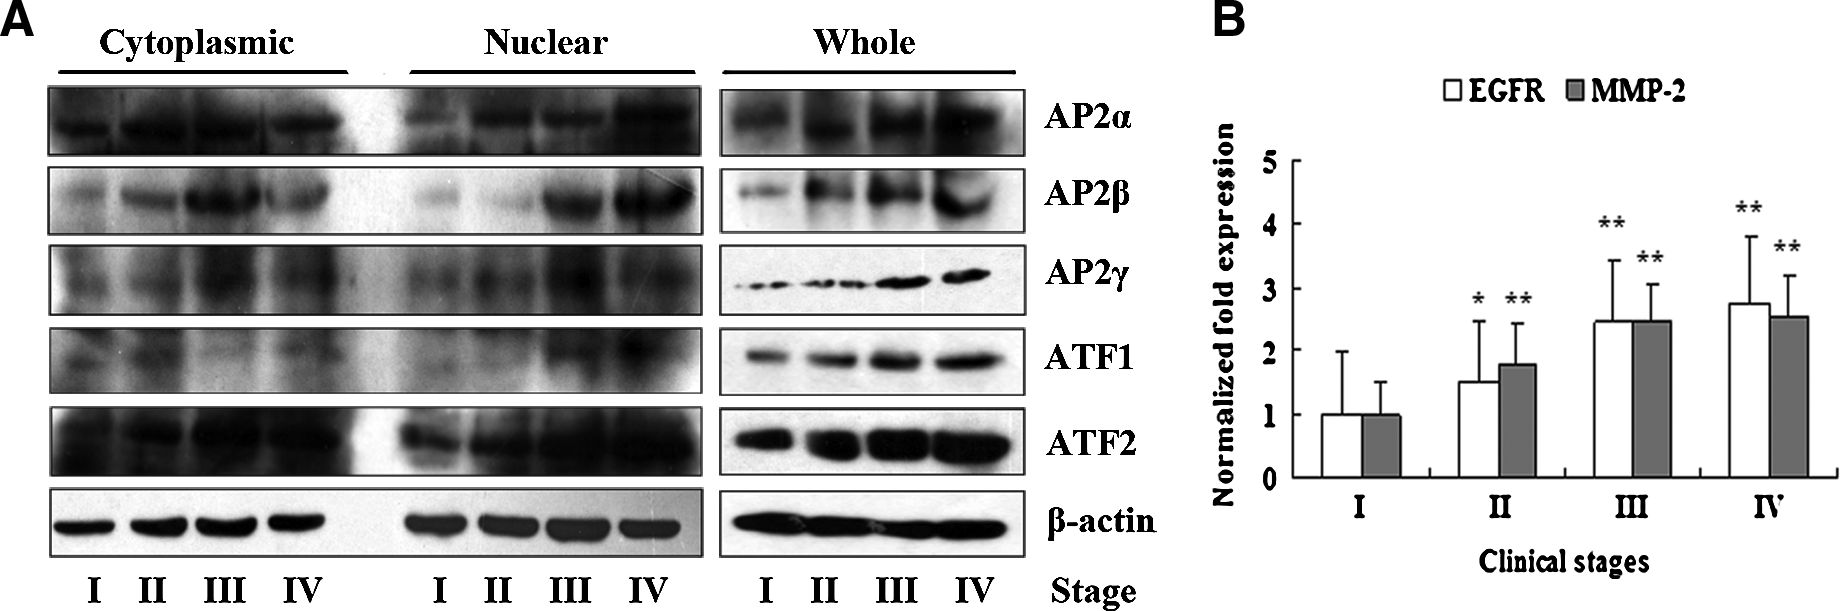
Western blot analysis of AP2α, AP2β, AP2γ, ATF1, and ATF2 expression and RT-PCR analysis of EGFR and MMP-2 expression. (
Discussion
As in other epithelium-derived tumors, the development and progression of NPC are attributed to alterations of multiple genes in the complex multistep process that has been well addressed in previous studies. Current knowledge, however, is not enough to clarify the complicated gene regulation mechanisms involved in the progression of NPC. Activity changes in TFs directly or indirectly aid in the progression of the malignant phenotype of tumor cells via upregulation of genes involved in out-of-control growth, dedifferentiation, potentiality of invasion, and metastasis. Thus, to better understand NPC we must first acquire systematic data about the TFs that are activated during tumor progression as well as information about differential gene expression profiles during NPC progression. The integration of these two types of information could help elucidate the gene regulation mechanisms.
In the present study, we used protein/DNA array analysis to systematically identify the TFs for which activities differed among clinical stages of NPC. Twenty-six TFs exhibited increased activities in both experimental data sets, and dynamic activity changes were observed among the clinical stages. Moreover, the activity changes were most conspicuous between clinical stage I and stages III/IV. TFs are highly efficient molecules that generally perform the dual functions of regulating the expression of oncogenes and tumor suppressor genes. We propose that activation of oncogenes and loss of tumor suppressor genes (e.g., via mutation or promoter hypermethylation) sequentially occurring in different stages of NPC may result in overactivation of some of the TFs that predominantly regulate genes associated with tumor progression. Of the 26 TFs, 16 were associated with progression to more advanced stages of NPC (Table 3). We suggest that these TFs may facilitate tumor progression by inducing aberrant gene expression profiles. Among them, overactivated AP2 and ATF/CREB were identified in NPC cells in our previous research. AP2 proteins appear to function as tumor suppressor genes (Heimberger et al., 2005; Schwartz et al., 2007) or oncogenes (Orso et al., 2008; Paonessa et al., 2006) in a cell- or tissue-specific pattern. In human squamous cell carcinoma, AP2α was only present in the nuclei of normal basal keratinocytes but was significantly increased in proliferating keratinocytes, and high affinities of AP2α binding to EGFR gene promoters were demonstrated (Oyama et al., 2004). Popa et al. (2004) reported that AP2 transcriptional activity decreased in differentiated human epidermal keratinocytes. In this study, we observed that increased AP2α activity and expression were associated with the progression through stages of NPC and with EGFR expression. We propose that overactivated AP2α transcriptional activity may, in part, account for overexpression of EGFR, thereby leading to tumor cell proliferation. Deng et al. (2007) reported that AP2β, a tumor-specific promoter activator of human telomerase reverse transcriptase, was relevant to tumor cell immortalization and growth. Jager et al. (2003) showed that AP2γ stimulated proliferation and impaired differentiation, thus suggesting that it may play an important role in the maintenance of a proliferative and undifferentiated state of cells. We speculate that AP2 proteins may perform similar roles in NPC. The ATF/CREB family is composed of a large group of basic region-leucine zipper (bZip) proteins that mainly includes ATF1, ATF2, ATF3, ATF4, and CREB1. We previously demonstrated that ATF1 and ATF2 were overexpressed in NPC cell lines (Su et al., 2010). ATF2 is known to be associated with tumor stage and prognosis, although it acts in a cell- or tissue-specific fashion (Bhoumik and Ronai, 2008; Dam and Castellazzi, 2001). In preneoplastic human breast epithelial cells, ATF2 upregulated MMP-2 expression, which in turn, induced an invasive phenotype (Kim et al., 2007). Overexpression of ATF1 also has been shown to upregulate MMP-2 expression and contribute to the acquisition of the metastatic phenotype in melanoma cells (Jean et al., 2000; Melnikova et al., 2006). Additionally, ATF2 was implicated in resistance to chemo- and radiotherapy (Huang et al., 2008). We propose that sustained activity of ATF2 in tumors may be involved in invasion, metastasis, and recurrence after chemo- or radiotherapy. Elevation of phosphorylated ATF2 has been reported in NPC biopsies (Oneil et al., 2008).
In our study, we found augmented ATF2 and ATF1 expression in association with tumor progression. Moreover, both of their expressions were correlated with MMP-2 expression. This result suggests that overexpression of MMP-2 during the progression of clinical stages may promote tumor cell invasion and metastasis (from local lymph node to distant organic metastasis), which may be, in part, due to sustained high activities of ATF1 and ATF2. It is notable that the transcriptional activities of ATF1 and ATF2 depended on interaction with various TFs, such as AP1, C/EBP, and NF-κB, whichy also showed increased activities during tumor progression (Fig. 2A and Table 2), and all of them have been implicated in the development and progression of NPC (Huang et al., 2006; Oneil et al., 2008; Rayet and Gelinas, 1999; Thornburg et al., 2003; Tsai et al., 2006). We also identified several TFs that maintained high activities in NPC. For example, members of the Stat family proteins were associated with oncogenesis and acquired tumor radioresistance (Buettner et al., 2002; Khodarev et al., 2004). Aberrant Stat activation may be both a necessary and predisposing event for EBV-driven tumorigenesis in NPC and Hodgkin's disease (Chen et al., 2001). RFX proteins were shown to repress the collagen α2(I) gene (COL1A2) (Xu et al., 2006), and may act as modulators of genes regulated by Ras signaling in epithelial cells (Maijgren et al., 2004). Furthermore, Sengupta et al. (2002) showed that NF-κB and C/EBP proteins were involved in TNF-α inhibition of COL1A2 transcription. These findings suggest that members of the RFX family may play important roles in collagen regulation in NPC. The Snail family is thought to be a progression marker in diverse tumors, but particularly in epithelia-derived tumors. Snail proteins contribute to acquisition of invasive and metastatic properties by epithelial tumor cells via inhibition of E-cadherin expression and upregulation of MMP expression (Gimeno and Nieto, 2005; Sun et al., 2008). Moreover, Snail proteins have been implicated in dedifferentiation and the resistance to chemotherapeutic agents (Sun et al., 2008).
In summary, our study presents an activity differential profile for NPC and thus provides a valuable platform for further research on the mechanisms of gene regulation in this cancer. Although the features of the selected TFs that are characteristic of tumor progression could not uncover the activity state of all TFs that may be activated in this malignancy, the high-throughput Protein/DNA array analysis revealed the laws of kinetic activity changes of TFs that may cause aberrant gene expression profiles during the progression of this tumor. The increase in available information about protein–DNA and protein–protein interactions combined with gene differential expression profiles may help elucidate the mechanism of gene regulation by the TFs that are correlated with clinical staging, thus providing potential diagnostic and prognostic tools as well as therapeutic targets for NPC.
Footnotes
Acknowledgments
The work was supported by State Key Science Research Program of China (Grant Numbers: 2006CB910502 and 2006CB910504); National Natural Science Foundation of China (Grant Numbers: 30770825 and 30700469); New Century Excellent Talents in University (NCET-08-0562); The 111 project (Grant Number: 111-2-12); The National “863” High Technology Program of China (Grant Number: 2007AA02Z170). We thank the staff of Department of Otolaryngology, the Second Affiliated Hospital, Central South University, and the staff of Department of Otolaryngology, Tumor Hospital of Province Hunan, for recruiting nasopharyngeal carcinoma patients and retrieving paraffin-embedded tumor samples.
Author Disclosure Statements
We promise the following statements: (1) I have read and have abided by the statement of ethical standards for manuscripts submitted to OMICS. (2) All authors of this research article have directly participated in the planning, execution, or analysis of the study. (3) All authors of this article have read and approved the final version submitted. (4) The contents of this manuscript have not been copyrighted or published previously. (5) The contents of this manuscript are not now under consideration for publication elsewhere. (6) There are no financial or other relationships that might lead to a conflict of interest.