




Abstract
Abstract
When cultured hepatocytes are exposed to challenging environments such as plasma, they frequently suffer a decline in liver-specific functions. Media supplements are sought to reduce or eliminate this effect. A rational design approach for amino acid supplementation in hepatocyte culture has been developed in our prior work, and designed amino acid supplementation (DAA) was found to increase urea and albumin production. To fully characterize the metabolic state of hepatocytes under different amino acid supplementations, a number of metabolite measurements are performed in this work and used in a metabolic network flexibility analysis framework including thermodynamic constraints to determine the range of values for the intracellular fluxes. A metabolic objective prediction model is used to infer the metabolic objectives of the hepatocytes and to quantify the intracellular flux distribution for three different amino acid supplementations. The results illustrate that DAA leads to greater fluxes in the tricarboxylic acid cycle (TCA) cycle, urea cycle, and fatty acid oxidation concomitant with lower fluxes in intracellular lipid metabolism compared with empirical amino acid and no amino acid supplementation for hepatocytes during plasma exposure. It is also found that hepatocytes exhibit flexibility in their metabolic objectives depending on the composition of the amino acid supplementations. By incorporating both experimental data and thermodynamic constraints into the mathematical model, the proposed approach leads to identification of metabolic objectives and characterization of fluxes' variability and pathway changes due to different cultured conditions.
Introduction
Computational modeling of hepatic metabolism is increasingly being utilized in tandem with experimental measurements to understand and control the performance of hepatocytes under adverse culture conditions (Chalhoub et al., 2007; Chan et al., 2003c). In mathematical modeling of cell metabolism, a comprehensive network, with a large number of interconnecting reactions in the cell, is built to mimic the actual cell phenomena. Mathematic modeling for flux analysis can be classified into metabolic flux analysis (MFA) (Arai et al., 2001; Chan et al., 2003a; Vallino and Stephanopoulos, 1994) and flux balance analysis (FBA) (Edwards et al., 2002; Kauffman et al., 2003; Lee et al., 2006; Varma and Palsson, 1994). In both approaches, mass balance equations are written for each internal metabolite with the assumption of pseudosteady state. If the system is overdetermined, MFA is used to calculate all unknown fluxes and evaluate the gross measurement error using redundant information (Wang and Stephanopoulos, 1983). If the system is underdetermined, FBA uses constrained optimization to identify the flux distribution of the metabolic network (Lee et al., 2006). Using appropriate metabolic objectives that cell strives to achieve (Gianchandani et al., 2008; Khannapho et al., 2008; Schuetz et al., 2007) and considering valid constraints that reduce the feasible region (Bonarius et al., 1997) are important issues in application of FBA. Because the cellular objectives may not be known or easily hypothesized, optimization frameworks have been developed to infer the metabolic objectives (Burgard and Maranas, 2003), applied to the hypermetabolic state of the liver (Nolan et al., 2006) and to cultured hepatocytes (Uygun et al., 2007).
The consideration of various constraints, describing environmental (nutrients, physical factors, etc.), physicochemical (mass balance, thermodynamic of internal reactions, maximum enzyme capacities), self-imposed regulatory, and evolutionary constraints, allows to reduce the feasible region of an FBA problem (Covert et al., 2003), and to determine the state of the cell (Edwards and Palsson, 2000). Recently, three additional thermodynamics constraints using the second law of thermodynamics, including energy balance analysis (EBA), pathway energy balance constraints (PEB), and network-embedded thermodynamic analysis (NET analysis), have been incorporated into the FBA model to reduce the solution space by deleting thermodynamically infeasible reactions or pathways (Beard and Qian, 2005; Kummel et al., 2006; Nolan et al., 2006). The main contribution of EBA ensures that entropy production is positive for each reaction, which defines reaction direction. PEB constraints successfully extended the second law of thermodynamics to an overall distribution of Gibbs free energy in a pathway instead of in an individual reaction; this approach has been used to identify the intracellular fluxes for the case of liver metabolism (Nolan et al., 2006). Network-embedded thermodynamic analysis (NET analysis) has been developed to determine the range of Gibbs energy of reactions and feasible range of metabolite concentration for the entire network utilizing the second law of thermodynamics, the reaction directionalities, and metabolite concentrations within an optimization model (Kummel et al., 2006; Zamboni et al., 2008).
In this work, the framework of metabolic network flexibility analysis (MNFA) is used, which includes mass balance constraints, reaction irreversibility restrictions, experimental measurements of extracellular fluxes that impose bounds on flux values, and pathway energy balance constraints in order to determine the range of flux distribution that describes the metabolic state of the cell. In addition, a bilevel programming problem is used to derive the metabolic objectives. The developed optimization tools are applied to hepatocyte metabolism in order to investigate the amino acid supplement effects on cell functions during plasma exposure. Specifically, the roles of lipid metabolism, gluconeogenesis/glycolysis, the tricarboxylic acid cycle (TCA) cycle, and urea cycle in regulating urea production are elucidated.
Materials and Methods
Hepatocyte culture
Hepatocytes were cultured using the well-established collagen sandwich method (Dunn et al., 1991; Yang et al., 2009). Prior to initiating the cultures, 0.4 mL of collagen mixture solution was added to each well of six-well plates and incubated at 37°C and 10% CO2 until the gel solidified. Cryopreserved rat hepatocytes purchased from Xenotech LLP (Lenexa, KS) were thawed following the Xenotech protocol and reconstituted to a density of 106 cells/mL in C + H standard medium, which consists of DMEM supplemented with 10% heat- inactivated fetal bovine serum (FBS), 7.0 ng/mL glucagon, 7.5 μg/mL hydrocortisone, 20 μg/L epidermal growth factor, 200 U/mL penicillin, and 200 μg/mL streptomycin. Reconstituted hepatocytes were seeded on a plate with collagen gel for 24 h, at which time another 0.4 mL of collagen gel was added, resulting in a double sandwich configuration. After the second gel layer solidified, 0.8 mL fresh C + H medium with 0.05 mU/mL insulin was added. This maintenance medium was exchanged with spent medium every day for 6 days preconditioning.
To begin the experiment, 6-day-old sandwiched hepatocyte cultures were exposed to plasma with hormone supplementation including 7.5 μg/mL of hydrocortisone and 0.05 mU/mL of insulin. Treatment groups varied in the amino acid supplementation in the plasma, comparing “designed” amino acid supplementation (DAA) based on a rational design approach described in our previous work (Yang et al., 2009), “reference” amino acid supplementation (RAA) based on published data (Chan et al., 2003c), and no amino acid supplementation (NAA). The concentrations corresponding to each amino acid supplementation are given in the supporting material (Supplementary Table S1). Those media were exchanged with spent media every day for 5 days plasma exposure. At the end of the experiment, culture supernatants were collected and stored at 4°C prior to analysis.
Biochemical assays
After 5 days exposure to the plasma with the various amino acid supplementation, albumin production was quantified by an enzyme-linked immunosorbent assay (ELISA) using purified rat albumin (MP Biomedicals, Solon, OH) and peroxidase-conjugated antibody for detection (MP Biomedicals). The concentrations of urea, glucose, lactate, glycerol, and glutamine were measured colorimetrically using commercial test kits (Sigma, St. Louis, MO). Enzymatic kits were utilized for the measurement of cholesterol (BioAssay System, Hayward, CA), acetoacetate, β-hydroxybutyrate, triglycerides (Stanbio, Boerne, TX), and free fatty acids (Roche, Indianapolis, IN).
Amino acids and ammonia were labeled fluorescently with the AccQ reagent (Waters Corporation, Milford, MA) and separated by gradient elution from 100% buffer A (10% acetonitrile, 6% formic acid, and 84% ammonium formate in water) to 100% buffer B (60% acetonitrile, 40% micropore water) in 33 min at 1 mL/min flow rate on an AccQ-Tag C18 column (150 mm × 3.9 mm i.d, Waters Corporation) with a fluorescence detector (Waters 470; Waters Corporation) using excitation/emission at 250/395 nm, respectively. Serial dilutions of standards were used to construct a calibration curve for each analyte, with the linear portion utilized for measurements. The concentrations of amino acid/ammonia in the fresh or spent medium were determined using these standard curves, with sample dilutions performed as necessary to operate within the linear range.
Statistics
All measurement results were expressed as mean ± standard deviation for three replicate culture plates. To evaluate the effects of amino acids supplementation on extracellular fluxes of hepatocytes, data were analyzed with Tukey's test using SAS software (SAS institute Inc., Cary, NC). Significant differences were accepted as significant at p < 0.05.
Basic hepatic network
The major reactions of hepatic metabolism were considered in a highly interconnected stoichiometric network that includes glycolysis/gluconoegenesis, the TCA cycle, urea cycle, amino acid uptake/secretion and catabolism, oxygen uptake, electron transport system, pentose phosphate reactions (as a lumped group), ketone body synthesis, fatty acid, triglyceride (TG), and glycerol metabolism. This network builds upon previously reported hepatic networks and involves 46 intracellular metabolites (Chan et al., 2003c; Lee et al., 2003; Nagrath et al., 2007; Sharma et al., 2005; Uygun et al., 2007), and 78 reactions (30 reactions with measurement data, 48 reactions with unknown fluxes as labeled in Supporting Data Table S2).
Standard and minimum PEB constraints
Standard PEB constraints have been developed in order to eliminate infeasible flux distributions (Nolan et al., 2006), which express an overall distribution of Gibbs free energy to the reactions involved in an elementary mode, in which endergonic reactions (ΔG > 0) can be “powered” by exergonic reactions (ΔG < 0) if those reactions are “coupled” in the same elementary modes and the overall free energy change weighted by their fluxes is negative (Stephanopoulos et al., 1998). The constraints have the following form:
where
The matrix
where αpr and βr are the stoichiometric coefficients of products and reactants in the biochemical reaction, respectively;
where j is the number of reactions and p is number of elementary modes.
In this study, the Gibbs free energy of reaction (ΔGRXN) is used corresponding to the physiological state represented by cellular concentrations of metabolites rather than the standard free energy change (
Because the thermodynamic constraint is used to eliminate infeasible pathways, it is possible that uncertainty in metabolite concentration values could lead to a situation where the feasibility of a pathway is also uncertain. In order to define a conservative criterion wherein no feasible pathways are eliminated, we utilized minimum pathway free energies constructed from minimum Gibbs free energies of reaction,
where R is the ideal gas constant, T is the temperature (K); and C are the intracellular concentrations of metabolites that are estimated from literature values and expressed as minimum value for productions (Cpr,min) or maximum value for reactant (Cr,max) corresponding to the different values reported or estimated. For the extracellular reactions (metabolite uptake from or secretion into the culture medium), the first term is considered as zero (
Equation 4 is used to construct pathway energy balance constraints, called minimum PEB constraint (MPEB) as follows:
where superscript min represents the defined state based on the concentration range of metabolites. The details on the construction of MPEB constraints are given in the supporting material (Supplementary Data Text S2).
The major difference between those two PEB constraints is that the concentrations of the metabolites are considered in the minimum PEB constraints but not in the standard PEB constraints. In this study, the minimum PEB constraints are incorporated into the optimization problem in order to restrict the feasible region of the flux values that allows the differentiation between the cultured conditions and the evaluation of a thermodynamic feasible flux range.
MNFA
Flux spectrum approach has been developed to calculated the flux range for each unknown fluxes (Llaneras and Pico, 2008; Wiback et al., 2004) by solving, separately, minimization and maximization linear programming for each unknown flux. This approach is important to estimate the flux range for an underdetermined network without unique solution. We further extend the flux spectrum approach by considering the minimum PEB constraints as constructed in the previous section and the bounds on the flux values based on measurement values. The resulted model is shown below and is referred as metabolic network flexibility analysis (MNFA),
where Sij is the stoichiometric coefficient of metabolite i in reaction j; vj is the reaction rate of reaction j; the fluxes
The main assumptions used to generate this model are as follows: (1) the internal metabolites are assumed to be maintained at pseudosteady state, which means their rate of change is small compared to their turnover. This assumption is valid for hepatocyte culture after 5 days plasma exposure (Chan et al., 2003b); (2) the bounds for reactions are restricted by multiple constraints including thermodynamic constraints, external flux measurement in an interval [vmin, vmax] based on the average value and standard derivation of measurements using triplicates, and irreversible reactions (vj ≥ 0) based on the information given in the metabolic map of KEGG (Kanehisa and Goto, 2000).
In order to determine the minimum and maximum values of each unknown flux (48 unknown reactions), model (I) is solved 48*2 times using a linear programming algorithm implemented in CPLEX 9 using GAMS (GAMS, 2006).
Metabolic Objective Prediction (MOP)
For the cases where a cellular objective can be identified in terms of a metabolic flux, it can be used as a driving force to identify a consistent flux distribution within system constraints. However, for mammalian cells, the cellular objectives are manifold, dynamic, and generally unknown. Thus, we adopted a bilevel programming model Objfind (Burgard and Maranas, 2003) by incorporating minimum PEB constraints to infer the metabolic objectives of hepatocytes under varying amino acid supplementations as follows:
where cj is the coefficient of relative importance for each flux vj, and L is the number of measured fluxes. Model (II) is a bilevel programming problem in which the upper level minimizes the sum of squared error between measured fluxes and their predicted values from the model (II), whereas the lower level maximizes the sum of all possible objectives and weights are chosen from the upper level problem. The measurements restrict the metabolic objectives chosen in the follower's problem because the feasible region of the lower level problem is restricted by the upper level decision. Note that because in model (II) cj is the variable of the upper level problem it can be considered as parameter in the lower level problem (Burgard and Maranas, 2003). Therefore, this bilevel programming can be reformulated into a single-level nonlinear program either by following the primal-dual strategy (Burgard and Maranas, 2003), or using the Karush-Kuhn-Tucker (KKT) conditions of the lower level problem (Shi et al., 2005). In this work we followed the KKT approach to transform the bilevel programming (model II) to a single-level optimization problem as follows:
where
The complementarity constraints of model (III) are further modified to linear integer constraints by introducing binary variables (Saharidis and Ierapetritou, 2008). Model (III) corresponds to a mixed-integer nonlinear programming (MINLP) due to the quadratic objective function and is solved using a MINLP solver GAMS/SBB, which is based on a combination of standard Branch and Bound method and local nonlinear programming (NLP) solvers. The problem is solved in the order of hours using a Dell PC (3 GHz, 1 GB of RAM).
Results
Extracellular Fluxes
After 6 days of preconditioning, previously cryopreserved rat hepatocytes were exposed to plasma containing medium with varying amino acid supplementation for 5 days. At this time, the concentrations of extracellular metabolites in the supernatant and in the fresh medium were measured. The production or consumption rate of each extracellular metabolite was calculated by the difference between its concentration in the fresh medium and in the supernatant divided by the number cells in each well (106 cell/mL as the cell density at the beginning of the experiment because hepatocytes are not growing) and the time interval (1 day) over which the medium was exposed to cells. The measured fluxes of metabolites in each amino acid supplementation are listed in Table 1.
NAA, no amino acid supplementation; RAA, reference amino acid supplementation; DAA, designed amino acid supplementation. All measured fluxes are labeled as “mean ± standard derivation” in unit of μmol/106 cells/day. Significant difference of measured fluxes is identified between NAA and DAA, and RAA and DAA, respectively (labeled as ap < 0.05).
It was found that hepatocytes release varying levels of branched chain amino acids (BCAA: valine, isoleucine and leucine) depending on the particular amino acid supplementation during plasma exposure. Designed amino acid supplementation results in an increased secretion of valine, isoleucine, and leucine compared with the culture conditions with no amino acid supplementation or with reference amino acid supplementation. Increased secretion of the BCAA under designed amino acid supplementation may be due to an increased rate of transformation of supplied amino acids to propionyl-CoA, which is further transformed back to BCAA. This mechanism is supported by the mathematical modeling, and results are shown in Table 3 (flux vu18, vu21, vu30, vu33, vu34).
The major finding of this experiment is that urea production and albumin synthesis under the designed amino acid supplementation were found to be increased compared with previously reported (empirical) amino acid supplementation or no amino acid supplementation by reducing the lipid accumulation (Yang et al., 2009). However, from the experimental results, it was found that triglyceride (TG) uptake (vm30), free fatty acid (FFA) uptake (vm28), and cholesterol synthesis (vm29) are not significantly different among the different amino acid supplementation conditions (details in Table 1). Therefore, intracellular fluxes need to be calculated to further investigate the effects of amino acid supplementation on the metabolic state of hepatocytes.
MNFA
First the algorithm for determining the elementary modes (Schuster et al., 2000, 2002) was applied for the hepatic network, which is specified for each of three amino acid supplementation (DAA, RAA, and NAA) by the reaction irreversibility based on measurement data from experiment (Table 1). A total of 65,696, 54,754, and 90,079 elementary modes were identified in DAA, RAA, and NAA supplement conditions, respectively. The minimum pathway energy balance (MPEB) constraints were then constructed based on these elementary modes as described in the previous section and incorporated into the MNFA model (I) to estimate the range of each unknown flux.
The numerical values of the range of flux values found from the solution of MNFA model (I) are provided in the Supplemenary Data Table S3 (labeled as min_ΔG). In the following we are looking at the specific pathways (i.e., glycolysis/gluconeogenesis pathway, TCA cycle, and urea cycle) to investigate the effects of amino acid supplementation on hepatocyte metabolism.
In previous studies, it was found that glucose metabolism of hepatocytes switches to gluconeogenesis during plasma exposure from glycolysis during medium preconditioning (Chan et al., 2003c). However, we found that this switch only happens in the case with no amino acid supplementation during plasma exposure. For the cases of reference and designed amino acid supplementation, cryopreserved rat hepatocytes maintained the glycolysis phenotype during plasma exposure as in the preconditioning. It is also found that designed amino acid supplementation enhances glucose consumption (vm1) and increases the rate of glucose-6-phosphate dehydrogenation by glucose-6-phosphate dehydrogenase (vu38) and the rate of its storage as glycogen (vu43) compared to that in reference amino acid supplementation (Fig. 1).
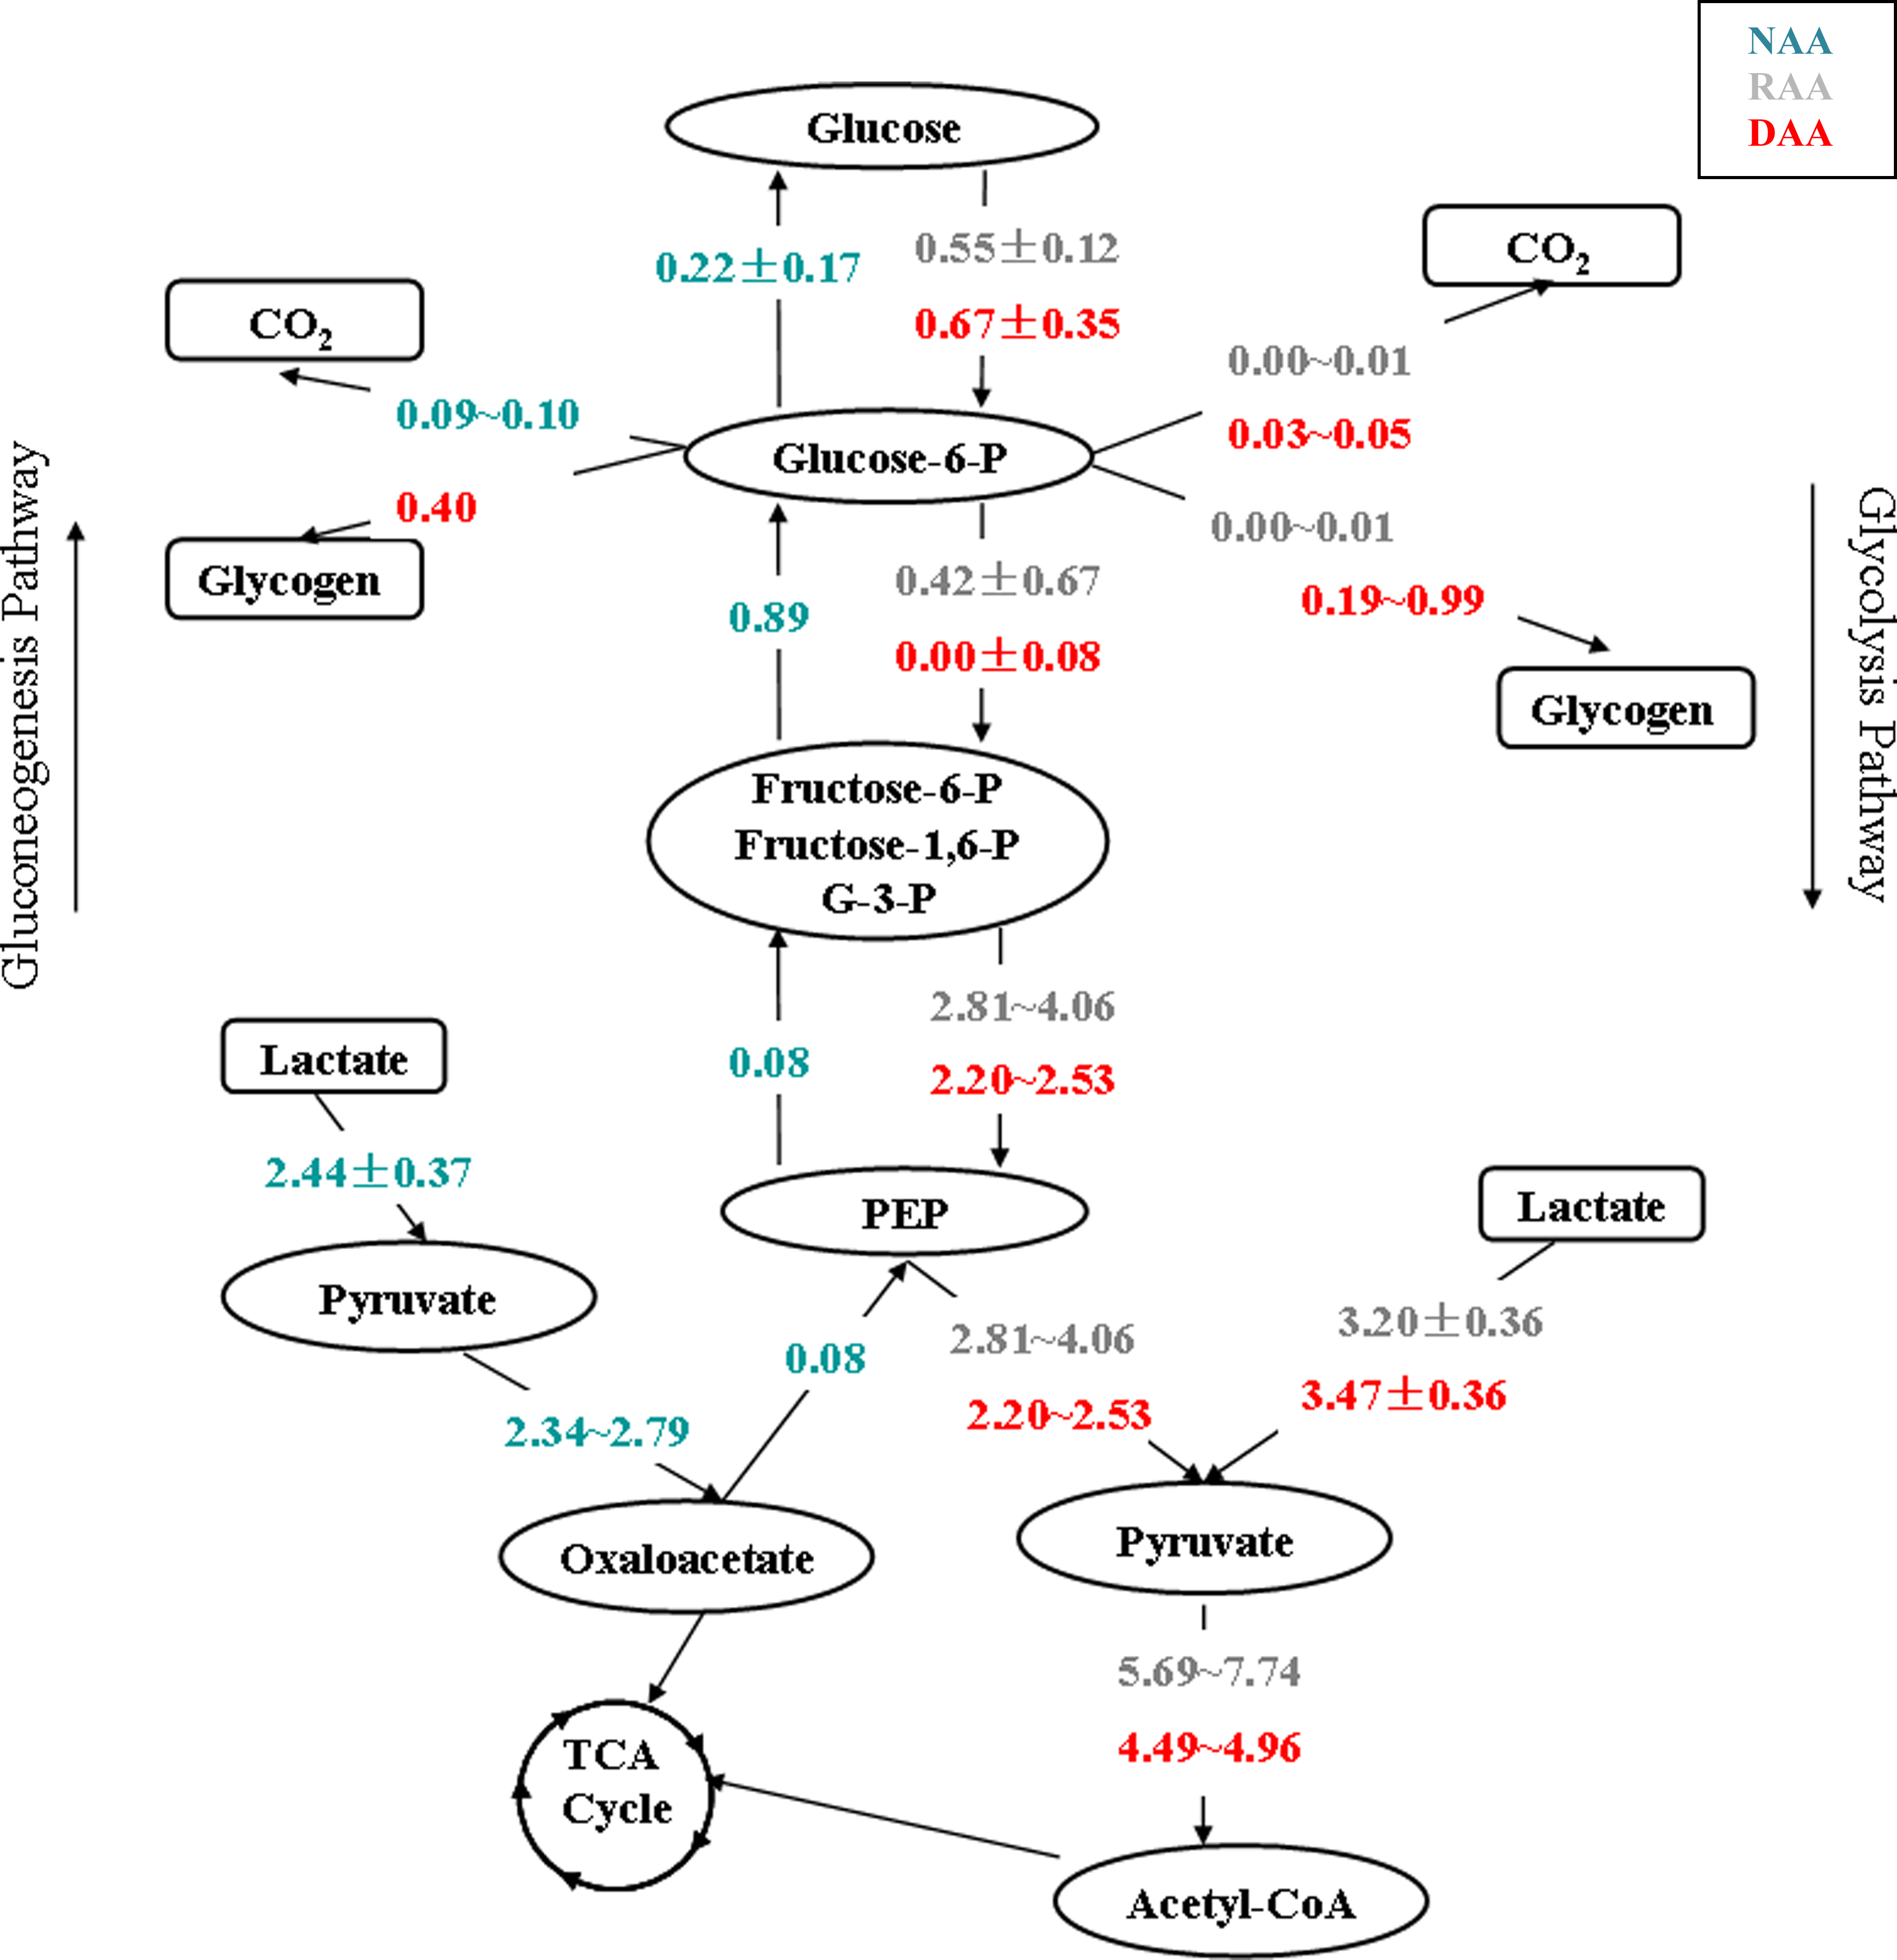
Flux distribution in glycolysis/gluconeogenesis pathway. Unknown flux range is calculated by metabolic network flexibility analysis (I) with minimal PEB constraints (labeled the range as “min∼max”), and extracellular fluxes are measured (labeled as “mean ± standard derivation”). All fluxes are reported in units of μmol/106 cells/day. It was found that gluconeogenesis is utilized by hepatocytes without amino acid supplementation; however, glycolysis pathway is utilized with reference and designed amino acid supplementation.
In our previous study, urea production (vm3), a key liver-specific function, was increased in designed amino acid supplementation compared to reference amino acid supplementation and no amino acid supplementation conditions during plasma exposure. Arginine, which is the only amino acid that can be directly converted to urea, can be taken up from the culture medium (vm4), or synthesized from citrulline and aspartate (vu14). This step provides the critical link between urea cycle and TCA cycle. In the presence of ATP, aspartate combines with citrulline to form fumarate and arginine, and fumarate returns to the TCA cycle. The flux distribution results (Fig. 2) show that TCA fluxes (vu9∼vu12) were increased in designed and reference amino acid supplementation compared with no amino acid supplementation. The majority of urea production from arginine is derived from citrulline (urea cycle, vu14) instead of form arginine uptake from supplementation (vm3), particularly in designed amino acid supplementation.
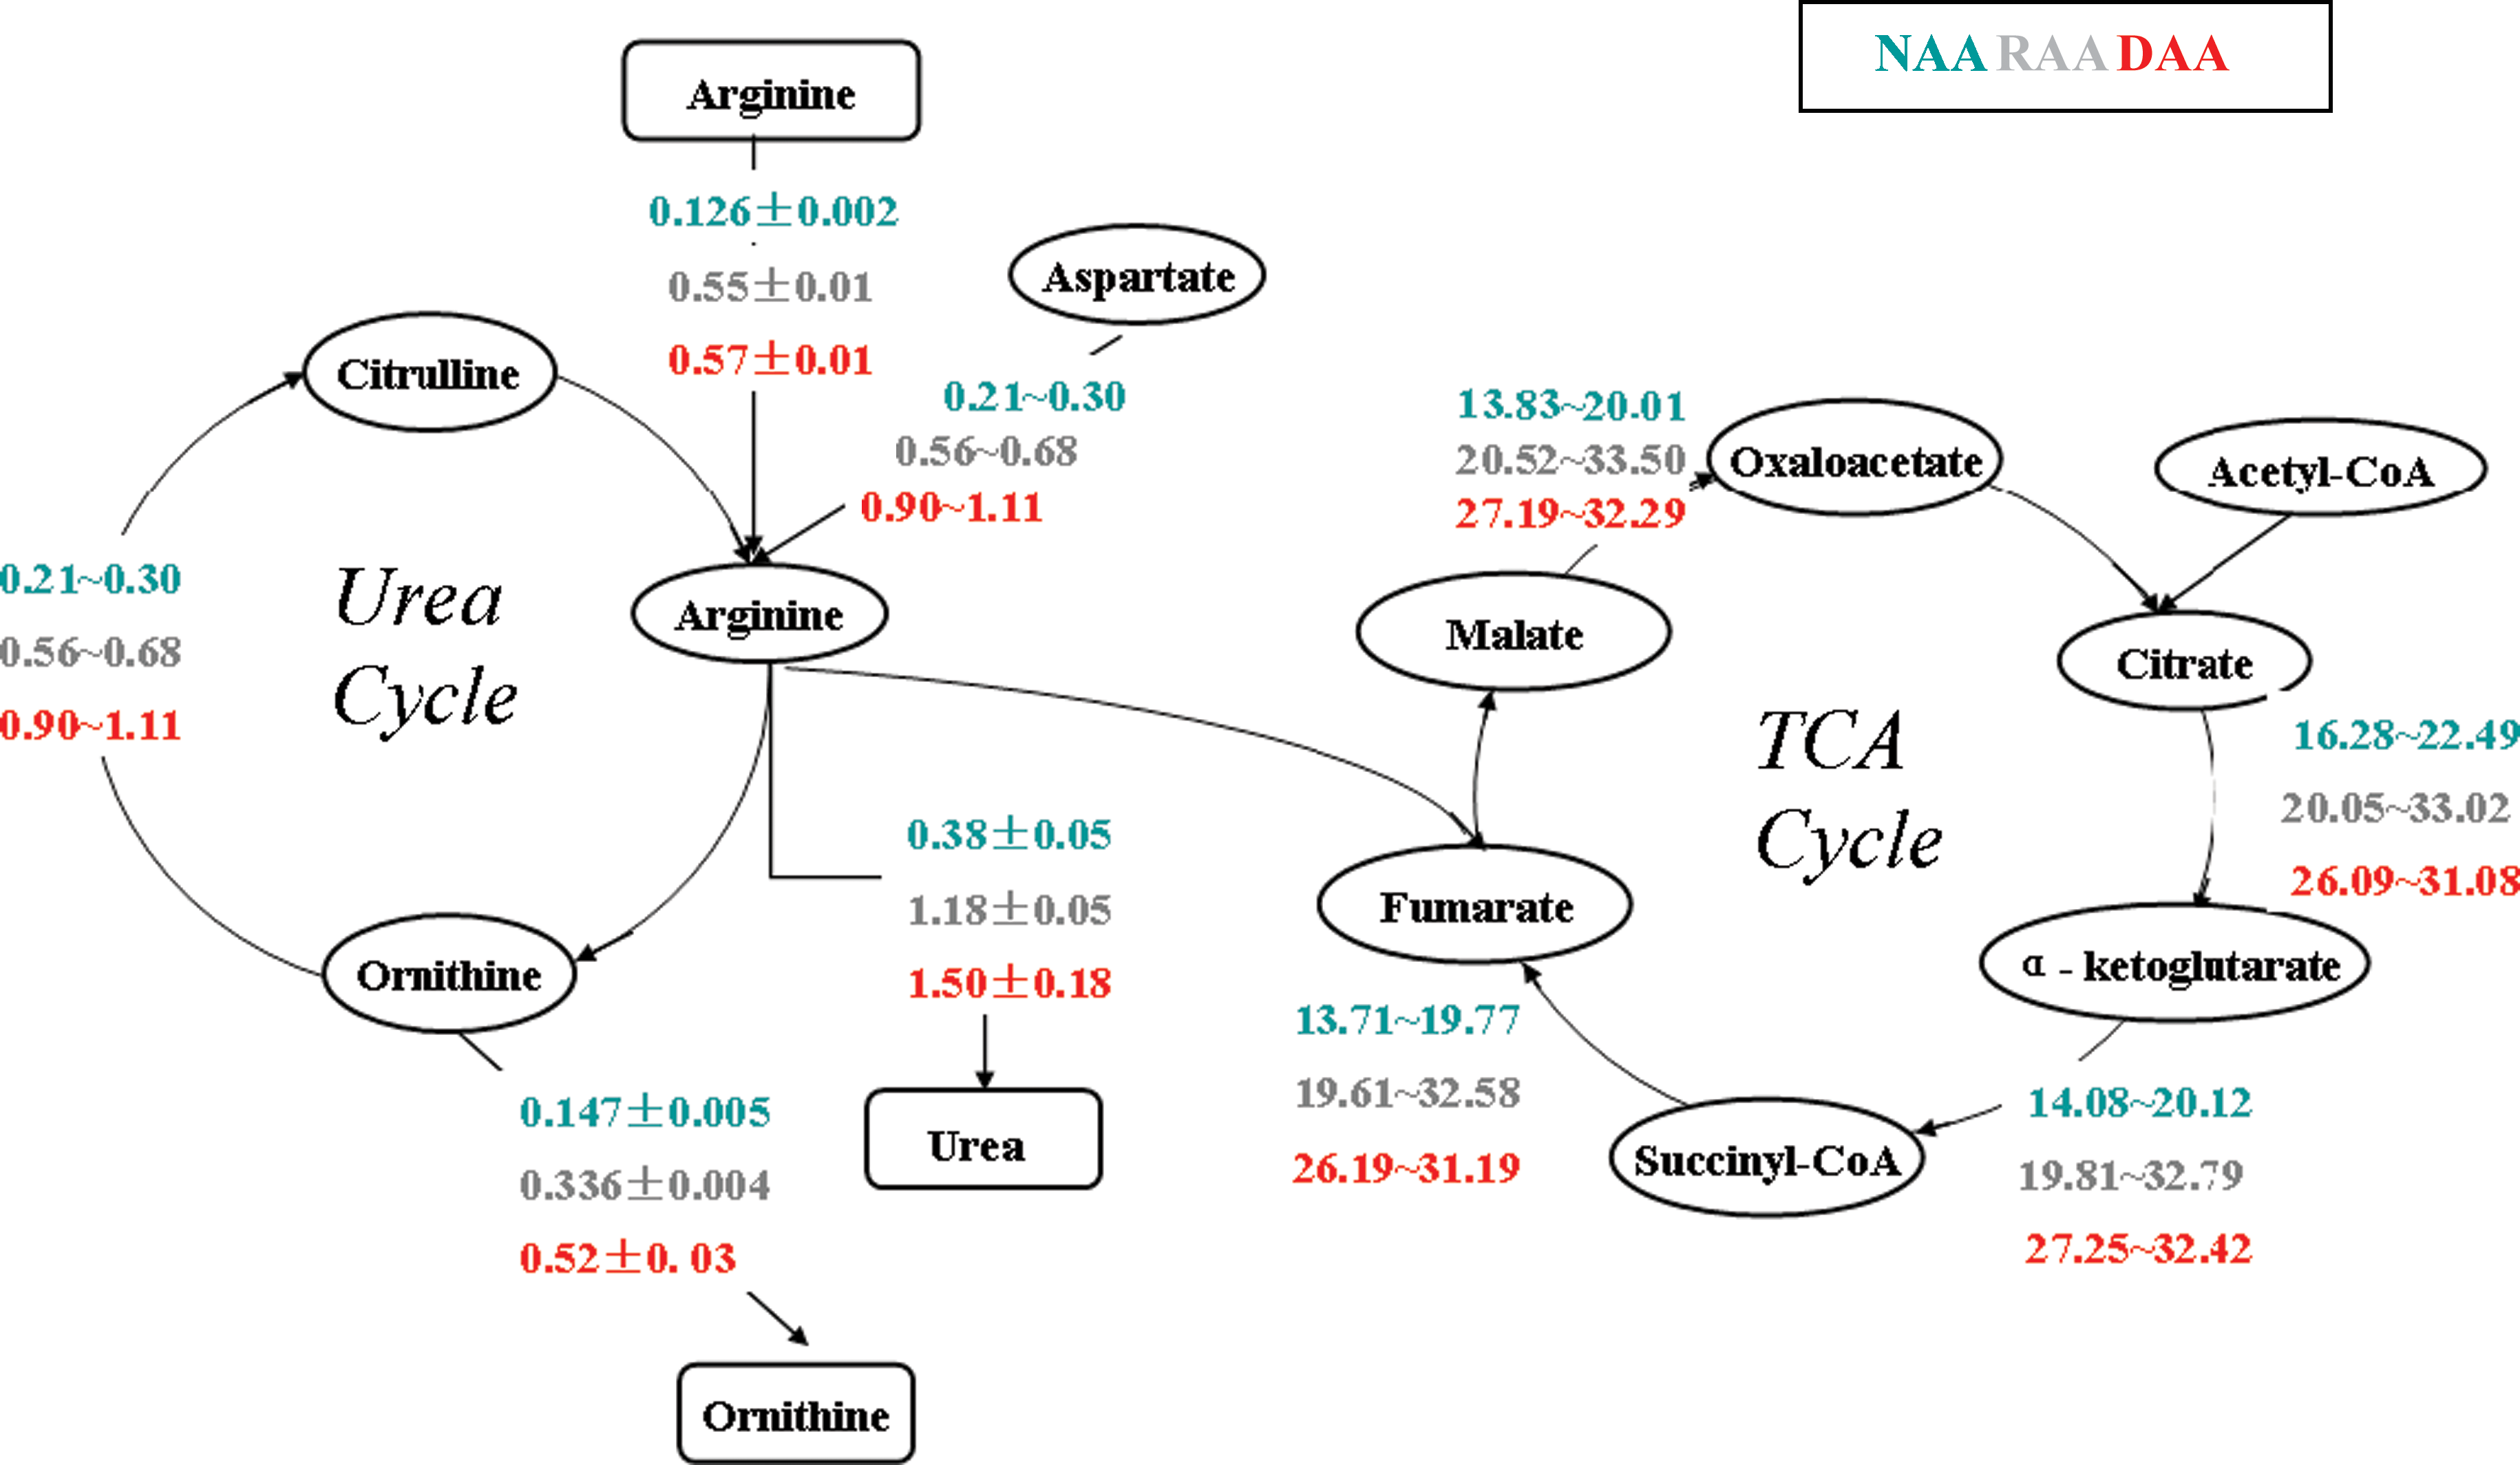
Flux distribution in the urea cycle and TCA cycle. Unknown flux range is calculated by metabolic network flexibility analysis (I) with minimal PEB constraints (labeled the range as “min∼max”), and extracellular fluxes are measured (labeled as “mean ± standard derivation”). All fluxes are reported in units of μmol/106 cells/day. It was found that urea production was significantly increased in designed amino acid supplementation by an increase of fluxes in urea cycle compared with those values in reference amino acid supplementation and no amino acid supplementation. Fluxes in TCA cycle were increased in designed and reference amino acid supplementation compared with no amino acid supplementation.
However, even with the incorporation of the minimum PEB constraints, the flux values are not sufficiently constraints to allow to reach any conclusion regarding the differences associated with fatty acid, lipid and glycerol metabolism, oxygen uptake, and electron transport in the different amino acids supplementation conditions. Therefore, the minimum PEB constraints were incorporated into the metabolic objective prediction model to calculate a unique flux distribution and infer the cell's metabolic objectives.
Metabolic objective prediction
By applying the metabolic objective prediction model (III), the metabolic objectives of culture hepatocyte, consistent with experimental measurements, are identified by the coefficient of relative importance (cj) for the three different amino acid supplementations. The results for most important metabolic objectives (cj > 0.1) are shown in Table 2.
NAA, no amino acid supplementation; RAA, reference amino acid supplementation; DAA, designed amino acid supplementation. The numeric values are coefficients determined from MOP model (III) that identify the important reactions for each condition.
The analysis implies that hepatocytes prioritize the management of their lipid metabolism by favoring palmitate uptake (vm28), and cholesterol ester transformation to palmitate (vm29) in the case where no amino acids are supplemented. In the condition of reference amino acid supplementation, the metabolic objectives shift to transport of amino acids and synthesis of ketone bodies via arginine and glycine uptake (vm4 and vm10), glutamate and aspartate release (vm12 and vm13), and fatty acid oxidation (vu33). Finally, in the case of designed amino acid supplementation, hepatocytes' metabolic objectives correspond to fatty acid metabolism: fatty acid oxidation (vu33), transformation of pyruvate to acetyl-CoA (vu6), and formation of the ketone body β-hydroxybutyrate (vm15).
Lipid metabolism and electron transport chain
From the experimental results, it was found that total free fatty acid uptake [TG uptake (vm30), FFA uptake (vm28), and cholesterol synthesis (vm29)] are not significantly different among the different amino acid supplementation conditions (Table 1). However, intracellular fluxes, calculated using model (III) (details in Table 3), indicate that there is lower lipid accumulation in the condition of designed amino acid supplementation due to an increase in TG conversion into fatty acid (vu42), an increase in fatty acid conversion to acetyl-CoA (vu33), and a decrease of TG storage (vu45) compared with other conditions during plasma exposure. These intracellular flux distributions are consistent with the morphological appearance of the cells, in which lipid droplets are apparent in the absence of amino acid supplementation but are reduced markedly when amino acid supplementation is employed (Yang et al., 2009).
NAA, no amino acid supplementation; RAA, reference amino acid supplementation; DAA, designed amino acid supplementation). Intracellular fluxes (μmol/106 cells/day) are calculated from MOP model (III).
From the obtained flux distribution (Table 3), it also found that the fluxes of oxygen uptake (vu33) and the reactions associated with electron transport (vu36, vu37) were increased under designed amino acid supplementation compared with the other two conditions. From the hepatic energy metabolism aspects, metabolism of amino acids in designed amino acid supplementation increases the amount of NADH and FADH2 through increase of the fluxes in TCA cycle. The NADH and FADH2 are next utilized with O2 taken from medium to make more ATP via the reactions associated with electron transport.
Discussion
It has been recognized that amino acids play an important role in regulatory control of hepatic metabolism during plasma exposure such as synthesis/degradation of protein and lipid (Chan et al., 2003c). In our previous work, experimental data showed that designed amino acids supplementation, derived from a rational approach based on linear optimization toward an objective of high urea flux, led to an increase in urea and albumin production compared with reference amino acid supplementation and no supplementation. In this work, metabolite measurements and flux/pathway analysis were used to characterize the hepatocytes' state of metabolism under varying amino acid supplementations.
In this system, the number of unknown fluxes (48 reactions) is greater than the number of mass balance equations (46 internal metabolites). Therefore, intracellular fluxes cannot be uniquely determined using FBA (Stephanopoulos et al., 1998). Additional constraints are required to reduce the feasible region of an FBA problem. Nolan et al. (2006) has successfully reduced the feasible region of FBA for hypermetabolic liver by incorporating the standard PEB constraints. However, the standard PEB constraints did not consider the effects of the metabolite concentration from different cultured conditions, which can greatly alter the values of Gibbs free energy of the reactions (Beard and Qian, 2005). The hepatic metabolic network considered involve a large number of metabolites, which make the analysis and quantification of concentration of every metabolite difficult and tedious. In order to resolve this issue, the concentrations of the extracellular metabolites are measured and correspond to the values in the culture medium and in the collected supernatant at the end of experiment (see Supplementary Data Text S1). The concentrations for intracellular metabolites are assumed to be within the range that exist in the literature relative to hepatic metabolism, or within their physiological ranges of the order of μM to mM if no data are available in the literature (Fraenkel, 1992) (see Supplementary Data Text S1). Although exact measurements of concentrations for intracellular metabolites are not available, the proposed methods take into consideration the effects of metabolite concentration on evaluating the Gibbs free energy of pathway rather than relying solely on standard conditions.
In order to check the hypothesis that the additional PEB constraints can help reducing the feasible solution space of hepatic network, the range of each unknown flux was estimated using MNFA model without considering PEB constraints, with standard PEB constraints that are based on standard Gibbs free energy, and minimum PEB constraints that are based on the metabolite concentrations. The numerical results are provided in Supplementary Data Table S3 (labeled as “without_ΔG,” “standard_ΔG,” and “min_ΔG,” respectively). The results illustrate that a large reduction can be achieved in the range of unknown fluxes by the addition of either the standard or the minimum PEB constraints compared with the results without PEB constraints in all three conditions corresponding to different amino acid supplementations. Comparing the two types of PEB constraints, it can be observed that although the standard PEB constraints generate a tighter feasible region for the unknown flux values, the addition of the minimum PEB constraints guarantee that the flux range obtained incorporates all possible flux values and provides a more reliable range of metabolic states. Thus, we used minimum PEB constraints to investigate the effects of amino acid supplementation and incorporate these constraints into MOP model (III) to infer the metabolic objectives.
In a traditional flux balance analysis, a particular flux distribution is determined based on a preselected objective, such as maximization of growth rate for a microorganism (Ibarra et al., 2002), or maximization of urea production for primary hepatocytes (Sharma et al., 2005). Schuetz et al. (2007) evaluated different objective/constraints combinations and found that the objectives of Escherichia coli change with different environmental conditions or biological occurrences. A Bayesian-based objective function discrimination method has thus been developed to find the most probable objective with a highest posterior probability from a group of spare objectives (Knorr et al., 2007). Recently, a bilevel programming framework (Objfind) has been developed to systematically identify and test metabolic objectives (Burgard and Maranas, 2003) that are the most consistent with experimental data and represented by the value of the coefficient of importance. In this work, we modified Objfind, by taking into consideration flux data of external metabolites, mass balances of all internal metabolites and minimum PEB constraints, to determine the hepatocyte objectives. One of the advantages of this method is that it does not require a preselection of a set of objective functions (Burgard and Maranas, 2003).
Uygun et al. (2007) applied a similar approach of Objfind for objective identification in cultured hepatocytes assuming that the cells exhibit the same objective under different conditions. Instead, in our study, the results of MOP analysis reveal the cellular priorities change based on the amino acid supplementation (Table 2). Previous reports suggested that urea synthesis is reduced during plasma exposure, most possibly due to lack of amino acids in the medium (Matthew et al., 1996), which is represented in our studies by the case of no amino acid supplementation. The results of MOP reveal that in this case the cells uptake FFA and transform cholesterol ester to FFA (vm28, vm29), which is supported by the results reported in the literature of increased TG accumulation (Matthew et al., 1996). When amino acid supplementation was provided in the plasma, TG accumulation was reduced for both reference and designed amino acid supplementation (Chan et al., 2003a; Yang et al., 2009). Given that changes are occurring in pathways beyond the urea cycle, it is not surprising that the metabolic objectives of hepatocytes are changing with varying amino acid supplementations. The solution of the MOP model implies that the metabolic objectives for the case of reference amino acid supplementation are to exchange amino acids (arginine, glycine, glutamate, and aspartate) with cultured medium and to synthesize acetoacetate. For the case of designed amino acid supplementation, arginine and glycine uptake were not selected as cell objectives because the cells have already reached their maximum uptake capacity of arginine and glycine. Excess uptake of any amino acid from the cell can cause buildup of ammonia that should be excreted to avoid toxic effects. Supplying hepatocytes with large amounts of glutamine (6.85 mM in reference and designed amino acid supplementation compared with 0.65 mM in the medium of no amino acid supplementation) results in a large increase of intracellular glutamate via the reaction vu26 and aspartate due to reaction vu31. Thus secretion of both glutamate and aspartate were among the objectives identified by MOP for the case of reference amino acid supplementation.
Both reference and designed amino acid supplementation identified fatty acid oxidation as an objective, which is an important step to reduce the rate of TG accumulation during plasma exposure (Stefanovich et al., 1996). The coefficients of importance (cj) associated with fatty acid oxidation are greater in designed amino acid supplementation (cj = 0.44) than in reference amino acid supplementation (cj = 0.11). A higher value of cj indicates a greater priority relative to other functions for the same culture condition, which implies that the reduction of TG accumulation is more pronounced in the designed amino acid supplementation. The other two metabolic objectives identified for the case of designed amino acid supplementation are β-hydroxybutyrate production and transformation of pyruvate to acetyl-CoA, which indicates that the decrease in ketone body production results in more acetyl-CoA entering the TCA cycle to produce urea (Yang et al., 2009). These results indicate that hepatocytes can fine tune their intracellular metabolism to maintain their principal metabolic functions upon perturbations in substrate availability.
In summary, a flux balance analysis integrating experimental data with stoichiometric and thermodynamic constraints was used to analyze the alterations in hepatocyte metabolism under varying amino acid supplementation. The results showed that amino acid supplementation induces an increase in the flux of free fatty acid oxidation in hepatic metabolism during plasma exposure. The increase in fatty acid oxidation correlates with the increase in urea production going from no supplementation to reference supplementation to design supplementation, suggesting that this is a pathway that can be manipulated either directly or indirectly to mediate improvements in hepatic function. More generally, this work provides a proof-of-concept for an integrated approach to mammalian cell metabolic engineering in which the computational framework of FBA allows the design of a candidate supplementation, and experimental data obtained under the designed conditions are used to analyze the validity of model assumptions and suggest further improvements towards designed objectives.
Footnotes
Acknowledgments
We gratefully acknowledge the financial support from the NSF QSB program (BES-0456697), NSF Metabolic Engineering (BES-0519563), and USEPA-funded Environmental Bioinformatics and Computational Toxicology Center (GAD R 832721-010). We thank Professor Kyongbum Lee for providing the standard Gibbs free energy data for metabolites of hepatocyte network.
Author Disclosure Statement
The authors declare that no conflicting financinal interests exist.
References
Supplementary Material
Please find the following supplemental material available below.
For Open Access articles published under a Creative Commons License, all supplemental material carries the same license as the article it is associated with.
For non-Open Access articles published, all supplemental material carries a non-exclusive license, and permission requests for re-use of supplemental material or any part of supplemental material shall be sent directly to the copyright owner as specified in the copyright notice associated with the article.
