




Abstract
Abstract
Hypoxia affects mammalian mitochondrial function, as well as mitochondria-based energy metabolism. The detail mechanism has not been fully understood. In this study, we detected protein expression levels in mitochondrial fractions of Wistar rats exposed to hypobaric hypoxia by use of proteomic methods. Adult male Wistar rats were randomized into an hypoxic (4,500 m, 30 days) group and a normoxic control group (sea level). Gastrocnemius muscles mitochondria were extracted and purified. Mitochondrial oxygen consumption was measured with a Clark oxygen electrode; mitochondrial transmembrane potential was detected with Rhodamine 123 as a fluoresce probe. Using 2-DE and MALDI-TOF MS analysis, we identified eight mitochondrial protein spots that were differentially expressed in the hypoxic group compared with the normoxic control. These proteins included Chain A of F1-ATPase, voltage dependent anion channel 1 (VDAC), hydroxyacyl Coenzyme A dehydrogenase α-subunit, mitochondrial F1 complex γ-subunit, androgen-regulated protein and tripartite motif protein 50. Two of the spots, VDAC and ATP synthase α-subunit, were confirmed by Western blotting analysis. Oxygen consumption during State 3 respiration, as well as the respiratory control ratio (RCR) was significantly higher in the control than that in the hypoxic group; mitochondrial transmembrane potential was significantly higher in hypoxic group than that in the control. With successful use of multiple proteomic analysis techniques, we demonstrates that 30 days hypoxia exposure has effects on the expression of mitochondrial proteins involved in ATP production and lipid metabolism, decrease the stability of mitochondrial membrane, and affect the mitochondrial electron transport chain.
Introduction
Mitochondria play important roles in many important metabolic tasks, such as cellular proliferation, regulation of the cellular redox state, fatty acid oxidation, urea cycle, heme and steroid synthesis, and heat production. The response of skeletal muscle mitochondria to a lowered environmental oxygen partial pressure, would depend on the exact interdependence of environmental oxygen availability and mitochondrial oxidative phosphorylation in the entire body (Hoppeler et al., 2003). Previous studies suggested that changes of mitochondrial structure and function serve as an important mechanism for the acclimatization to a hypoxic environment (Casey et al., 2002; Cerretelli et al., 1984; Liu et al., 2002; Piruat et al., 2005). The acclimatization could potentially be associated with changes in the synthesis of mitochondrial RNA and proteins (Liu et al., 2002), and such changes results in recovery of mitochondrial function under long term hypoxia. There are 1000–2000 proteins in mitochondria; however, only very few mitochondrial proteins associated with hypoxic acclimatization have been studied, the roles of hypoxia on mitochondrial protein expression need to be extensively comprehended.
The use of proteomic analyses provides a powerful suite of techniques for the identification and characterization of mitochondrial proteins involved in these processes, and should yield significant insight into a more complete understanding of the molecular effects of hypoxia on skeletal muscle function.
In the present study, we detected differential expression levels of mitochondrial proteins in Wistar rats exposed to hypobaric hypoxia 30 days and the control by use of proteomic methods. We also measured mitochondrial respiratory function and mitochondrial transmembrane potential, which concerned with those differently expressed proteins, to investigate the possible links between mitochondrial protein variants and muscle acclimatization to hypoxia.
Materials and Methods
Materials
Acrylamide, methylenebis-acrylamide, glycine, Tris, SDS, urea, glycerol, bromophenol blue, IPG buffers, IPG strips, and ampholyte were purchased from Amersham Biosciences (Uppsala, Sweden). Pharmalyte, TEMED, CHAPS, thiourea, iodoacetamide, rotenone, Rhodamine 123, and ammonium persulfate were from Sigma (St. Louis, MO, USA). DTT was from Promega (Madison, WI, USA). Complete protease inhibitor cocktail tablet was from Roche (Indianapolis, IN, USA). Antirabbit, -mouse IgG antibodies and antivoltage-dependent anion channel (VDAC) antibody were obtained from Sigma. Anti-ATP synthase α-subunit antibody was from Molecular Probes (Eugene, OR, USA). Anti-LAMP, -dynamin II, and -KDEL antibodies were supplied by Stressgen (Victoria, B.C., Canada). Anti-β-actin antibody was from Abcam (Cambridge, UK). The ECL Western blotting detection kit was from Amersham Biosciences, GE Healthcare (Piscataway, NJ, USA). Other reagents and chemicals were obtained from standard commercial sources and were of analytical grade.
Animal model
Adult male Wistar rats (n=16) weighing 180–200 g, fed standard laboratory diet, were divided into a chronic hypoxic group (n=8) and control group (n=8) randomly. The animals in the chronic hypoxia group were placed in a hypobaric chamber to mimic 4,500 m high altitude, whereas the control group was outside the chamber (300 m) for 1 month. Animals were sacrificed by decapitation in the 4,500 m hypobaric chamber (hypoxic group) or outside (the control), respectively. Bilateral gastrocnemius were rapidly excised and placed in ice-cold mitochondrial isolation buffer (MIB) that contained 0.25 mol/L sucrose and 10 mmol/L Tris-HCl, pH 7.4 after being washed with cold bicarbonate buffer.
Preparation of skeletal muscle mitochondria
The mitochondrial sample was prepared according to the methods of Zydowo et al. (1985) and Taylor et al. (2002). Briefly, gastrocnemius tissues were manually homogenized, using a medium-fitting glass Teflon homogenizer in MIB. The resultant homogenate was centrifuged successively twice at 600×g for 5 min at 4°C. Afterward, the supernatant was centrifuged again at 10,000×g for 10 min. The mitochondria-enriched pellet were resuspended in MSHE (210 mmol/L mannitol, 70 mmol/L sucrose, 5 mmol/L HEPES, 1 mmol/L EGTA, plus a Complete protease inhibitor cocktail tablet) and loaded onto a 35%/17% metrizamide gradient in 6% Percoll. Gradients were centrifuged at 20,000×g for 45 min. The mitochondrial fraction was collected from the 35%/17% interface, diluted in MSHE before pelleting at 12,000×g for 10 min, and resuspended in MSHE. Protein concentrations were determined using the Bradford method. The purity of the mitochondria was assessed by Western analysis using antisera directed against β-actin, dynamin II, KDEL, and LAMP to detect contamination due to cytoplasm, plasma membrane, ER, and lysosomes, respectively. The integrity of the mitochondria was assessed by Western analysis using a cocktail of monoclonal antibodies directed against components of the electron transport chain (ETC): 39-kDa subunit of complex I, 70-kDa subunit of complex II, core 2 of complex III, cytochrome c oxidase subunit IV (COX IV) of complex IV, and ATP synthase α-subunit of complex V.
Oxygen-consumption measurements
The respiratory rate of mitochondria was investigated by measuring oxygen consumption polarographically with a Clark oxygen electrode according to methods of Luo et al. (1998). Oxygen electrode buffer (225 mmol/L sucrose, 3 mmol/L K2HPO4, 0.4 mmol/L EDTA, pH 7.4) was incubated for 1 min in a magnetically stirred chamber at 30°C. The respiratory substrates, glutamate (5 mmol/L) and malate (2.5 mmol/L), were added, followed by the isolated mitochondria (1–2 mg protein/mL). Basal respiration was first measured in the absence of ADP for 1 min. Subsequently, State 3 respiration was measured after ADP was added at a final concentration of 1 mmol/L. State 4 respiration was measured as ADP had been expended. The respiratory control ratio (RCR) was calculated using the ratio of State 3 to State 4 respiratory rates.
Mitochondrial transmembrane potential measurement
The mitochondrial transmembrane potential (ΔΨ) was measured according to the methods of Emaus et al. (1986). Mitochondria were incubated at room temperature for 5 min in 1 mL incubation medium containing 150 mmol/L sucrose, 5 mmol/L magnesium chloride, 5 mmol/L sodium succinate, 2.5 μmol/L rotenone, 5 mmol/L potassium phosphate buffer, pH 7.4, 1 μmol/L Rhodamine 123, 20 mmol/L HEPES, followed by centrifuging at 5,000×g for 5 min. The supernatant was collected and fluorescence excited at 500 nm and emitted at 525 nm was measured. (Rhodamine 123)in was estimated from Rhodamine 123 uptake assuming distribution into a matrix space of 1 μL/mg of protein. Membrane potentials (negative inside) were calculated by the Nernst equation: ΔΨ=59log([X]in/[X]out).
The two-dimensional electrophoresis of mitochondrial proteins
The mitochondrial pellet was dissolved in lysis buffer (8 M urea, 2.5 M thiourea, 5% w/v CHAPS, 12.5 M DTT, and 0.5% v/v carrier ampholytes), and kept at room temperature for at least 1 h. The protein content was assayed by Coomassie brilliant blue G250. 2-DE was performed as described by Amersham protocal. Isoelectric focusing (IEF) was carried out on Ettan IPGphor isoelectric focusing system (Pharmacia Biotech, Uppsala, Sweden) using 18 cm IPG strips (pH 3–10). Mitochondrial protein (1.0 mg) was added to the rehydration solution (7 M urea, 2 M thiourea, 4% w/v CHAPS, 10 M DTT, 0.5% v/v SDS, 0.4% v/v carrier ampholytes, and a trace of bromophenol blue) to a total volume of 350 mL. Strips were rehydrated for 4 h and then IEF was performed for a total of 80,000 Vh. The second dimension electrophoresis was carried out on 1.5 mm and 13%T SDS-PAGE gels (Bio-Rad vertical system; Bio-Rad, Hercules, CA, USA). The parameters were constant current of 20 mA/gel for 40 min and 30 mA/gel until the front of bromophenol blue dye reached the bottom of the gel. After electrophoresis, gels were stained with CBB R-350. 2-DE gels were scanned with an ImageScanner (Amersham Biosciences) and the difference in the abundance of differential protein spots was analyzed analyzed using ImageMaster 5.0 software (Amersham Biosciences).
Protein identification
The significative protein spots were excised from the gel and then digested with trypsin. Briefly, protein spots were destained with 50% ACN and dried in a vacuum concentrator. The dried gel was then rehydrated in trypsin solution and incubated overnight at 37°C. After the peptides were eluted in turn with TFA of different concentrations, the peptide mixture was measured on a Micomass Tof Spec MALDI-TOF mass spectrometer (Autoflex, Brucker) in a positive ion reflectron mode. The accelerating potential was 20 kV, with eight shots per second. Trypsin autodigestion peaks were used as internal calibration and Ang III as external. Peptide mass data were searched against National Center for Biotechnology Information (NCBI) by the Mascot search engine with rattus as the species searched. The basic requirement for identification was that the expectation value (chance of misidentification) is less than 0.05 and the coverage (the ratio of the protein sequence covered by the matched peptides) is more than 20%. The results were further confirmed in the Swiss-Prot protein database (us.expasy.org/sprot). Protein identification was repeated at least once with spots from different gels.
Western blot analysis
Twenty micrograms of mitochondrial protein from gastrocnemius were separated by 10% SDS-PAGE. The proteins were transferred to PVDF membranes, which were blocked overnight in TBST [0.1% (v/v) Tween 80, 100 mmol/L Tris, and 0.9% (w/v) NaCl, pH7.5] containing 5% nonfat dry milk and then probed with antibodies of VDAC, ATP synthase α-subunit at a dilution of 0.2 μg/mL for 1.5 h at room temperature. The membranes were incubated with horseradish peroxidase-conjugated secondary antibody at a dilution of 1:2,000 for 1 h at room temperature. Immunoreactivity was visualized with an ECL Western blotting detection kit under VersadDoc Mode 5000 (Bio-Rad).
Results and Discussion
Although the primary function of mitochondria is to convert organic materials into cellular energy in the form of ATP, mitochondria play important roles in many important metabolic tasks, such as cellular proliferation, regulation of the cellular redox state, fatty acid oxidation, urea cycle, heme and steroid synthesis, and heat production. Previous studies suggested that changes of mitochondrial structure and function serve as an important mechanism for the acclimatization to a hypoxic environment. Acute hypoxia downregulates mitochondrial RNA and protein synthesis (Casey et al., 2002; Liu et al., 2002; Piruat et al., 2005), and impairs mitochondrial structure and function (Magalhaes et al., 2005; Remis et al., 1989). However, during prolonged hypoxic exposure, mitochondrial damage may be repaired to some degree and the mitochondrial to fiber volume ratio increases (Cerretelli et al., 1984). As a result, animals exposed to chronic hypoxia show gradual acclimatization. The acclimatization could potentially be associated with changes in the synthesis of mitochondrial RNA and proteins (Liu et al., 2002). However, the effect of hypoxia on mitochondrial protein expression has not been determined. To the best of our knowledge, this study represents the first of analyzing the effect of hypoxia on mitochondrial functional proteomics in rat skeletal muscle.
Pure and intact mitochondria were isolated
To analyze proteomics of mitochondria, it is necessary to isolate a relatively pure preparation of mitochondria. As describe in Maerials and Methods, mitochondria were isolated from rat gastrocnemius muscle by differential centrifugation and further purified by metrizamide gradient centrifugation. To determine if the mitochondrial preparations were contaminated by proteins of the cytoplasm, plasma membrane, endoplasmic reticulum, and lysosomes, we performed Western blots analysis using antibodies against β-actin, dynamin II, KDEL, and LAMP, respectively. Before the metrizamide gradient-based purification, only β-actin was detectable. After the purification, none of the four proteins were detected (Fig. 1). Thus, the purified mitochondria appeared to be free from contamination by other cellular proteins.
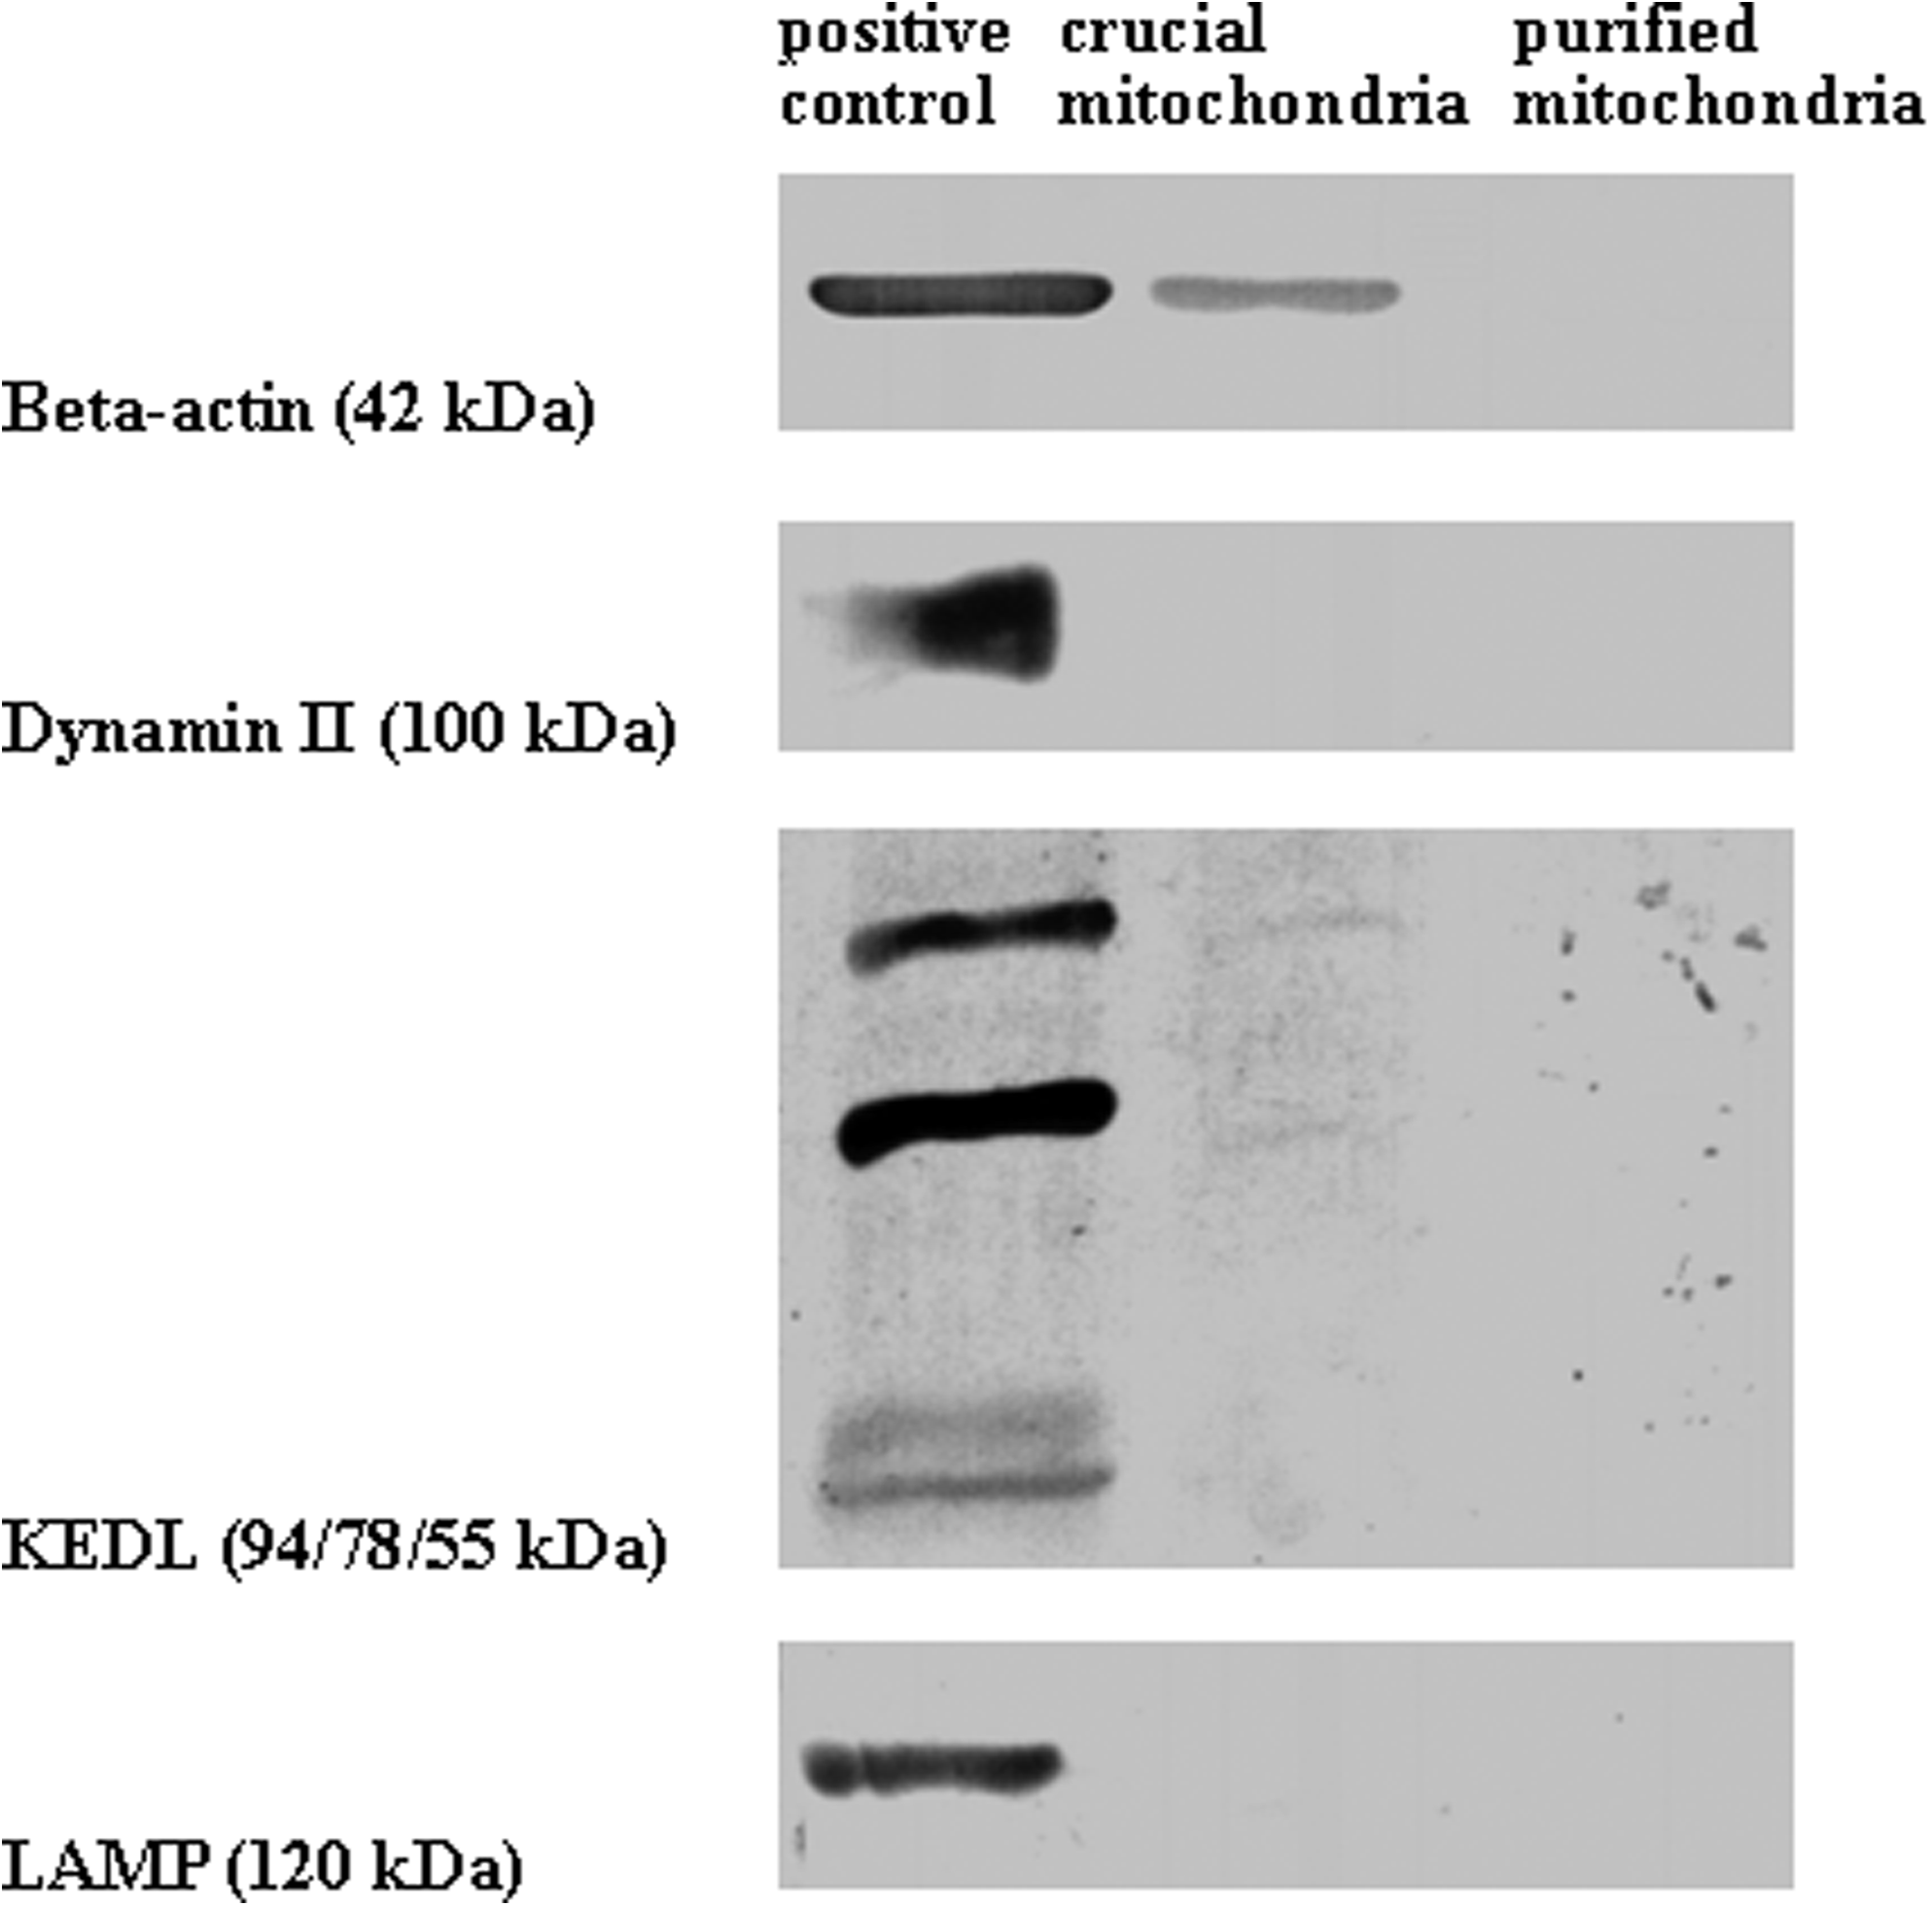
Purity detection of isolated rat gastrocnemius mitochondria by metrizide density gradient centrifugation. (
To perform mitochondrial proteomic analyses, it is also essential to maintain mitochondrial protein compositions in the purified preparation. To determine if our purified mitochondrial preparation is enriched with mitochondrial proteins, we performed Western blots with specific antibodies against several components of the electron transport chain, including a 39-kDa subunit of complex I, a 70-kDa subunit of complex II, the core 2 protein of complex III, COX IV, and ATP synthase α-subunit of complex V. All the five proteins were detected (Fig. 2). Thus, mitochondrial proteins appeared to have been preserved during the isolation and purification process.
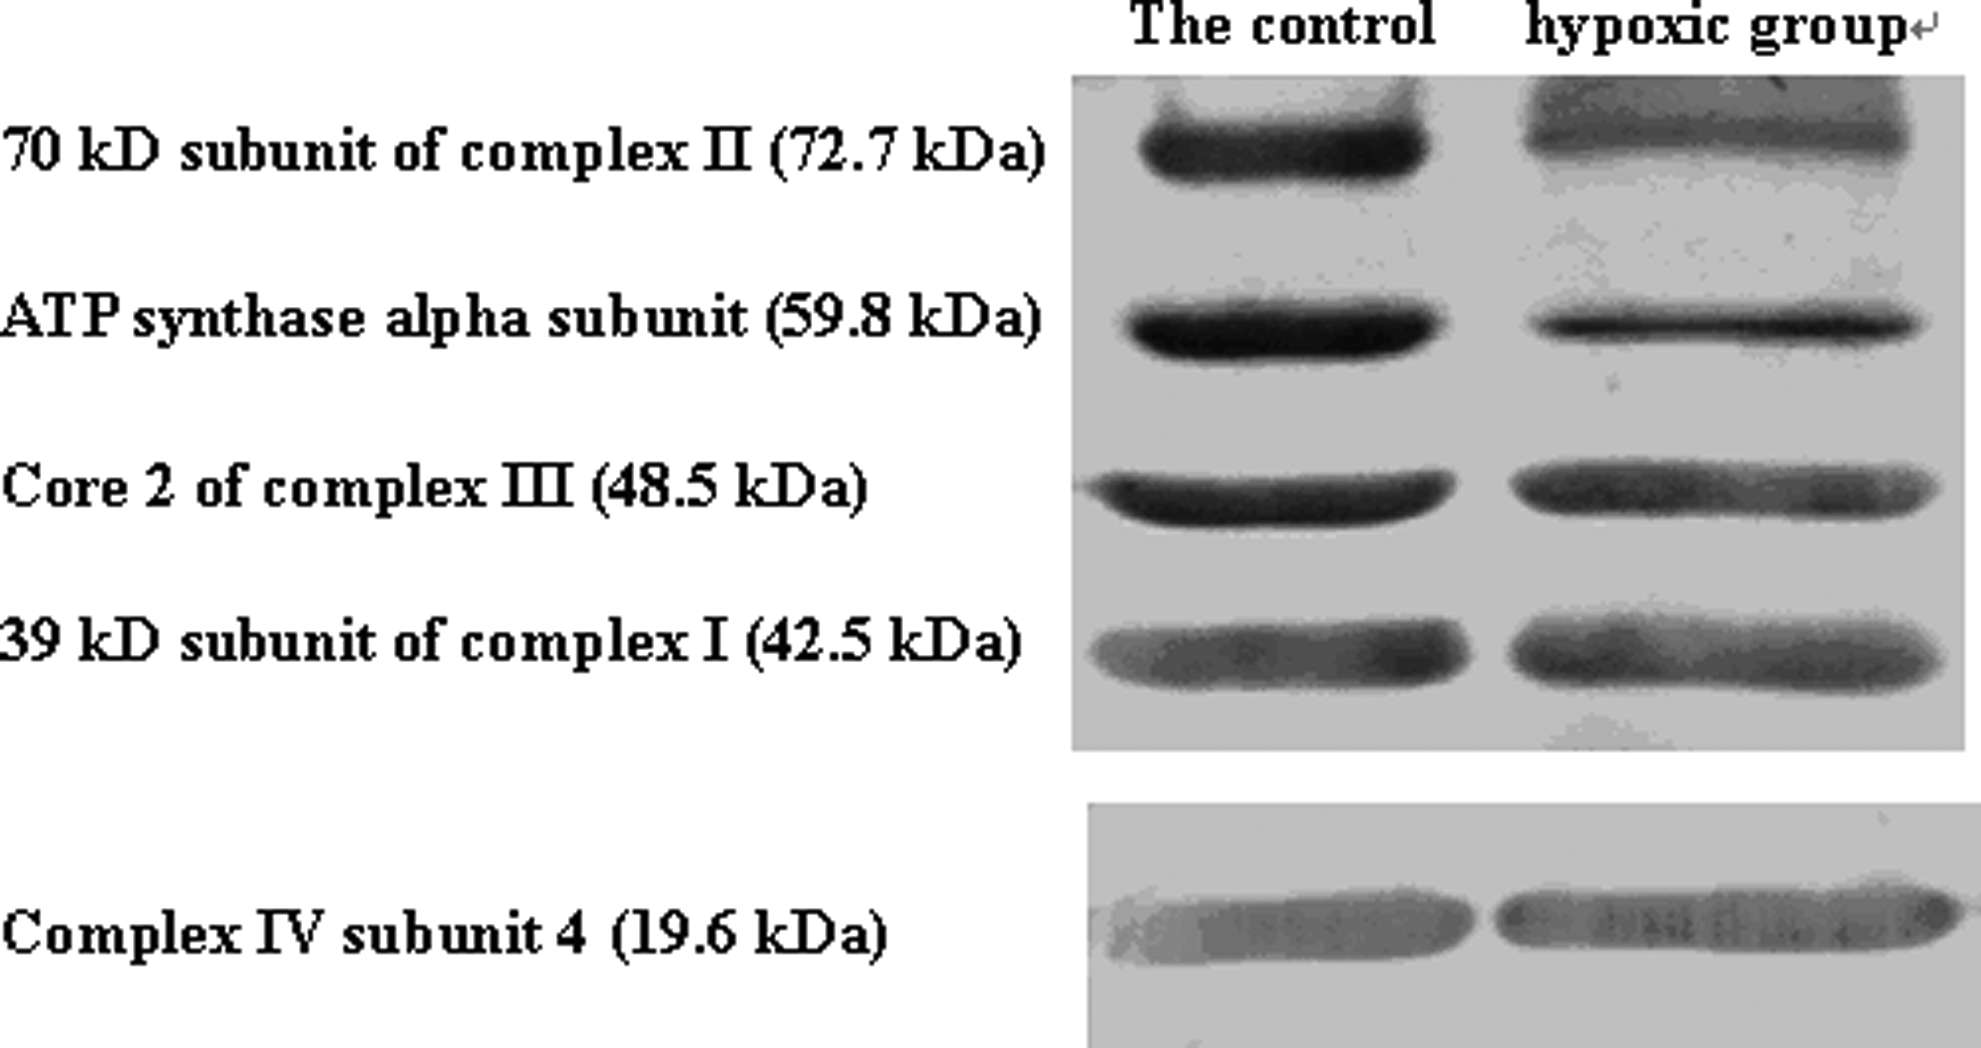
Integrity detection of isolated rat gastrocnemius mitochondria by metrizide density gradient centrifugation. (
Changes in mitochondrial protein expression
Gastrocnemius mitochondrial proteins from control (normoxic) and hypoxic rats were separated by two-dimensional electrophoresis. Mitochondrial proteins from two different gastrocnemius samples were distributed in the regions of pI 3 to 10 and had molecular weights between 30 and 150 kDa (Fig. 3). The densities of 35 spots (approximately 10% of the total) differed significantly between the control and hypoxia groups, with 8 higher and 27 lower in the hypoxia group. We picked four hypoxia upregulated and four hypoxia downregulated spots, which showed over twofold difference in density) for further analyses.

2-DE analysis of mitochondrial proteins in Wistar rat gastrocnemius tissue. Samples of control and hypoxic group mitochondria are shown. (
Protein identification
The eight selected spots were isolated from the two-dimensional electrophoresis gel of the hypoxia group and subjected to MALDITOF-MS. The peptide mass peaks were compared with those in the NCBI database to identify the proteins. The protein data descriptions are listed in Table 1. The four spots upregulated by hypoxia were identified as chain A of F1-ATPase, voltage-dependent anion channel 1 (VDAC), androgen regulated protein, and tripartite motif protein 50 (Tim50), whereas the four spots downregulated by hypoxia were identified as hydroxyacyl-coenzyme A dehydrogenase (HOAD) α-subunit; chain A of F1-ATPase (two spots), and mitochondrial F1 complex γ-subunit.
The pI and mass values were obtained from the MASCOT database. Individual scores indicate extensive homology. (gi, Gene bank ID, score, MASCOTscore) * calculated value. Δ complared with the control.
Western blot analysis
VDAC and ATP synthase were chosen for further analyses and subjected to Western blot analysis (Fig. 4) to confirmed the 2-DE gel image data. Compared with the control group, the levels of VDAC protein increased significantly (p<0.05), whereas ATP synthase decreased significantly (p<0.05).
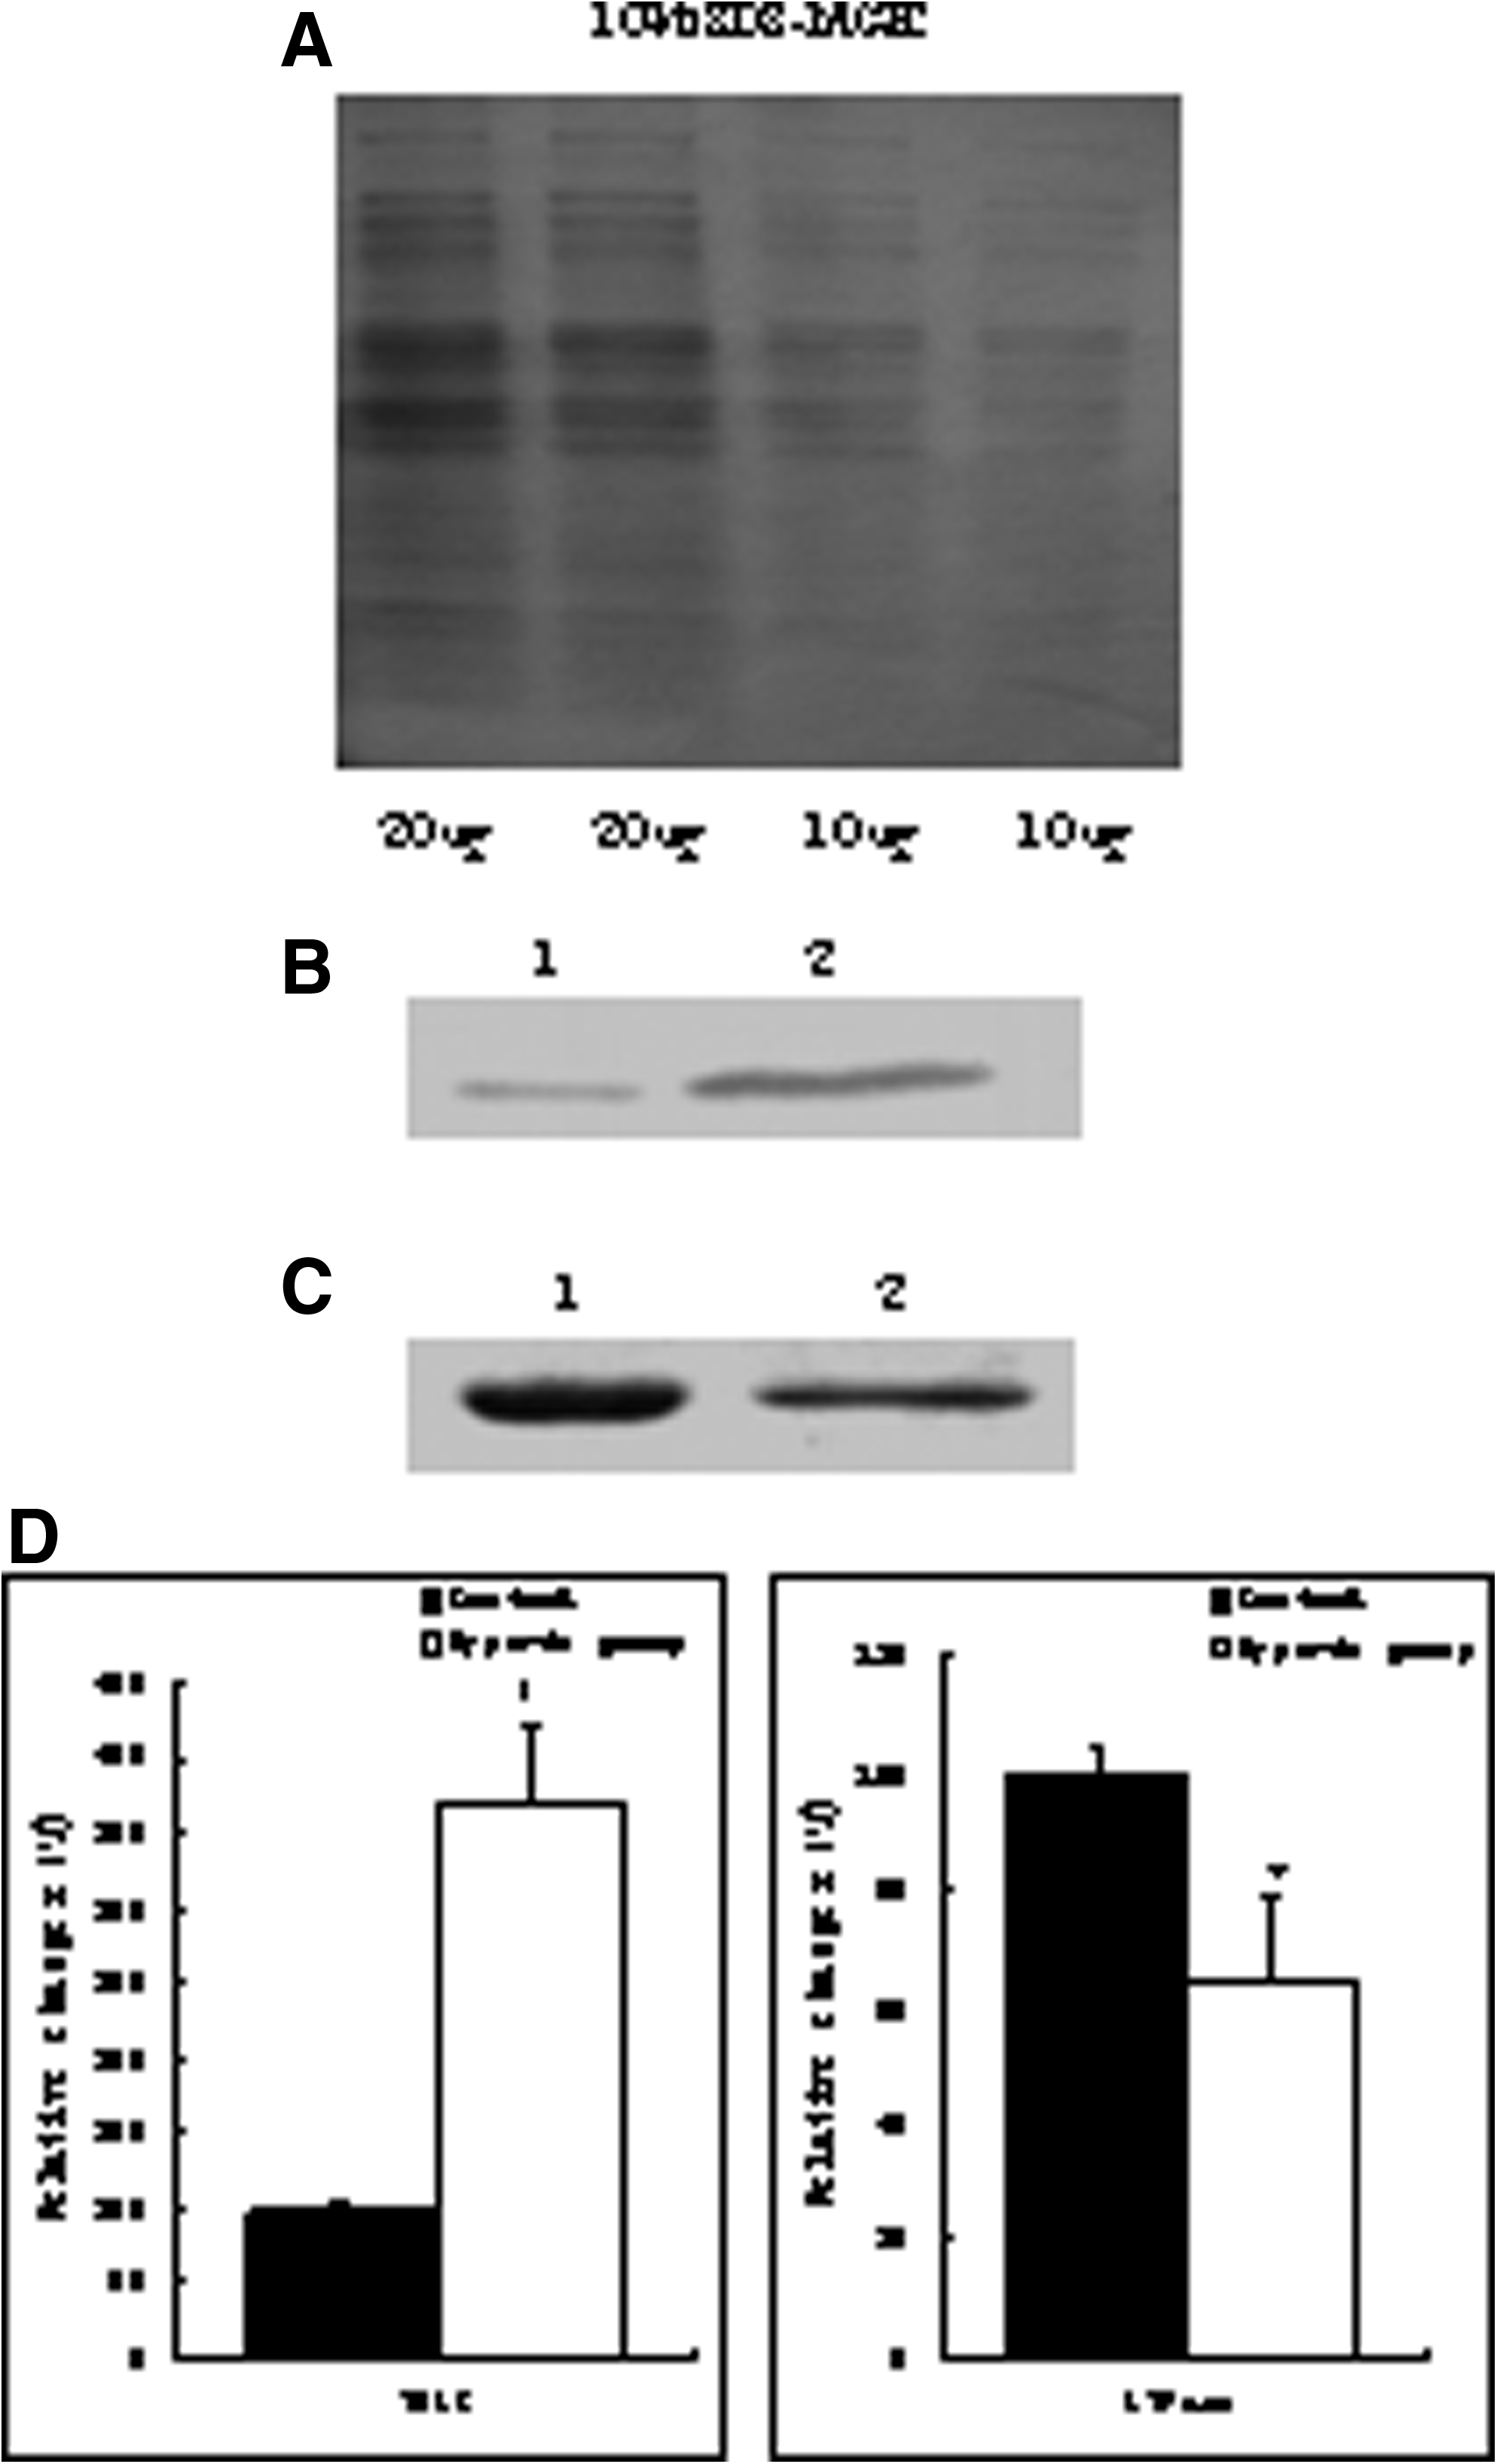
Western blotting analysis data of VDAC and ATP synthase α-subunit. (
ATP synthase and mitochondrial oxygen consumption
Gastrocnemius mitochondria were assessed for respiratory function in the presence of glutamate and malate as respiratory substrates. Oxygen consumption during State 4 (resting) respiration was not significantly different between hypoxic group and the control. Oxygen consumption during State 3 (ADP stimulated) respiration, as well as the RCR was significantly higher in the control than in hypoxic group (p<0.05) (Table 2).
p<0.05 versus control.
In this study, respiratory function of gastrocnemius mitochondria was monitored in the presence of glutamate and malate as respiratory substrates. Hypoxia inhibited oxygen consumption during State 3 (ADP stimulated) but not State 4 respiration, resulting in a significantly lower RCR. These findings confirmed that oxidative phosphorylation function was decreased in hypoxic mitochondria (Luo et al., 1998).
The ATPase–ATP synthase (F0–F1 complex) functions in the last step of oxidative phosphorylation to regenerate ATP from ADP and Pi (Boyer, 1997). The F1 sector separated from the F0 moiety conserves its ability to hydrolyze ATP. The F1-ATPase subunits are organized in three α–β couples with the γ-subunit deeply anchored in the middle. It contains six nucleotide-binding sites that are located at the interfaces of α- and β-subunits. Three nucleotide-binding sites, mainly located on the α-subunit, are noncatalytic as they pooly exchange their bound nucleotides. The three other nucleotide-binding sites, which are catalytic, are essentially located on the β-subunits. Differential loading of the catalytic sites depends on the structural modification induced by the rotation of the γ-subunit and drives the synthesis or hydrolysis of ATP (Boyer, 1997; Senior et al., 2002). This mechanism is consistent with a large body of evidence showing strong positive cooperativity between the three catalytic sites (Boyer, 1997). On the other hand, modulation of the ATPase activity is driven by the noncatalytic sites as first postulated by Di Pietro et al. (1981) and later demonstrated unequivocally (Jault and Allison, 1994; Jault et al, 1994; Milgrom et al, 1990).
Previous studies found that mitochondrial F0–F1 complex activity as well as ATP production was decreased in hypoxic mitochondrial samples (Luo et al., 1998). In the present study, we found the α- and γ-subunits (noncatalytic subunits) other than the β-subunit (catalytic subunit) were up- or downregulated in chronic hypoxic samples, suggesting that the regulation subunits rather than the catalytic subunits of F1-ATPase are responsible to hypoxia stimulation. Intriguingly, three different protein spots of F1 ATP synthase α-subunit had been found differently expressed in hypoxic group mitochondria, of which two were downregulated and one upregulated. It was found that the α-subunit of Atpase was downregulated by hypoxia through Western blot analysis, corresponding to one of the three spots (spot 1) on the 2D gel. We postulate that the other two protein spots may reflect two kinds of protein structure of α-subunits, of which different structural modification was induced in order to bind to the corresponding β-subunit, respectively. Changes of the noncatalytic subunits, including decrease of α- and β-subunit protein levels and a changed ratio of three different kinds of structures of the α-subunit, may be key factors of the negative modulation of the ATPase activity responsible to hypoxia stimulation.
VDAC and mitochondrial transmembrane potential
VDAC is a highly conserved mitochondrial outer membrane protein. Regulations of mitochondrial oxidative phosphorylation induces changes in mitochondrial transmembrane potential, which affects fuctions of VDAC. Mitochondrial transmembrane potential was significantly higher in the hypoxic group than in the control (p<0.05) (Table 3).
p<0.05 versus control.
A global sealing to metabolite exchange occurs in mitochondria during anoxia (Aw et al., 1987a, 1987b). VDAC proteins are involved in the regulation of cellular metabolism with a higher level of production reported in hypoxic neuronal cells (Shinohara et al, 2000). In hypoxic cells, reactive oxygen, and nitrogen species, cytokines, kinase cascades, and increased NADH (Imahashi et al., 2004; Lee et al., 1994) act to inhibit VDAC and block the exchanges of oxidative phosphorylation substrate and products, which thus lead to suppression of mitochondrial function. In this study, VDAC protein expression was significantly increased in skeletal muscles of rats after 30 days of hypoxic exposure. Upregulated of VDAC protein in chronic hypoxic rats could compensate the blocking of VDAC and permit substrate exchanges across OMM.
In the present study, the mitochondrial transmembrane potential was elevated in the hypoxic group, accompanying with the increase of VDAC protein expression. The elevation of membrane potential was apparently a result of overexpression of VDAC in hypoxic mitochondria. However, it remains obscure whether the elevation of mitochondrial potential would subsequently cause nonspecific permeabilization of mitochondrial inner membrane and mitochondrial permeability.
Footnotes
Acknowledgments
This work was supported by Nature Science Foundation of China (No. 30300123; No. 81071610) and the Major State Basic Research Development Program of China (No. 2012CB518201). We thank Professor Xueming Zhang, Professor Gensuo Yang, Dr. Hongli Wang, and Dr. BingYu Liu from the National Center of Biomedical Analysis for their excellent dedication in 2-DE and MULDI-TOF analysis. We thank Dr. Zhaowen Wang for critical reading and help for manuscript preparation.

Author Disclosure Statement
The authors declare that no conflicting financial interests exist.
References
Supplementary Material
Please find the following supplemental material available below.
For Open Access articles published under a Creative Commons License, all supplemental material carries the same license as the article it is associated with.
For non-Open Access articles published, all supplemental material carries a non-exclusive license, and permission requests for re-use of supplemental material or any part of supplemental material shall be sent directly to the copyright owner as specified in the copyright notice associated with the article.
