
Abstract
Abstract
Aging is characterized by the interlocking decay of biological functions over time. Microarrays have been successful in elucidating some of the genome-wide changes that occur with age. Using the AGEMAP dataset that catalogs changes in gene expression as a function of age in 16 tissues in mice, we identified tissue-specific aging genes. Coordinated aging processes across different tissues then were clarified in crosstissue coexpression networks on both the gene and pathway levels. Our findings provide more concrete information about coordinated aging across different tissues. By bridging gene-level and tissue-level research, this study could help identify targets for attenuation of critical aging-related genes, pathways, or networks for antiaging intervention.
Introduction
Network analysis is a powerful tool for identifying phenotype-related changes and potentially predicting disease outcome (Chuang et al., 2007; Huang et al., 2009a, 2010a, 2011a, 2011c; Taylor et al., 2009). The network can provide a more comprehensive and robust characterization of aging than physiological variables or gene expression alone. Previous studies have developed modular networks of aging (Xue et al., 2007). Given that aging represents systematic degeneration throughout the body and that gene expression profiles of different tissues are highly specific (Liu et al., 2008), however, no single static network can represent the dynamic aging process in all tissues. To address this problem, tissue-specific dynamic networks first must be constructed, followed by crosstissue integration of networks.
In this study, we identified tissue-specific aging genes in 16 mouse tissues (cerebellum, cerebrum, striatum, hippocampus, spinal cord, adrenal glands, heart, lung, liver, kidney, muscle, spleen, thymus, bone marrow, eye, and gonads). Coordinated aging among different tissues was clarified in cross tissue coexpression networks on both the gene and pathway levels. The relationships among tissues also were investigated and compared with existing aging theories or hypotheses.
Material and Methods
Data sets
The gene expression profiles used in this work are from NIA/NIH AGEMAP (Zahn et al., 2007) (http://www.ncbi.nlm.nih.gov/geo/query/acc.cgi?acc=GSE9909), a gene expression database for aging in mice. AGEMAP includes 1,248 microarrays (NIA Mouse 17K_A and NIA Mouse 17K_B) which represent 624 unique samples (one sample has both NIA Mouse 17K_A and NIA Mouse 17K_B microarrays). To each sample, gene expression levels for 16,896 probes corresponding to 8,932 genes in 16 tissues of C57BL/6 mice, taken over four age groups during the life of mouse were measured. The four age groups were: (1) younger than 90 days, (2) older than 90 days but younger than 270 days, (3) older than 270 days but younger than 540 days, and (4) older than 540 days. Generally speaking, in each age and tissue group, there were 10 mice, although some groups had 7, 8, or 9 mice. The 16 measured tissues included cerebellum, cerebrum, striatum, hippocampus, spinal cord, adrenal glands, heart, lung, liver, kidney, muscle, spleen, thymus, bone marrow, eye, and gonads. We downloaded 68 mouse aging genes from GenAge (de Magalhaes and Toussaint, 2004), a curated database of genes related to aging, as a complementary source of aging-related genes in each tissue.
Identification of aging genes in each tissue
To identify tissue-specific aging genes, the maximum relevance, minimum redundancy (mRMR) method (Peng et al., 2005) was used to select them in each of 16 mouse tissues. The goal of mRMR is to select the feature subset that can best characterize the statistical properties of a target classification variable, with the constraints that these features are mutually as dissimilar as possible to each other but marginally as similar as possible to the classification variable. During the mRMR step, the genome-wide gene expression levels of each mouse were considered as the initial feature set to discriminate the mouse samples belonging to four age-specific groups. We then sorted these features according to their importance to the age-group prediction, but we still did not know how many features in each list should be selected as the subset best characterizing the classification variable. The incremental feature selection (IFS) procedure (Huang et al., 2009b, 2010b) was applied to optimize aging-related genes in each tissue. In this step, the subset features were selected by testing all possible feature sets and choosing the feature set that achieved the best prediction accuracy. To evaluate prediction accuracies using different numbers of features, we used jackknife crossvalidation. In this crossvalidation test, we employed a nearest neighbor algorithm (NNA) (Huang et al., 2009b, 2010b) to classify each sample into one of the four age groups. NNA allocates a new sample into a category by comparing the features of this sample with the features of those with known categories.
Construction of crosstissue coexpression aging network
The five tissues that were not measured in every mouse were excluded here. The gene expression profiles of 11 tissues (thymus, cerebral cortex, hippocampus, spinal cord, striatum, adrenals, eye, kidney, lung, skeletal muscle, and spleen), which every mouse had were used to construct the crosstissue coexpression aging network. The number of tissue–tissue pairs was 55. In each tissue–tissue pair, we calculated the Pearson correlation coefficients between the aging genes in one tissue and the other tissue. Overall, there were 561,388 intertissue gene pairs. The correlation coefficients of intertissue gene pairs were features and the age groups were considered as the samples. Then, mRMR method was applied to select the intertissue coexpression gene pairs. Next, these gene pairs were ranked according their mRMR score. The top 10,000 crosstissue gene pairs formed the crosstissue coexpression aging network.
Minimum redundancy maximum relevance feature selection
Minimum-Redundancy–Maximum-Relevance (mRMR) (Peng et al., 2005) is a widely used method for feature selection (Cai et al., 2011; Huang et al., 2010c, 2011b, 2011c). The mRMR program we used was downloaded from http://penglab.janelia.org/proj/mRMR/.
Prediction model
With the features selected by mRMR, the NNA (Friedman et al., 1975) is used to classify the samples into the above mentioned four age categories. We used the cosine similarity to measure the distance between samples (Cai et al., 2011; Huang et al., 2009b, 2010b, 2010c, 2011b; Qian et al., 2006).
Jackknife crossvalidation method
The jackknife crossvalidation method, also known as leave-one-out cross-validation (LOOCV) (Cai et al., 2009; Huang et al., 2008, 2009b; Li et al., 2007) is widely used to evaluate prediction performance. Each sample in the data set is knocked out in turn and tested by the predictor trained by the other samples remaining in the data set. During this process, each sample is used not only for the training, but also for the testing. The prediction accuracy was used to evaluate the performance of predictor:
where Ti and Ni stand for the number of correctly predicted samples and actual samples in class i = {1,2,3,4}.
IFS
mRMR can only provide a list of features by sorting the features according to their importance to the prediction, but it is still unknown how many fore features in the list should be selected. The best fore features are selected by testing all possible top feature sets, and choosing the feature set that can achieve the best prediction accuracy (Cai et al., 2011; Huang et al., 2009b, 2010b, 2010c, 2011b, 2011c). The possible feature subset Si can be expressed using the following equation:
The initial feature subset is S1 = {f1}, and the last feature subset is
Results
Tissue-Specific Aging Genes Identified by mRMR and IFS
To identify these tissue-specific aging genes, mRMR and IFS method (Peng et al., 2005) was used to select them in each of 16 mouse tissues. Figure 1 shows the number of selected aging genes by IFS in each tissue. The shading line bar indicates the number of aging genes selected by IFS. The gray bar represents the prediction accuracy achieved with the selected aging genes. Supplementary Table S1 gives the prediction accuracy (ACC), sensitivity (Sn), specificity (Sp), and Sn/(1 − Sp) of each group. As shown in Figure 1, given the small number of genes in the eye, almost all samples can be correctly assigned to their age group. This may imply that the eye may be a model tissue for aging studies. In fact, previous studies have found that the retina in mice genetically altered to develop Alzheimer's disease undergo changes similar to those that occur in the brain, suggesting that the eye is a potential gateway to quicker diagnosis of Alzheimer's (Liu et al., 2009). We combined our selected aging genes with the 68 genes from GenAge (de Magalhaes and Toussaint, 2004) to yield the full list of aging genes in each tissue.

The aging genes selected by mRMR and IFS. In each tissue, the shading line bar indicates the number of aging genes that were selected by mRMR and IFS procedure. The gray bar represents the prediction accuracy with the selected aging genes evaluated by leave-one-out crossvalidation (LOOCV).
Crosstissue coexpression aging network
Aging is a particularly complex physiological process that at least partially involves perturbations to gene–networks connecting different tissues, resulting in a systems-level imbalance. To provide an intertissue view of aging with respect to molecular states that are associated with physiological states, we constructed crosstissue coexpression networks of aging with top 10,000 intertissue aging gene pairs. By calculating the number of shared Gene Ontology (GO) terms of each intertissue gene pair, we found that 4,114 of 10,000 intertissue aging gene pairs shared at least one same GO term. This means that almost half of the intertissue gene pairs already had biological basis.
The 10,000 intertissue gene pairs belonged to six tissue–tissue pairs, which are shown in Figure 2. There were two patterns in the tissue–tissue pairs of aging. Figure 3 depicts these two patterns. One pattern (Fig. 3A) reveals the cerebral cortex's aging affects lung, skeletal muscle, and spleen's aging; the other (Fig. 3B) shows that the hippocampus's aging affects the aging of the spinal cord and, furthermore, that the aging of the spinal cord affects the spleen's aging.
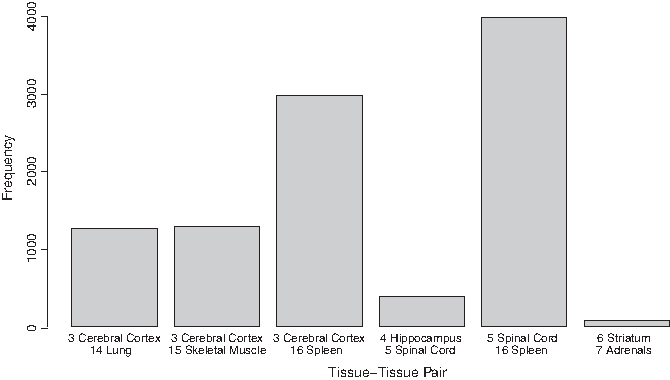
The intertissue aging gene pairs selected by mRMR. The top 10,000 intertissue aging gene pairs belonged to six tissue–tissue pairs.

The two patterns in the tissue–tissue pairs of aging. One pattern (
Crosstissue pathway interaction networks of aging
To investigate the intertissue pathway-to-pathway crosstalk, we constructed the crosstissue pathway interaction networks of aging. To each tissue–tissue pair, the genes of each tissue in top 10,000 intertissue aging gene pairs were enriched to KEGG pathways. Then the number of intertissue aging gene pairs between one KEGG pathway in one tissue and the other KEGG pathway in the other tissue was used as the connectivity of two pathways among two tissues. Figure 4 shows the pathway interaction networks of aging between spinal cord-spleen (Fig. 4A), cerebral cortex–spleen (Fig. 4B), cerebral cortex–skeletal muscle (Fig. 4C), hippocampus–spinal cord (Fig. 4D), cerebral cortex–lung (Fig. 4E), and striatum–adrenals (Fig. 4F). A darker red edge indicates stronger connectivity, and the lighter blue edge indicates weaker connectivity. The results suggest that the cell cycle among different tissues may be synchronized by intertissue pathway-to-pathway crosstalk. Such crosstissue communication could be achieved by secreted protein in body fluid (Ahn and Simpson, 2007). Interestingly, the p53 signaling pathway, insulin signaling pathway, and transforming growth factor (TGF)-beta signaling pathway may also have crosstalk between different tissues. Signal transduction plays an important role in homeostasis and senescence.

The crosstissue pathway interaction networks of aging. The pathway interaction networks of aging between the spinal cord–spleen (
Discussion
Functions of tissue-specific aging genes
The GO functions of aging genes in each tissue (before combining the 68 genes from GenAge) were investigated by enrichment analysis based on hypergeometric test (Huang et al., 2010b). The aging genes in the thymus were enriched in GO biological process terms such as GO:0010149 (senescence), GO:0010260 (organ senescence), GO:0001306 (age-dependent response to oxidative stress), and GO:0007571 (age-dependent general metabolic decline), terms clearly related to aging. In several tissues, including the cerebellum and cerebral cortex, the aging genes were enriched in cell cycle, DNA damage, and apoptosis-related terms. Cell cycle is the cellular life span and can affect organismic longevity. According to the DNA damage theory of aging, aging is a consequence of an accumulation of unrepaired DNA damage. Nuclear DNA damage may contribute to aging either directly (by increasing cell dysfunction) or indirectly (by increasing apoptosis or cellular senescence) (Best, 2009). Some aging genes clearly have tissue-specific functions. In the eye, the aging genes were enriched in GO:0005212 (structural constituent of eye lens), GO:0001654 (eye development), GO:0070307 (lens fiber cell development), GO:0070309 (lens fiber cell morphogenesis), GO:0007423 (sensory organ development), and GO:0043010 (camera-type eye development). Aging genes in neural tissues such as the cerebellum and hippocampus were enriched in GO terms such as GO:0043525 (positive regulation of neuron apoptosis), GO:0014032 (neural crest cell development), GO:0014033 (neural crest cell differentiation), GO:0048665 (neuron fate specification), GO:0021915 (neural tube development), and GO:0021675 (nerve development).
The biological meanings of crosstissue coexpression aging network
It was found that 4,114 of 10,000 gene pairs in crosstissue coexpression aging network shared at least one same GO term. For instance, the correlation of Ercc2 in spinal cord and Polg in spleen was changing with aging and they shared three GO terms including GO:0003677 (DNA binding), GO:0000287 (magnesium ion binding), and GO:0007568 (aging). It has been reported that DNA deletions and clonal mutations in PolgA protein drive premature aging (Vermulst et al., 2008) and that in Polg mutant knock-in mice a causative link exists between mtDNA mutations and aging phenotypes (Trifunovic et al., 2004). It is possible the expression of Polg in the spleen is regulated by the expression of Ercc2 in spinal cord, with this regulation changing with time. The results may even help people understand the related biological process of aging. Except for the term GO:0007568 (aging), Ercc2 and Polg shared GO:0000287 (magnesium ion binding). Magnesium deficiency is associated with increased risk for many age-related diseases. Human cells in a magnesium-deficient environment age faster. It was reported that one of the effects of insufficient magnesium levels on cellular aging is increased oxidative stress, leading to accelerated rates of damage to telomeres that protect chromosomes from destruction and are thought to control a cell's life span (Killilea and Ames, 2008).
Our findings of tissue–tissue coordinated aging are consistent with the neuroendocrine immune system theory of aging (Arking, 2006). In this theory, the nervous, endocrine, and immune systems are integrated in a single neuroendocrine immune system in the sense that each of them affects the proper functioning of the others. Our findings confirm that the age-related immune dysfunction is not intrinsic to the immune cells but arises as a result of age-related defects in other neuroendocrine functions. The potential for effective antiaging interventions may be larger than was previously suspected.
The results of the second tissue–tissue coordination pattern suggest that the aging of hippocampus caused some kind of cascade of aging in other tissue. The hippocampus plays an important role in memory and other cognitive abilities (Arking, 2006).
Conclusions
To gain insights about possible connections in aging from gene level to tissue level, we constructed the tissue specific gene networks of aging. Moreover, we clarified the aging-related intertissue gene/pathway relationship and tissue–tissue relationship that had been observed for a long time by physiologist but not be validated on molecule level. This work is a bridge of gene level study and tissue level study. Our method may be applied on other similar biology problems that involve changes in tissue along with time, such as cell differentiation, development, and tumor metastasis.
Footnotes
Acknowledgments
The authors acknowledge Lynne Berry and Yvonne Poindexter from the Vanderbilt University Cancer Biostatistics Center for their editing. This work was supported by grants from National Natural Science Foundation of China (Grant No. 31070752) and National Basic Research Program of China (2011CB510102, 2011CB510101).
Author Disclosure Statement
The authors declare that no conflicting financial interests exist.
References
Supplementary Material
Please find the following supplemental material available below.
For Open Access articles published under a Creative Commons License, all supplemental material carries the same license as the article it is associated with.
For non-Open Access articles published, all supplemental material carries a non-exclusive license, and permission requests for re-use of supplemental material or any part of supplemental material shall be sent directly to the copyright owner as specified in the copyright notice associated with the article.