
Abstract
Abstract
Metabolomics is a rapidly emerging tool for studying and optimizing both media and bioprocess development for culturing recombinant mammalian cells that are used in protein production processes. Quenching of the cells is crucial to fix their metabolic status at the time of sampling. Three precooled quenching solutions were tested for their ability to fix the metabolic activity of CHO cells: phosphate-buffered saline (PBS) (pH 7.4; 0.5°C), 60% methanol with 70 mM HEPES (pH 7.4; −20°C), and 60% methanol with 0.85% (w/v) ammonium bicarbonate (AMBIC) (pH 7.4; −20°C). The metabolic activity of the sampled CHO cells was assessed by determining the intracellular levels of ATP using a bioluminescence assay and selected metabolites with LC-MS/MS. We found the precooled PBS (pH 7.4; 0.5°C) to be the optimal quenching reagent for fixing intracellular metabolism. Importantly, the structural integrity of the cell membrane was maintained and highest yields were obtained for intracellular levels of ATP as well as for 18 out of 28 intracellular metabolites. In contrast to the previously reported studies, buffered methanol quenching was not applicable for suspension cultured CHO cells as cellular membrane integrity was affected. We recommend that the cells are quenched and washed simultaneously to keep the sampling time to a minimum and to prevent any further metabolic activity in the cells. We observed that additional washing steps are not required. Our analyses suggest that methanol as quenching solution, even in combination with a buffer substance, appears not suitable for quenching sensitive mammalian cells. The protocol we report herein is a simple cell sampling method that enables high-throughput metabolomic analyses and is suitable for a large number of samples.
Introduction
Although CHO cells are widely used as host cells for recombinant protein production, the effects of bioreactor cultivation on intracellular metabolism, protein processing, and production are poorly understood. Therefore, an investigation into the metabolom of CHO cells might lead to a better understanding of how the cells respond to changes in media, process conditions, and protein production (Omasa et al., 2010).
Notably, metabolomics has rarely been applied to mammalian cell culture and bioprocess development (Khoo and Al-Rubeai, 2007, 2009; Oldiges et al., 2007). Moreover, only a few studies have looked at quenching mammalian cell metabolism—the important first step when assessing the effects of various experimental treatments (Dietmair et al., 2010; Oldiges et al., 2007; Sellick et al., Volmer et al., 2009, 2011; Wiendahl et al., 2007). Indeed, more attention has been paid to the subsequent extraction and analyses (Dietmair et al., 2010; Ritter et al., 2008), rather than ensuring that the metabolic profile is correct and not a sampling artifact.
A critical requirement for metabolomics is the rapid fixing of enzymatic activities, preferably with a simple one-step procedure. Furthermore, the cellular integrity must be preserved to prevent uncontrolled leakage of enzymes, which can alter the metabolic profile. Different strategies have been proposed, usually based on rapid changes in pH or temperature (Álvarez-Sánchez et al., 2010). Although several authors have emphasized the importance of harvesting the cells rapidly with all the advantages and drawbacks of cell preparation, no standardized method is currently available (Álvarez-Sánchez et al., 2010; Khoo and Al-Rubeai, 2007; Sellick et al., 2009; Teng et al., 2009). Hence, the comparison and interpretation of published metabolomics data can be fraught with experimental artifacts.
In the literature, mostly, chilling of cells on ice or using precooled solutions, which should neither change the characteristics of the metabolites of interest nor interact with subsequent analyses, is described (Dietmair et al., 2010; Grammatikos et al., 1999; Oldiges et al., 2007; Sellick et al., 2009). For mammalian cells in suspension, Wiendahl et al. (2007) investigated the use of a microstructure heat exchanger directly connected to a bioreactor in order to avoid inhomogeneously cooled samples and to stop the metabolism at a subsecond scale time. Volmer et al. (2011) recently reported the application of a fast filtration method, which showed higher quenching efficiency, mainly due to improved overall sampling time, compared to the microstructure heat exchanger method and centrifugation at low temperature. However, it is not possible to definitely rank available methods due to inconsistent findings in literature. Within bioprocess development, mainly cell line, clone, media, or process comparisons are of interest, for which the analysis of metabolite profiles throughout the cultivation is required. This results in a high number of samples that have to be processed simultaneously. Therefore, a procedure not needing special equipment, which can be performed routinely with standard laboratory equipment with many samples in parallel, would be an advantage. Therefore, our study characterizes the effect of three different quenching solutions for mammalian cells successfully applied in previously published studies. Sellick et al. (2009, 2011) demonstrated that 60% methanol with 0.85% (w/v) AMBIC showed best results regarding metabolite recovery, leakage, and metabolic stopping for suspension cultured mammalian cells. Moreover, Sengupta et al. (2011) and Ritter et al. (2008) used 60% methanol and 70 mM HEPES as quenching solution for CHO cells and subsequent intracellular metabolite quantification. Methanol solutions enable lower quenching temperatures and buffer supplementation avoids potential damage of cellular membranes (Bolten et al., 2007; Faijes et al., 2007; Sellick et al., 2009).
Our approach described herein, comparing these three solutions for CHO cells, is goal-oriented to define the optimized quenching procedure not requiring special equipment and thus being suitable for high-throughput analysis of a large amount of samples.
Material and Methods
Cell line and cultivation conditions
Recombinant CHO cells, transfected via nucleofection with an expression vector coding for a recombinant protein, were cultivated in fed batch mode. Proprietary chemically defined MTX-free in-house medium was used. The initial seed density was between 4.0×10⁵ and 4.5×10⁵ viable cells/mL. The culture temperature was set at 36.5°C (pH 6.9, 40% pO2).
To avoid depletion of glucose and glutamine throughout cultivation, these metabolites were routinely monitored with a NOVA BioProfile100 Plus (Nova Biomedical, Waltham, MA, USA); their concentrations were maintained between 3.5 and 5.0 g/L for glucose and 2.5 and 4.0 mM for glutamine. Cell counts and viability were monitored with a Vi-Cell™ XR Cell Viability Analyzer (Beckman Coulter, Brea, CA, USA). Samples for further analysis described below were taken from fed-batch cultivations at a cell viability ≥90%, unless otherwise mentioned.
Sampling and quenching
The cells were rapidly quenched by the addition of a fivefold volume of precooled quenching solution to 5×10⁶ viable cells. The quenching solutions to be tested were PBS (pH 7.4; 0.5°C) (Q1), 60% methanol with 70 mM HEPES (pH 7.4; −20°C) (Q2), and 60% methanol with 0.85 (w/v) ammonium bicarbonate (AMBIC; pH 7.4; −20°C) (Q3).
The quenched cells were centrifuged at 1,000×g for 60 s at 0°C to separate cells and medium. A short centrifugation time was used in order to minimize exposure of cells to the methanol in the quenching solutions Q2 and Q3. The control cells were centrifuged without any quenching treatment. After centrifugation, complete removal of the liquid phase is mandatory. Throughout the whole procedure the sample tubes and all reagents were cooled using ice baths or cooling blocks. The temperature of the quenched samples was kept below 1°C. Where specified, additional washing steps were performed: the cell pellets were resuspended in 1 mL PBS (0.5°C) and centrifuged as described above. Finally, the cell pellets were shock-frozen in liquid nitrogen and stored at −70°C until extraction for subsequent analysis (maximum of 2 days for ATP determination and <2 months for all other intracellular metabolites), unless otherwise mentioned.
Determination of membrane integrity
Cooling, centrifugation, or quenching itself can potentially damage labile mammalian cell membranes and thus leads to uncontrolled leakage as well as changes of the metabolic profile. Therefore, membrane integrity was determined using (1) trypan blue staining and (2) a nexin assay. The impact of quenching solutions and the influence of different centrifugation conditions were evaluated (1,000×g/1 min, 1,000×g/3 min, 1,500×g/1 min, and 2,000×g/1 min).
Quenched cell pellets were immediately resuspended in fresh medium at room temperature followed by direct Vi-Cell measurement (Vi-Cell™ XR Cell Viability Analyzer; Beckman Coulter, Brea, CA, USA) or required sample preparation according to the Guava Nexin Assay manual. For the apoptosis assay from Guava Technologies (Millipore Cooperation, Hayward, CA, USA) using microcapillary flow-cytometry additionally, parallel Vi-Cell™ measurements were performed in order to directly compare obtained viability results. In addition to technical replicates, each plate well was analyzed three times with 2,000 cell counts each time.
ATP determination
For the determination of ATP concentration the ATP Bioluminescence Assay KIT CLSII (Roche Diagnostics, Mannheim, Germany) was used. The optimal detection range between 10−7 to 10−10 M ATP was best for the estimated amount of about 50 nmol intracellular ATP for 5×10⁶ cells (Lu et al., 2005; Sellick et al., 2009).
ATP extraction was performed by adding 1 mL of boiling lysis buffer (100 mM Tris, 4 mM EDTA) to the frozen cell pellets. Afterward, the cells were resuspended and centrifuged (1,000×g, 60 s). Supernatants were transferred into a fresh tube and stored on ice until measured. 50 μL of undiluted samples or standards were pipetted into black 96-well plates (Nalgene Nunc, Rochester, NY, USA). A volume of 50 μL enzyme solution was added to each well and after 30 s of shaking, the plate was measured by a luminometer (SPECTRAmax M2, Molecular Devices, Sunnyvale, CA, USA) at 562 nm with 30 readings/well.
Calibration by a serial dilution of ATP standard in ultrapure water was performed for each analysis separately.
Extracellular ATP concentrations were below the limit of detection (LOQ=10−11 M ATP). Supernatants could not be analyzed.
LDH activity determination
The determination of lactate dehydrogenase (LDH) was carried out based on the LDH-OPTIMIZED-KIT (Sigma Diagnostics, St. Louis, MO USA). Frozen cell pellets (stored at 2–8°C for a maximum of one week) were resuspended in 1 mL of a solution of 0.9% NaCl and 0.1% Triton X-100 and stirred with a magnetic stirrer for 30 min at room temperature to lyse the cells and to extract LDH. Afterwards, the solution was centrifuged at 15,000×g for 5 min, the supernatant was decanted, sterile filtered (0.2 μm), and used for measurement. A total of 625 μL of LDH reagent solution and 25 μL of the sample or standard were mixed by inversion (three to five times) in a cuvette and incubated for 30 s. Immediately afterwards absorbance reading at 340 nm was started. Kinetic of LDH activity over a period of 4 min with an reading interval of 20 s was measured using the SPEKTRAmax M2 (Molecular Devices, Sunnyvale, CA, USA). Calibration by a serial dilution of LDH standard (Sigma Aldrich, St. Louis, MO, USA) in 0.9% NaCl and 0.1% Triton X-100 was performed for each analysis separately. Within this study the LDH concentration was analyzed for quenched and extracted cell pellets. Cell lysis was performed on the day of measurement using a Triton X-100 solution as mentioned above.
Targeted metabolomics of intracellular metabolites
One representative fed-batch cultivation was sampled at three time points throughout cultivation (5, 10, and 13 days after inoculation). Cell viability was above 90% on day 5 and 10; on day 13 cell viability was 77.3%. At each sampling, all three quenching solutions [PBS (Q1), 60% methanol with 70 mM HEPES (Q2), and 60% methanol with 0.85% (w/v) AMBIC (Q3)] were tested in triplicates. After shock freezing in liquid nitrogen, samples were stored at −70°C.
Intracellular levels of metabolites for intermediates of energy metabolism, amino acids as well as biogenic amines were measured at BIOCRATES Life Sciences AG, Innsbruck, Austria. For extraction, frozen cell pellets (5×10⁶ viable cells) were resuspended in 75 μL ice-cold phosphate buffer (10 mM, pH 6.8) and subjected to sonication for 3 min on ice (RK514BH, Merck, Darmstadt, Germany). Samples were then frozen in liquid nitrogen followed by thawing during sonication. The freeze/thaw procedure was repeated to result in three freeze/thaw cycles. Samples were centrifuged at 17,900×g for 5 min at 4°C, and the resulting supernatants were applied to the respective assays, as described in detail elsewhere (Urban et al., 2010). For the quantification of amino acids, hexose (mainly glucose), and biogenic amines, briefly, the commercially available KIT plates (Biocrates, Life Science, Innsbruck, Austria) were used. The fully automated assay was based on PITC (phenylisothiocyanate)-derivatization in the presence of internal standards followed by LC-MS/MS detection using a AB SCIEX 4000 QTrap™ mass spectrometer (AB Sciex, Darmstadt, Germany) with electrospray ionization. The experimental metabolomics measurement technique is described in detail by patent application US 2007/0004044 (accessible online at freepatentsonline.com, 2007).
For the quantitative analysis of energy metabolism intermediates (glycolysis, citrate cycle, pentose phosphate pathway, urea cycle), a hydrophilic interaction liquid chromatography (HILIC)-ESI-MS/MS method in highly selective negative multiple reaction monitoring (MRM) detection mode was used. The MRM detection was performed using an ABSciex 4000 QTrap™ tandem mass spectrometry instrument (ABSciex, Darmstadt, Germany).
Samples were extracted and protein precipitated simultaneously using aqueous methanol in a 96-well plate format. Stably isotop-labeled internal standards, which compensated matrix suppression effects by enabling the calculation of concentration ratios between analytes and internal standards, and external calibration were used for highly accurate quantification. Samples were randomized on the plate prior to analysis to avoid potential confounding interaction between concentration and order of injection. Moreover, intraday variability and plate to plate effects were monitored using natural, nonspiked plasma samples (n=5) on each plate. The precision of the measurements was determined. For analytes detectable in plasma, coefficients of variation are within 15 to 20% range, depending on the concentrations of the individual analyte in plasma.
Information on linear ranges and LOQ of quantified metabolites as well as on intraday variability can be found in supplementary material (Table 1 and Fig. 4).
LC-MS/MS data were quantified with Analyst 1.4.2 software (Applied Biosystems, Darmstadt, Germany). All methods were validated for human plasma considering FDA Guidance for industry—Bioanalytical Method Validation (Food and Drug Administration, 2001).
Data analysis
To compare the data from different days, intracellular metabolite concentrations were normalized to the average of a metabolite concentration within one sampling day, including all three tested sampling procedures. The obtained dataset was analyzed performing a one-way ANOVA including multiple range tests (Fisher's least significant differences).
Results and Discussion
Effect of quenching on membrane integrity
A low cell viability can indicate possible cellular disruption caused by the quenching solutions and/or mechanical stress and is therefore associated with potential, unwanted metabolic leakage. In two independent experiments, we observed a significant decline of cell viability determined by trypan blue staining for both buffered methanol solutions within all replicates (see Supplementary Fig. 1). Similar results were recently reported by Dietmair et al. (2010) using PI-staining. In contrast, quenching cells by the addition of precooled PBS did not influence cell viability. Reference samples and PBS approaches were comparable and equal to the initial cell viability. Thus, the centrifugation step itself and the sudden drop in temperature seems to be not relevant for the change in cell membrane integrity regarding the uptake of trypan blue.
As reported by Álvarez-Sánchez et al. (2010) methanol lowers the freezing point of the sampling buffer and is therefore commonly used as quenching agent. However, because methanol can damage cellular membrane and therefore leads to uncontrolled metabolic leakage, the addition of buffers (e.g., HEPES, AMBIC) to methanol solutions is used to maintain ionic strength and avoid osmotic shock (Bolten and Wittmann, 2008; Faijes et al., 2007; Sellick et al., 2009). Previously published studies reported the successful use of both tested aqueous methanol solutions, buffered with AMBIC or HEPES, as useful quenching solutions for CHO cells (Sellick et al., 2009; Sengupta et al., 2011). Our findings are in contrast to the reported conclusions as we observed a reduced membrane integrity due to buffered methanol treatment. However, the studies mentioned above showed no information regarding cell viability after the quenching treatment. Moreover, different centrifugation settings (1,000×g/1 min, 1,000×g/3 min, 1,500×g/1 min, and 2,000×g/1 min) as well as additional washing steps with precooled PBS (one, two, and three times) to remove residual medium were tested within this study. However, none of the listed settings led to a significant change of viability (see Supplementary Figs. 2 and 3).
The effects of the tested quenching solutions on structural membrane integrity were confirmed using the Guava Nexin Assay which uses 7-aminoactinomycin (7-AAD) as a cell impermeant dye. It was possible to distinguish between living, late-stage apoptotic, necrotic, or dead cells. In addition, this assay can detect early apoptotic cells using Annexin V-PE, which binds to phosphatidylserine (PS) on the external membrane of apoptotic cells.
The increase of double positive cells, which are Annexin V-PE as well as 7-AAD stained and thus considered to be late apoptotic/necrotic, observed for both buffered methanol solutions (see Fig. 1) correlates with the decrease in ViCell viability. Thus, the hypothesis that the uncontrolled metabolic leakage might occur due to disrupted cell membranes is confirmed. Not only early apoptotic cells, which were categorized as “viable” by the Vi-Cell™ XR Cell Viability Analyzer, were affected by methanol treatment, as the increase of the percentage of double positive cells was higher than the decline in Annexin (+) 7-AAD (−) cells as seen in Figure 1.
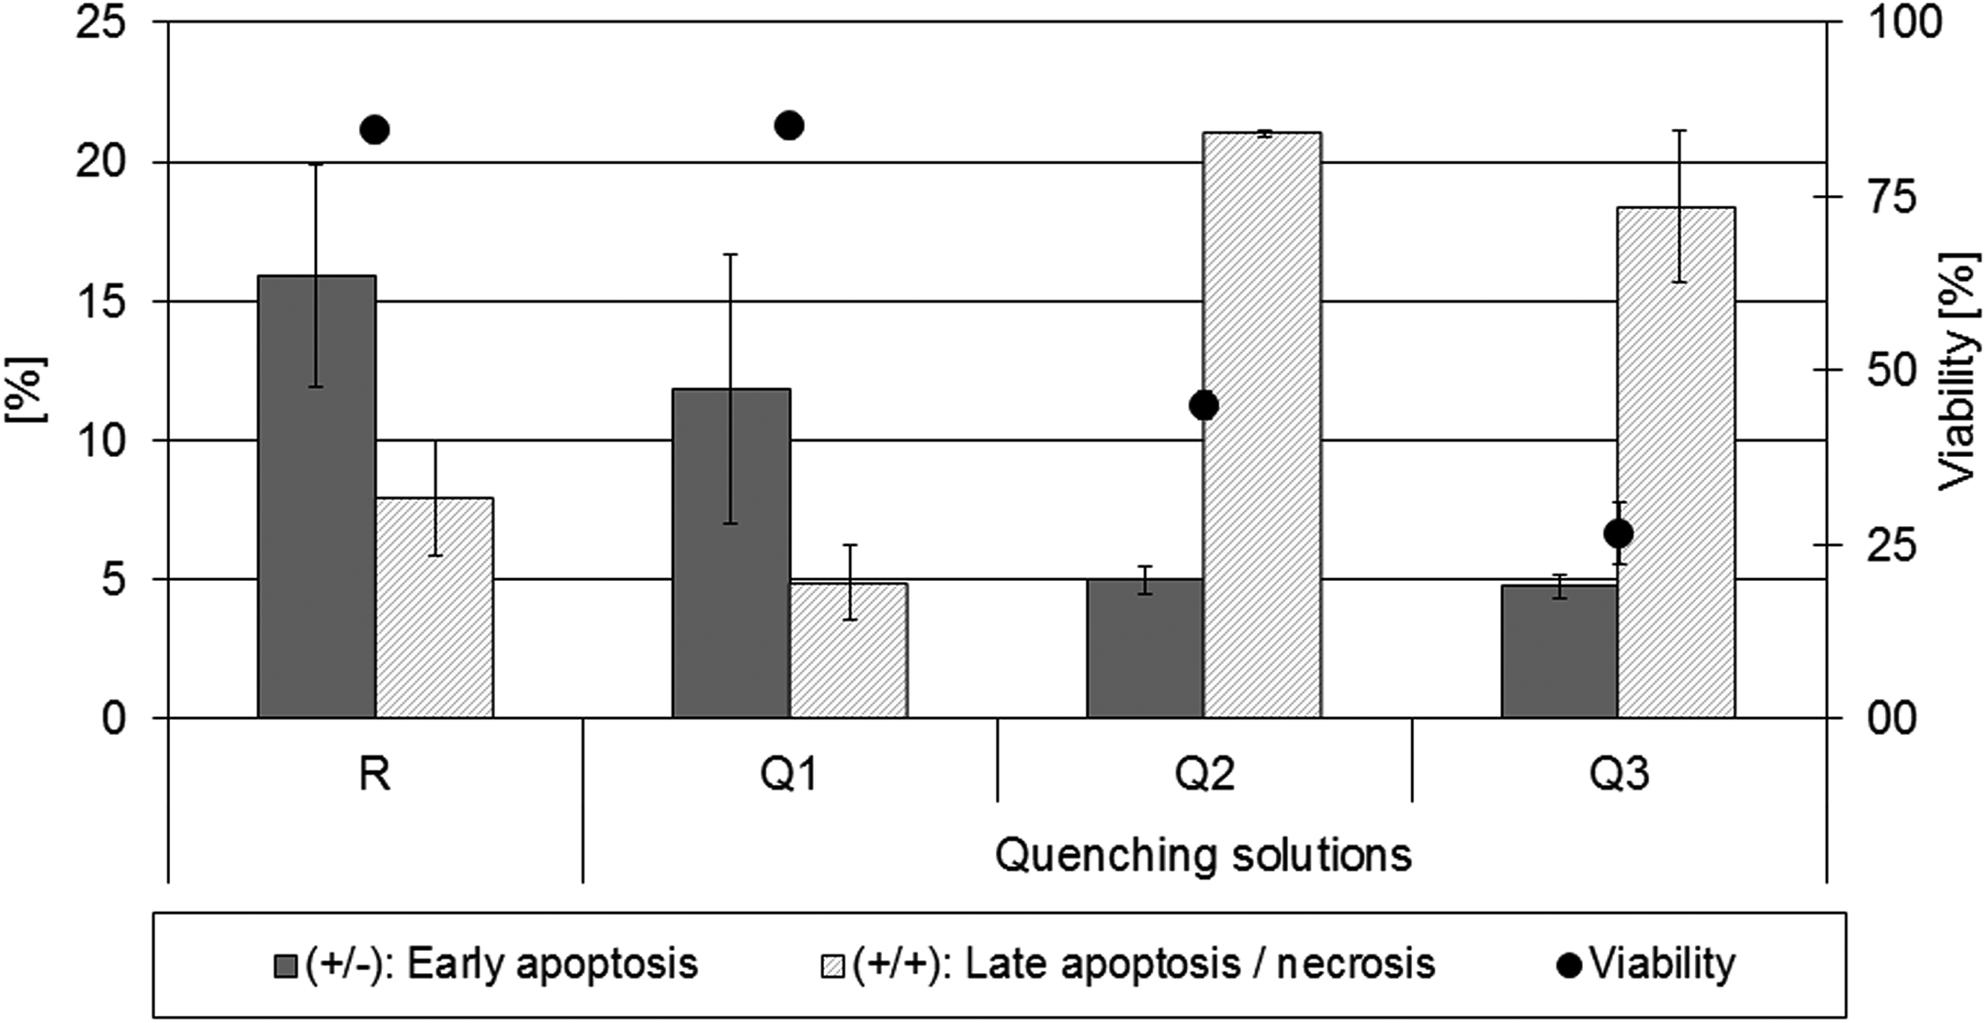
Effects of different quenching solutions on cell membrane integrity. Membrane integrity was determined via Guava Nexin Assay compared to Vi-Cell™ results. R=Reference, Q1=PBS, Q2=MeOH + HEPES, Q3=MeOH + AMBIC. Each sample preparation experiment was tested in replicates (n=3). The individual mean standard deviation for each experiment is shown. The increase of double positive cells (+/+; textured bars) for both buffered methanol approaches as well as the comparability of references and PBS confirm previous Vi-Cell™ results and were verified by parallel Vi-Cell™ measurement of identical samples (black dots represent the means of all three technical replicates). Legend: (+/−): positive for Annexin V-PE, but negative for 7-AAD; (+/+): positive for Annexin V-PE as well as for 7-AAD.
Effect of quenching solutions on intracellular ATP and LDH
ATP is known to be a very sensitive metabolite, because the concentration of ATP can change rapidly due to high turnover rates or environmental stress. Hence, the determination of actual total ATP concentrations in cell pellet extracts can be a characteristic for the efficiency of stopping the metabolic activities within a cell.
The impact of the three different quenching solutions on the intracellular ATP amount, and therefore, on the efficiency of inhibiting metabolic reactions was tested in three replicates. The output is summarized in Figure 2, showing ATP concentrations at diverse quenching procedures in percentages referring to just centrifuged samples. The treatment using methanol with AMBIC (Q3) was the only approach that showed a significant change in comparison to the reference data. Unexpectedly, methanol quenching solutions with a desirable quenching temperature of lower than −20°C were not able to significantly improve the preservation of the intracellular metabolite environment compared to PBS quenching. Because MeOH + HEPES is comparable to the references and PBS quenched approaches, a balance should be found between an improved inhibition of enzymatic reactions and uncontrolled leakage due to cell membrane damage.

Effects of diffferent quenching solutions on intracellular ATP amount that is an indirect indicator for the efficiency of inhibiting metabolic reactions. Bars represent the average of three replicates. Furthermore, the individual mean standard deviation for each experiment is shown. ATP results are illustrated as a fraction of centrifuged samples that showed an intracellular ATP amount of 13 nmol/106 cells. Only AMBIC-buffered methanol shows a significant change: the reduced intracellular ATP amount correlates with lowest viability detected for MeOH + AMBIC as described earlier (see Fig. 1). Q1=PBS, Q2=MeOH + HEPES, Q3=MeOH + AMBIC.
On the one hand, these results confirm recent findings that showed that quenching with AMBIC-buffered methanol yields lower levels of ATP/ADP and increases metabolic leakage (Dietmair et al., 2010; Pabst et al., 2010). On the other hand, contrary data are published as well: Sellick et al. (2009), for example, reported an improved adenylate energy charge for methanol quenching and best results for an AMBIC buffered solution. It should be pointed out, that according to Weibel et al. (1974), the results have to be treated with caution as the present quenching procedures involve delays of several minutes, which will cause drastic changes after cells are removed from their environment. However, in the present study this effect is the same for all approaches/samples, and therefore, differences between the various setups would be detectable.
The determination of intracellular LDH activity was also used to estimate the degree of cell disruption or damage, for example, due to mechanical forces during centrifugation. Normally, LDH only exists intracellularly and the alterations of LDH activity between various sampling settings can reliably indicate a release of the enzyme due to loss of cell integrity. Wiendahl et al. (2007) also applied LDH determination to evaluate potential cell disruption or damage of the sensitive mammalian cells in their studies regarding the implementation of a microstructure heat exchanger for quenching.
No significant differences in intracellular LDH activity between PBS quenched (1.59 U/mL LDH activity) and untreated samples (1.42 U/mL) occurred. As the addition of quenching solutions led to further dilution, extracellular LDH concentrations were below the limit of detection (LOQ=0.1 U/mL LDH activity) and supernatants could not be analyzed.
For approaches testing methanol as quenching solution, LDH determination was not applicable as the methanol might have denaturized the LDH enzyme and therefore the determination reaction was blocked.
Effect of additional washing steps on intracellular ATP and LDH
To remove contaminating extraneous metabolites, especially when working with cultivated mammalian cells, usually at least a single washing step with PBS is required (Moore et al., 1997; Omasa et al., 2010; Ritter et al., 2008; Teng et al., 2009). However, additional washings increase the risk of metabolic leakage (Sellick et al., 2009).
Because our previous results showed that PBS quenching is the most suitable method, additional washing steps were tested in detail for this procedure only. As it is illustrated in Figure 3 for ATP, washing steps will lead to an altered intracellular snapshot. The reason for the observed decrease in ATP might be the conversion of ATP to ADP and AMP due to the increased proceeding time rather than just metabolic leakage. This assumption is supported by the results obtained within preliminary experiments where a controlled delay of the shock freezing step was tested. The quantified intracellular ATP amount was lower after an increased holding time prior to shock freezing. For example, PBS quenched samples showed a decline of 45% of intracellular ATP after 5 min and of 55% after 15 min compared to immediately frozen samples. As expected from known high turnover rates of many metabolites, the influence of the time between sampling itself and the liquid nitrogen step seems to be very crucial.
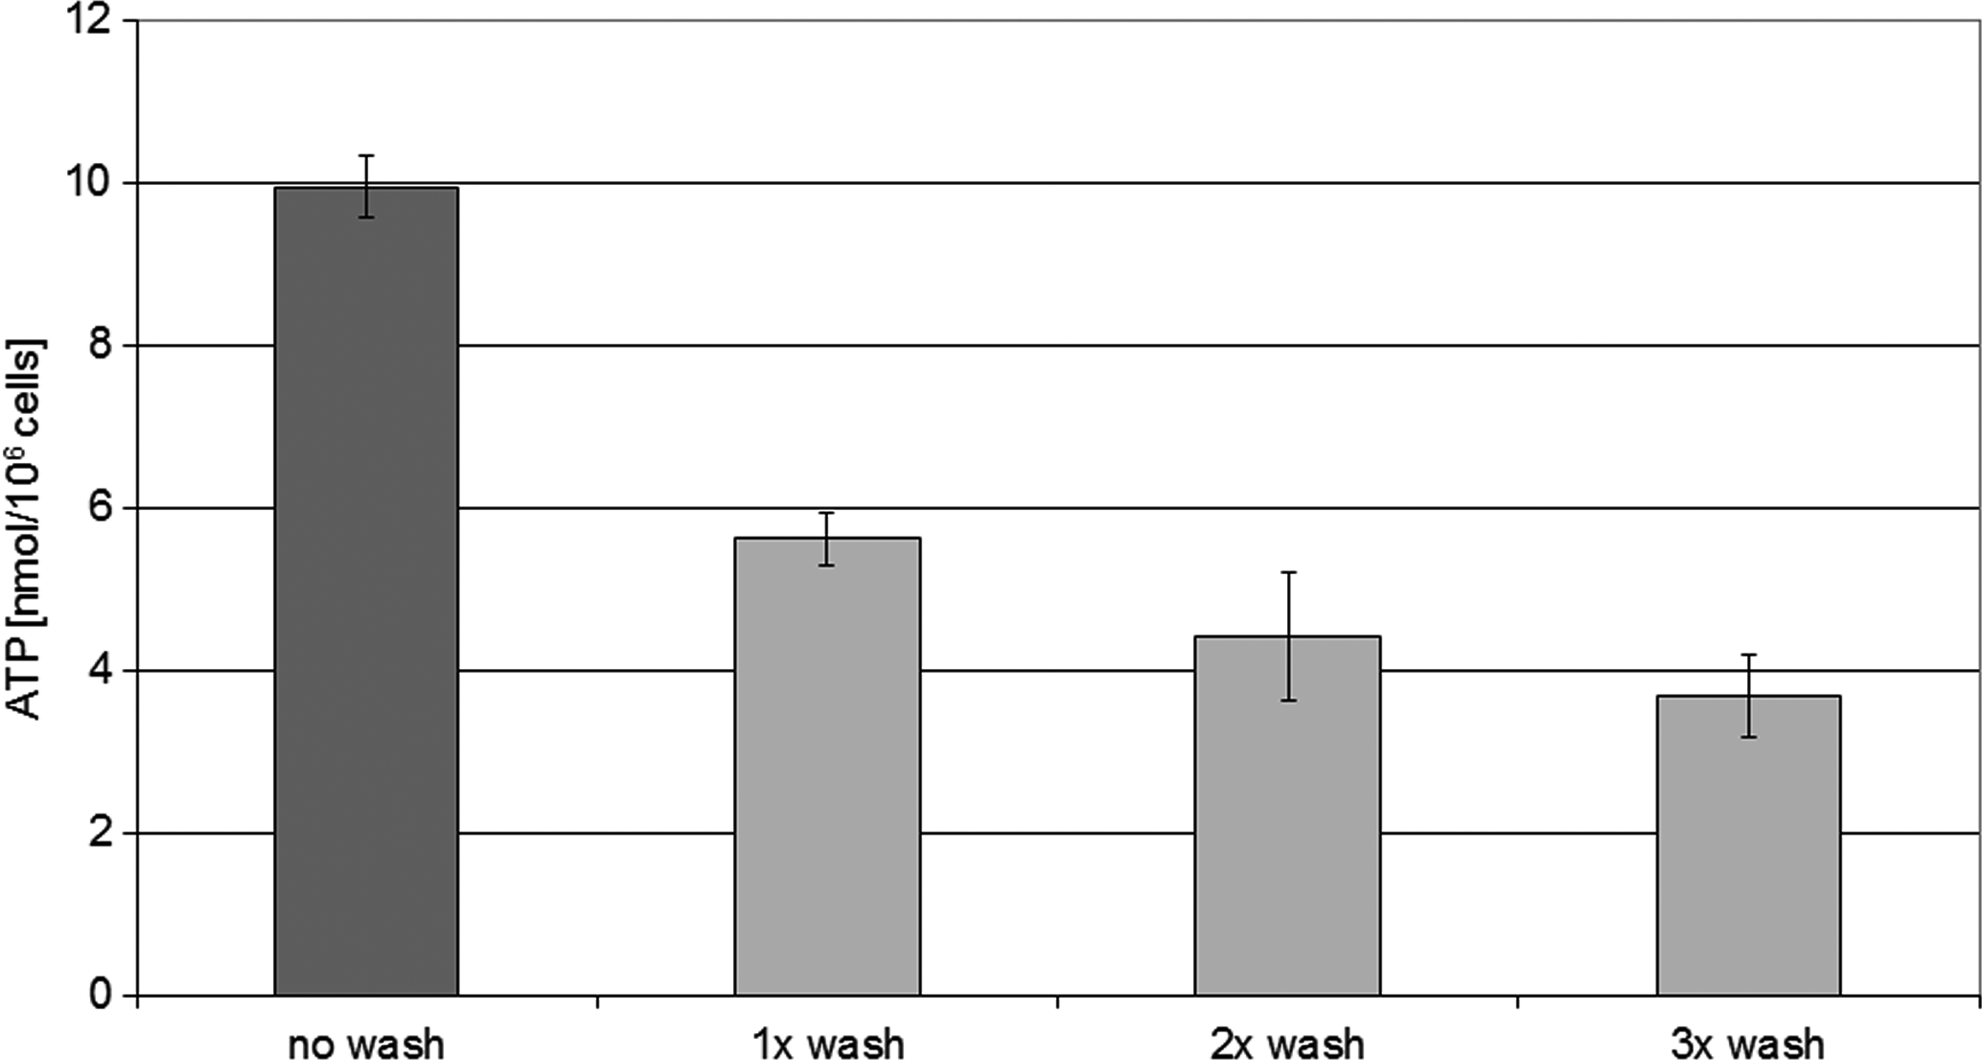
Effect of additional washing steps on the intracellular ATP levels of cells quenched with PBS. Bars represent the mean of three replicates, individual standard deviations are shown. The intracellular levels of ATP significantly decline after repeated washing cycles. Multiple range tests [Fisher's least significant difference (LSD) procedure] detects three independent groups: no wash, 1×wash and 2×/3×wash (one-way ANOVA: p-value <0.000).
Additional washing steps did not lead to a decline of LDH activity. The samples were randomly distributed between 1.31 and 1.95 U/mL of LDH.
The addition of fivefold volume of quenching solution extensively dilutes extracellular metabolites. Thus, the reported quenching step includes a simultaneous washing step. In some cases, high phosphate concentrations due to the presence of PBS can interfere with the subsequent analyses. Hence, some groups prefer a washing solution of iso-osmotic NaCl solution (Dietmair et al., 2010; Volmer et al., 2012).
Targeted metabolomics of intracellular metabolites
Within this study different metabolites covering diverse biochemical pathways and physicochemical characteristics were analyzed in triplicates at different time points of cultivation.
To assess the quality of the data and to avoid miss-interpretation due to contamination from residual medium, the extra- and intracellular metabolites were checked for linear correlations before the actual data analysis. No correlations were found (data not shown), and data were used for further analysis.
The evaluation of the complete data set showed that highest values were usually obtained with PBS as quenching solution. As evident from Table 1, the statistical analysis performing one-way ANOVA identified significant differences in 23 out of 28 metabolites.
Relative yields refer to overall mean values for the corresponding metabolite.
Relative yields were calculated based on averages of all three sample preparations on each sampling day.
Standard deviation, given for single metabolites.
All metabolites were analyzed by LC-MS/MS and (HILIC)-ESI-MS/MS and matched to several chemical databases: KEGG, HMDB, LipidMaps, CheBi, and PubChem. All possible chemical structures, including possible stereoisomers, which could realistically correspond to the determined analytes, were retrieved in the SMILES format. Lipophilicity (logP) and molecular weight were computed for each structure using the R interface to the Chemistry Development Kit (rcdk package version 3.0.3). When stereoisomers were available, we reported the average logP over all structures (stereoisomers do not influence the molecular weight).
No data available (<LOD).
n.a., not applicable.
PBS washing resulted in significant higher yields for 18 metabolites compared to at least one methanol quenching method. The remaining five significant metabolites refer to lysine, lactate, fumarate, pyruvate + oxalacetate and succinate, mainly intermediates of energy metabolism. For these metabolites buffered methanol quenching resulted in higher concentrations. However, the apparent conclusion that the increased levels of these metabolites can be directly explained by insufficient quenching using precooled PBS, can be disproven by higher yields with PBS for alpha-ketoglutarate, DHAP+3-phosphoglyceraldehyd, as well as ATP, which are supposed to likewise have high turnover rates (de Koning and van Dam, 1992; Rizzi et al., 1997; Weibel et al., 1974). In order to explain these results and to understand the impact of the used quenching solution, we tried to find a correlation between relative yields of compounds and their properties. We presumed that, for instance, hydrophobic compounds might be stronger affected by methanol solutions resulting in leakage. Although detailed analysis showed that there was no correlation between the molecular weight or lipophilicity of metabolites and the determined concentration.
Conclusion
Our results indicate that the use of precooled PBS as quenching solution without additional washing steps and a simple centrifugation step appears most suitable for optimization of metabolomics analysis in the context explained in this article. Because a fivefold volume of quenching solution is added, the risk of extracellular contamination can be reduced without increasing process time. Performing cell and media separation by centrifugation simultaneously with the intrinsic step of quenching is advantageous to minimize the elapsed time for sample preparation. The described protocol is straightforward and makes it possible to screen high numbers of samples simultaneously for a broad range of metabolite classes. The specified procedure is technically easy to use, applicable for a large number of samples and preferably used for comparability studies.
All our analyses indicated that methanol as quenching solution, even in combination with a buffer substance, is not suitable for quenching sensitive mammalian cells. Viability testing using trypan blue as well as using the Guava Nexin assay identified a decline in membrane integrity. In addition, ATP measurement and the targeted metabolomics analysis showed lower yields for methanol than for PBS quenching. Specifically methanol buffered with AMBIC showed unexpected low results.
Our data indicate the importance of standardized sample preparation in metabolomics. For comparability studies requiring a high number of samples, this method is thus recommended and has been shown to be adequate for fixing cellular metabolism at the time of sampling as steps are executed as quickly and as consistently as possible. For different clones or different process parameters, it will be easy to observe differences throughout the cultivation conditions, which are most relevant especially for bioprocess development. Besides targeted approaches for selected metabolites, overall metabolic profile data for diverse cell lines or different cultivation conditions and phases might give hints on new targets for metabolic and process engineering.
Footnotes
Acknowledgments
The authors acknowledge BIOCRATES Life Sciences AG (Innsbruck, Austria), namely, Dr. Denise Sonntag, for analytical support as well as for proofreading the manuscript. Moreover, they thank Dr. Philipp Ball for additional, precise proofreading as a native speaker.
Author Disclosure Statement
The authors declare that no conflicting financial interests exist.
References
Supplementary Material
Please find the following supplemental material available below.
For Open Access articles published under a Creative Commons License, all supplemental material carries the same license as the article it is associated with.
For non-Open Access articles published, all supplemental material carries a non-exclusive license, and permission requests for re-use of supplemental material or any part of supplemental material shall be sent directly to the copyright owner as specified in the copyright notice associated with the article.