




Abstract
Abstract
Among the different areas of molecular biology concerning the detailed study of different parts of the cell, such as genomics, proteomics, and metabolomics, different new areas of study are emerging which entail the analysis of different parts of the genome, such as the prediction of genes or different kinds of transcription factor binding sites (TFBSs). The goal of this study was to construct and analyze a catalogue of all statistically relevant putative functional octamer words or motifs (which we have termed the “motifome” of a given organism) found within first introns, promoters, the 5′ and 3′ untranslated regions (UTRs), and the entire genome of japonica rice, and compare them to results attained from a previous analysis performed on the Arabidopsis genome. We found a number of novel motifs in different sets of non-coding rice sequence sets. The diversity of motifs in rice was higher in Arabidopsis, implicating a higher mutation turnover. While common motifs were found between the two species, motif pairs were missing, showing the difference between the regulatory machinery between rice and Arabidopsis.
Introduction
The goal of this study was to enumerate and catalogue all possible octamer motifs in different parts of the japonica rice genome, as well as in the genome itself. The reason rice was chosen is because its entire genome sequence is already available and well annotated. Furthermore, consensus sequences of a number of high-scoring motifs have been defined, and co-occurring motifs have also been defined and analyzed.
Furthermore, the genome of rice can be compared to that of Arabidopsis. Therefore a cross-species comparison was done to draw conclusions about species differences and similarities in gene regulation. Furthermore, motifs marked as statistically significant in this analysis can be used in further experimental studies concerning gene regulation.
Materials and Methods
Selection of rice sequences
The 5′ untranslated region (UTR), 3′ UTR, intron, and whole genome sequences for rice were downloaded from the MSU Rice Genome Annotation Project website at ftp.plantbiology.msu.edu/pub/data/Eukaryotic_Projects/o_sativa/annotation_dbs/pseudomolecules/version_6.1/all.dir/ (Ouyang, 2007). The files all.con, all.intron, and all.utr were downloaded, and the file all.utr was split into two separate files, which contained the 5′ UTR and 3′ UTR sequences.
The core (250 bp), proximal (1000 bp), and distal (3000 bp) promoter sequences were downloaded from the Osiris database (Morris, 2008; http://www.bioinformatics2.wsu.edu/cgi-bin/Osiris/cgi/home.pl). Transcript sequences were used, and were shortened to prevent overlapping with neighboring genes.
Word statistical measure
These calculations are based on the algorithm presented in Lichtenberg (2009a). The statistical significance of a given word w is sign(w)=S·ln(S/ES), where S is the number of sequences the word w occurs in, and ES is the number of sequences the word is expected to occur in, by calculating the probability of the word's occurrence based on the background base distribution in rice (pA=pT=28.2%, pC=pG=21.8%). The probability pw can be calculated with the following formula:
In the whole genome, the expected occurrence of w is ES (w)=Ngenome·pw, where Ngenome is the size of the rice genome, and pw is the occurrence probability of the word. In the case of the other six sequence sets, ES is calculated somewhat differently. We assume that the occurrence of a given word follows a Poisson distribution. Hence, the number of sequences the word is expected to occur in is
Word clustering
For all seven sequence sets we matched all of the top 100 highest scoring words with each other. Two words belonged to the same cluster if the Hamming distance was at most 1 bp. The two words were also allowed to slide 1 bp alongside each other.
Word location distribution
We searched for the top 100 motifs of each of six sequence sets (core, proximal, and distal promoters, introns, 5′ UTRs, and 3′ UTRs), and calculated their location in each sequence of each set. The number of occurrences of different motifs at all positions was also calculated and mapped to an interval of [−N,−1] in the case of the 3 promoter sets, where n=250, 1000, or 3000 (for core, proximal, or distal promoters). Since the length of the sequences differs in all other sequence sets, the positions were normalized to an interval of [1,100]. The position occurrence frequency was then plotted to a curve. For introns, 5′ UTRs, and 3′ UTRs, the position occurrence frequency was also plotted from the beginning and end of the individual sequences in addition to normalization.
Word pair statistical measure
For a word pair w1;w2, the probability of finding such a pair is equal to the product of the individual word probabilities: pw1;w2=pw1·pw2. The significance value for a word pair can also be calculated similarly with pw1;w2 in place of pw.
GO term analysis
For six of the sequence sets (core, proximal, and distal promoters, introns, 5′ UTRs, and 3′ UTRs), a list of genes was determined containing at least one of the top 10 octamer words. A list of these rice gene identifiers was entered into the GO Enrichment Analysis Tool at the Rice Array Database. MSU GOSlim terms were retrieved for biological, cellular, and molecular functions. GO terms were accepted whose p value was at most 0.01. The top 10 octamer words and the GO terms associated with them were visualized for all six sequence sets and all three functional categories using the matrix2png web application software at http://chibi.ubc.ca/matrix2png/bin/matrix2png.cgi.
Results
Principles of investigation
The total occurrence of all possible 65,536 octamer motif words was enumerated in the entire rice genome, as well as the appropriate 5′ UTR, 3′ UTR, all introns, core, proximal, and distal promoters, and a corresponding significance value was assigned to them. Octamers were also analyzed in this study, since they are short enough to be classified as TFBSs without being too specific, and are long enough to be statistically robust and diverse (shorter words such as hexamers would appear roughly once every ∼4000 bp; about once in every distal promoter).
Analysis of occurrences of word motifs for all seven sequence sets
For all seven sequence sets, the top 100 highest scoring motifs were studied in further detail. A statistical overview of these sequence sets can be seen in Table 1. All motifs are listed in the worksheets of Supplementary Material 1 (see online supplementary material at http://www.liebertonline.com). The top 10 motifs from all seven sequence sets can be seen in Table 2. To test whether the found motifs were truly biologically relevant, we checked whether the individual octamer motifs perfectly matched any experimentally verified motifs listed in the PLACE database. Quite a large number of the top motifs corresponded to motifs found in the database (core promoters: 66, proximal promoters: 40, distal promoters: 66, 5′ UTRs: 12, 3′ UTRs: 32, introns: 44, whole genome: 43). This information can found in Supplementary Material 1 (see online supplementary material at http://www.liebertonline.com).
The motifs CARGNCAT, CARGCW8GAT, MARTBOX, −314MOTIFZMSBE1, and ABRECE3ZMRAB28 were consistently the highest ranking motifs, which matched the top 100 from the seven different sequence sets in japonica rice. They also matched motifs from the top 100 sets a total number of 223, 219, 105, 59, and 41 times, respectively. These 5 motifs correspond respectively to two MADS protein-binding sites, a T-box in a scaffold attachment region, a sugar-responsive element, and a CE3-coupling element involved in stress response, as annotated in the PLACE database.
It is of interest to note that a number of (TC)n and (TTC)n motifs were found to be overrepresented in the region [−39,−26] which corresponds to where the TATA-box is located in many Arabidopsis and rice core promoters. According to Bernard and associates (2010), such motifs also contribute to the regulation of transcription. Motifs from the top 100 motifs found in japonica rice core promoters such as CTCTCTCT (score: 3796.82, rank: 12), TCTCTCTC (score: 4305.22, rank: 9), and TCTTCTTC (score: 1692.44, rank: 89) were found in this region.
We also studied the number of motifs that were unique to one or more sequence sets. Overall the algorithm found 311 such motifs: 121, 108, 20, 18, 33, and 11 motifs were unique to only one, two, three, four, five, or six sets (Fig. 1). No motifs were common to all seven sets. A list of these common motifs may be found in Supplementary Material 1 (see online supplementary material at http://www.liebertonline.com). For these top 311 motifs we studied their distribution among different combinations of sequence sets. Overall 28 different set combinations were found, 13 of which occurred 10 or more times (Table 3). High-scoring motifs from the top 100 set of motifs occurring in both the 3′ UTRs and introns were the most frequent, with 39 occurrences. A number of motifs were found to be unique to a specific set (34 to 5′ UTRs, 29 to 3′ UTRs, 25 to introns, 20 to core promoters, and 10 to the whole genome). Twenty-seven motifs were common to both the core promoters and 5′ UTRs, which means that there may be some overlap in the regulation between these two kinds of sequences. Twenty-one motifs were common to both proximal and distal promoters, meaning that these motifs might take part in the special regulation of genes. Another 17 motifs were common to the whole genome as well as 5′ UTRs. A small number of motifs were found to be promiscuous to a number of different sets. Overall 13 motifs were found in the set combination 12345, 11 in 13467, 11 in 123467, and 11 in 1234 (1: whole genome, 2: core promoters, 3: proximal promoters, 4: distal promoters, 5: 5′ UTRs, 6: 3’UTRs, 7: introns). In total, 68 motifs were found in the whole genome as well as proximal and distal promoters (the set combination 134).

Number of top 100 words common to different numbers of sequence sets in rice.
What is interesting to note is that no nullmers (motifs that do not occur in a given sequence set) were found in any of the sequence sets in rice, from which we may infer that the motif diversity in rice is higher than that of Arabidopsis, for which sets of nullmers of different sizes were found in core promoters, introns, 5′ UTRs, and 3′ UTRs (Lichtenberg, 2009a).
The top 100 motifs of each of the seven individual sequences sets were also compared between rice and Arabidopsis. Overall, between Arabiodopsis and japonica, 10, 11, 2, 5, 19, 27, and 27 motifs were common to both sets of core promoters, proximal promoters, distal promoters, 5′ UTRs, 3′ UTRs, introns, and genomes, respectively (Fig. 2). These data may be seen in Supplementary Material 1 (see online supplementary material at http://www.liebertonline.com). Here those PLACE motifs with hits to most of the top 100 motifs from all different sequence sets were the motifs CARGNCAT, CARGCW8GAT, MARTBOX, and −314MOTIFZMSBE1 (functions mentioned previously), with 25, 24, 9, and 6 hits, respectively.
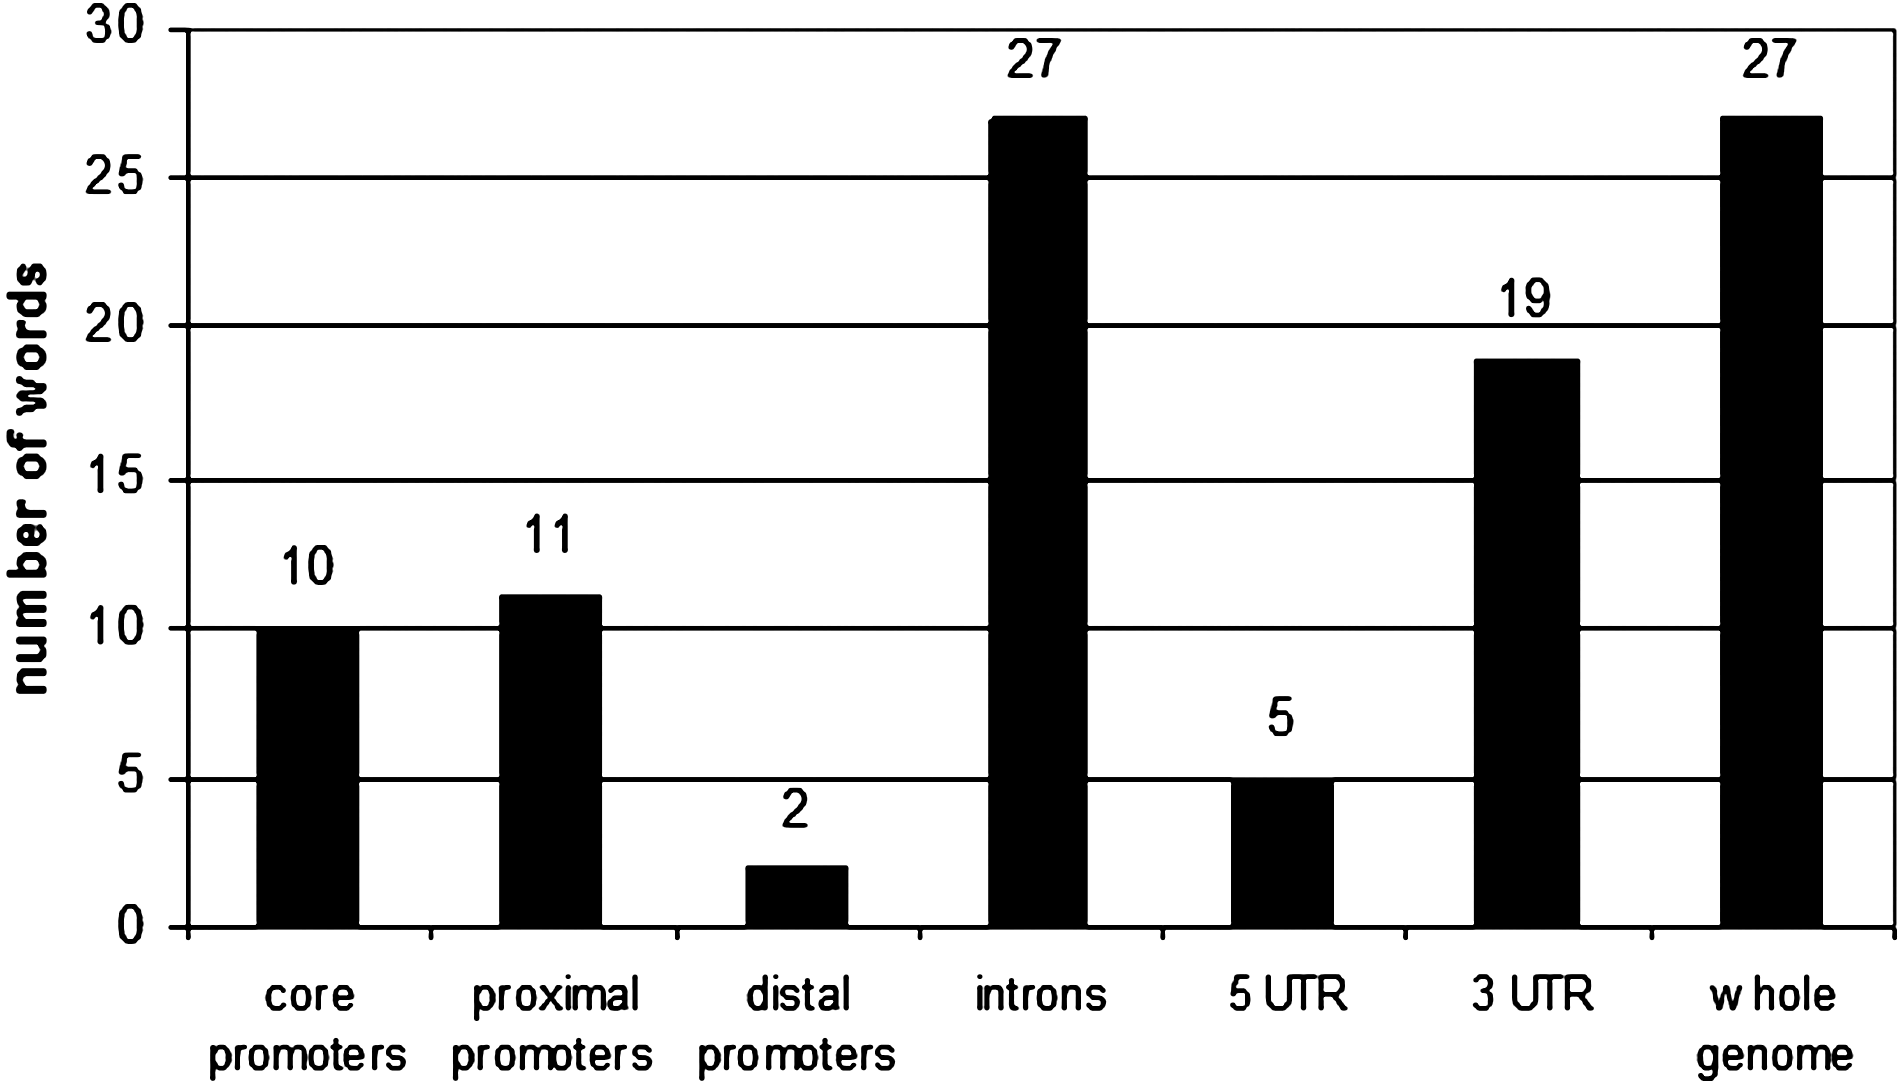
Number of top 100 words common to the corresponding sequence set in Arabidopsis.
Word clusters
Clusters of words coming from the top 100 words were defined with a consensus sequence. A total of 10, 9, 6, 11, 7, 2, and 6 clusters were made for core, proximal, and distal promoters, 5′ UTRs, 3′ UTRs, introns, and the whole genome, respectively (51 in total). Each cluster had at least three members, and the largest cluster was found in introns containing 50 members, represented by the consensus sequence NNHYNNNTYNT. The average number of cluster members was 6.4, with a standard deviation of 7.36. The clustering data can be seen in Supplementary Material 2 (see online supplementary material at http://www.liebertonline.com).
Of particular interest are the consensus sequences KAAAAAAAW and KAAAAAAAAK, which correspond to the PLACE motif ATRICHPSPETE, annotated in the PLACE database as an A/T-rich sequence (Sandhu et al., 1998). The motifs HAAAATTTT, HAAAWTTTW, and AAAWTTWA correspond to the PLACE motifs CARGCW8GAT and CARGNCAT, which are poly A/T motifs involved in binding MADS proteins (Tang and Perry, 2003; Wang et al., 2004). The consensus sequences CCACCHCC and CCACCDCC form part of the P-box, which is necessary but not sufficient for elicitor or light responsiveness (Logemann, 1995). The motif GCCGCC (GCCCORE) matched our consensus sequences CGCCGCCGCC, GCCGCCGCCG, CCGCCGBC, KCGCCGCCN, KCCGCCTCC, and BCGCCGCCS. This motif is present in the promoter of a number of pathogen-responsive genes (Brown, 2003). The PLACE motif GRWAAW corresponded to our motifs BAAAAAAWN, KAAAAAAAAK, and KAAAAAAAW. This motif, the GT-1 binding site, functions in light responsiveness in many genes (Zhou, 1999). The PLACE motif GAAAAA (GT1GMSCAM14) matches our motifs BAAAAAAWN, KAAAAAAAAK, and KAAAAAAAW, and is also a GT-1 binding site just like GRWAAW, but also takes part in pathogen response and salt-induced stress (Park et al., 2004). The motif TGTCTC (ARFAT) is part of the auxin response factor (ARF), which is present in the promoter of a number of early auxin response genes (Hagen and Guilfoyle, 2003). The motif TTATTT (TATABOX5) corresponds to the well-known TATA box, matched by our motifs WWAKTTTTTTN and ADNTTTWTTWN.
In order to check whether the consensus sequences themselves were real, we calculated the score value for each consensus sequence according to the algorithm (Table 4). As we can see, the score value for the consensus sequences is high except in only a few cases. For example, the score for the consensus sequence NNHYNNNTYNT is −15500.6. This consensus sequence is found in introns, from a cluster with 50 members. A possible reason for such a low score is that the sequence is very unspecific, and therefore occurs very frequently (235,282 times). Its expected occurrence is 251,305, with a difference of 16,023 (6.81% of 235,282). At such high occurrences, a small difference such as this is more significant. Another consensus sequence found in core promoters, GTGGGAAAM had a score value of −6.97284. These two consensus sequences were regarded as statistical artifacts not representing true binding sites.
Localization of word motifs across sequences
In order to get a feel of how our top 100 words localize along the sequences in each sequence set we performed a complete sequence set search for all top 100 words of all sets. The results can be seen in Figures 3–14. In the case of promoters, a number of regulatory motifs, such as TFBSs, are localized to a specific region of the promoter. As in the case of the core promoters it is interesting to note that there is a hump between −80 and −35 bp within this region, which is where the core transcription machinery binds to the DNA (Fig. 3). Such a bulge was also observed in the case of Arabidopsis core promoters (Lichtenberg, 2009a). Motif localization for proximal and distal promoters can be seen in Figures 4 and 5.
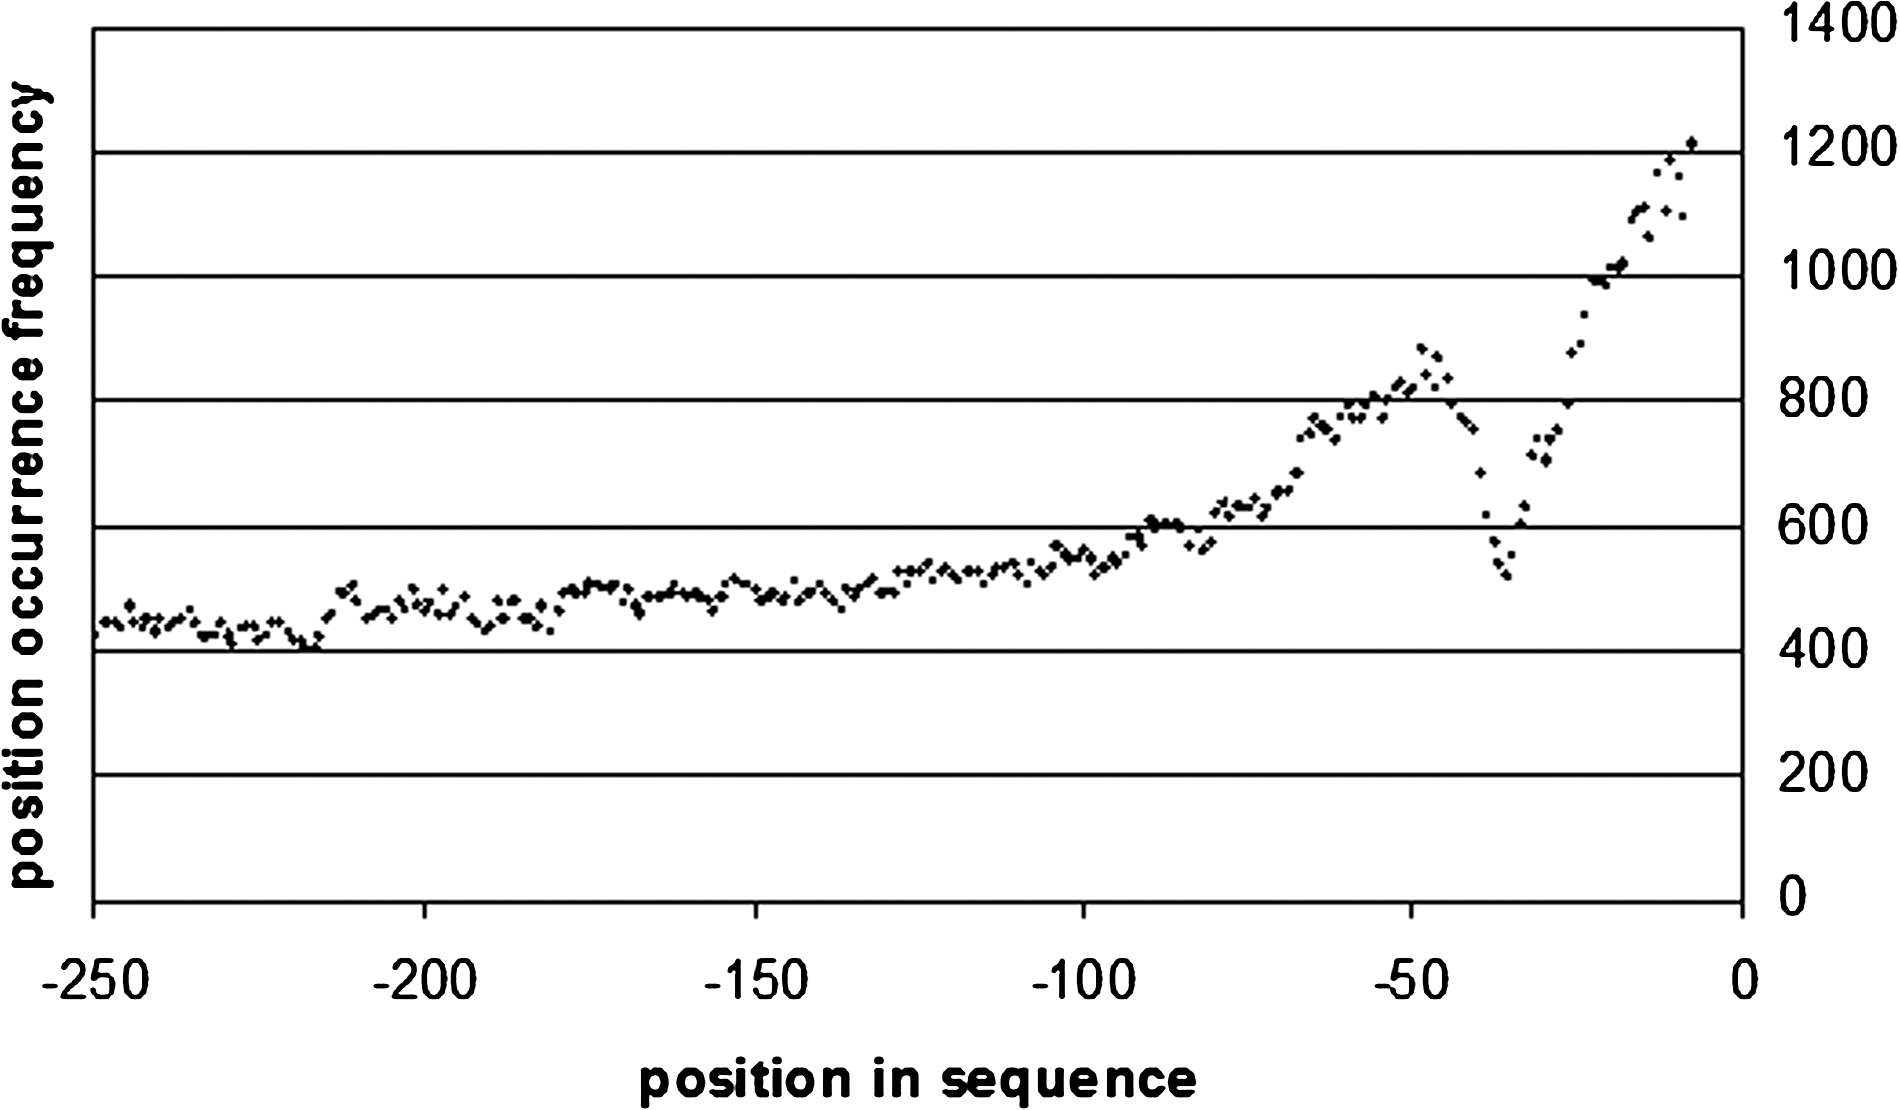
Word positional frequency across core promoters.

Word positional frequency across proximal promoters.

Word positional frequency across distal promoters.
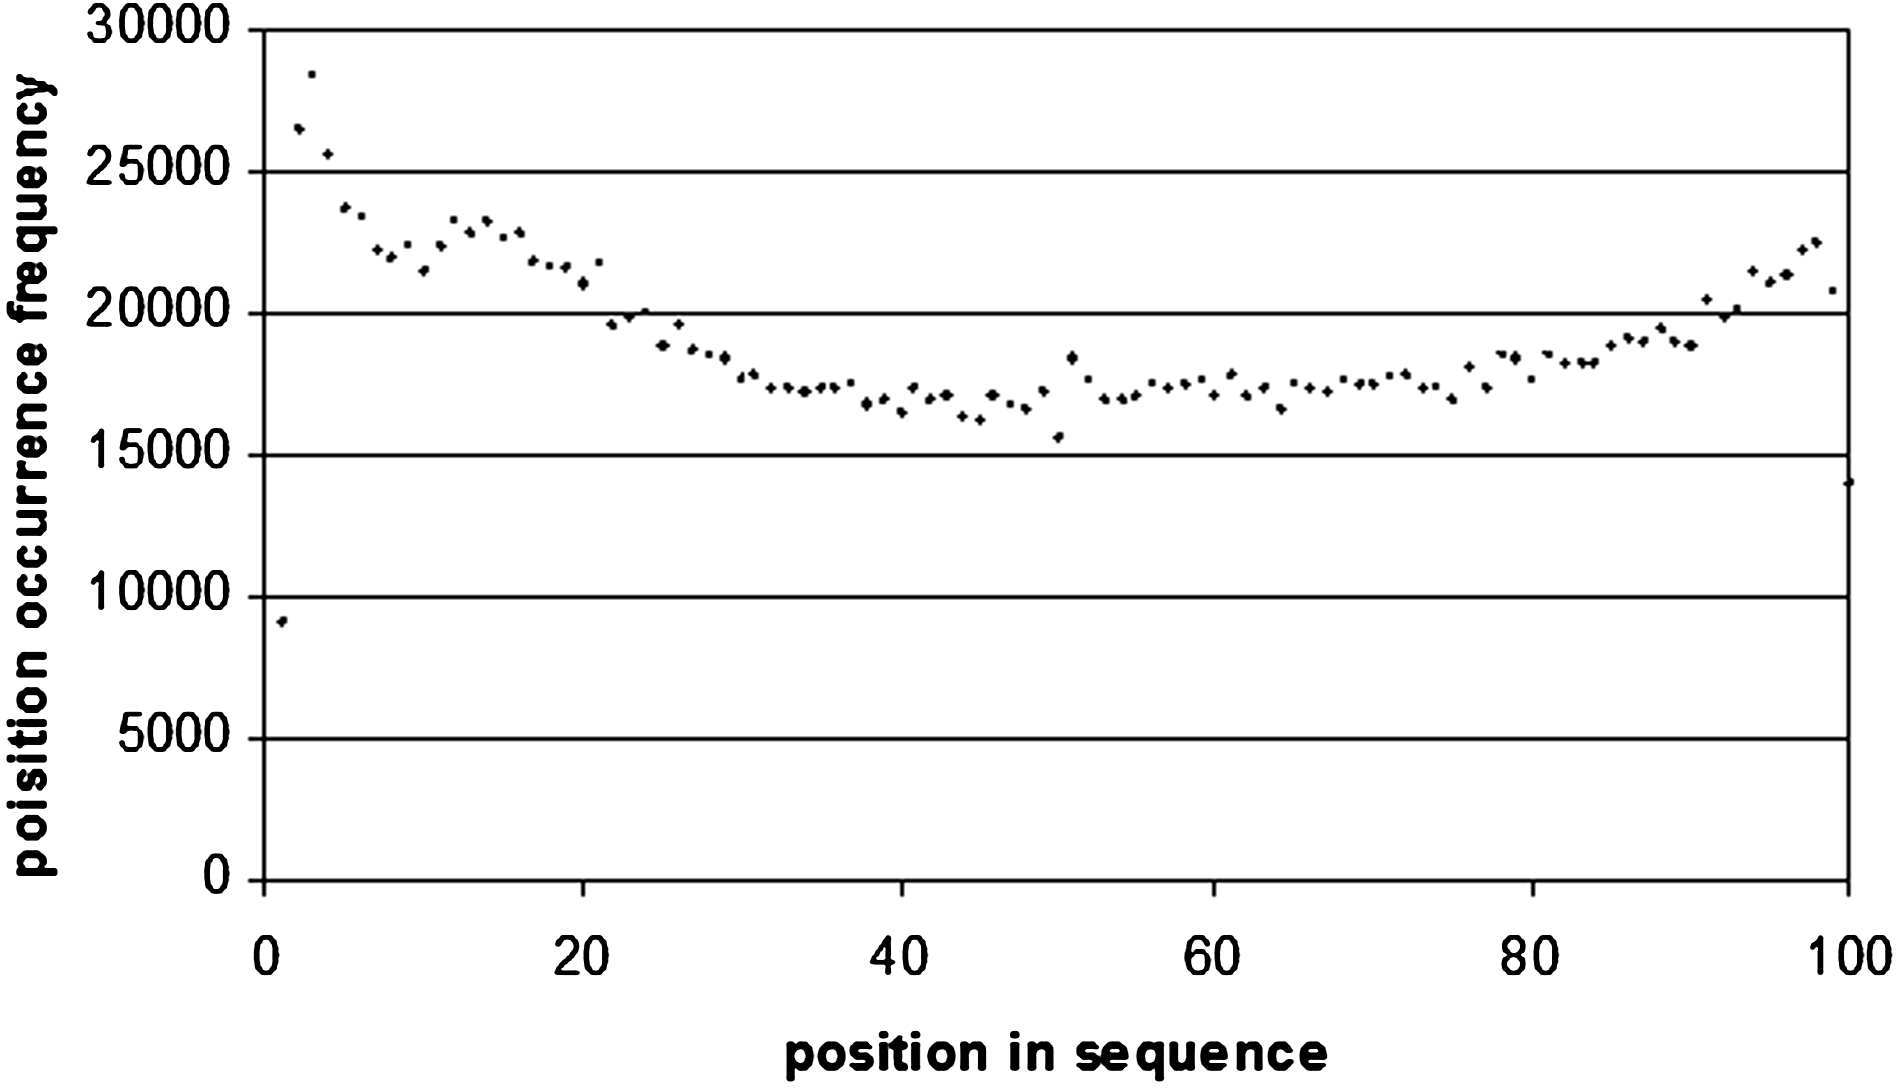
Word positional frequency across introns.
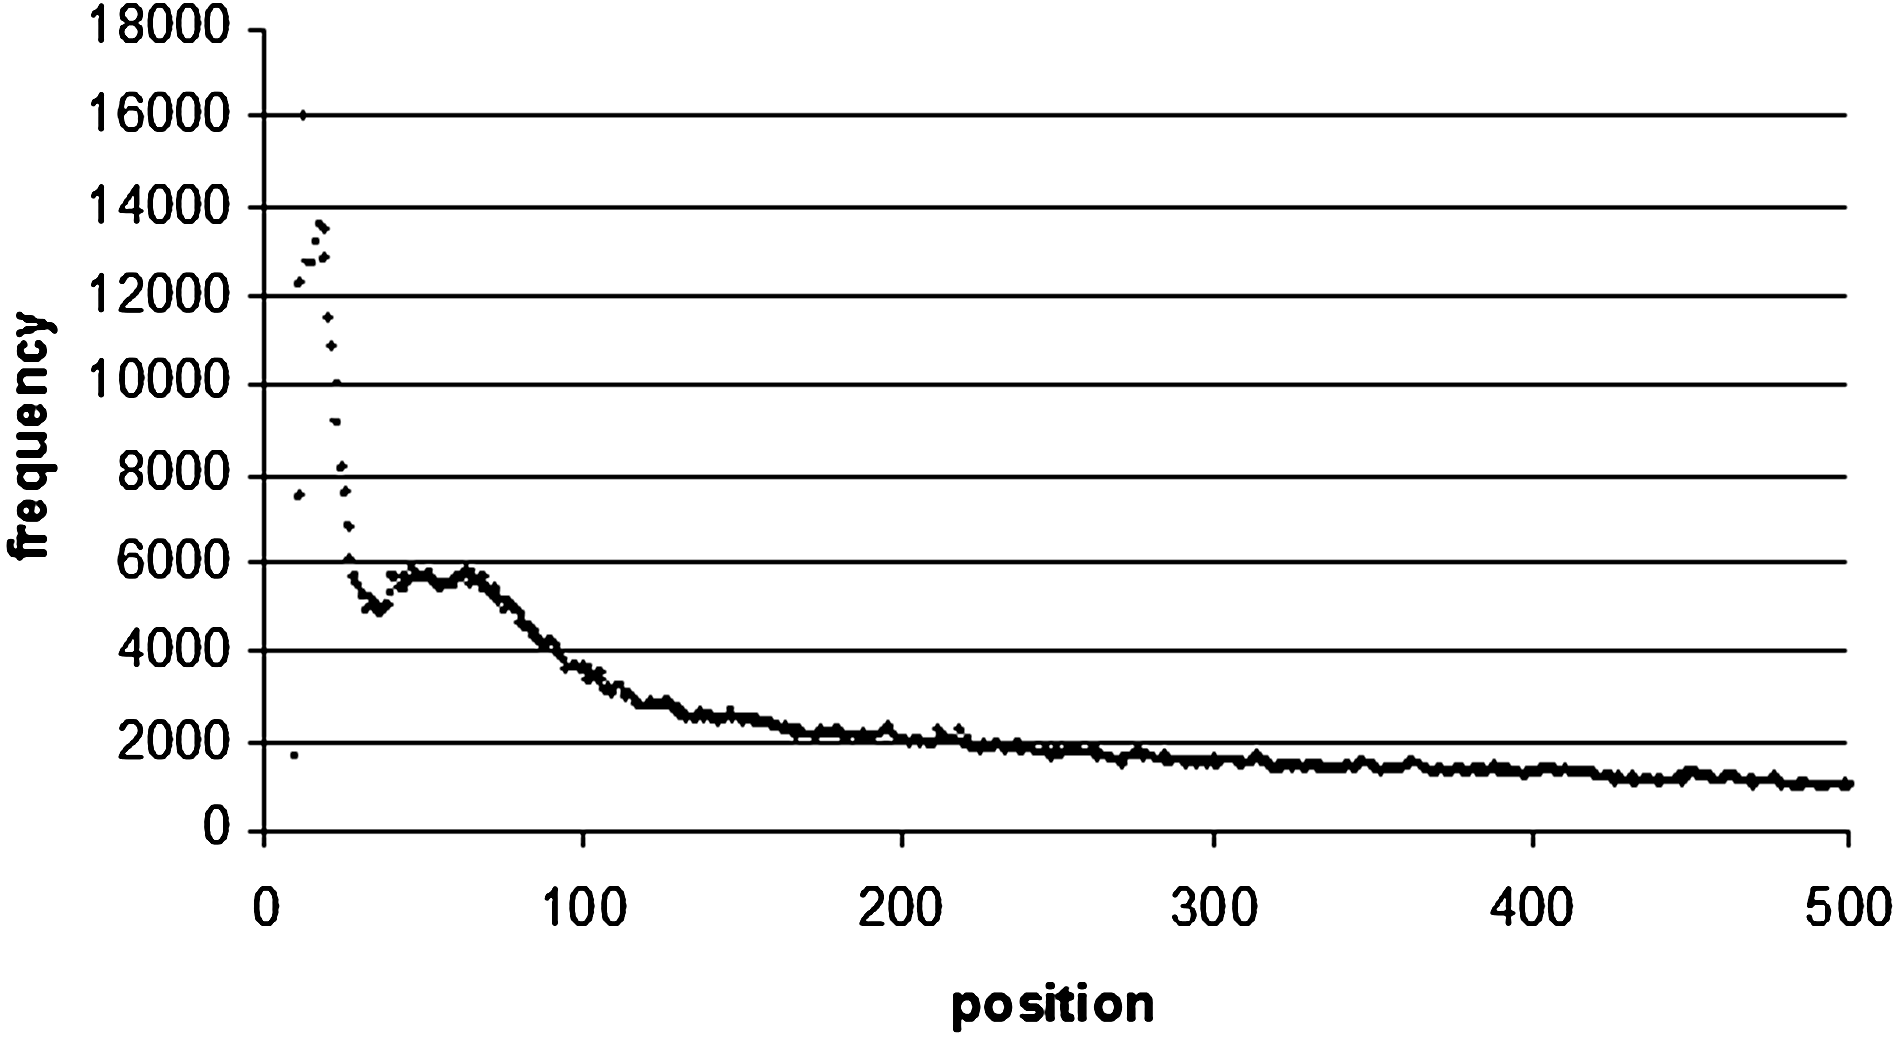
Word positional frequency from the beginning of introns. In order to make the diagram more readable, only the first 500 bp were taken from the distribution. The positional frequency values all decrease after 500 bp.

Word positional frequency from the end of introns. In order to make the diagram more readable, only the first 500 bp were taken from the distribution. The positional frequency values all decrease after 500 bp.
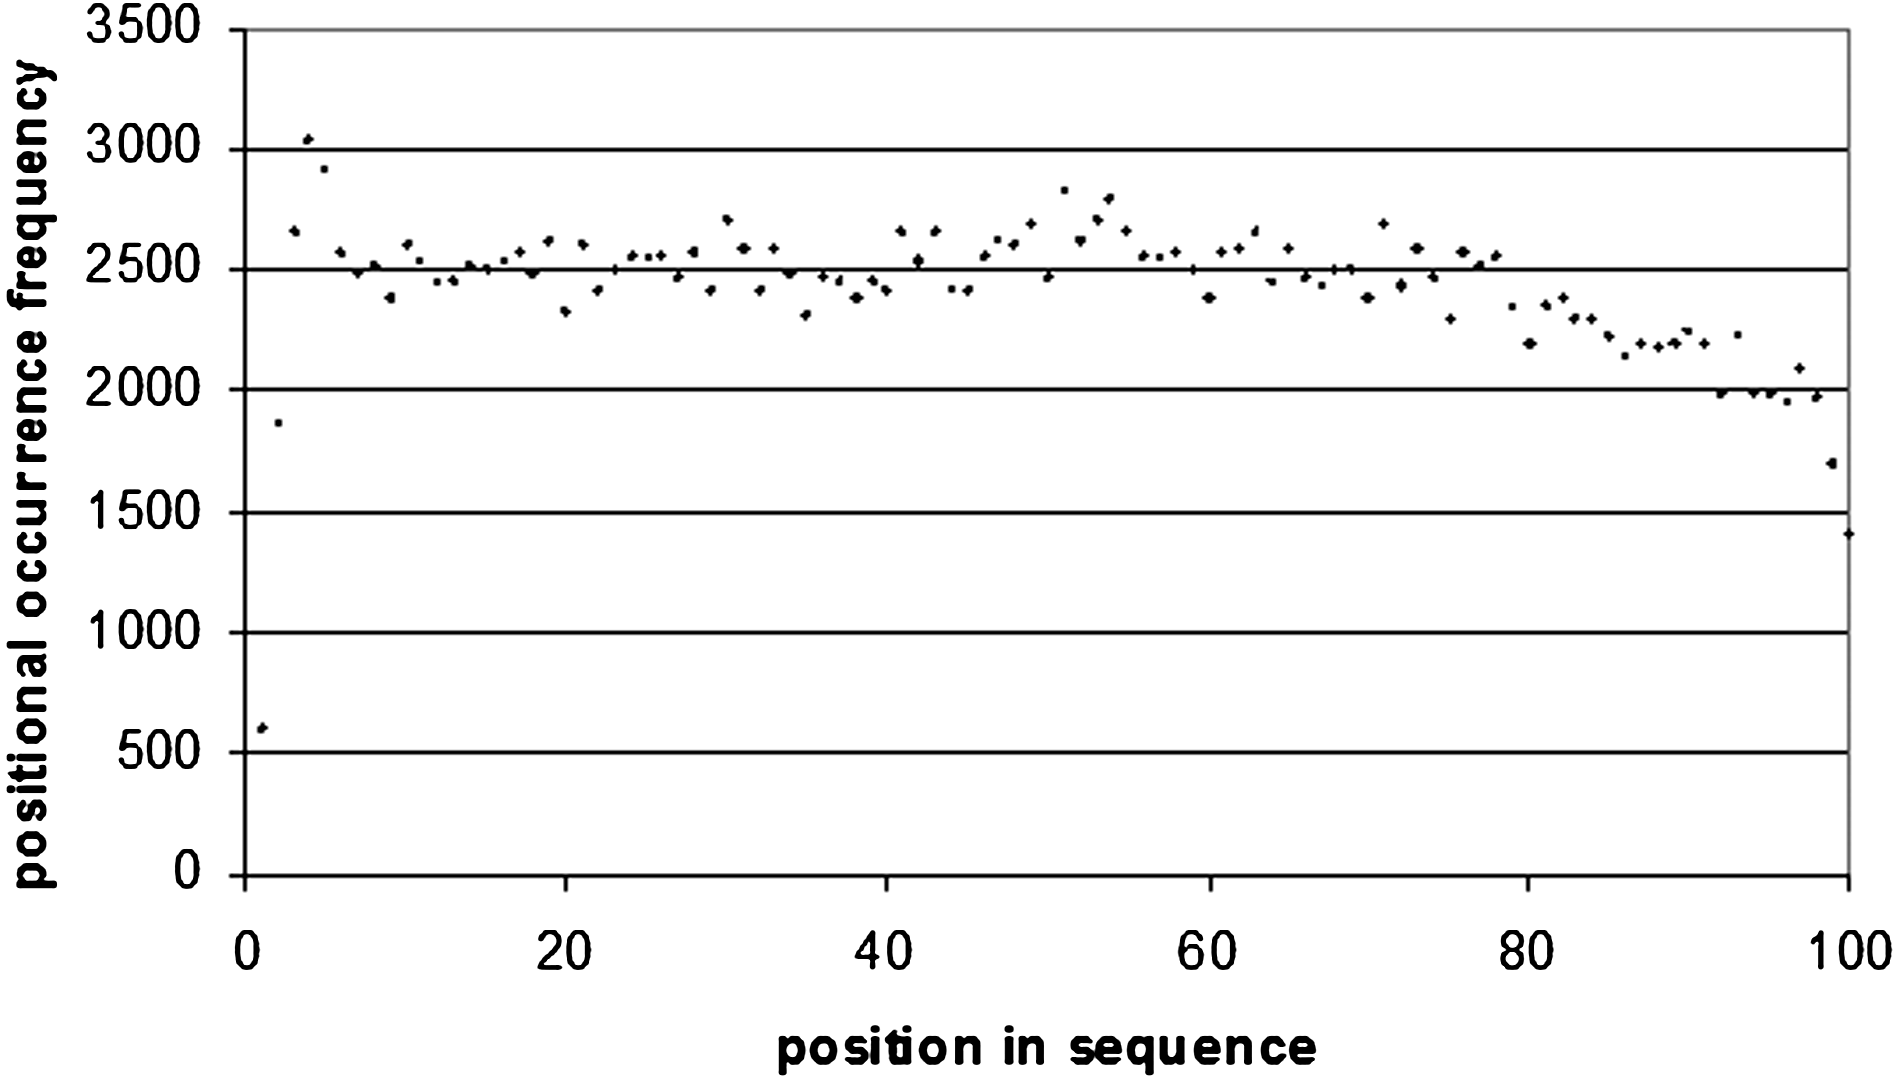
Word positional frequency across 3′ UTRs.
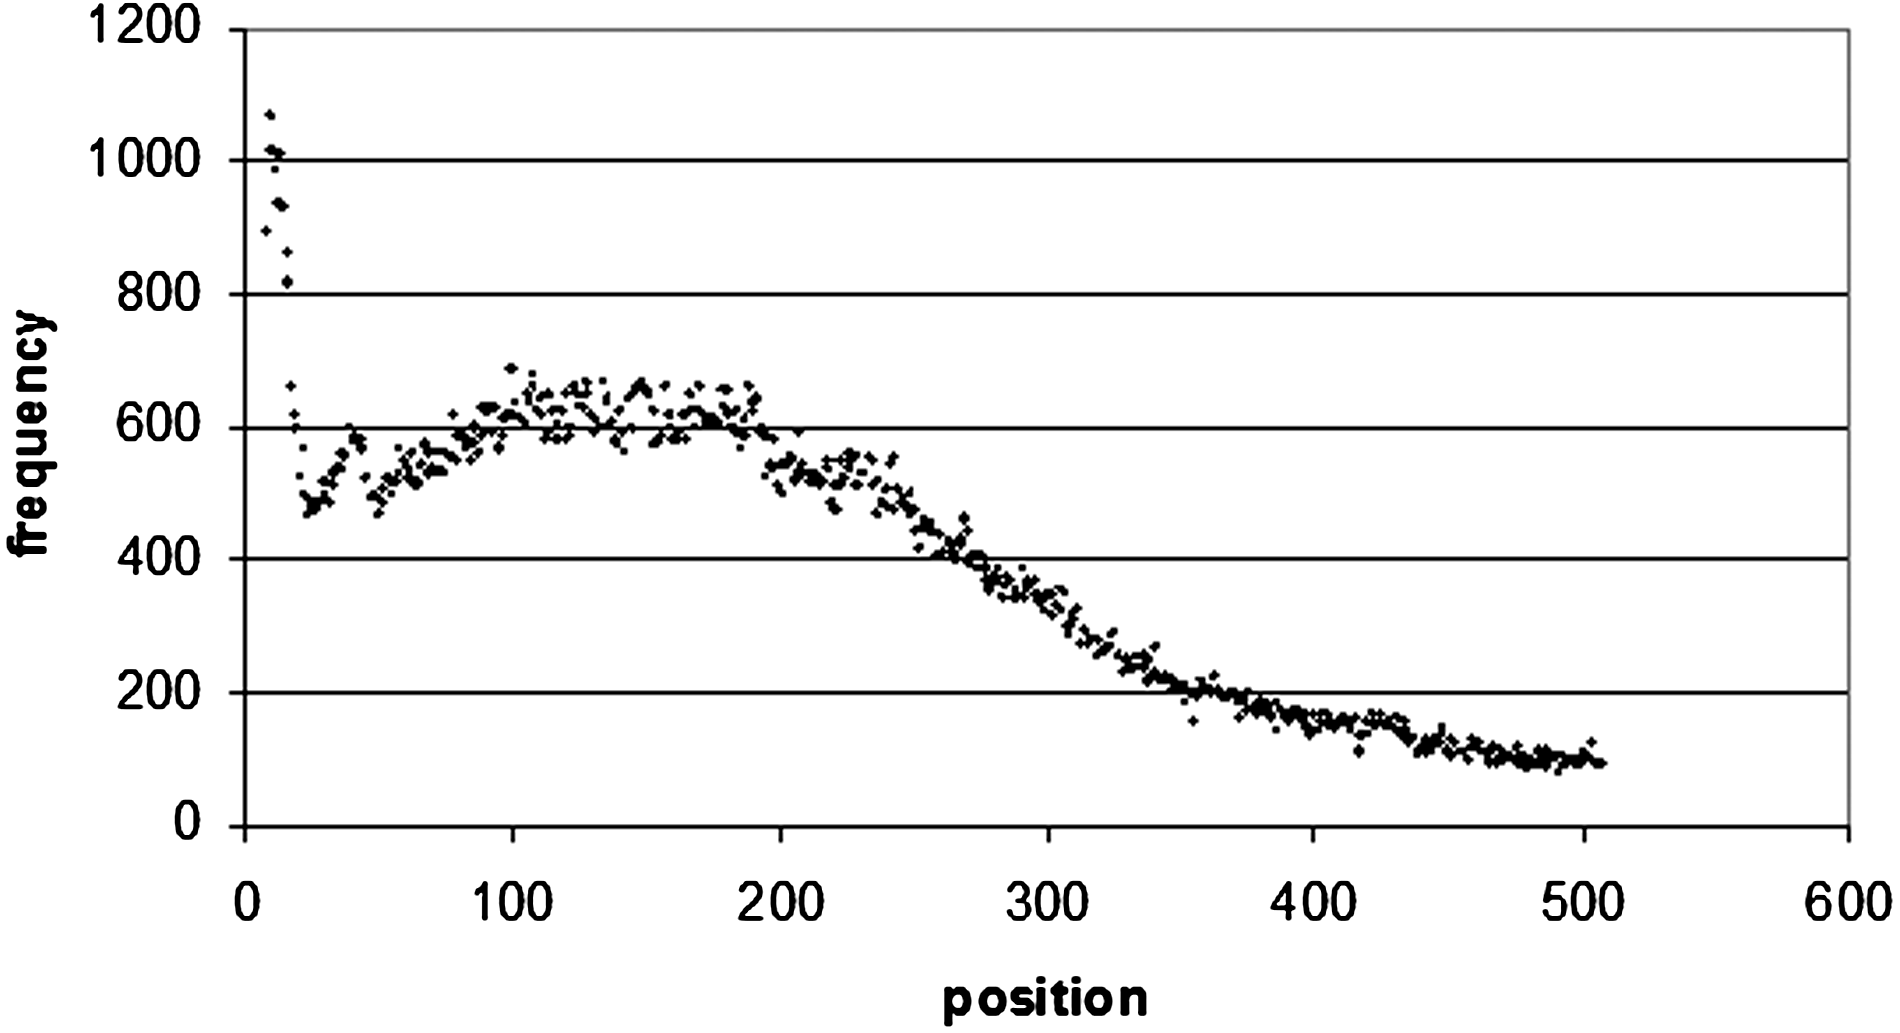
Word positional frequency from the beginning of 3′ UTRs. In order to make the diagram more readable, only the first 500 bp were taken from the distribution. The positional frequency values all decrease after 500 bp.
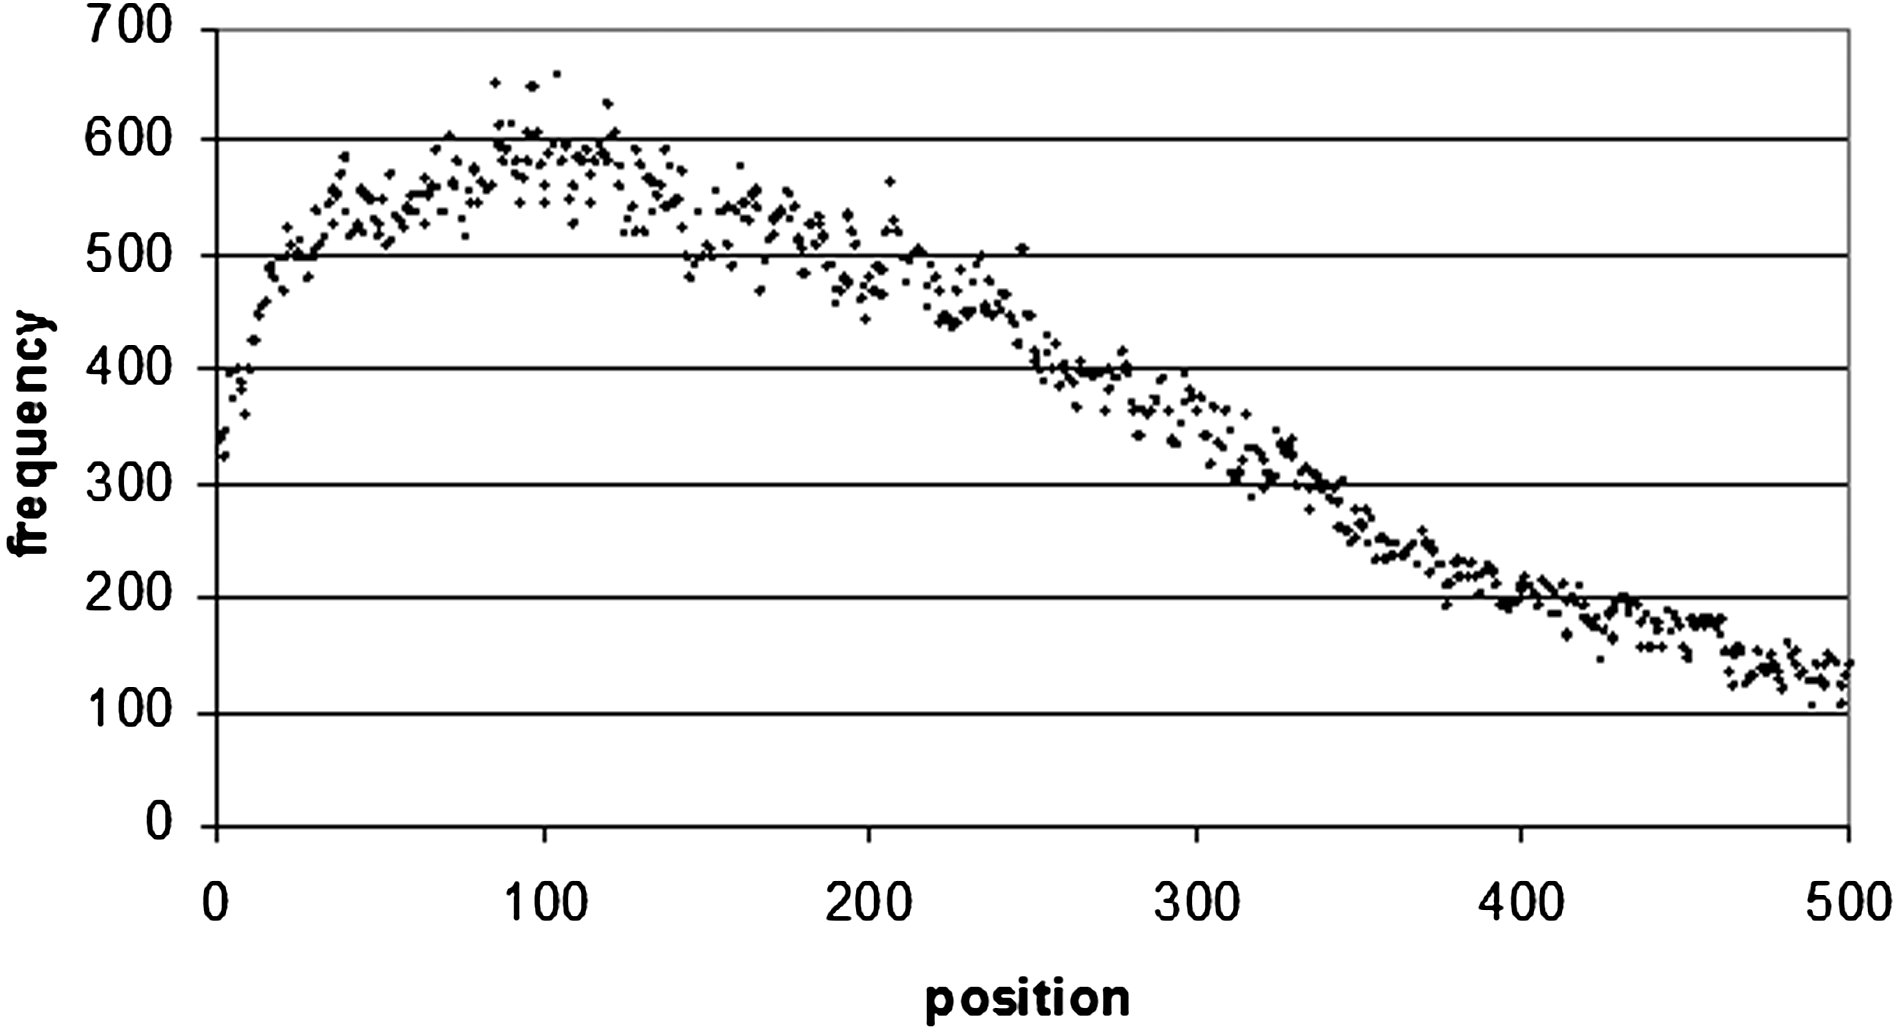
Word positional frequency from the end of 3′ UTRs. In order to make the diagram more readable, only the first 500 bp were taken from the distribution. The positional frequency values all decrease after 500 bp.

Word positional frequency across 5′ UTRs.
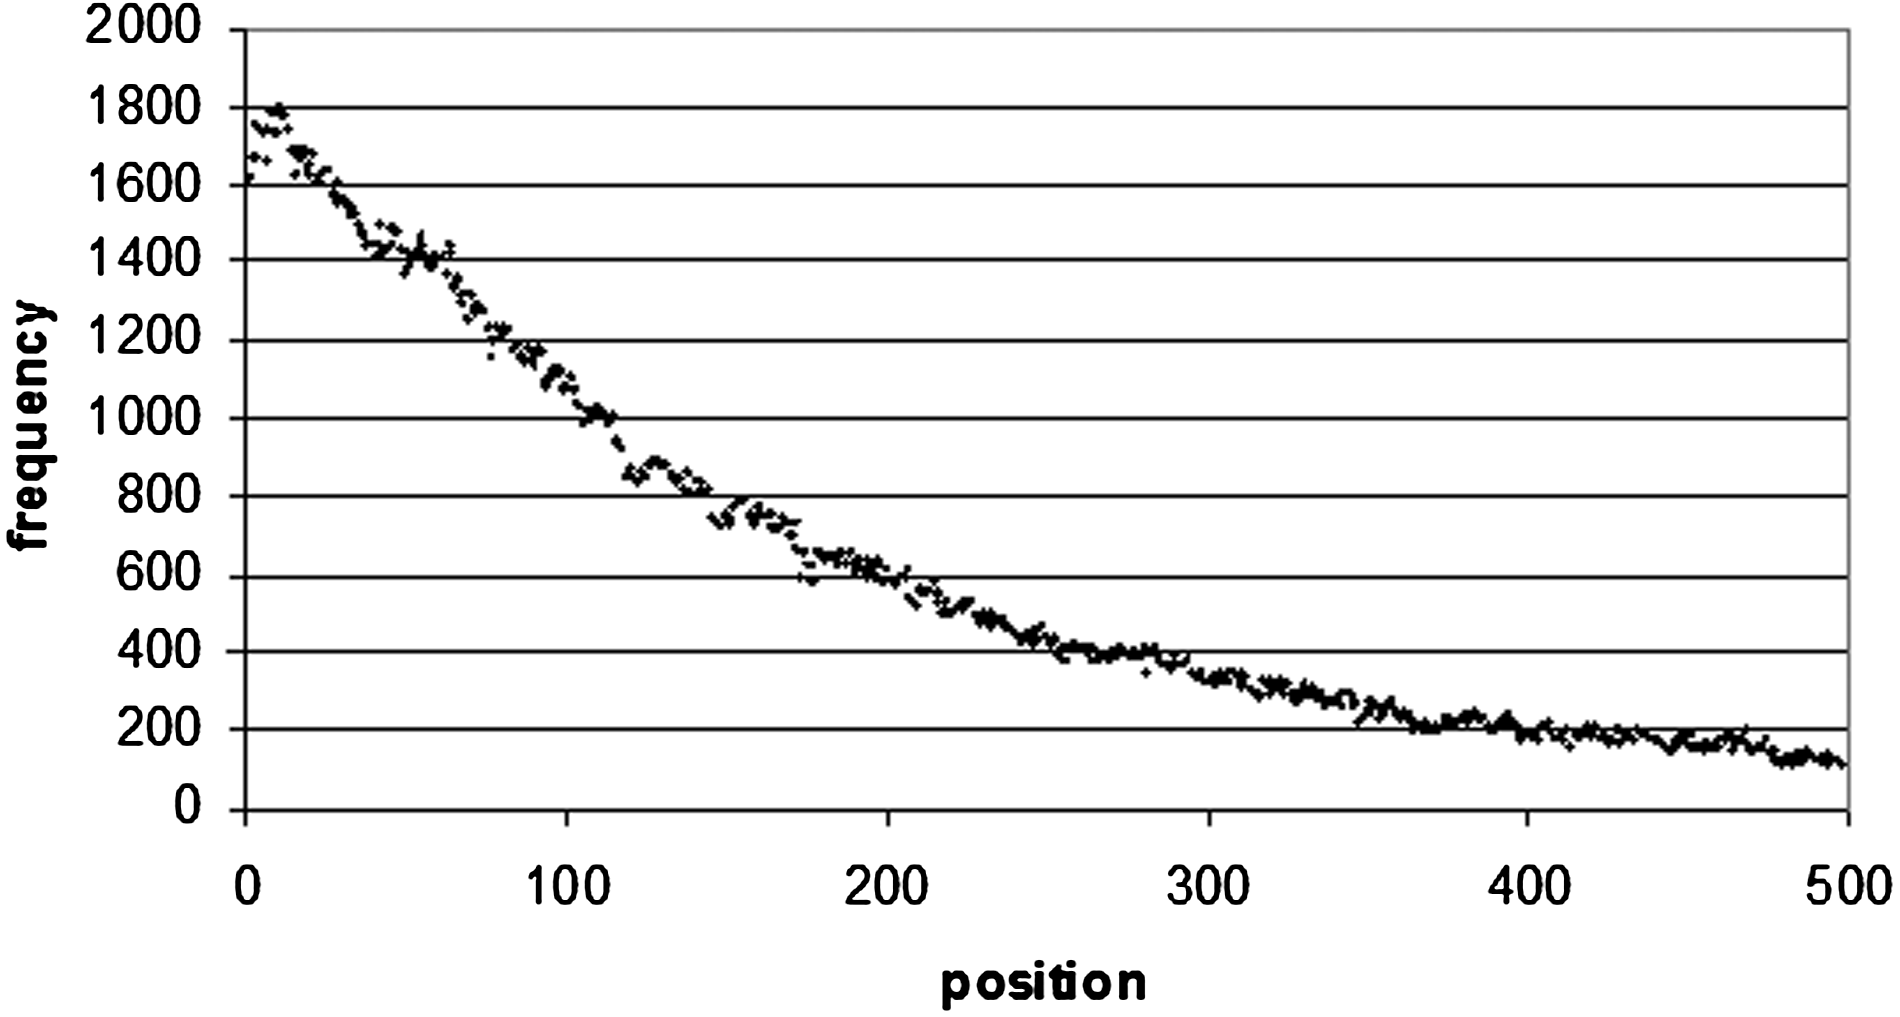
Word positional frequency from the beginning of 5′ UTR. In order to make the diagram more readable, only the first 500 bp were taken from the distribution. The positional frequency values all decrease after 500 bp.
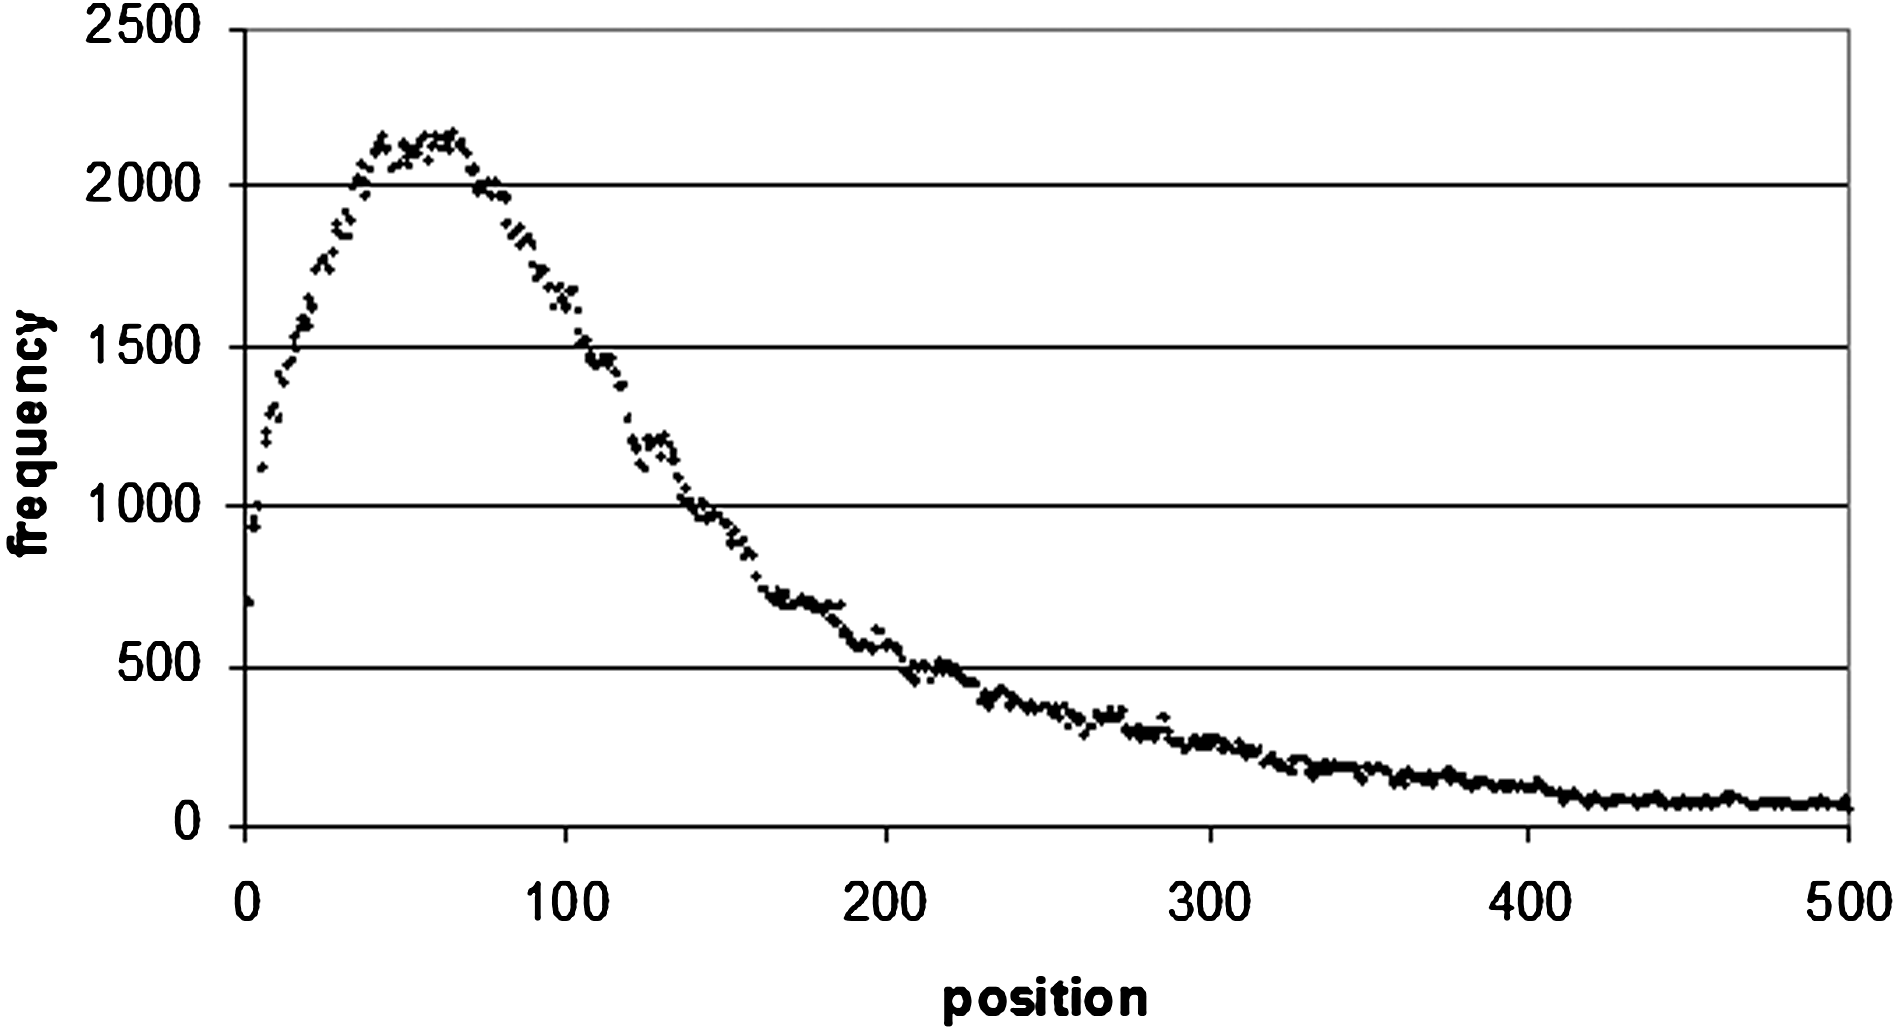
Word positional frequency from the end of 5′ UTRs. In order to make the diagram more readable, only the first 500 bp were taken from the distribution. The positional frequency values all decrease after 500 bp.
Also interesting is the positional occurrence frequency of motifs in the intron sequences (Fig. 6). As we can see the curve is a concave one, with maxima at both ends of the curve. This is where we would expect the splicing machinery to form, therefore regulatory motifs are expected to be found at these positions. Goren and colleagues found that regulatory motifs were overabundant at the exon/intron boundaries in a number of species (Goren et al., 2010).
For the intron sequences and the 3′ and 5′ UTR sequences we studied the positional frequency of the top 100 motifs from the beginning of the sequence to the end, as well as from the end of the sequence to the beginning. In introns, there is a frequency peak at 12 bp from the beginning of the sequence with an occurrence of 16,026. There was also another peak at 22 bp from the end of the intron with an occurrence of 6608 (Figs. 7 and 8). This is because regulatory proteins binding to introns does not occur exactly at the exon-intron junction, but occurs further inside the intron itself.
The situation is the same for 3′ UTR sequences (Fig. 9), where there is a maximum occurrence of the top 100 motifs of 682 at 107 bp from the start of the sequence, and 660 at 104 bp from the end of the sequence (Figs. 10 and 1). Of these 660 sequences, 157 of them are poly(A/T) sequences (which correspond to the sequence WWWWWWWW), which occur frequently at the end of 3′ UTR sequences. A8 occurs 16 times, A7 35 times, and A6 46 times. In 5′ UTRs (Fig. 12) there is a peak of 1789 occurrences 15 bp from the start of the sequence, and 2145 at 68 bp from the end of the sequence (Figs. 13 and 4).
Co-occurrences of words
Genes are usually regulated by more than one regulatory motif, and often transcription factors join together to form regulatory complexes, especially in the proximal and core promoter as well as introns. Therefore we studied the distribution of motif pairs in the core, proximal and distal promoters, introns, 5′ UTRs, and 3′ UTRs in japonica rice. We counted the number of sequences that a given motif pair occurs in, as well as the number of sequences in which it was expected to occur in based on the background base distribution. A list of the top 10 highest scoring motif pairs from the previously mentioned six sequence sets from japonica can be seen in Table 5.
A list of the top 100 highest scoring motif pairs for each sequence set can be found in Supplementary Material 3 (see online supplementary material at http://www.liebertonline.com). Furthermore, we counted the number of motif pairs which were either unique to one sequence set, or which were common to two, three, or four sequence sets. As we can see in Figure 15, there were 316, 56, 24, and 25 such motif pairs. No motif pairs were found in common with Arabidopsis.
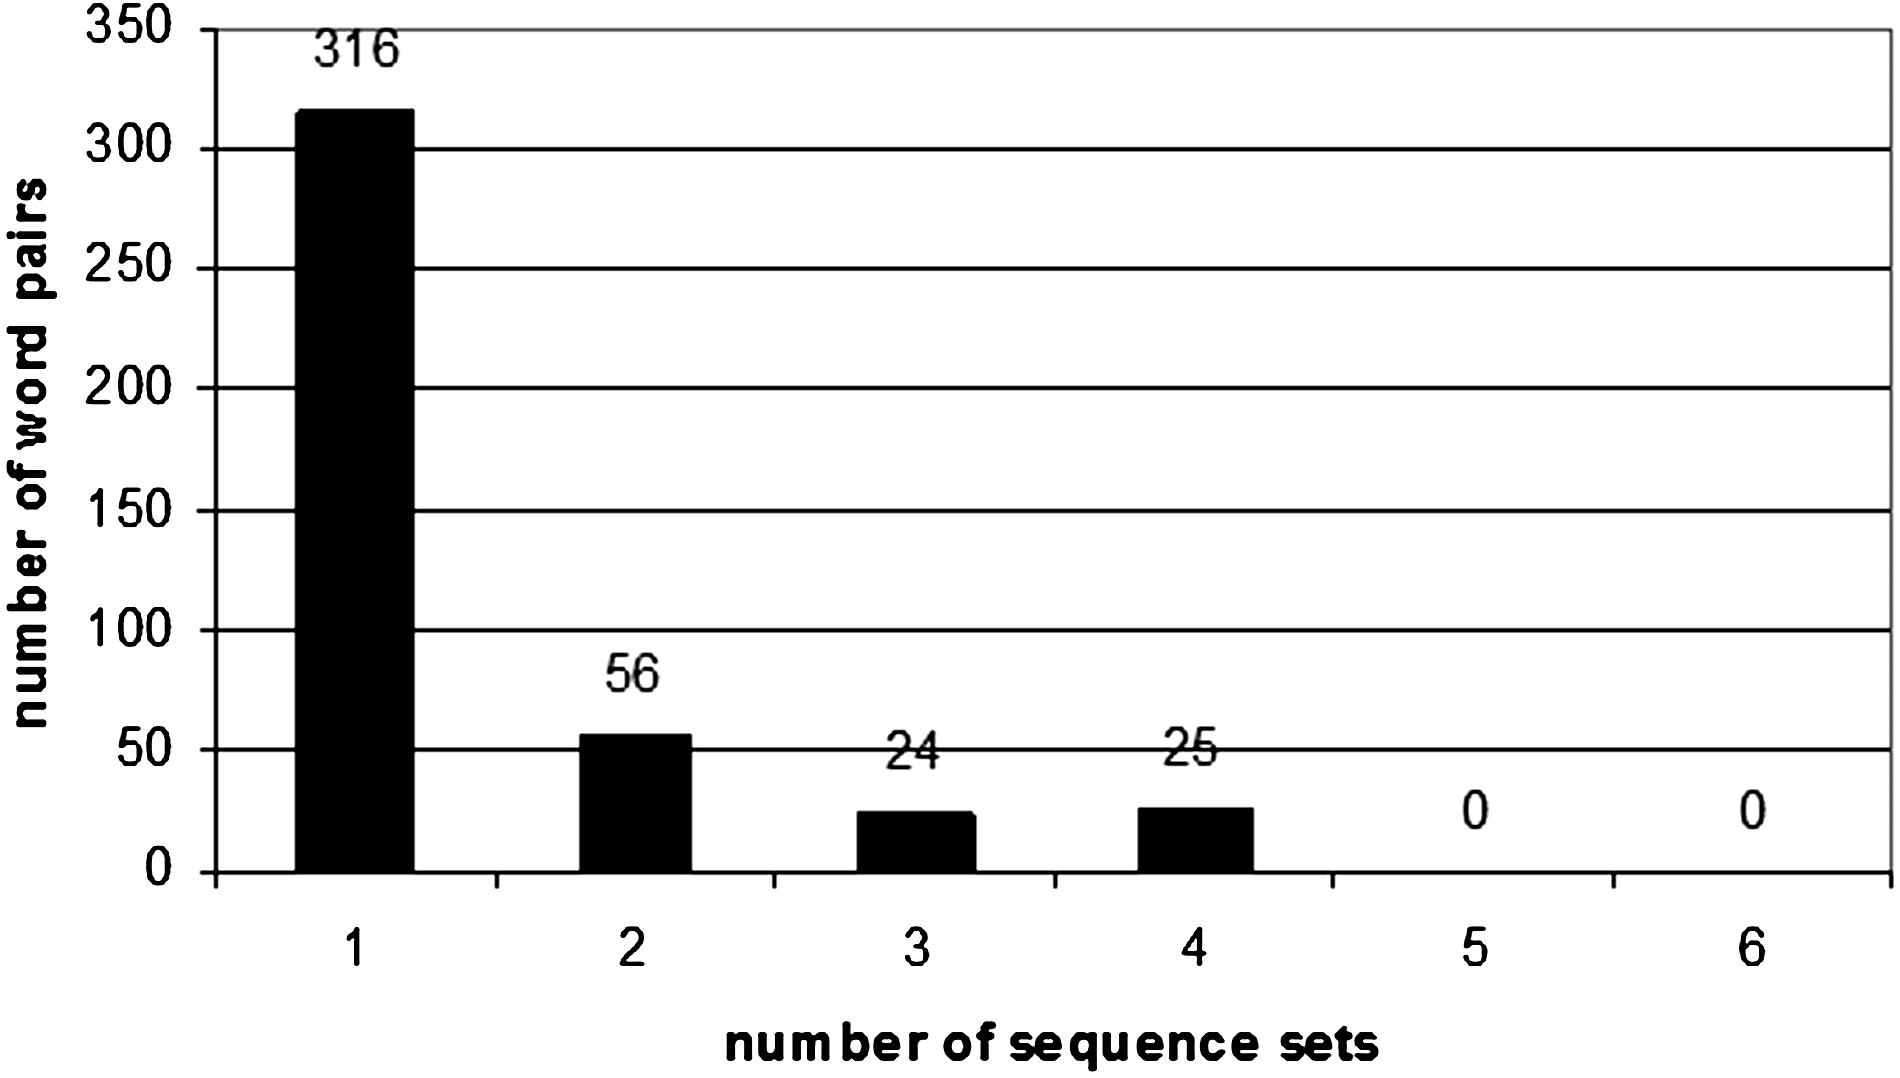
Number of top 100 word pairs common to different numbers of sequence sets in rice.
Functional categorization
In order to see what kinds of genes contained the highest scoring motifs, we studied the distribution of the top 10 words in six of the seven sequence sets (core, proximal and distal promoters, intron, 5′ UTRs, and 3′ UTRs). We searched for Gene Ontology (MSU GOSlim) terms used in connection with a given gene at the Rice Array Database, where we performed GO Enrichment Analysis (Jung, 2008). The GO terms from biological, cellular, and molecular functional categories associated with the top 10 motifs from the six sets were visualized with matrix2png software (Pavlidis and Noble, 2003). The result of this analysis can be seen in the figures associated with Supplementary Material 4 (see online supplementary material at http://www.liebertonline.com). Here GO terms strongly associated with a motif (low p value) are denoted with a green box, while GO terms loosely associated with a motif (higher p value) are denoted with a red box. Where the p value is not present or is higher than 0.01, the box is colored grey.
Discussion
A number of motifs found in our analysis have been found to match experimentally verified regulatory motifs. Besides this, a major novel finding of the application of the algorithm to rice is the prediction of a number of novel putative motifs of yet unknown functions. Of the top 100 motifs from different sequence sets, those common to the core promoter and 5′ UTR might prove to be of significant interest. These motifs can be used in further studies or verified experimentally. The top 100 highest-scoring motifs were also clustered and a consensus sequence defined for them. Compared to the study in Arabidopsis, the statistical measure of these consensus sequences was calculated; the majority were found to be statistically significant. We also predict a number of regulatory motif modules (pairs) in six of these non-coding sequence sets based on the co-occurrence of motifs from the top 100 motif sets. Another novel type of analysis compared to Arabidopsis was the position-specific analysis of the frequency of the octamer words at both ends of the intron sequences and the 3′ UTRs, allowing us to locate the place where motifs occur to which the splicing and transcription machinery binds.
Since the rice word landscape has been analyzed, it is now possible to compare it with the word landscape of Arabidopsis and draw novel insights therefrom. The importance of our findings lies in the fact that compared to the total motif content of Arabidopsis, we found that out of the top 100 motifs found for each of the seven sequence sets, 190 of them were found in at least two of the sequence sets in rice, while 101 motifs were found to be common between rice and Arabidopsis pertaining to these sequence sets. However, when comparing word pair content between the two species, no pairs were found to be in common with Arabidopsis and rice, suggesting that the overall molecular regulatory networks in these two species is different. The reason could be that one is a monocot and the other a dicot. Furthermore, we found no nullmers in rice, indicating that the sequence background in rice results in a larger variability in rice motifs, suggesting a higher mutational turnover of motifs. However, since these motifs are conserved between rice and Arabidopsis, we can infer that these are general regulatory motifs which could be conserved across a large number of species.
A genomic comparison of the total motif content of such species as Arabidopsis and japonica rice can serve as a basis for new areas in the study of the regulatory machinery found in non-coding sequences between species. Total motif content comparison between different species can be used to measure how closely related they are. According to some views, changes in gene regulation are responsible for speciation (Ohno, 1970). Therefore, high scoring motifs found in one species may account for differences between another species where that particular motif has a low score. In fact, our future plans include the analysis of the Oryza sativa indica and Brachypodium distachyon genomes. Comparison of the two Oryza sativa genomes would prove to be of interest, as these two species are very closely related and are therefore expected to contain a very high number of motifs common to the japonica genome.
Lichtenberg and associates (2009b) studied the distribution of word motifs in unidirectional and bidirectional promoters involved in DNA repair pathways in humans and found a subtle, yet still discernible, signature for bidirectional promoters. Similar studies between differently regulated genes could show which specific motifs are responsible for the regulation of different biochemical pathways or physiological processes. Similar motif content may point to regulatory overlaps between different pathways or processes, such as in ABA-dependent and ABA-independent abiotic stress pathways in plants (Yamaguchi-Shinozaki and Shinozaki, 2005).
Conclusion
The total octamer motif content of rice has been enumerated and analyzed. Although the algorithm applied to the rice non-coding sequences is not new, a number of novel and interesting insights and improvements were made based on the analysis of the japonica genome and its comparison with the corresponding Arabidopsis sequence sets. Therefore the present study serves as an excellent follow-up analysis of both plant genomes. The study and comparison of the word landscape of different species could help in opening up a new chapter in genomics with the analysis of an organism's so-called “motifome,” which we define as the listing and statistical ranking of all possible motifs in a given genome.
Footnotes
Author Disclosure Statement
The authors declare that no conflicting financial interests exist.
References
Supplementary Material
Please find the following supplemental material available below.
For Open Access articles published under a Creative Commons License, all supplemental material carries the same license as the article it is associated with.
For non-Open Access articles published, all supplemental material carries a non-exclusive license, and permission requests for re-use of supplemental material or any part of supplemental material shall be sent directly to the copyright owner as specified in the copyright notice associated with the article.
