
Abstract
Abstract
Massive amounts of transcriptomic data documenting plant responses to changes in environment continue to accumulate in online databases. Unfortunately, many of these data sets have not been analyzed in full detail, especially those that involve time course experiments. To gain more knowledge of the successive gene expression events that occur when stress is initiated in one organ and then relayed to another, we have chosen stress response data for Arabidopsis shoots and roots from the detailed time course study of Killian et al. as a promising source to mine. Using refined statistical analysis, modified vector analysis, and a GO enrichment algorithm, more information was revealed concerning the effects of salt and UVB on gene expression events in shoots and roots over a 24-h time period. GeneMania, with in-house modifications, was used to further analyze abscisic acid (ABA) and jasmonic acid-related (JA) gene expression events in salt-stressed roots and shoots. JA effects appeared to be quite distinct in roots when compared to shoots, especially with respect to the expression of members of the negative regulatory JAZ gene family. In contrast, ABA-related gene expression events were more similar in the two organs. Instances of crosstalk between hormones were observed, as were early responses of regulatory genes involved in both auxin and cytokinin signaling. In the case of each hormone class examined, hormone biosynthesis genes were coexpressed with the genes encoding negative regulators of the corresponding signaling pathway. Hypotheses to explain this finding and future experiments to further explore these nonlinear phenomena are proposed.
Introduction
Many hormones, including auxin and cytokinins, are integral parts of stress signaling (Chen et al., 2010; Iglesias et al., 2011; Ryu et al., 2010; Wang et al., 2010), in addition to abscisic acid (ABA) (Hirayama and Shinozaki, 2010; Raghavendra et al., 2010), ethylene, and jasmonic acid (JA) (Chen et al., 2010). Crosstalk between hormone-mediated pathways is the rule and not the exception (Mason et al., 2010; Wang et al., 2010). In some cases, such as the connection between JA and ABA signaling, the same key transcription factor, AtMYC2, is known to be involved in both pathways (Abe et al., 2003; Browse, 2009). JA, ethylene, and auxin signaling resemble each other with respect to the nature of the E3 UQ ligases that link them to the UQ/26S proteasome pathway (Santner and Estelle, 2010). It is not surprising that increasing numbers of direct causal links between developmental events and stress responses continue to be reported, for example, a SOS3-mediated effect on lateral root development under salt stress that is regulated by auxin (Zhao et al., 2011).
Many studies have focused on molecular responses to abiotic stress in the aboveground organs of model plants such as Arabidopsis. Although addressed in a few recent studies (Dinneny et al., 2008; Gong et al., 2005; Kang et al., 2011; Park et al., 2010), much remains to be learned about specific events occurring in the root over time in response to “underground” stresses. Even though stress signals are rapidly transferred between shoots and roots (Kilian et al., 2007), the relationship of the changes in the shoots subsequent to those taking place in the roots, and vice versa, is not well understood either. The rapidity with which signals travel in either direction and the respective components of responses at the level of gene expression in each organ remain to be elucidated. Root-to-shoot signals were first identified as arising from ABA-mediated responses (Jiang and Yu, 2009), but other phytohormones, such as JA and ethylene, and other unexpected factors, such as sulfate (Ernst et al., 2010), were recently proposed to play a role in this long-distance signaling process (Hasegawa et al., 2011).
The study of Kilian et al. (2007), generated by the DFG-funded Arabidopsis Functional Genomics Network (AFGN), provides an extensive analysis of the gene expression events that occur in parallel in roots and shoots of salt- and UVB-stressed plants over the course of 24 h. This data set was obtained from hybridization of samples from roots and shoots over a 24-h period to Affymetrix Arabidopsis arrays (the “ATH1” chip), containing probes corresponding to the transcriptome, as it was constructed in 2004 (inferred to be ca. 23,000 protein coding sequences), The authors' analysis did not delve deeply into questions of affected pathways or functional categories to which responsive genes belong. New, pertinent, information is also continuously being made available concerning plant responses to abiotic stress, collated by software tools such as GeneMania. GeneMania is a tool that allows the retrieval and visualization of documented associations among genes and their products (e.g., coexpression from transcriptomics data, protein–protein interaction from yeast-two-hybrid data, and colocalization by cell type). Tools such as GeneMania, as well as the traditional literature, can be mined for newer information that potentially can shed light on the functional roles of genes identified in this large data set (Warde-Farley et al., 2010).
To gain more knowledge of the gene expression events that occur when stress is initiated in one organ and relayed to another, we have chosen to analyze the stress response data for roots and shoots from the detailed time course study of Kilian et al. (2007). We first report here on the use of a rigorous statistical method (GLM and MULTTEST procedures in SAS, version 9.2, SAS Inc., Cary, NC) to identify responsive genes, and a novel tool to conduct a modified vector analysis to visualize genes whose responses were unique, shared, or opposite in roots and shoots. We have also developed proportional Venn diagrams applied over the time course of the experiments to display changes in numbers of responsive genes over time, and the extent of overlap in the number of genes expressed at any pair of time points. Enrichment of Gene Ontology (GO) categories corresponding to the genes responding over time to salt and UVB stress was identified using the Ontologizer tool, and the results were visualized as heat maps. Following the Ontologizer classification, GeneMania was used to visualize networks documenting associations between salt-responsive genes and others. The GeneMania results, plus information about subcellular location, obtained from another source (Kaundal et al., 2010), were then used to identify putative networks involving ABA and JA-related gene expression events specific to shoots or roots under salt stress.
Materials and Methods
Choice of data sets
An initial data set, where different stresses were applied to uniformly growing plants at the same developmental stage and samples from different organ were harvested, represents a base for building upon existing mechanistic hypotheses. The stress data sets reported in Kilian et al. (2007) have at least six time points spanning a range from 0.5 to 24 h and two organs (roots and shoots), thereby affording the possibility of identifying both earlier signaling events and later downstream events and enabling the identification of organ-specific patterns of responses to stresses. In contrast, the data sets of Gong et al. (2005; Dinneny et al., 2008; Hasegawa et al., 2011), although very valuable, each contain results from only one or two time points or only one organ.
Selection of raw microarray data and preprocessing
AtGenExpress stress data sets (salt, UVB light) and the control data set were retrieved from the GEO Website (http://www.ncbi.nlm.nih.gov/gds?term=AtGenExpress). Plant materials, growth conditions, stress treatment, and sampling procedures have been described (Kilian et al., 2007). The expression profiles of Arabidopsis (wild-type ecotype Col-0) were generated using the Affymetrix ATH1 gene chip, which allows the detection of approximately 19,080 protein-encoding genes.
Data preprocessing of the downloaded raw microarray data was performed in R with the “affy” package. Quality control was then performed using the “QCReport” function. Present calls were determined using the function “mas5calls” (with default settings). A probe set is considered “present” if it is called as “P” in both replicates of at least one condition. Normalized gene expression values (log2 scale) were obtained using the “rma” function with background correction, quantile normalization, and median-polish summarization steps included.
Statistical analysis of differentially expressed genes
Analysis was performed on the 19,098 genes for which signals were present in at least one data set for both replicates and both conditions. A statistical model was used to determine which genes had a significant difference in signal intensity between stress and control groups. Samples were taken at each time point for both stress and control conditions. This comparison was made at all levels of organ and time. The model, which was applied to each gene, is as follows:
where yijkl represents the signal intensity at the ith level of stressor, jth level of organ, kth level of time, and lth replicate. There were two replicates in this experiment so l=1,2. α i represents the effect of the stressor where i=1 corresponds to the control group and i=2 corresponds to the stressor group. The β j terms represent the effect of the organ, where j=1 corresponds to the root and j=2 corresponds to the shoot. The effect of time is represented by τ k , where each level of k represents a different point in the time course. In this experiment there were six time points for UVB and five time points for salt. (αβ) ij , (ατ) ik , (βτ) jk , (αβτ) ijk represent all two-way and three-way interactions among stress status, organ, and time point. The error term ɛ ijkl was assumed Gaussian with a mean of zero and variance=σ2, and Σ i α i = Σ j β j = Σ k τ k = Σ i Σ j (αβ) ij = Σ i Σ k (ατ) ik = Σ j Σ k (βτ) jk = Σ i Σ j Σ k (αβτ) ijk = 0.
Model 1 was fit for each of the present 19,098 genes using the GLM procedure in SAS (version 9.2, SAS Institute). The above model was then used to estimate the difference between stress signal and control signal at each time point and organ. Our model accounts for interaction between organs (roots or shoots), time, and stress status (control, salt, or UVB). The comparison between control and stress status conducted on the basis of this model is valid for all genes regardless of whether interaction is present or differs between genes. The MULTTEST procedure was used to control the false discovery error rate (FDR) at 5%. Under this adjustment, one expects at most 5% of the tests that show a difference between stress and control status to be false positives. These tests conclude that stress and control groups differ in regulation if the observed difference in the expression levels is implausibly zero in nature after taking experimental variability into account.
Temporal gene regulation patterns
Temporal gene regulation patterns were generated for each organ under each stress condition based on the discrete values of significant changes, with “1” referring to significant up-regulation, “0” for no significant change, and “−1” for significant downregulation. The number of genes that fall into each of the temporal regulation pattern were counted and summarized.
Gene Ontology enrichment analysis
Overrepresentation analysis (ORA, #1) was performed using Ontologizer software (Bauer et al., 2008) (available from http://compbio.charite.de/index.php/ontologizer2.html) for each of the comparisons between stressed organ and its control at a specific time point. The calculation method “Topology-Elim” (Alexa et al., 2006) was used in conjunction with the multiple test correction (MTC) method “Westfall-Young-Single-Step” (Kohne and Pigeot, 1995) with 10,000 resampling steps. All the upregulated and downregulated gene lists were subjected to the ORA analysis separately after mapping to the known AGI IDs based on the Affymetrix probe set to AGI mapping file (“affy_ATH1_array_elements-2010-12-20.txt,” available from ftp://ftp.arabidopsis.org/home/tair/Microarrays/Affymetrix/). The universe of nonredundant AGI IDs for all probe sets on the ATH1 array was used as the population set. A file contains the GO terminology and structure in the OBO format (“gene_ontology.1_2.obo,” available from ftp://ftp.geneontology.org/pub/go/ontology/obo_format_1_2/) and a file containing associations from genes to GO terms (“gene_association.tair,” available from http://www.geneontology.org/gene-associations/) were used in the analysis.
Heat map generation
The Ontologizer output files from upregulated and downregulated gene sets were organized separately across time points per organ (roots or shoots). The adjusted p-values from MTC analysis with Westfall-Young-Single-Step method were converted to the minus logarithm (at base 10) values (referred to as “negLog10P”) and rounded to the nearest integers. The top 50 significant GO terms were determined by the sum of the negLog10P values across all the time points and organs and were subjected to heat map generation using an enhanced heat map function “heatmap.2,” which is available in the R CRAN package “gplots.”
Gene functional network inferences
To infer possible gene functions, groups of genes of interest, identified by keyword search in their gene functional annotation and associated GO term and filtering based on expression pattern, were subjected to analysis in GeneMANIA (freely available at http://www.genemania.org) (Montojo et al., 2010; Warde-Farley et al., 2010). The GeneMANIA Cytoscape plugin (version 2.0) and associated data set (data version: 2010-12-01) were installed in Cytoscape (version 2.8.1, available at http://www.cytoscape.org/), using the Bubble Router plugin in Cytoscape 2.6.
Four separate sources of data were used to generate the networks, only three of which were obtained from GeneMania. These were coexpression from microarray data, colocalization by cell type, and physical interaction data, from yeast-two-hybrid results. Analysis of the GeneMania-derived results was conducted using the default network weighting method, with the number of related genes being limited to 20. Additional information, not provided by GeneMania, concerning gene product localization predictions generated by AtSubP (Kaundal et al., 2010) was then added to the network images. Predicted interactions were excluded from the analysis. For all analyses conducted in GeneMania, the gene expression data set from Kilian et al. (2007) was eliminated, and, therefore, the edges in the resultant networks reflect only interactions gleaned from newer, biologically proven, data, including protein–protein interactions. Resultant networks were modified to include additional expression and functional information with our in-house programs. The images presented are, thus, a compendium of relationships inferred from four data sources, and do not represent actual cells, in any way.
Results
Although regulation of gene expression encompasses many processes, such as transcriptional and translational activities, mRNA and protein modification and stability, in this report, for simplification purposes, we use the following terms: “regulated,” “upregulation,” and “downregulation” to describe change of, increase or decrease in, mRNA accumulation, detected in microarray analyses.
Comparison of statistical analysis methods
Instead of the fold change criteria adopted by Kilian et al. (2007) for identification of regulated genes, we used a significance test analysis which incorporates a FDR adjustment (see Materials and Methods). The FDR method allows the user to control the false positive rate and also detects regulation in genes below traditional fold change thresholds. FDR-adjusted significance testing is preferable to the fold change method because FDR tests can detect regulation present in a larger number of genes, and the false positive rate is automatically quantified in the FDR method. The FDR adjustment was first discussed in Benjamini and Hochberg (1995). To use FDR to control for an error rate, a quantifiable error rate is necessary. Because fold change analysis does not have a quantifiable error rate, it precludes the use of FDR.
For each organ and time point, the numbers of regulated genes for UVB and salt stress were calculated using the fold change and the FDR methods (Figs. 1 and 2). In both stresses, the count of regulated genes is higher according to the FDR method compared to the fold change method. This is because the FDR method declares regulation if intensity differences between control and stress are implausibly zero after accounting for variability in the data, whereas the fold change method declares regulation only if the fold change is greater than three or less than one-third. Whichever method is used, regulated gene counts are always higher in the organ on which the stress has been applied (roots for salt stress and shoots for UVB).

Bar plot of number of regulated genes at each time point for both organs during the UVB stress obtained by both fold change and FDR methods. Positive values on the vertical axis correspond to upregulation, and negative values correspond to downregulation.

Bar plot of number of regulated genes at each time point for both organs during the salt stress obtained by both fold change and FDR methods. Positive values on the vertical axis correspond to upregulation, and negative values correspond to downregulation.
Early gene expression events in responses to stress
Representing data in a simple meaningful way has always been a challenge for microarray analyses. Traditional Venn diagrams, a compact way to convey “omics” data, can be used to compare and contrast the number of genes regulated at a given pair of time points as well as the number commonly regulated in both time points. Line graphs can be used to depict the behavior of known stress-responsive genes over time. It is quite difficult to visually extract biological meaning from such summaries, but they are a useful first step in data analysis. To graphically summarize the results, we have combined the results of the FDR approach with a more general “expression plot,” defined as any plot that summarizes gene regulation in one or more backgrounds. The vector-style analysis was employed to glean detailed information about gene expression events occurring at the 30-min time point (Figs. 3 and 4). Vector-style analysis can be used to classify a gene's behavior for two “backgrounds,” which can be genotypes or organ, for example (Breitling et al., 2005). A vector analysis plot is a scatter plot of change in expression values in one background on the x-axis and change in expression values in the other background on the y-axis. The scatter plot is divided into eight nonoverlapping parts (corresponding to the eight possible combinations of up, down, and nonregulation in both backgrounds), and directionality of gene expression is defined according to which region a given gene falls.
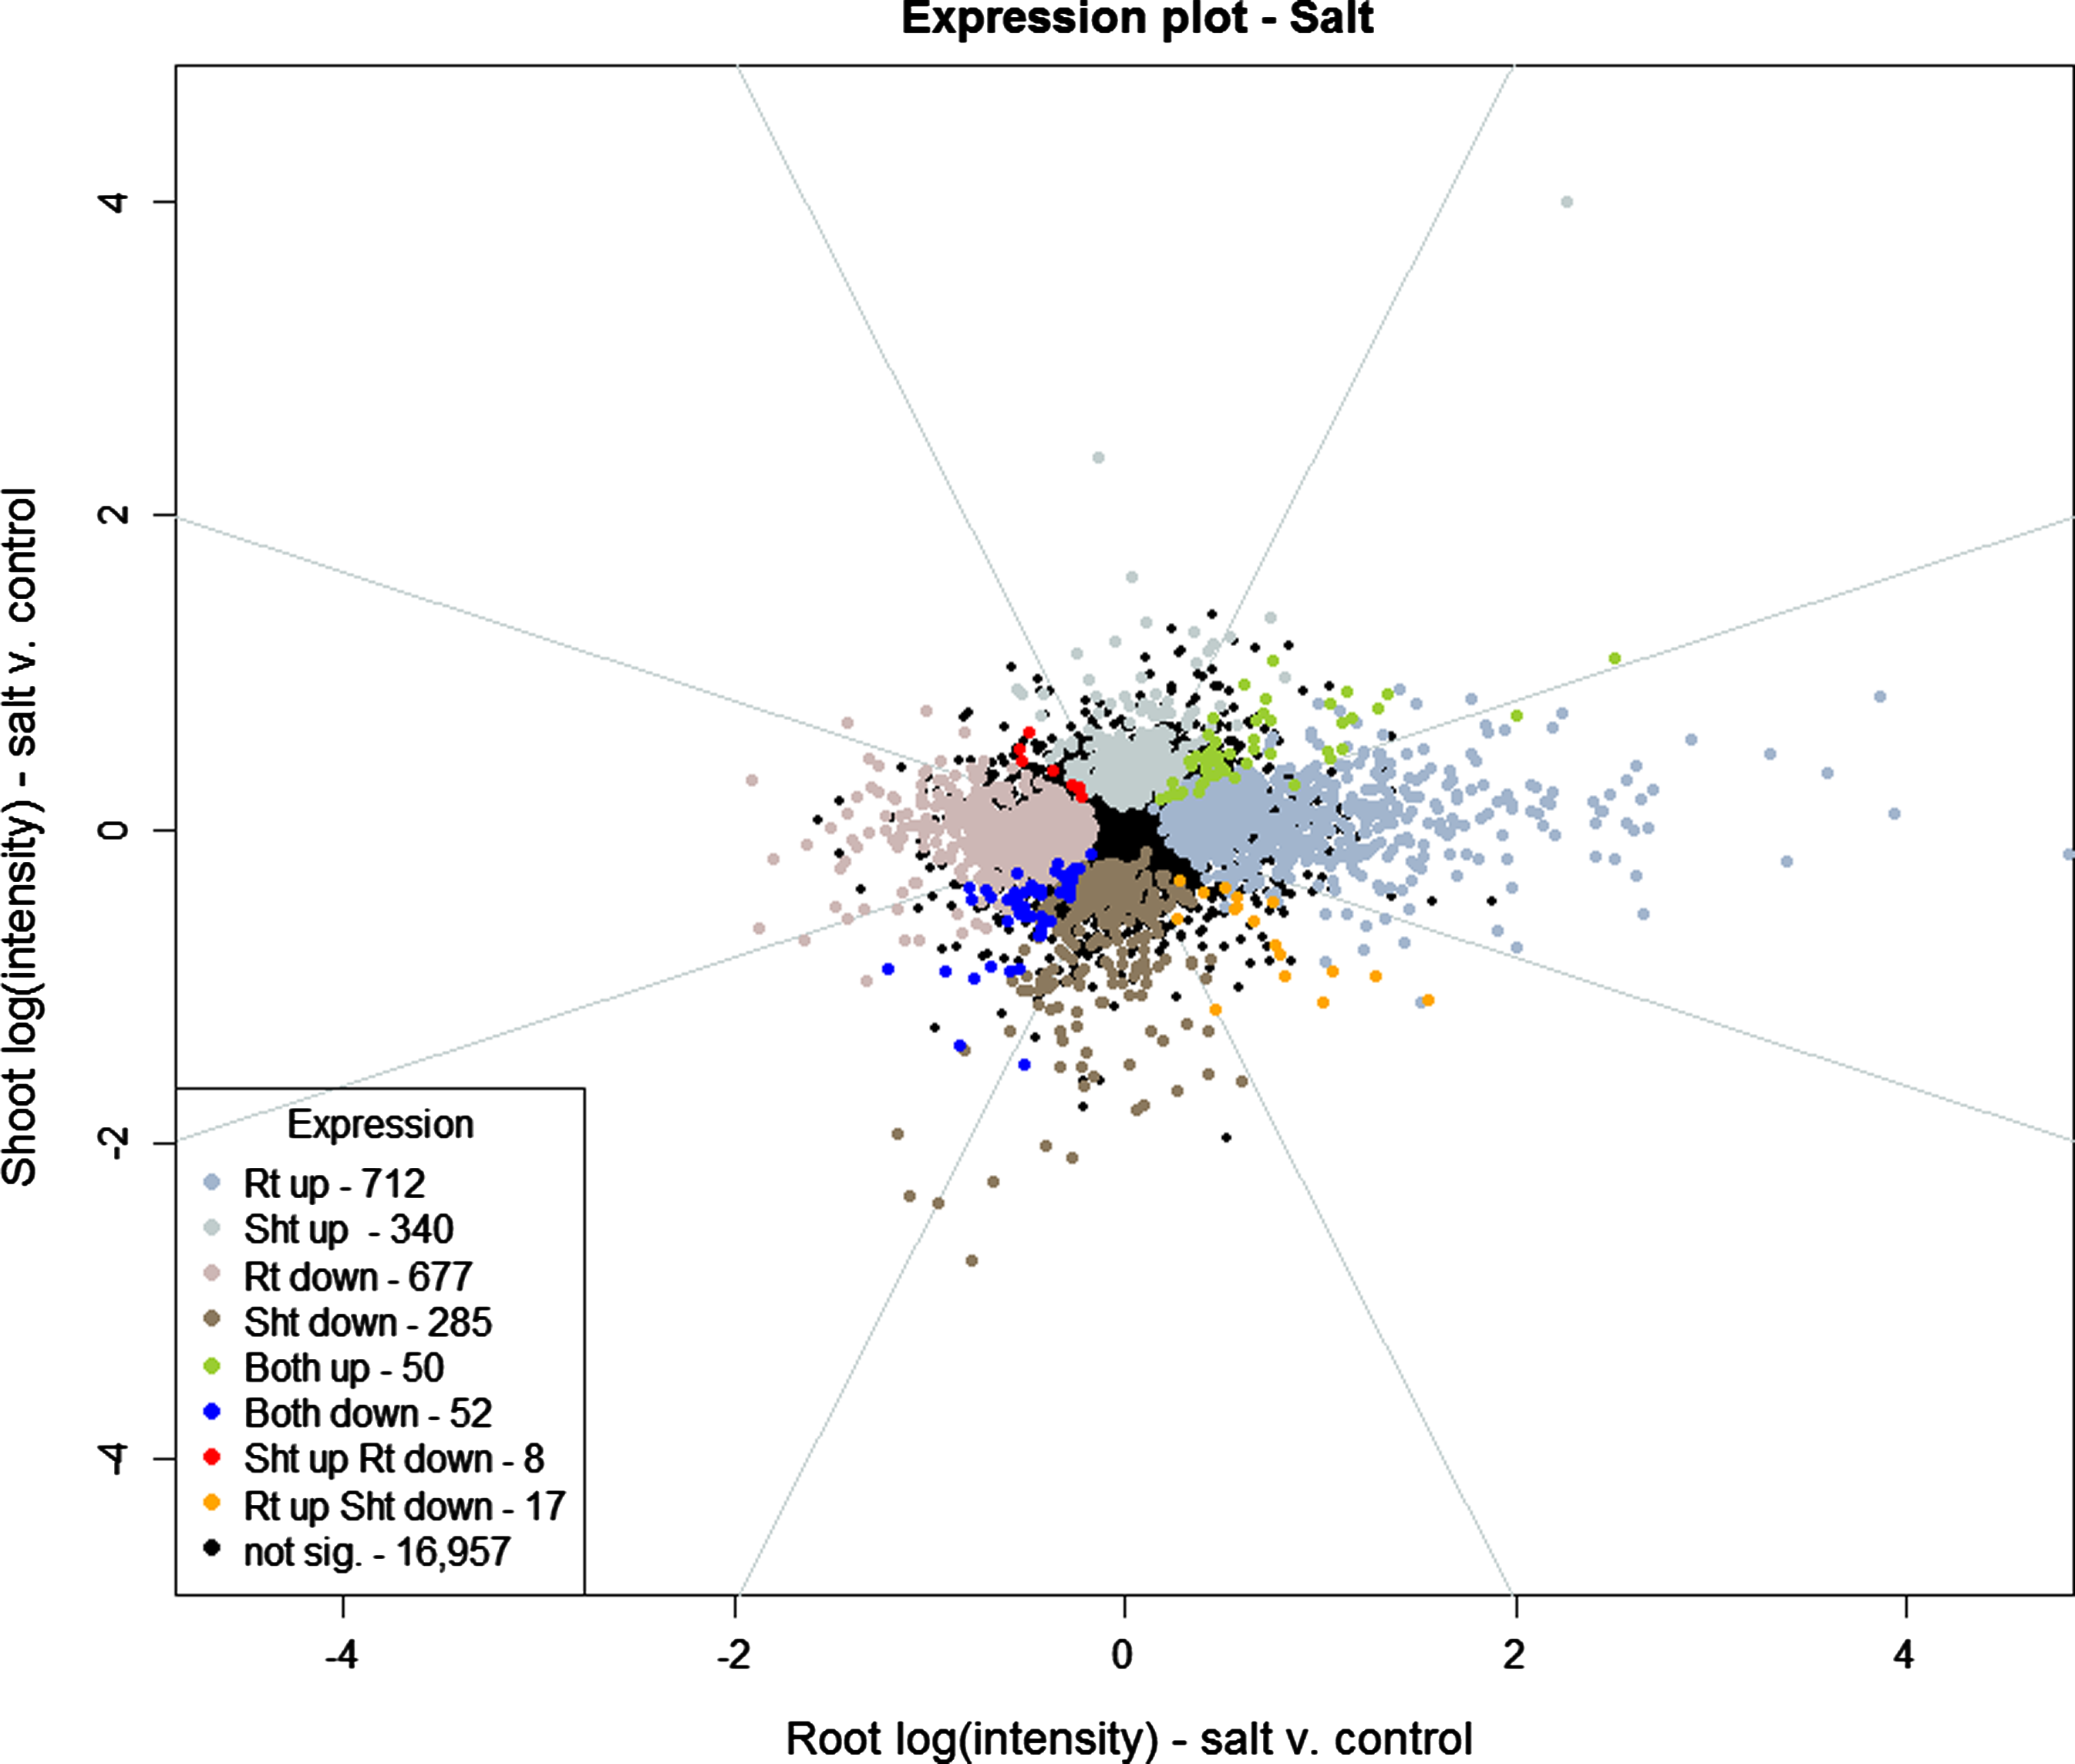
Vector analysis plot comparing regulation in roots and shoots between salt-stressed and control groups at 30 min. Up- and downregulation are declared based on the results of fitting Model 1 (see Materials and Methods). Azure octant lines show Breitling et al. (2005) classification regions.
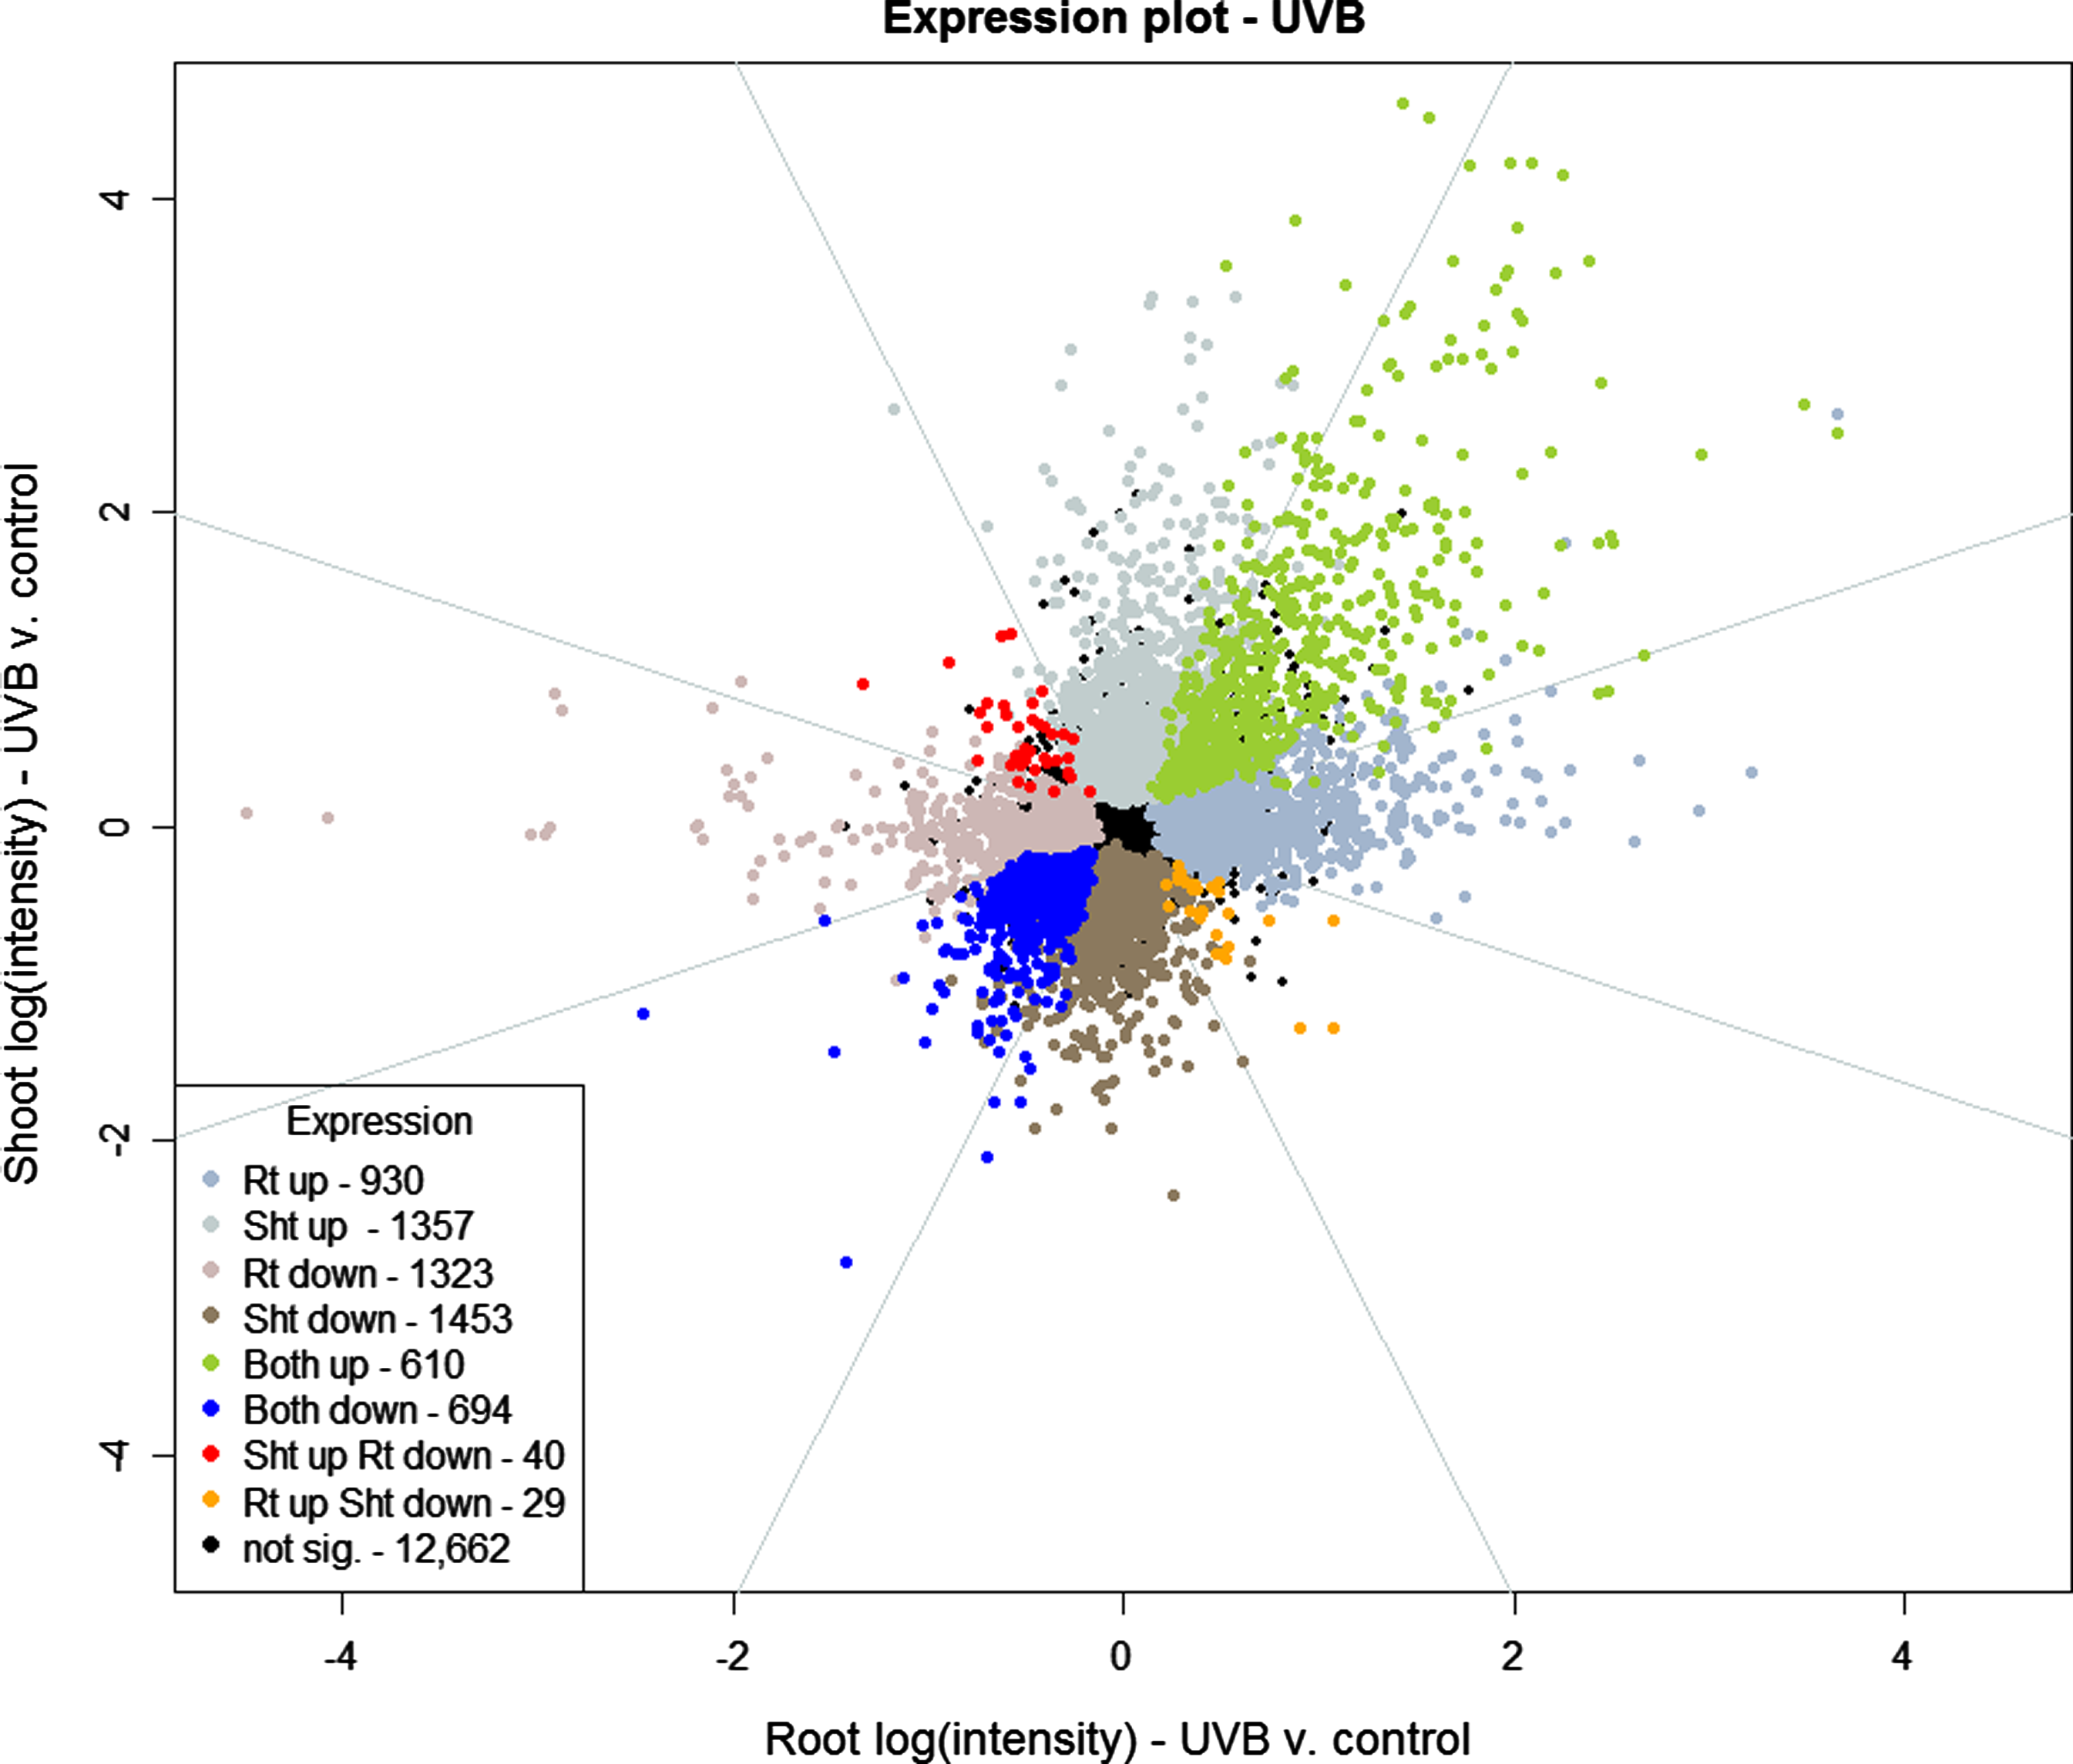
Vector analysis plot comparing regulation in roots and shoots between UVB-stressed and control groups at 30 min. Up- and downregulation are declared based on the results of fitting Model 1 (see Materials and Methods). Azure octant lines show Breitling et al. (2005) classification regions.
Of the 19,098 genes under investigation, 16,957 show no pattern of regulation in the salt versus control treatment (Fig. 3) at the 30-min time point after FDR analysis. The remaining 2,141 genes show some regulation pattern in roots, shoots, or both. Of the 2,141 genes that are regulated, 2,014 are expressed in either roots or shoots, but not both. Only 127 genes are regulated in both roots and shoots, and 102 of these are regulated in the same direction. The corresponding numbers for UVB stress are 12,662 nonresponsive genes, 5,063 responsive in either roots or shoots, but not in both, 1,373 genes responsive in roots and shoots, and, of those genes, 1,304 responded in the same direction. As observed above for the whole time series, a greater number of genes are regulated in roots compared to shoots for the salt treatment after 30 min, and vice versa for the UVB stress.
Proportional Venn diagrams were then used to discern any differences that may exist in the number of genes expressed across the time course in roots and shoots between any two time points (Figs. 5–8). The goal was to gain some insight into the number of gene expression events (e.g., signal processing, response, adaptation) that may occur over the 24-h time course of response to salt or UVB. Each gridblock in the array represents the 19,098 genes under investigation, and the area of each region in the gridblock is proportional to the number of genes in that region. A comparison of the areas between shoots and roots reflects the observation that more genes are regulated in roots than in shoots in response to salt stress. The degree of overlap between any two spheres indicates the number of genes regulated at both time points but does not indicate the identity of those genes.
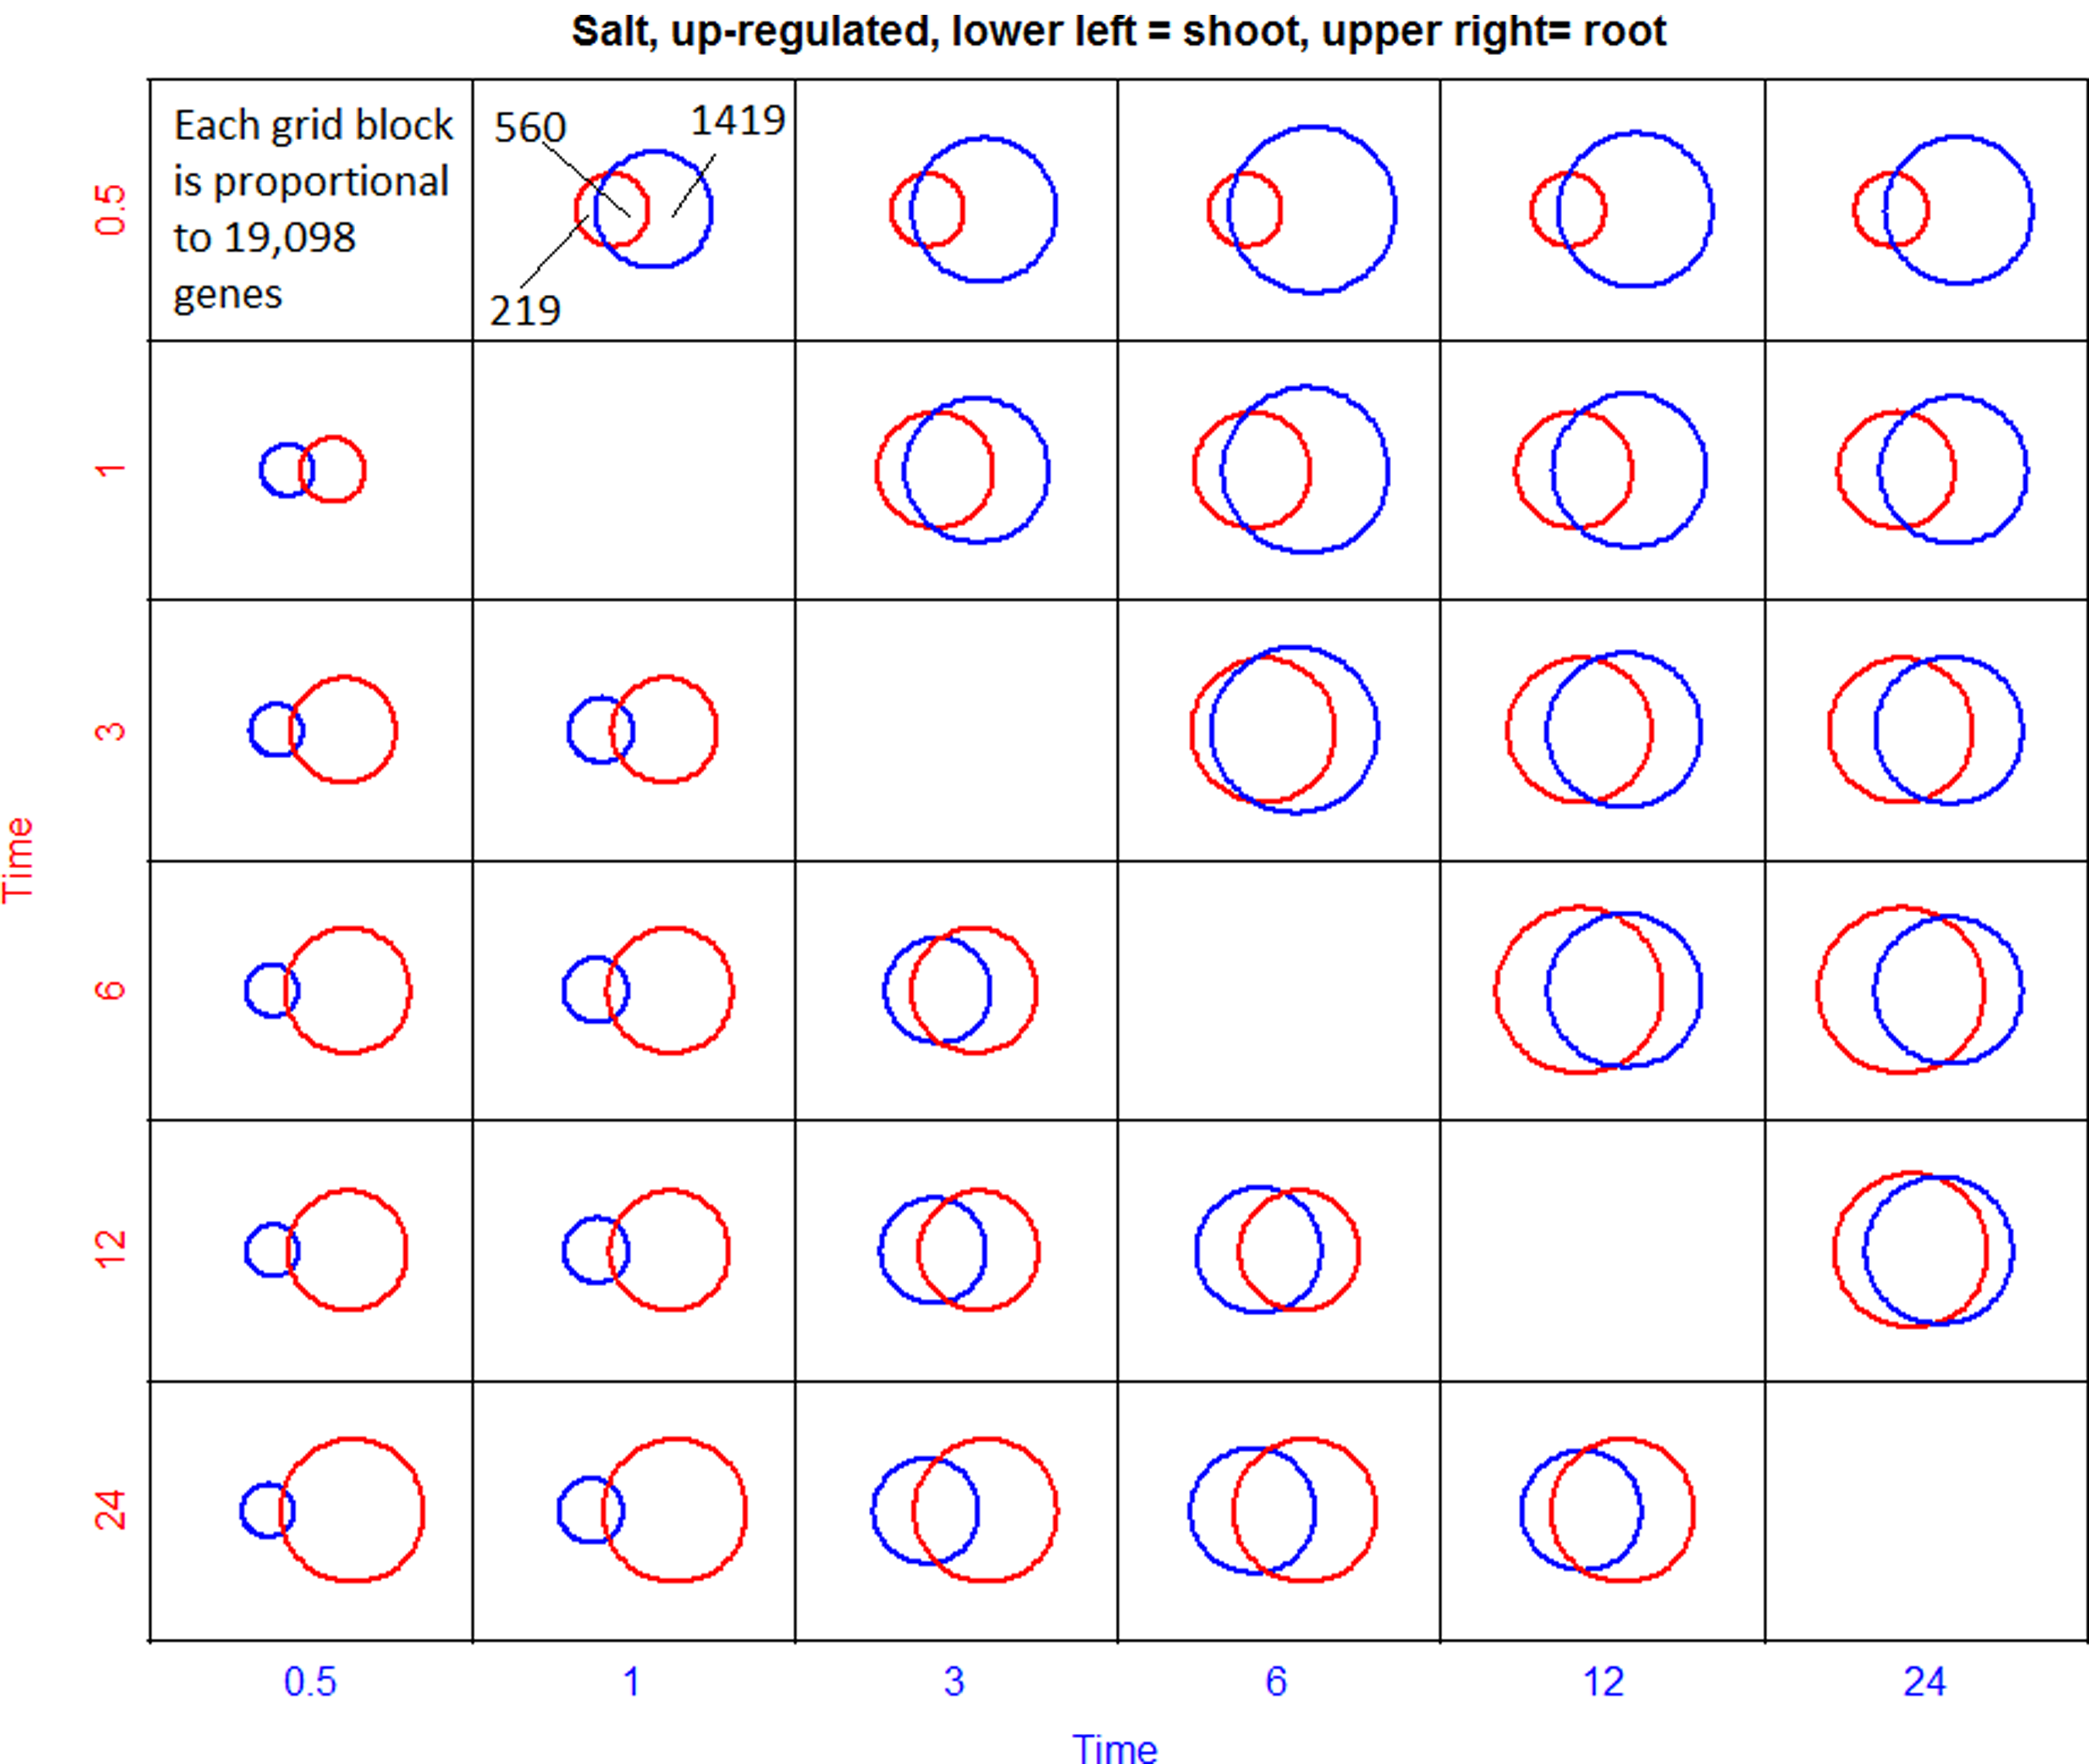
Proportional Venn diagram array summarizing upregulated genes in the salt condition throughout the time course. Each grid block represents the 19,098 genes under investigation. Each circle and intersection is proportional to the number of genes in each set. Lower left triangle summarizes shoot responses and upper right triangle summarizes root responses.

Proportional Venn diagram array summarizing downregulated genes in the salt condition throughout the time course. A greater number of downregulated genes appear in the root because salt stress originates in the root. See legend to Figure 5.

Proportional Venn diagram array summarizing upregulated genes in the UVB condition throughout the time course. See legend to Figure 5.

Proportional Venn diagram array summarizing downregulated genes in the UVB condition throughout the time course. See legend to Figure 5.
The degree of overlap between gene sets among adjacent time points increased at later time points in both shoots and roots, suggesting that more genes are commonly regulated at the later time points. In both roots and shoots, the number of genes that are upregulated also generally increases throughout the time course, as shown by the increase in the area representing regulated genes. This increase could potentially be due to amplification of adaptive, downstream events that are set in motion by imposition of the stress. The diagrams also show that more genes are downregulated than upregulated (Fig. 5) in roots in response to salt stress. The opposite is true for the shoots.
For the UVB stress, the number of upregulated genes in roots is stable across time among all comparisons made in the proportional Venn diagrams (Fig. 7). The identity of upregulated genes changes across time as can be inferred from the relatively small overlap between any two time points. In shoots, the largest number of upregulated genes is observed at 6 h and declines later on. Roots experience a decline in the number of downregulated genes at 6 and 12 h (Fig. 8). Interestingly, the overlap between time 6 and 12 is the smallest compared to other time points, whereas the intersection is the highest between time 3 and 6 h in shoots (Fig. 8). Contrary to salt stress, it seems the peak of the response to UVB happens after 3–6 h, and there is a slow return to a basal state after these times, with less genes showing regulation compared to the untreated control. This could be due to the fact that the plants are subjected to salt stress for the duration of the experiment, while they only experienced 15 min of UVB stress at time 0.
Responses to salt stress in shoots and roots as revealed by GO enrichment analysis
Specific processes and pathways responding to the stress treatments were identified by GO enrichment analysis. Overrepresentation analysis of the effects of salt stress on roots and shoots indicated that up- and downregulated genes were enriched significantly in 49 and 47 Gene Ontology biological process terms, in at least one of the time points under study in either organ (Fig. 9a and b).

(
Spatiotemporal distribution of enriched upregulated gene categories (Fig. 9a) demonstrated that the early responses to salt stress (at time points 0.5 and 1 h) occurred predominantly in roots. The early responsive upregulated genes categories included terms associated with responses to hormone stimuli and/or to various stresses. No GO term was identified as significantly enriched with upregulated genes in the earliest time points in shoots. This time lag is in agreement with the model of salt stress signals being initially captured and processed in roots and then amplified and transduced throughout the entire plant.
Among those hormones that are directly associated with enriched hormone-related GO terms were ABA, JA, salicylic acid (SA), auxin, and ethylene. Both upregulated and downregulated genes were identified as significantly overrepresented in the term “response to auxin stimulus” (GO:0009733). However, only upregulated genes were enriched in most of the other hormone stimulus responsive terms: response to ABA stimulus (GO:0009737), response to JA stimulus (GO:0009753), and response to SA stimulus (GO:0009751). In addition, GO categories for hormone-mediated signaling pathways were also enriched for upregulated genes: ethylene mediated signaling pathway (GO:0009873), negative regulation of ABA-mediated signaling pathway (GO:0009788), and JA-mediated signaling pathway (GO:0009867). This result is examined in more detail below. Interestingly, the enrichments in the different hormone-associated pathways do not occur at the same time points.
Candidate organ-specific processes
Stress-responsive processes that may be unique to roots or shoots were searched by enrichment analyses using genes upregulated only in roots or in shoots in response to salt stress. Significantly enriched categories were consistent with categories identified before, when using the entire gene set as input (Fig. 10). These categories included signal transduction, protein phosphorylation, DNA-dependent regulation of transcription, and response to JA/SA stimulus in roots, and response to cadmium ion, ubiquitin-dependent protein catabolic process, intracellular protein transport, and response to salt stress in shoots. JA-related processes showed enrichment for upregulated genes in roots and downregulated genes in shoots (Fig. 10). No comparable GO enrichment pattern, in which opposite effects were observed in roots versus shoots, was observed for other hormone-related categories in salt-stressed plants. This result suggests that JA-related processes that occur under salt stress may be organ-specific.

Category enrichment of A. thaliana genes that were uniquely up- or downregulated in root or shoot in response to salt stress. ORA with upregulated genes (positive zone) uses minus log10 transformed p-values to indicate the degree of enrichment. For ORA with downregulated genes (negative zone), Log10P values are used instead. The overrepresentation analysis was performed using the elim algorithm followed by WYSS adjustment. Brown bars show ORA result with genes up-/downregulated in root only, while green bars are for the case of shoot-only. A negLog10P or Log10P value of 0 is assigned to any adjusted p-values greater than the cutoff (i.e., 0.05).
ABA-associated responses to salt over time in roots and shoots
Successive waves of ABA-associated gene expression took place in salt-stressed roots and shoots over time, with many genes remaining responsive over the entire time course (Supplementary Table S1). Many genes that responded at the first time point in roots responded at a later time point in shoots. ABA-related genes whose response was specific to roots at the 30-min time point included NCED9, encoding a key enzyme in ABA biosynthesis, SnRK 2.3, a component of ABA signaling, NPX1, ABI1, and ABI2, and an ABI5 binding protein (NINJA), all negative regulators of ABA signaling (Supplementary Table S1). Six ABA-related genes were uniquely upregulated in shoots (highlighted in orange), one of which was a G protein coupled receptor.
To get more insight about the response of the ABA signaling-related genes in roots, all ABA-related genes upregulated at the earliest time point, as shown in Supplementary Table S1, were used as an input to GeneMANIA. This tool returns genes that are connected to the input genes as detected by coexpression, localization, or protein–protein interactions (Warde-Farley et al., 2010). The genes from the resulting network were displayed according to their subcellular localization (obtained from Kaundal et al., 2010). Genes were colored according to their expression at different time points (Fig. 11). From this figure, it is apparent that these early responding genes encode proteins fulfilling various functions in various compartments, and that most of these genes are upregulated for the duration of the experiment.

GeneMANIA-inferred network of early upregulated genes in root under salt stress. Upregulated genes at the 30-min time point annotated with keyword “Abscisic acid” were identified from out complete root gene list as input to GeneMANIA. Predicted interactions and our own data set were excluded to avoid bias in the prediction process. Networks were laid out by Bubble Router with subcellular localization prediction obtained separately from AtSubP. The main panel denotes the layout of the network and the side panels denote the expression pattern at 30-min, 3-h, and 24-h time points. Node color denotes expression pattern of the genes; query genes to GeneMANIA are marked in gray in the main panel. Genes without expression data (absent from the probe set) are colored light turquoise. The nature of the interactions determines their color and normalized maximum weight their width. “Positive”=positive regulator of signaling, “Negative”=negative regulator of signaling, “Response”=gene that has been previously documented to respond to stress, but whose function in signaling is not understood. “Unknown”=gene whose function is unknown, often appearing in GO under “Biological Process.” The shape of each node indicates the functional role of genes in the network. Physical interaction edges are based on yeast-two-hybrid data and colocalization represents cell-type colocalization.
JA-related responses to salt stress
GO enrichment analysis showed that salt stress had opposite effects in roots versus shoots on the category containing JA-related genes (see above). To further probe this finding, we wanted to identify genes both related to JA-response and showing organ specificity in response to salt stress. The two sets of genes responding at any time point either in roots or in shoots (Supplementary Table S2) were used as input to GeneMania.
Only a few genes from the root output network are upregulated at the 30-min time point, whereas most of them are upregulated at later time points (Fig. 12a). Most upregulated genes, including JAZ2, JAZ3, JAZ5, and JAZ7, are classified as playing a negative regulatory role in JA metabolism and are linked to other negative regulatory genes, such as JAZ8 and TIFY10. There is experimental evidence for physical interactions for many JAZ genes (JAZ 2, 5, 6, 7, 10, and 12) coexpressed with AtMYC2 at all three time points (30-min, 3-h, and 24-h time point) (Fig. 12a). Three JA biosynthesis genes were upregulated in salt stressed roots, simultaneously with upregulation of the JAZ genes at the 3-h time point. However, it is worth noticing that AHK2 and AHP5 are almost always downregulated through the entire experiment.

(
The network generated by downregulated genes in shoots of salt-stressed plants is much smaller (Fig. 12b). There are both up- and downregulated genes in every time point, except for the first. Two genes (AT4G31310 and ZW9) showed mixed regulation patterns. Genes involved in JA metabolism were present in the network, together with both positive and negative regulators. All salt-responsive genes classified as positive regulators were upregulated. Although two out of the only three positive regulatory genes were upregulated, it only occurred in one out of the three time points.
Early gene expression events and the involvement of hormone signaling
The data set of genes that responded uniquely at the earliest time point in roots was mined to glean clues about signaling events set in motion by the imposition of salt stress. Five genes were selected from among these early responders that were annotated to either regulation of transcription (MYB3R2, GRRH1, CRF3) or signal transduction (AT3G27473, ARR6) (Supplementary Table S3). Genes associated with these five input genes were searched with GeneMania, excluding the data of Kilian et al. (2007) from the analysis. Many of the inferred genes show change in expression under salt stress in roots in the Killian et al. (2007) data set, for example, GTE7, ARR7, ARR5, and MYB96 (Supplementary Table S3 and Fig. 13). Some of the edges (e.g., most of the interactions with the node “ARR6”) have strong support from physical interactions, as shown in Figure 13. Signaling-related genes that were upregulated during early salt-mediated responses showed connections in GeneMania with several of the Type A Arabidopsis response regulators (ARR4, 5, and 6), which are negative regulators of cytokinin signaling (Lee et al., 2008; Mason et al., 2010). In addition, two auxin negative regulatory genes, IAA12 and IAA7, were identified by GeneMania as being linked to the early responsive signaling genes. Early responding genes of the network encode proteins present in the nucleus. At later time points, an increasing number of genes of the network show downregulation (Fig. 13).
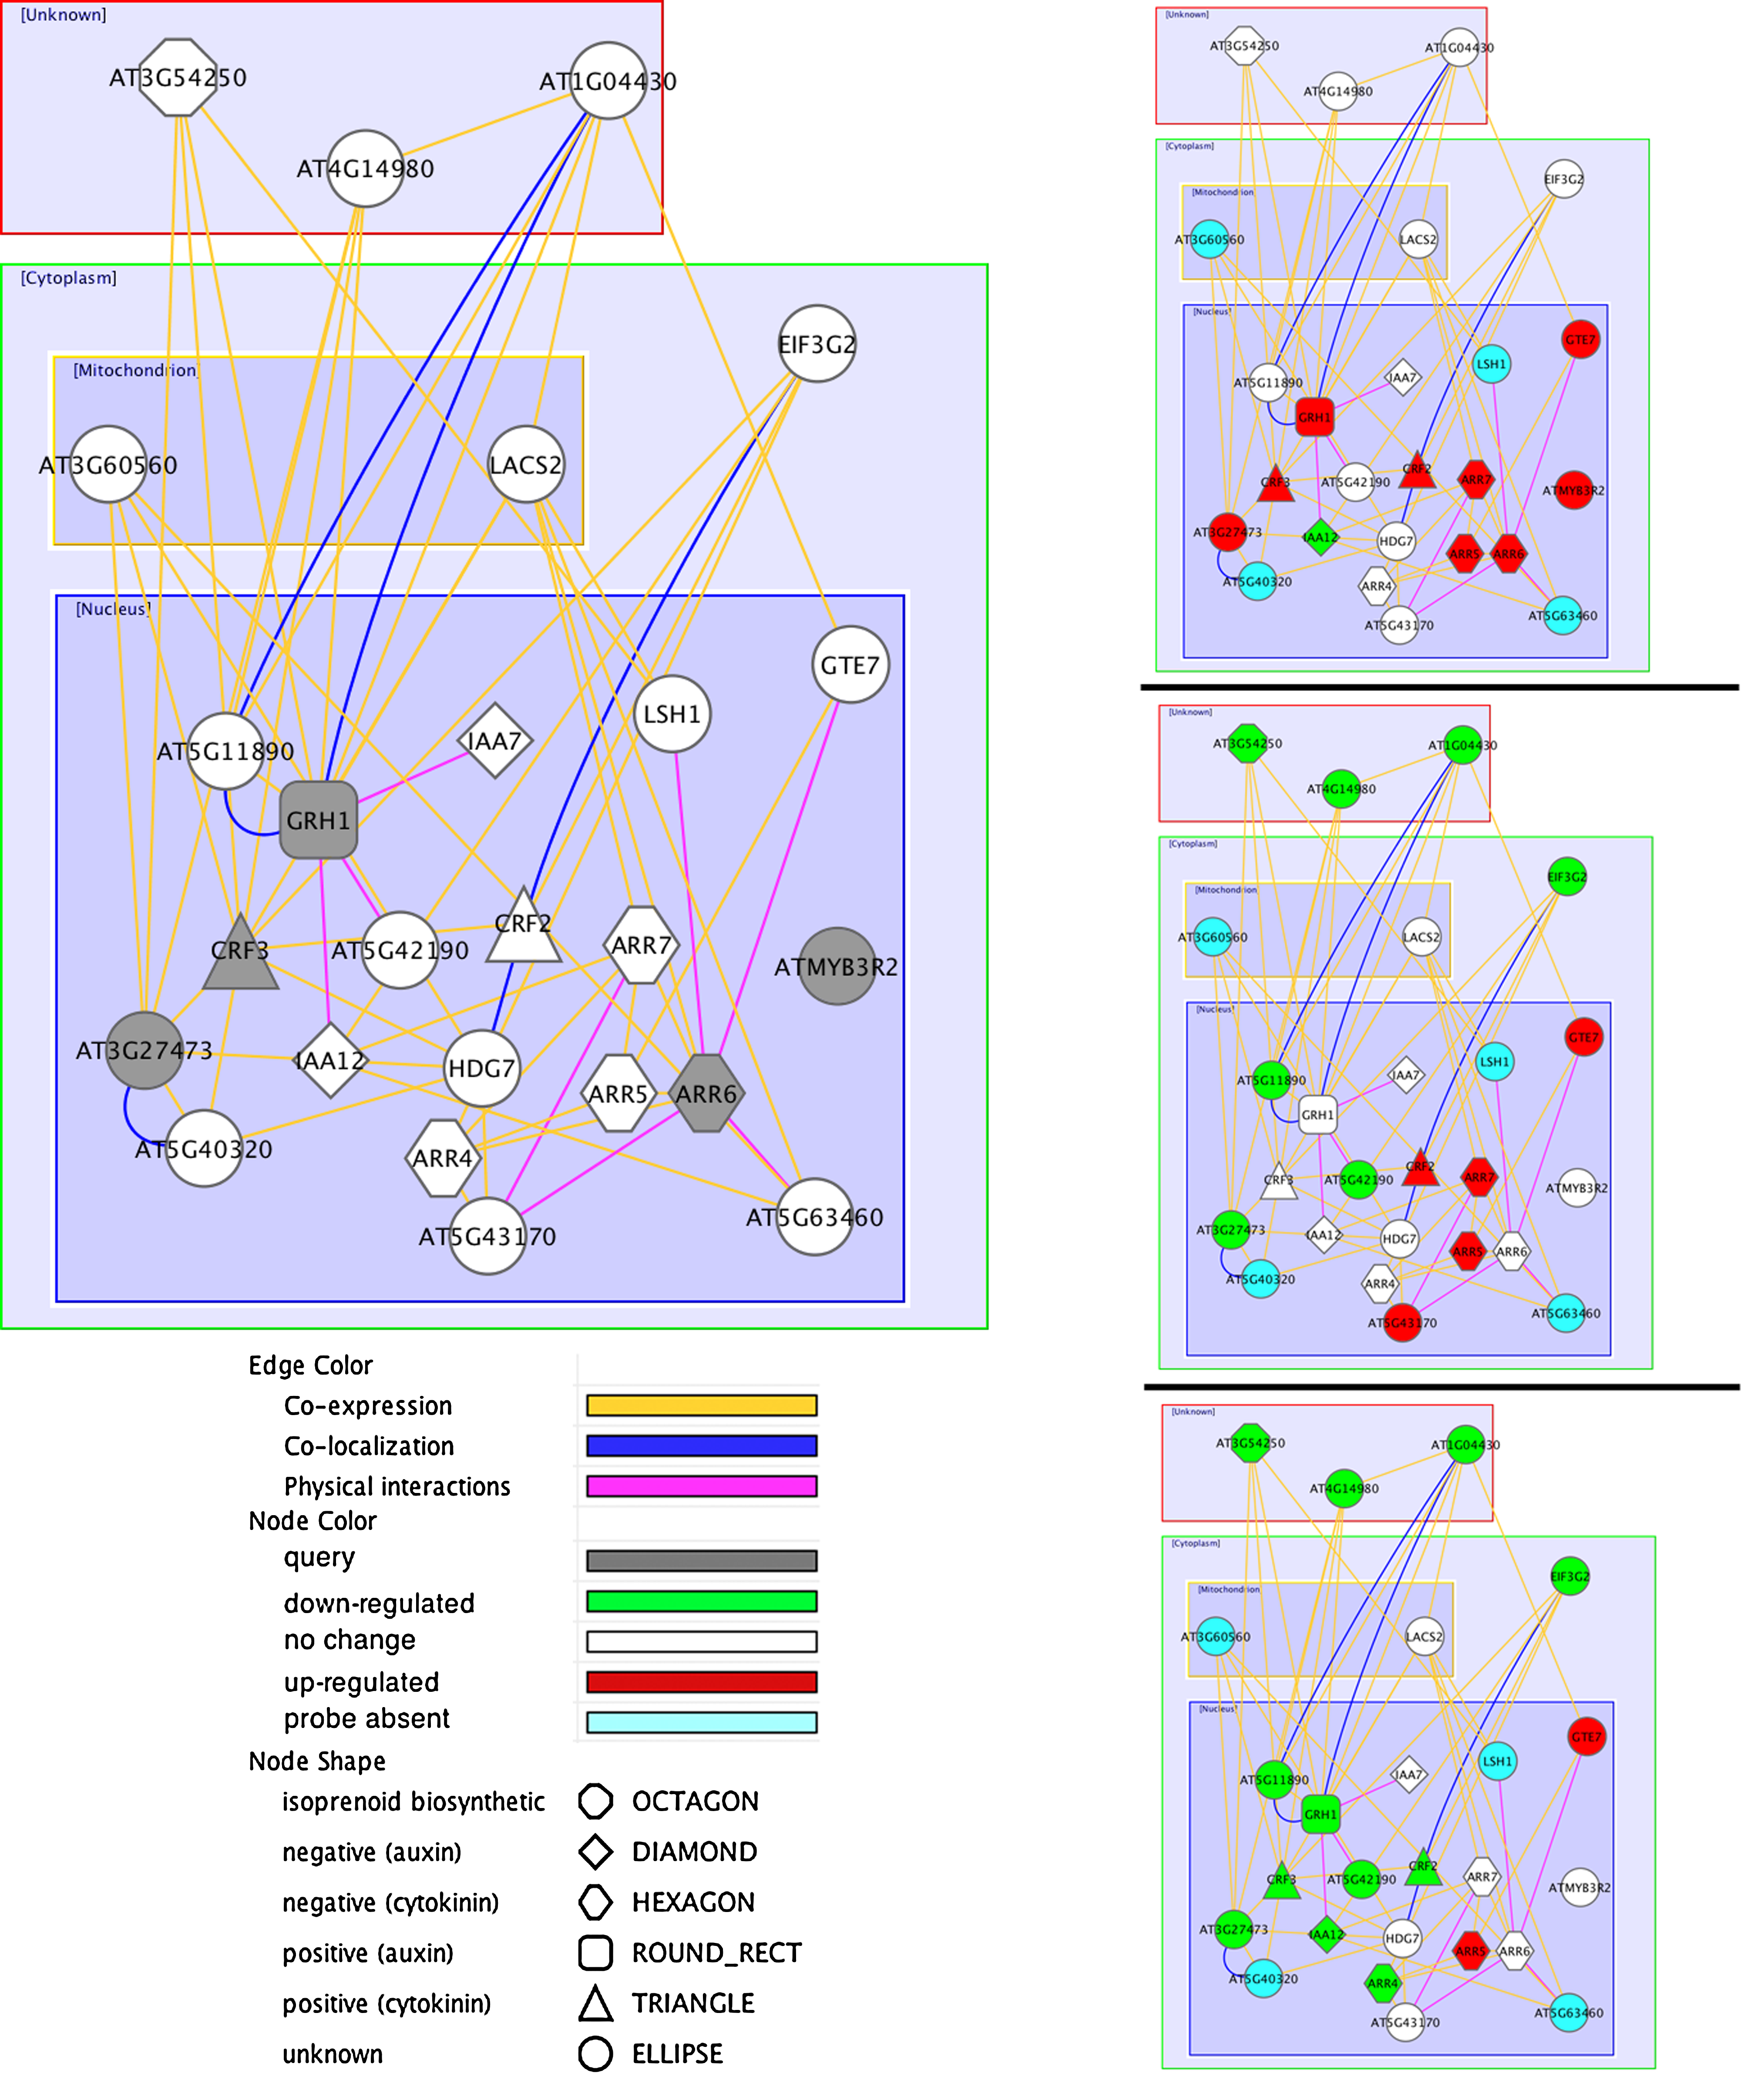
GeneMANIA-inferred network of early upregulated regulatory genes in roots under salt stress. The main panel denotes the layout of the network and the side panels denote the expression pattern at 30-min, 3-h, and 24-h time point. The input genes were associated with two significantly enriched biological process GO terms (i.e., regulation of transcription, DNA-dependent (GO:0006355) and signal transduction (GO:0007165) and were only upregulated at 0.5 h in root under salt stress condition. Gray circles marked the vertices for the five input genes, and the vertices for GM-identified genes are colored according to their expression patterns in root. The nature of the interactions determines their color and normalized maximum weight their width. Thicker edges indicate more contribution in inferring the related genes. Physical interaction edges are based on yeast-two-hybrid data and colocalization represents cell-type colocalization.
The response pattern observed for ethylene-related genes was similar to the response pattern of ABA and JA-related genes, in which genes encoding biosynthetic enzymes were upregulated at the same time as those encoding negative regulators of signaling were observed for ethylene-related genes (Supplementary Table S4).
Plant responses to UVB stress
The UVB stress data set was then investigated by GO enrichment analysis to understand how Arabidopsis plants responded to an unfavorable environmental condition that is initially imposed on the shoots. Up- and downregulated genes were overrepresented in 78 and 52 Gene Ontology Biological Process terms, respectively, in at least one of the conditions (Supplementary Fig. S1). The spatiotemporal distribution of enriched upregulated gene categories (Supplementary Fig. S1) showed that the majority of the plant responses to UVB stress occurred in the shoots, as opposed to salt stress, where the reverse situation occurs. More genes from enriched GO categories, including terms associated with responses to hormone stimuli and/or to stresses other than UVB, were upregulated at earlier time points in the shoots than in the roots. Interestingly, signal transduction (GO:0007165), response to SA stimulus (GO:0009751), and response to JA stimulus (GO:0009753) categories were enriched for upregulated genes in roots and not in shoots. Hormones (ABA, JA, SA, auxin, and ethylene) appeared to be involved in UVB stress responses. Both upregulated and downregulated genes were overrepresented in the term “response to auxin stimulus” (GO:0009733). Only upregulated genes were enriched in some of the other hormone associated terms: response to SA stimulus (GO:0009751) and ethylene mediated signaling pathway (GO:0009873) (Supplementary Fig. S1a). However, downregulated genes annotated with hormone-mediated signaling pathways, with response to ABA stimulus (GO:0009737), and with response to JA stimulus (GO:0009753) were also identified as enriched (Supplementary Fig. S1b). In addition, downregulated genes were enriched in the brassinosteroid-mediated signaling pathway (GO:0009742).
Discussion
Although, for many applications deep sequencing is fast replacing microarray technology as the method of choice for transcriptomic studies, the microarray data sets already accumulated, when analyzed thoroughly, still serve as an invaluable source of new insights into molecular control of plant processes.
Methods for analysis and data presentation
In this study, the use of rigorous statistics to analyze the results of microarray hybridizations resulted in a far richer data set of significantly stress responsive genes than the results obtained by Killian et al. (2007). Our model 1, used to detect genes with significant difference in mRNA accumulation (Materials and Methods), is useful for describing the behavior of signal intensity on a gene-by-gene basis as a function of all of the experimental conditions: stress status, time point, organ, and replicate. Because a single model describes all data related to a given gene, more data is used to estimate variability than one would use by conducting all pairwise tests between stress and control at each time point and organ separately. The model is sufficiently flexible to accommodate any form of interaction between experimental conditions for each gene separately, and all pertinent comparisons can be made on the basis of this flexible model. FDR adjustment was chosen because it detects more differentially regulated genes when compared with other methods such as the fold change method. The fold change method used by Killian et al. (2007) was unable to detect as many differentially regulated genes because only genes with a fold change above 3 are declared to be regulated (Figs. 1 and 2). FDR is able to detect regulation in lower fold changes as long as variability in the data is small, as was the case here. Many studies of gene expression changes under stress conditions and over the course of development of particular organs or tissues have relied on fold change as a cutoff for declaring significance. Many of these results are entries in current databases. A revisiting and a standardized reanalysis of other data sets that are deposited online would be a valuable first step toward enriching our knowledge of the responsiveness of individual plant genes and processes to altered internal or external conditions.
In this study, we have utilized modified visualization tools to mine the responses of Arabidopsis shoots and roots to two different abiotic stresses, providing an avenue for further insights into organ- or time-specific mechanisms. Vector analysis was developed by Breitling et al. (2005) and is a useful tool for displaying the behavior of genes in different backgrounds. However, this tool as originally developed has several drawbacks. First, the size of the eight regions is arbitrary. The regions can be made equivalent in size for convenience, but it is not clear if this is ideal from a biological standpoint. Second, vector analysis declares regulation as a function of how remote a given gene is from the origin with no regard to the variability in the data for individual genes. If a gene has highly variable data, it may be declared differentially expressed even if its remoteness from the origin is due to high variability and not regulation. The direction of regulation in our expression plots, using our modified method, is declared on the basis of a gene-by-gene statistical analysis rather than an arbitrary partitioning of the plot as is required by the original vector analysis method (Figs. 5–8). Hence, our method differs from Breitling's method of declaring directional regulation. We overlaid Breitling's eight equally sized regions in our plots for the purpose of comparing the two methods. This approach weighs variability in the data for individual genes when declaring regulation and also maintains a preassigned false discovery rate for declaring regulation.
Rapidity of responses to stress imposed on roots or shoots
Figures 1 and 2 show that changes in gene expression occur at the earliest time point in both roots and shoots, in response to both UVB and salt stress. Thus, it is clear that root-to-shoot and shoot-to-root signals must have been conveyed in response to the two stresses at this earliest time point. Gene expression responses to UVB, reflected in GO-enriched categories, were observed in the roots at the earliest, 0.25-h, time point. Those categories were “response to karrikin” (GO:0080167), “response to chitin,” and “response to salicylic acid.” Karrikin is a plant growth regulator found in the smoke of burning plant material (Nelson et al., 2009). Remarkably, “response to UVB” was enriched only at the second time point in both roots and shoots, suggesting that some UVB-responsive genes have not been categorized as such. It is possible that there is considerable crosstalk among these less well-studied stress-responsive pathways and that the UVB stress signal moves very rapidly from shoots to roots, as Kilian et al. (2007) have concluded.
Response to UVB stress shared extensive overlap with other abiotic and biotic stresses, varied within time and space in the plant, as shown in Supplementary Figure S1a and Figure S1b. For example, GO categories containing genes documented as responsive to heat and cold were enriched at the first time point in shoots, and several categories containing genes associated with responses to pathogens responded positively at the second and third time points in shoots (e.g., “innate immune response,” “defense response to fungus,” and “plant-type hypersensitive response”). In contrast to the data obtained for upregulated genes, no GO category corresponding to biotic stress responses was found to be enriched in either shoots or roots among the downregulated genes. GO categories in the downregulated gene set were also enriched in roots at the first time point, suggesting an extremely rapid communication between shoots and roots upon the perception of the UVB signal in the shoots. Many of the GO categories enriched among the downregulated genes were photosynthesis associated. Although these responses were not immediate, they appeared after 3 h. This response merits further investigation, suggesting, perhaps, that earlier defense responses of the photosynthetic machinery to UVB stress involve biochemical adjustments.
Early responses to salt stress
More ABA-related gene expression events appear to occur more rapidly in the roots in response to salt stress (Fig. 9a) than do events associated with the other hormones. Our results suggest that ABA biosynthesis, perception, and ABA-mediated responses are initiated in roots before those in shoots. Specifically, at the first time point, members of multigene families, such as SnRK2.3, RCAR1, and NCED 9, are activated. Four members of the Arabidopsis NCED multigene family (2, 5, 6, and 9) can contribute to ABA biosynthesis, and NCED9 was a first responder in the roots under salt stress, suggesting some specialized function for NCED9 in salt stress responses. SnRK2.3 has been established as a main positive regulator of ABA signaling in Arabidopsis (Fujii et al., 2011) and was upregulated under salt stress in roots only. RCAR1/PYL9 encodes a regulatory component of the newly discovered ABA receptor (Raghavendra et al., 2010) and was upregulated under salt stress at the first time point but showed no response in shoots.
Early gene expression events in shoots may have been initiated by ABA, traveling long distance through the xylem, even though there were not sufficient responses to contribute to GO enrichment in that category for the first time point in shoots (ABA-related genes). AKT2/3 (At4g22200), a shaker potassium channel gene, was upregulated in the shoots at the first time point after imposition of salt stress, indicating that, before the time that ABA biosynthesis was activated in the shoots, shoot cells responded to a salt stress signal from the roots. This gene was shown to be upregulated by ABA and salt, and is strongly expressed in shoots but only weakly in the roots (Pilot et al., 2003). The expression of AKT2/3 at the first time point in the shoots of salt-stressed plants is compatible with rapid long-distance transport of ABA made in the roots to the shoots.
Coregulation under salt stress of both negative and positive effectors of ABA and JA signaling
What is most remarkable in the gene expression data for salt stressed roots and shoots is the simultaneous coexpression of both positive and negative regulators of ABA signaling, along with the upregulation of known key genes responsible for ABA biosynthesis. A striking example is the case of the type 2C protein phosphatases ABI1 and ABI2, which were each upregulated in salt-stressed roots, simultaneously with the upregulation of ABA biosynthesis genes, and SnRK2.3, a positive regulator of ABA signaling, whose action is inhibited when bound to ABI and ABI2 (Supplementary Table S1). According to the widely accepted model, increased levels of ABA in salt-stressed roots will lead to the binding of the RCAR1 protein to the PP2Cs, and the release of SnRK2.3 from that complex, where its action is inhibited. The action of unbound SnRK2.3 will trigger, in turn, the activation of ABA-responsive genes. Because the PP2Cs ABI1 and ABI2 are documented negative regulators of ABA signaling (Cutler et al., 2010), their upregulation at the same time as that of SnRK2.3 and ABA biosynthesis genes seems, at first, to be somewhat paradoxical. This result is difficult to reconcile with a linear vision of ABA action, in which the action of PP2Cs is confined to an inhibition of ABA signaling, which is released as more ABA is made available. Another example of this paradox is seen for NPX1, which is known to act to negatively regulate ABA signaling (Kim et al., 2009). This negative regulator is upregulated throughout the 24-h time course in salt-stressed roots. This did not occur in shoots, suggesting that ABA signaling in roots and shoots may differ. Further experimentation is needed to determine whether other negative regulators of ABA signaling, such as NPX1, have additional roles in ABA-related events that occur with stress imposition.
Our observation is compatible with an additional, positive, regulatory role for the PP2Cs that occurs during this first stage of ABA-mediated responses to salt in roots. Recent data demonstrate such an additional positive role for ABI1, as a modulator of ABA and ethylene biosynthesis (Ludwików et al., 2009). In the Arabidopsis abi1 mutant, ABA levels were lower, and ethylene levels were higher than in wild-type plants, indicating an important other role for ABI1, and the existence of a point of interaction between ABA and ethylene biosynthesis.
In the case of JA, upregulation of one, then three, JA biosynthetic genes occurs at the first and second time points in the roots, simultaneously with the upregulation of JAZ2, 3, 5, 6, 7, and JAZ10, all negative regulators of JA signaling (Fig. 12a). The relationship between upregulation of biosynthetic genes, MYC2 (Niu et al., 2011), and negative regulators of hormone signaling observed here, which has been reported before for JA (Browse, 2009), is similar to our observations for JA and ABA-related genes and for auxin-related responses. These genes could also be involved in different hormone-related responses present in different root tissues. The results of Dinneny et al. (2008) showed relatively uniform ABA-related responses to salt stress in Arabidopsis roots across different cell types, and it is therefore unlikely that this seemingly contradictory finding reflects cell-specific responses.
The coexpression of both positive and negative regulators of ABA and JA signaling could be understood by applying the concept of noise and signal amplification, which has recently been applied to data underlying biological signaling cascades. Components of a signaling cascade are present at very low concentration (one to five molecules per cell) and are prone to sudden changes in their status (e.g. amount, phosphorylation, subcellular localization), which have been designated as noise (Eldar and Elowitz, 2010). Due to the high amplification power of signaling cascades, such noise could lead to a response without signal. Simulations and analysis of signaling cascades have shown that the presence of negative feedback increases noise frequency, making it easier to filter out by gene circuits (Mahalingam et al., 2006). Negative feedback has also been shown in yeast to be critical for signal transduction in a dose–response manner, without losing much of the signal. Suppression of the negative feedback loop of the pheromone response cascade led to oversensitivity and nonlinear responses in the normal concentration of the pheromone (Xue et al., 2008). In this model, both negative and positive regulators are integral parts of the same signaling cascade and are involved in controlling the accuracy of signal transduction. It is thus conceivable that, in the case of ABA or JA responses to salt, the amounts of all signal transducers are increased to bring about efficient and quantitative responses to the stress signal, especially when the transcriptome, and likely the proteome, of the cell is changing rapidly, potentially leading to added noise.
ABA-related responses to salt in roots and shoots
Successive waves of ABA-related gene expression activity took place in response to salt stress in the roots (Dinneny, 2010), including those occurring at the first time point (30 min), some of which was exclusive to that time point. In some other cases, the same gene was upregulated in shoots but at a later time point. Our analysis contributes some refinement, on a tissue and time-specific basis, of the categorization of the well over 100 documented loci in the ABA response. These loci comprise numerous families with both redundant and distinct functions at every level of the ABA signaling network: multiple receptor families, protein phosphatases (PP2Cs) that interact with the four PYR/PYL/RCAR receptors, protein kinases (e.g., SnRKs) regulated directly by the PP2Cs, and transcription factors, ion channels, and numerous other substrates of the SnRK and other kinase families (Cutler et al., 2010; Hubbard et al., 2010; Raghavendra et al., 2010).
AAO3, which has been established as an additional regulatory steps in ABA biosynthesis besides NCED3 (Melhorn et al., 2008), was upregulated in the shoots of salt-stressed plants, suggesting a possible difference in regulatory mechanisms for ABA biosynthesis in the two organs. Given this evidence for activation of ABA biosynthesis in shoots, later ABA-associated responses observed in shoots under salt stress were most likely brought about by ABA synthesized in that organ. Ernst et al. (2010) questioned whether, and to what degree, ABA biosynthesis occurs in water-stressed maize roots and whether the long-held view that ABA made in the roots travels through the xylem to activate molecular processes in the shoot is valid (Ernst et al., 2010). Although no measurements of ABA were made by Kilian et al. (2007), our analysis suggests that ABA biosynthesis is, in fact, initiated in roots upon imposition of salt stress and at an earlier time than in the shoot, if only by 30 min, and may have been transported to the shoot at that time. It is important to note the difference in the two experiments: water withholding over 10 days in maize plantlets (Ernst et al., 2010) versus the sudden addition of 150 mM NaCl to Arabidopsis plants in hydroponic culture (Kilian et al., 2007). Such differences could also explain the disparate observations. Overall, the pattern observed suggests that ABA-responsive pathways in the shoot share some aspects of gene expression with those that occur in response to salt stress in roots, albeit on a different time scale.
Contrasting responses of JA-related genes to salt stress in roots and shoots: a hypothetical link to proteasome-related activity
JA action has a major transcriptional component, making the gene expression results under study here a promising source for data mining (Chini et al., 2009). The data presented here could be a starting point for an investigation of organ-specific differences related to JA action, and extended to a wider investigation of signaling of the many other hormones whose action, like that of JA, includes the action of the UQ/26S proteasome.
Different patterns of JA-related gene regulation were observed in shoots and in roots. MYC2 was coexpressed with negative regulators JAZ5, 6, 7, and 10 in salt-stressed roots at the first time point (Supplementary Table S2) and with JA biosynthesis genes. Proteins in the JAZ family have been demonstrated to bind to several MYC proteins, including MYC2 (At1G32640), a basic helix-loop-helix (bHLH) DNA-binding family protein (Fernandez-Calvo et al., 2011), inhibiting their action. The repression of JA signaling is lifted when the JAZ proteins are removed through targeting to proteolysis by the proteasome (Niu et al., 2011). Because protein data are not available from the current study, it is not possible to draw any firm conclusions concerning JA-related signaling processes and proteasomal activity in salt-stressed roots and shoots. This unexpected result suggests that JA signaling in response to salt stress in Arabidopsis roots may involve additional, yet unknown, mechanisms, with individual JAZ proteins playing roles that may not directly involve the proteasome pathway, analogous to the recently described modulating role of ABI1 in ABA-mediated responses (Ludwików et al., 2009). Decreases in the levels of the 26S proteasome components are also known to lead to decreased cell division (Kurepa et al., 2009). The GO enrichment analysis presented here showed, indeed, decreases in the expression of cell division-related genes in salt-stressed roots, but not in shoots, toward the end of the time course experiment (Fig. 9b). In the case of the shoots, only two JAZ genes (Fernandez-Calvo et al., 2011) were activated in response to salt stress, while one, JAZ6, was downregulated, and COI1 was upregulated. The documented COI-mediated JAZ–proteasome pathway is more likely to be operating in the shoots, because no reduction in the expression of the genes encoding the components of the proteasome was observed. In both roots and shoots, the paradox of upregulation of JAZ negative regulators simultaneously with that of biosynthetic genes occurred in both shoots and roots and could possibly be explained as above in the context of noise modulation in signaling cascades.
The JAZ proteins may also play additional, perhaps organ-specific, roles in the mechanism of JA action on plant cells. Such an additional regulatory role for JAZ proteins has been suggested by Sheard et al., 2010), who showed that the Arabidopsis JA receptor is, in fact, a COI–JAZ complex. It would seem that JA signaling cannot be initiated without the participation of JAZ proteins. The response of different subsets of JAZ genes in the roots and shoots of salt-stressed Arabidopsis is in agreement with a model in which organ-specific JA-mediated responses are triggered by specific receptor complexes composed of different JAZ proteins bound to COI. A characterization of these complexes in the roots and shoots over time after salt-stress imposition would be a valuable next step towards a fuller understanding of organ-specific JA perception. The composition of proteasomal complexes could be similarly followed to determine if organ-specific proteasomal complexes form in response to salt stress, which can in turn be associated with distinct COI–JAZ pairings.
Conclusion
Taken together, results obtained with the analytical methods used in this study are further indicators of the complex nature of stress responses. Early and unique gene expression events (detectable after 30 min) occur in roots and shoots upon exposure to either salt or UVB stress, suggesting that long distance transport of signals either up or down the plant is rapid. Our results are in agreement with the hypothesis that (1) genes identified up to now as negative regulators of hormone action may have additional roles in perception, signaling, and/or the regulation of hormone biosynthesis, and (2) salt-responsive gene expression responses differ between shoots and roots. An experimental approach based more on proteomics (i.e., the characterization of specific protein complexes formed in response to a given stress in a given tissue under given conditions) and less on the probing of gene function with mutant genotypes may be a fruitful path to follow at this point. A tissue-specific regulatory role for the proteasome in stress responses is suggested and warrants further experimentation, also using a proteomics approach. Finally, as our capacity for data integration, data mining, and visualization grows, the current linear vision of hormone-related responses may need to be replaced with more complex interpretations and conceptualizations of cellular events following a change in environmental conditions.
Footnotes
Acknowledgments
LISA (Laboratory for Interdisciplinary Statistical Analysis), Virginia Tech. The support of the iPlant Collaborative (NSF DBI-0735191) is gratefully acknowledged.
Author Disclosure Statement
The authors declare that no conflicting financial interests exist.
References
Supplementary Material
Please find the following supplemental material available below.
For Open Access articles published under a Creative Commons License, all supplemental material carries the same license as the article it is associated with.
For non-Open Access articles published, all supplemental material carries a non-exclusive license, and permission requests for re-use of supplemental material or any part of supplemental material shall be sent directly to the copyright owner as specified in the copyright notice associated with the article.