
Abstract
Abstract
Sow milk yield and quality is crucial for the survival and growth of piglets. To understand the molecular mechanisms of lactogenesis and lactation, mammary tissue samples were taken from six sows at −17(±2), 1 and 17(±2) days relative to parturition. Mammary tissues from two sows in the same stage were used to extract RNA, which were subsequently pooled in equal amounts. Nine pooled samples were hybridized to porcine Affymetrix GeneChips. Totally 1,524 genes were detected as significantly differentially expressed over the time course tested (p<0.01, q<0.01, fold change ≥2 or ≤−2), including 709 upregulated and 575 downregulated genes identified at peak lactation compared to late pregnancy. Gene ontology analysis revealed that most of the upregulated genes were involved in transport, biosynthetic processes, and homeostasis, whereas most of the downregulated genes were involved in intracellular signaling cascades, cell cycle, and DNA replication. Furthermore, we identified 64 differentially expressed genes of the solute carrier families. Taken together, our microarray analysis provides insights into previously uncharacterized changes in transcriptome between late pregnancy and peak lactation in the porcine mammary gland. The solute carrier genes and other differentially expressed genes identified in this study will guide further characterization of their function to enhance milk yield and piglet growth.
Introduction
Solute carriers (SLC) play an important role in nutrient absorption and transport involved in milk ingredient synthesis and secretion. Although the changes in mammary nutrient and enzyme transporter expression and activity are correlated with physiological and morphological changes during pregnancy and lactation in some mammals (Shennan and Peaker, 2000; Zhao and Keating, 2007), no reported studies have characterized the expression of SLC gene family in the porcine mammary gland.
The objective of this study was to use the Affymetrix Porcine GeneChip to acquire a comprehensive picture of transcriptional adaptations in the mammary glands of lactating sows and further identify genes that may play important roles in nutrient transport in the porcine mammary gland.
Materials and Methods
Animals and tissue samples
Six multiparous (four to six parities) Large White sows were purchased from the Huizhou Swine Breeding Center and were managed by standard procedures. The diets were corn and soybean meal-based and were formulated to meet or exceed nutrient concentrations recommended by the National Research Council (NRC, 1998). The anterior mammary gland biopsies were taken from each sow at −17(±2), 1, and 17(±2) days relative to parturition.
The sow was first sedated with intramuscular injection of acepromazine maleate (Mutianyuan Inc., Guangzhou, China) at a dose of 0.3–0.5 mg/kg. Then, sows were anesthetized by intramuscular injection of mixed anesthetics that contained 500 mg Shutai (250 mg tiletamine and 250 mg zolazapam; Chongbiwei Biological Technology Inc., Beijing, China) and 350 mg ketamine (Agricultural Bureau of Guangzhou City supply, Guangzhou, China) dissolved in 0.9% sodium chloride. One mammary gland was washed, disinfected with 75% ethanol. After subcutaneous and intramammary injection of 1.0 mL 2% lidocaine (Guangdong Hengjian Inc., Jiangmen, China), a 2-cm incision was made vertical to the plica lateralis, aligned with the nipple and approximately 5 cm dorsal to the perimeter of the nipple areola. About 0.8 g mammary tissue was excised with a scalpel in a circular motion. The incision was closed with simple interrupted sutures using silk braided (Jinhuan, Inc., Shanghai, China). Sows received an intramuscular injection of ampicillin sodium (Jiacheng Technology, Inc., Zhuhai, China) at a dose of 10 mg/kg immediately after biopsy and then 24 and 48 h later. Sutures were removed 7 days after biopsy. The details of the surgery were performed as described by Kirkwood et al. (2007). Tissue samples were immediately frozen in liquid nitrogen until used. In total, 18 mammary gland samples were collected. All procedures were conducted following the protocols approved by the Committee for the Care and Use of Experimental Animals at South China Agricultural University.
Total RNA isolation and quality evaluation
Total RNA was isolated from each tissue sample using TRIzol reagent (Invitrogen, Carlsbad, CA, USA) according to the manufacturer's instructions. The RNA quality was confirmed by calculating the OD 260/280 ratio via a spectrophotometer, and the integrity of the RNA was verified by agarose gel electrophoresis. The amount of RNA was determined by measuring absorbance at 260 nm. The isolated total RNA was divided into two parts: one part was used for real-time quantitative PCR (Q-PCR), and the other part was used for making RNA pools. Next, equal amounts of total RNA from two individual sows at each time point in each treatment group were combined to create a pooled sample that was used for microarray assay.
Microarray assay
Gene expression profiling was performed for each pooled RNA sample on the GeneChip Porcine Genome Array (Affymetrix) at the Biochip Corporation (Shanghai, China), where GeneChip microarray service was certified by Affymetrix. This array contained a total of 24,192 probe sets, representing 20,201 genes and 220 controls. The majority of the probe sets were annotated by Tsai et al. (2006). The latest version (2010) of the annotation is available for download at http://www4.ncsu.edu/∼stsai2/annotation/. Briefly, 10 μg total RNA was used to produce biotin-tagged cRNA using the GeneChip One-Cycle Target Labeling Kit (Affymetrix), which was then hybridized to GeneChip array according to the standard procedures provided by the manufacturer. After hybridization, the GeneChip arrays were washed and stained with streptavidin–phycoerythrin on an Affymetrix Fluidics Station 450. The arrays were subsequently scanned with the Affymetrix GeneChip Scanner 3000.
Raw data from the excel files were converted to gene signal files using MAS 5.0 software (microarray analysis system 5.0, Affymetrix). The expression data were analyzed by GeneSpring GX 10.0 software (Agilent Technologies) for data normalization and filtering, and to generate present, marginal, or absent calls for genes represented by each probe set on the array. In our data set, if a probe had more than two present calls on at least one time point in the triplicate detection data, the gene was defined as expressed in the mammary gland and retained for further analysis. The DNA microarray data were available at the NCBI through Gene Expression Omnibus (GEO) Series accession number (GSE30704).
Statistical analysis
The normalized expression data for each transcript were subjected to log2 transformation. ANOVA test (R software) was used to identify genes that were differentially expressed over three stages with the time point as a fixed effect. The q value was used to obtain false discovery rates (FDR) (Storey and Tibshirani, 2003). Based on this, SAM 3.0 software was used to further calculate the differentially expressed genes between two stages (Tusher et al., 2001). A differentially expressed gene between any two stages (day 1/day −17, day 17/day 1, and day 17/day −17) was defined as a variation in gene expression of no less than twofold with a detection p value less than 0.01. For the expression change of SLC genes in porcine mammary gland, relatively loose threshold was set (p<0.05). Additionally, hierarchical clustering was performed using Cluster 3.0 and visualized by Java Treeview software. All the above procedures were accomplished on the SAS (SBC Analysis System, http://sas.ebioservice.com/) platform.
Furthermore, the differentially expressed genes identified between every two distinct stages (day 1/day −17, day 17/day 1, and day 17/day −17)were mapped to Gene Ontology (GO) terms and Kyoto Encyclopedia of Genes and Genomes (KEGG) pathways. The Database for Annotation, Visualization, and Integrated Discovery (DAVID 6.7) Bioinformatics Resources (http://david.abcc.ncifcrf.gov/) was used for these processes. GO terms with FDR-corrected p values <0.01 and KEGG pathways with FDR-corrected p values <0.05 were considered statistically significant. The Q-PCR statistical analysis was performed by one-way ANOVA using SPSS 17.0 software (SPSS Inc., Chicago, IL).
Real-time quantitative PCR
Microarray data were validated by Q-PCR using SYBR Green Real-Time PCR Master Mix reagents (Toyobo, Osaka, Japan) on the same RNA samples used for microarray analysis. Primers were designed based on cDNA sequence (Table 1) using Primer Premier 5 (PREMIER Biosoft Int., Palo Alto, CA, USA). Mitochondrial ribosomal protein L39 (MRPL39) gene was used as a control because it showed no significant variations in the expression in our microarray data, whereas the expression of commonly used housekeeping genes (GAPDH, β-actin, and 18S rRNA) varied during pregnancy and lactation in our detections (data not shown). The primer sequences for MRPL39 were described previously by Tramontana et al. (2008). The Q-PCR reactions were performed on an Mx3005p instrument (Stratagene, La Jolla, CA, USA), and the thermal cycling conditions were as follows: 95°C for 1 min followed by 40 cycles of denaturation at 95°C for 15 s, annealing at 59°C for 15 s, and extension at 72°C for 40 s. A melting curve analysis was also performed for each gene to confirm the production of a single specific amplification product. The amplification efficiency of each gene was counted and the relative expression level for each gene was calculated using the formula described previously (Liu and Saint, 2002): R0, T/R0, R=(1+ER) Ct,R /(1+ET) Ct,T .
Results
Identification of differentially expressed genes
We first compared differentially expressed genes among the day 1/day −17, day 17/day 1, and day 17/day −17 groups by SAM together with ANOVA algorithms to identify the magnitudes of the transcriptional responses among them. As shown in Figure 1, significant changes in transcriptome occurred between day 17 and day −17 relative to parturition with 709 genes upregulated and 575 genes downregulated (Supplementary Table 1). Additionally, we identified 428 genes that were differentially expressed at the foremilk stage compared to late pregnancy, among which 291 genes were upregulated and 137 genes were downregulated (Supplementary Table 2). Furthermore, transition from foremilk stage to peak lactation led to the induction of 128 genes and the repression of 87 genes (Supplementary Table 3). All of these genes were selected for further analysis by GO terms and KEGG pathways.
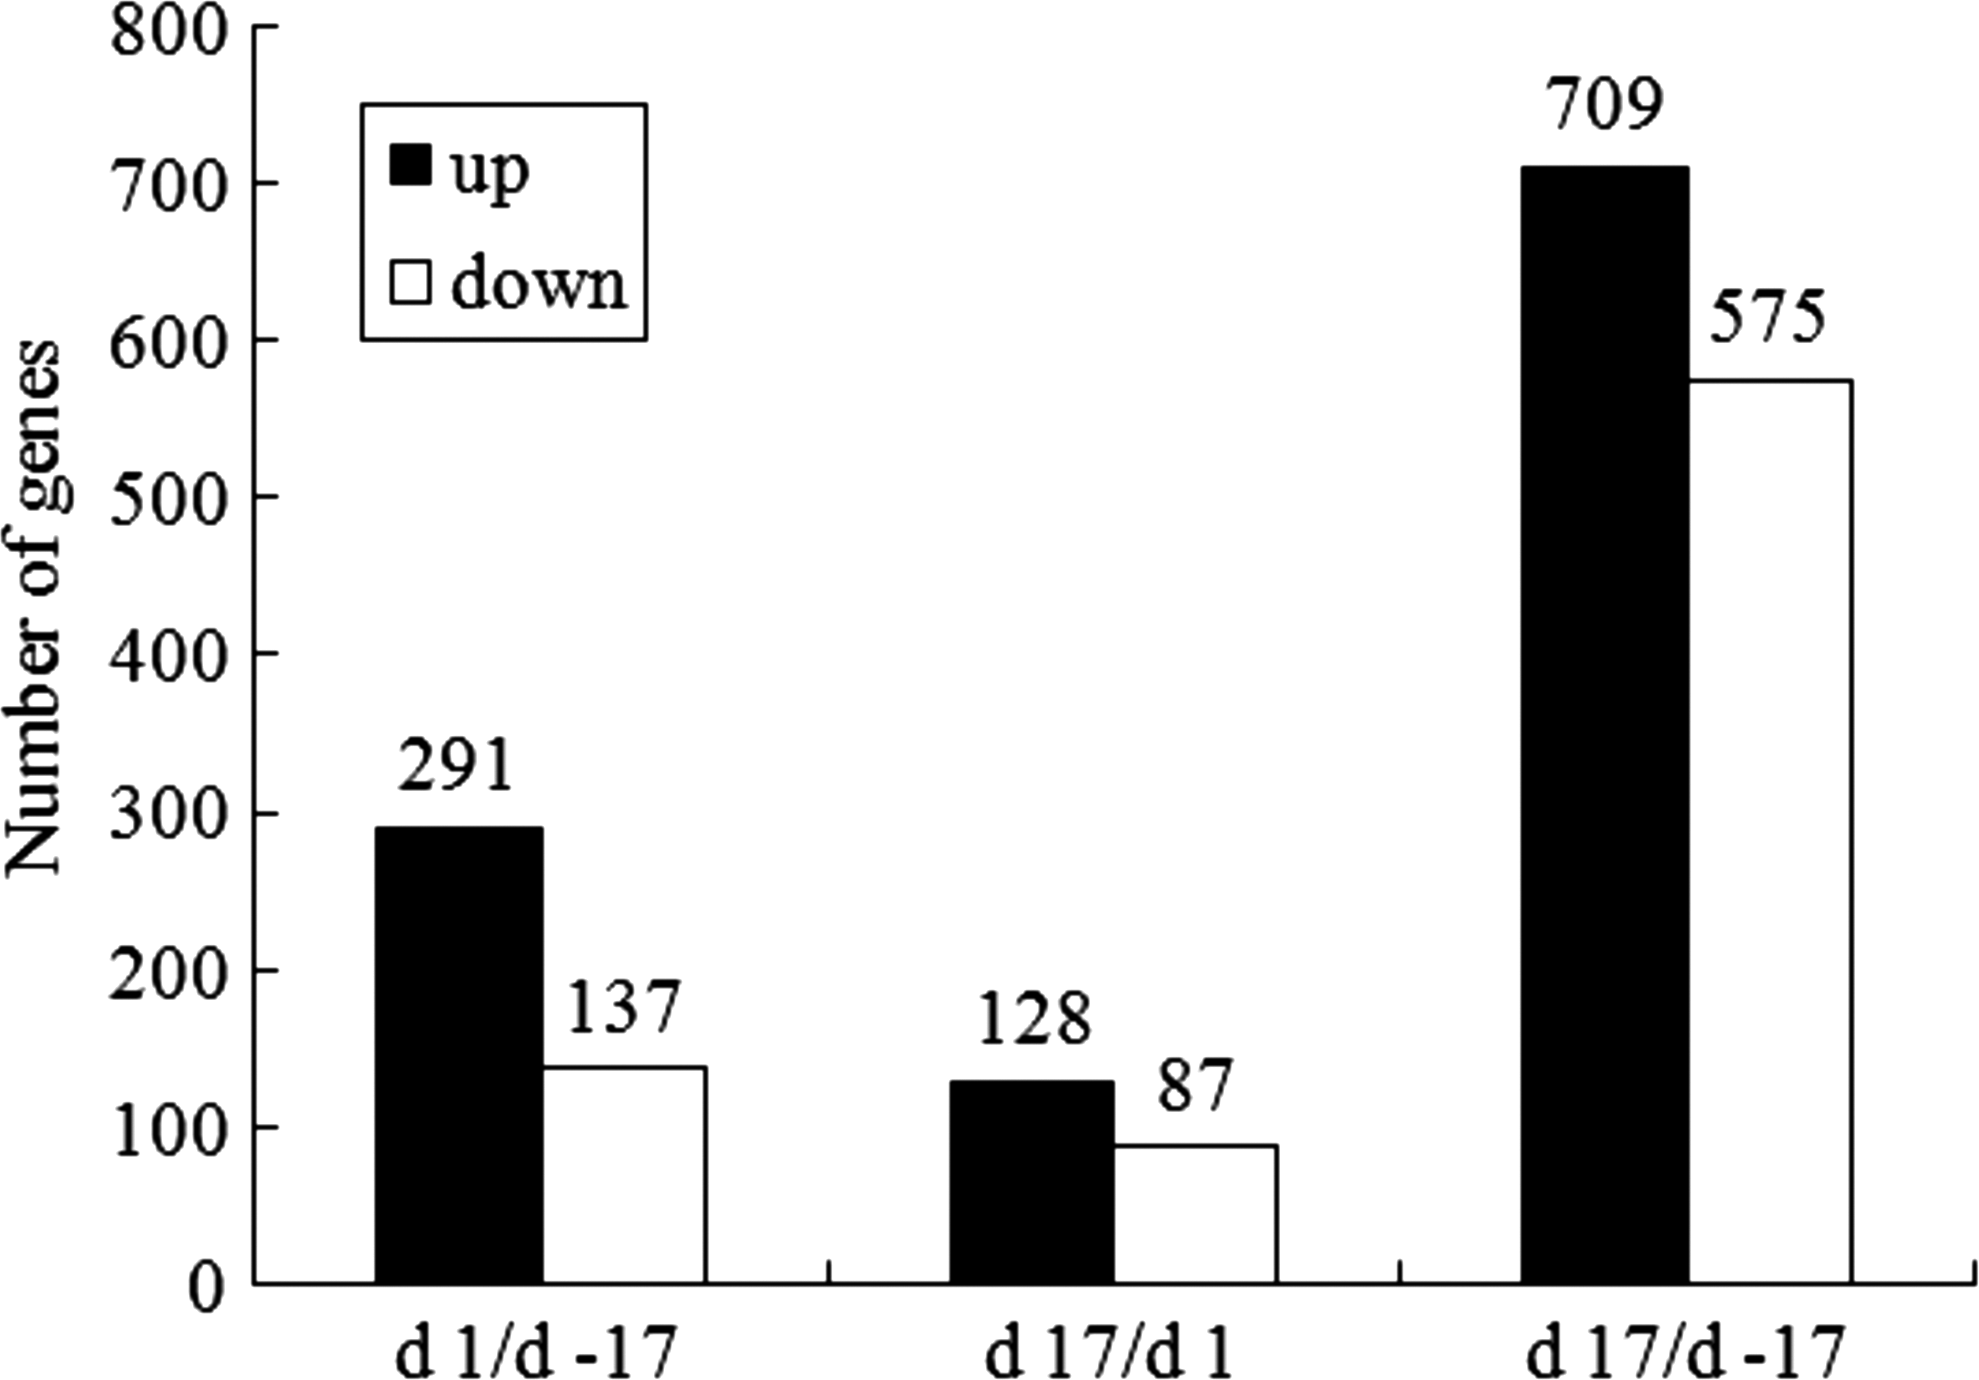
Summary of the differentially expressed genes.
Next, we identified 2,074 transcripts that were significantly differentially expressed over the time course at the cutoff criteria of the signed fold change ≥2 or ≤−2, p<0.01 and q<0.01. These transcripts included 1524 genes (Supplementary Table 4) and 350 anonymous ESTs.
Verification of differentially expressed genes by real-time quantitative PCR
To confirm the microarray results, 14 genes were selected for Q-PCR analysis, among which 8 genes were upregulated and 6 genes were downregulated in comparison (day 1/day −17, day 17/day 1, and day 17/day −17). As expected, the expression patterns of these genes were in agreement with the microarray data (Fig. 2), demonstrating the reliability of the microarray assay.
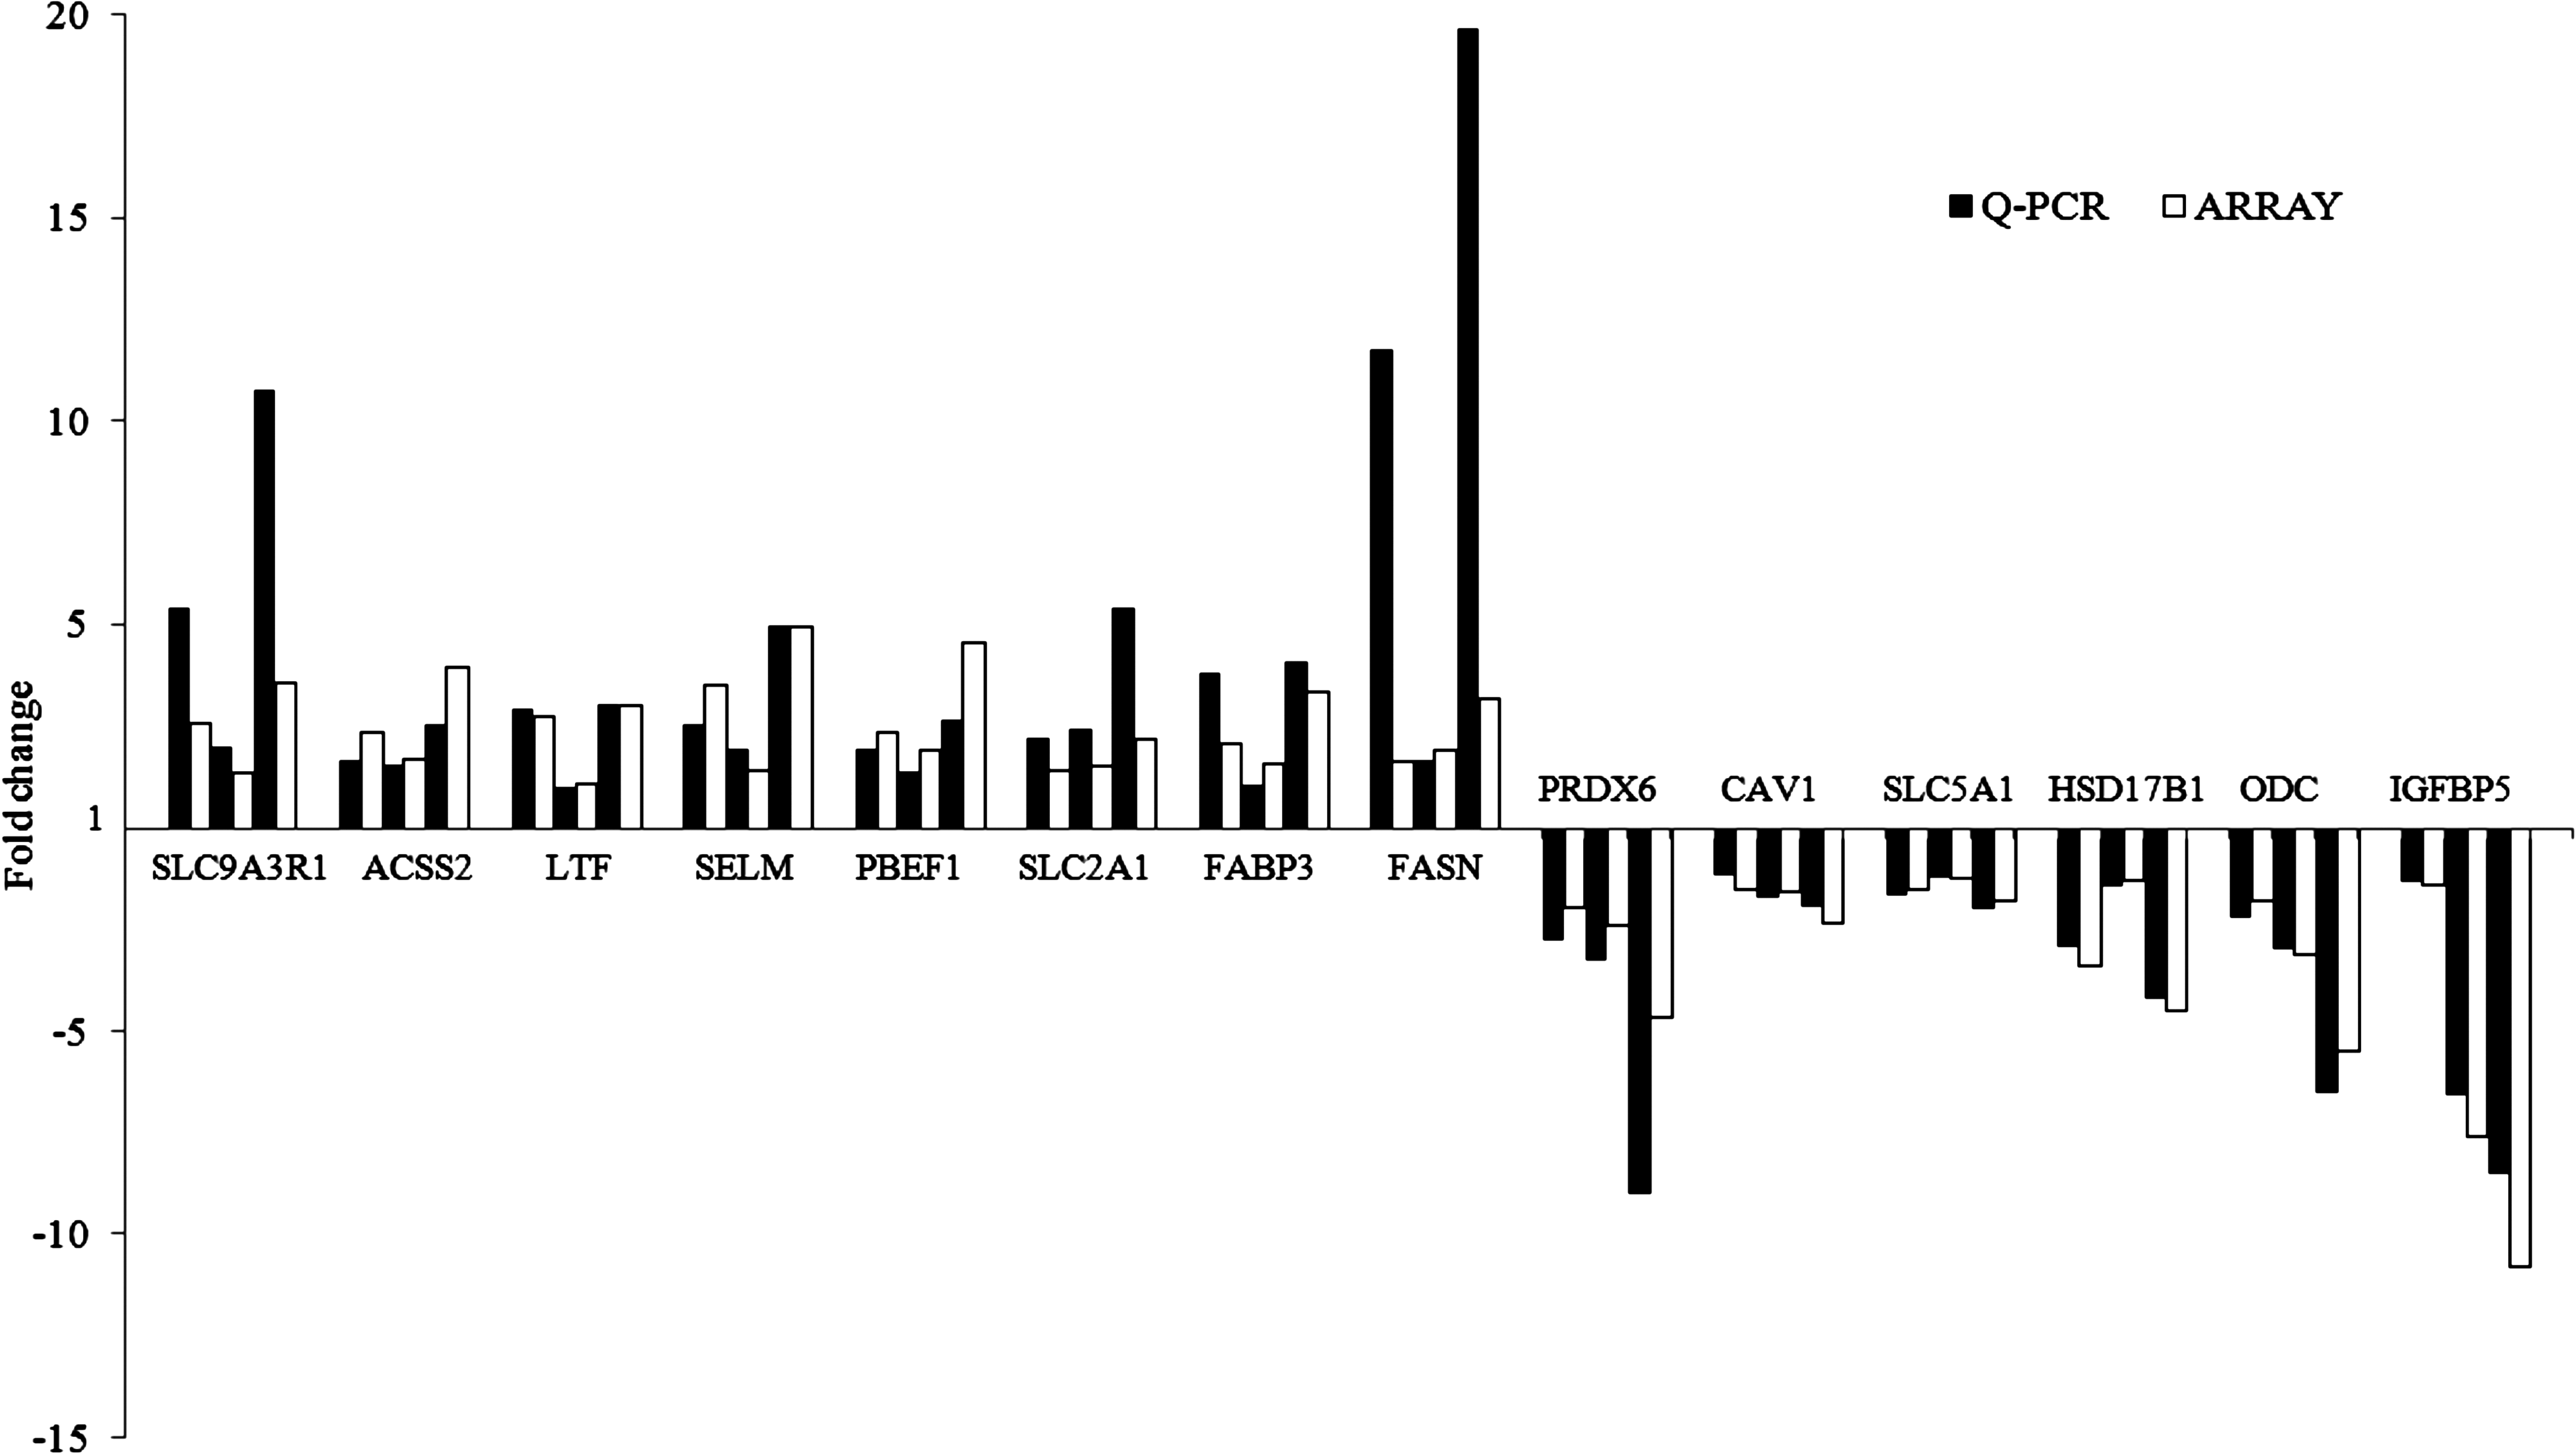
Differences of fold change in mRNA levels for each gene when comparing microarray and real time quantitative PCR (Q-PCR) analyses. For each gene from left to right, bars display the fold changes between day 1/day −17, day 17/day 1, and day 17/day −17, respectively. Bars above the x-axis indicate that genes were upregulated in comparison, and those under the x-axis indicate that genes were downregulated in comparison.
Gene ontology (GO) and pathway analysis
To facilitate the biological interpretation of the transcriptional profiles, we performed GO and pathway analysis for the genes differentially expressed between every two distinct stages. The results showed that the most abundant GO terms and pathways for differential genes were found in period from late pregnancy to peak lactation.
The genes upregulated at peak lactation compared to late pregnancy were enriched in biological processes mainly related to transport, biosynthetic processes, homeostasis, and regulation of apoptosis. Cellular component analysis showed that genes involved in organelles (endoplasmic reticulum, Golgi apparatus, and microsomes), organelle membranes, cell, and insoluble fractions, cytoplasmic, and membrane-bounded vesicles were highly expressed. Meanwhile, nucleotide-, GTP-, ion-, and confactor-binding proteins, ATPase, GTPase, and mannosidase were overrepresented in molecular functions. In contrast, most of the genes downregulated at peak lactation were involved in biological processes such as intracellular signaling cascades, cell cycle, and nuclear division, DNA replication, mRNA metabolic processes and cellular morphogenesis (Table 2). Very similar results were found in foremilk stage compared to late pregnancy (day 1 vs. day −17), the only difference is that GO terms associated with significantly downregulated genes were not found with false discovery rate (FDR)-corrected p-value<0.01 (Table 3). Minor changes occurred at different lactation stages (day 17 vs. day 1). Mammary gland development and carbohydrate transport are only two GO terms of biological processes associated with significantly upregulated genes. In addition, GO terms about cell cycle and microtubule cytoskeleton were found with downregulated genes closely related (Table 4).
Nine GO terms associated with significantly downregulated genes in porcine mammary gland in molecular functions category were listed with false discovery rate (FDR)-corrected p-value<0.01.
Number of genes involved in given term was divided by the total number of user's input genes.
Eight GO terms associated with significantly upregulated genes in porcine mammary gland in molecular functions category were listed with false discovery rate (FDR)-corrected p-value<0.01.
Number of genes involved in given term was divided by the total number of user's input genes.
Number of genes involved in given term was divided by the total number of user's input genes.
KEGG pathways associated with differentially expressed genes between every two distinct stages (day 17/day −17, day 1/day −17, and day 17/day 1) are listed in Table 5. The results showed that the upregulated genes on peak lactation compared to late pregnancy were involved in adiposytokine signaling pathway, peroxisome proliferator-activated receptor (PPAR) signaling pathway, N-Glycan biosynthesis, steroid biosynthesis, mammalian target of rapamycin (mTOR) signaling pathway, and terpenoid backbone biosynthesis, whereas the downregulated genes were related to regulation of actin cytoskeleton, spliceosome, and glutathione metabolism. Additionally, we observed the upregulation of steroid biosynthesis and lysosome pathways in the period from foremilk stage compared to late pregnancy. Furthermore, during the period from early lactation to peak lactation, the cell cycle and glutathione metabolism pathways were found to be downregulated.
KEGG pathways associated with differentially expressed genes between every two distinct stages (d 17/d –17, d 1/d –17, and d17/d 1) were listed with false discovery rate (FDR)-corrected p-value<0.05.
KEGG, Kyoto Encyclopedia of Genes and Genomes.
Number of genes involved in given pathway was divided by the total number of user's input genes.
PPAR, peroxisome proliferator activated receptor.
mTOR, mammalian target of rapamycin.
Transcriptional profiles of solute carrier transporters in the porcine mammary gland
Solute carrier families play an important role in milk component synthesis and secretion. As of July 2011, the human SLC gene family included 51 families and 378 transporter genes, which encode active and passive transporters and ion-coupled transporters and exchangers (http://www.bioparadigms.org/slc/menu.asp). In our study, 268 transcripts representing 179 genes belonging to 42 SLC subfamilies were expressed in porcine mammary glands from late pregnancy to peak lactation (Supplementary Table 5). Among these genes, 102 genes were identified by the ANOVA algorithm as differentially expressed over the time course (p<0.05, q<0.05). However, only 64 out of these 102 genes had more than twofold change of expression at one of the three time points examined (p<0.05, q<0.05, fold change ≥2 or ≤−2) and they are listed using standard SLC nomenclature in Table 6. The fold changes in the expression of these SLC genes were depicted for the three development stages.
Gene name, protein name, and description were omitted when distinct probes represented the same gene.
Fold change in gene expression at different time points. Positive values indicated the upregulation of expression and negative values indicated the downregulation of expression.
To gain further insights into the similarities at the transcriptome scale among mammary tissues obtained from sows at −17, 1, and 17 days relative to parturition, data from all of the significantly and differentially expressed SLC genes were used to generate a systematic cluster analysis. As shown in Figure 3, the clustering algorithm grouped day −17, day 1, and day 17 transcripts in their own distinct homogeneous group.
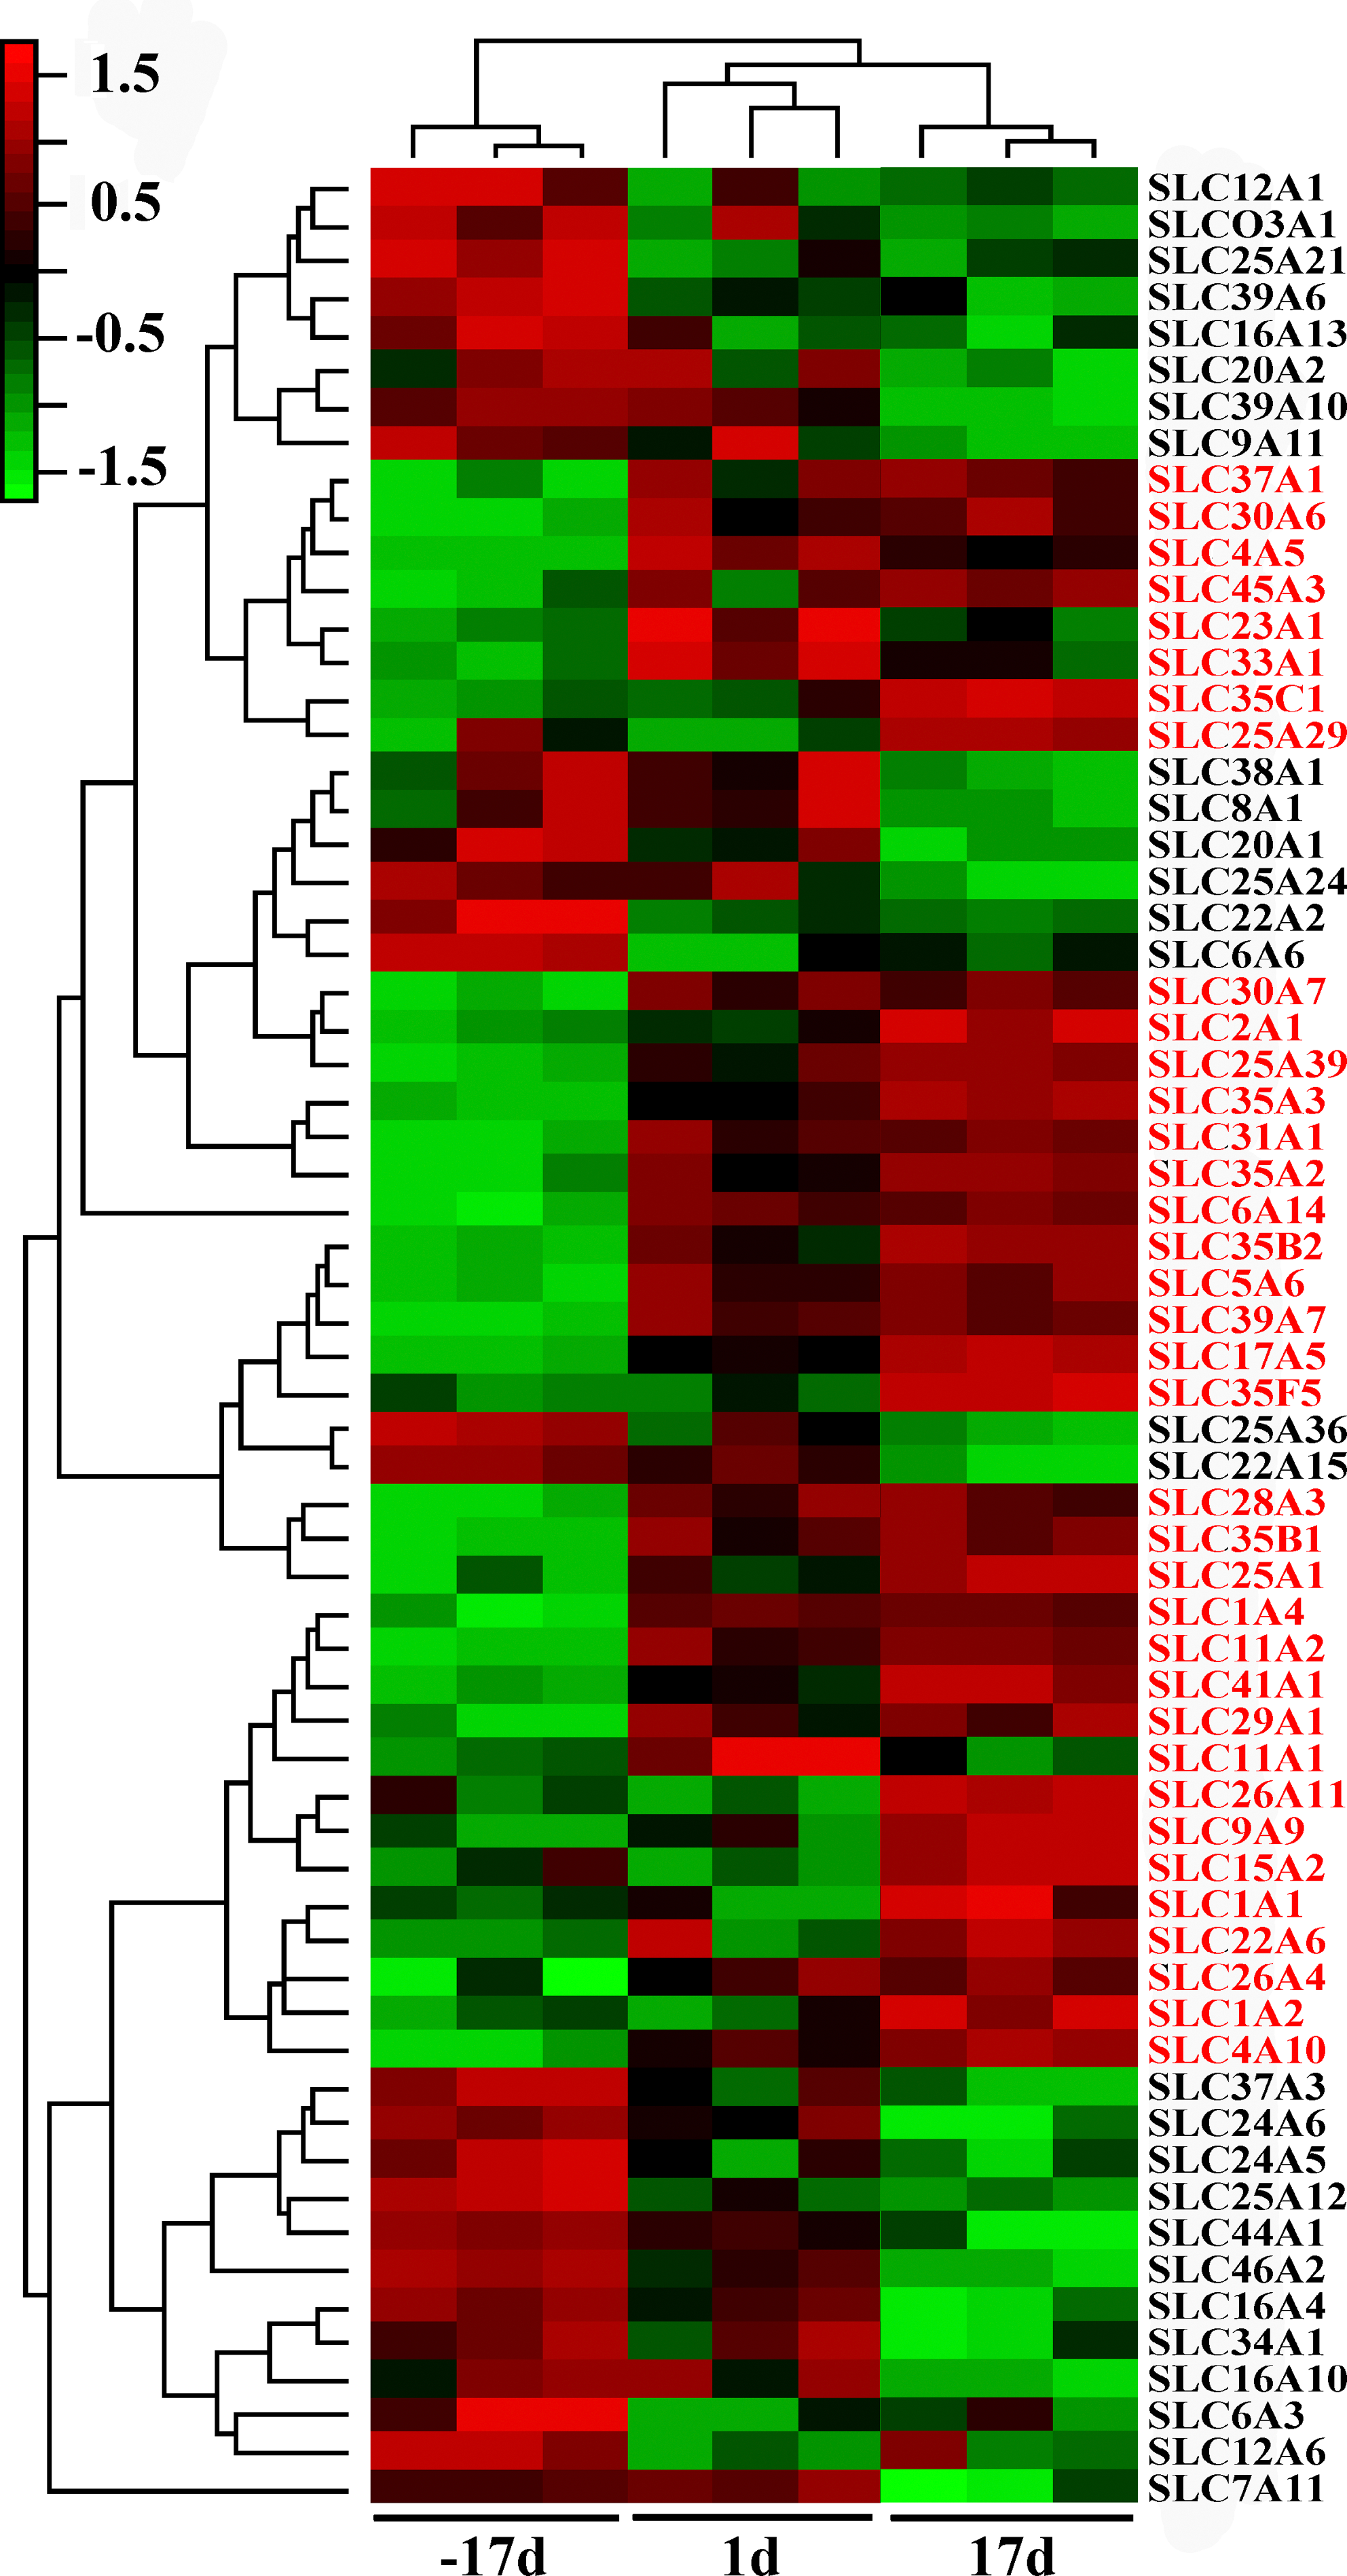
Clustering of differently expressed solute carrier genes in the porcine mammary gland over the three stages. The color codes of green, black, and red represented expression levels of low, average, and high respectively. Values of distinct transcripts representing the same gene were averaged. Gene symbols are displayed on the right side, upregulated genes during lactation are highlighted.
The SLC genes upregulated during lactation compared to late pregnancy are mostly involved in the transport of the substrate for milk component synthesis, such as AA, glucose, peptide, and metal ions. On the contrary, the majority of downregulated genes are related to ion-exchange and organic ion transport.
Discussion
To our knowledge, this is the first report that employed gene expression profiling to elucidate the molecular mechanism of lactogenesis and lactation in the porcine mammary gland. Lactogenesis involves the changes in the mammary epithelial cells that allow the development from the relatively undifferentiated mammary gland in pregnancy to full lactation sometime after parturition (Neville et al., 2001). Similar to other species (Davis et al., 1979; Strong and Dils, 1972), lactogenesis in the porcine mammary gland can be divided into two stages. Stage I occurs between days 90 and 105 of pregnancy, and stage II between days 112 of pregnancy and early lactation when the predominant feature is active milk secretion (Kensinger et al., 1986). Data from this study indicate that more than 1500 genes displayed differential expression over three stages according to relatively strict algorithms. Microarray data show that 291 genes were upregulated and 137 genes were downregulated during the foremilk stage compared to late pregnancy. This period almost covered the entire lactogenesis stages. Our findings suggest that there is a rapid adaptation in mammary gland at transcriptional level for postpartum lactation and many genes involved in lactogenesis and lactation are activated, which is consistent with previous results that marked development of the porcine mammary parenchyma occurs during the late pregnancy under the regulation of relaxin, estrogen, and progesterone (Winn et al., 1994). With the development of the ducts, lobules, and alveoli, mammary epithelial cells convert from a relatively inactive nonsecretory status during pregnancy to active milk-secreting cells at the onset of lactation (Akers et al., 1981), in which a series of functional genes are differentially expressed. Similar results were reported in stage II of lactogenesis in bovine (Finucane et al., 2008). Additionally, due to the stimulation by suckling and milk removal, the porcine mammary gland undergoes substantial growth during lactation (Hurley, 2000), 128 upregulated and 87 downregulated genes were identified to be involved in this process.
To further characterize the changes in transcriptional profiles in response to lactogenesis and lactation, the genes whose expression was significantly altered between every two distinct stages were classified into GO Slim terms. GO analysis revealed that biosynthetic processes and the maintenance of homeostasis were the major biological processes significantly associated with the upregulated genes identified at foremilk stage and peak lactation compared to late pregnancy (day 1 vs. day −17; day 17 vs. day −17 ). Therefore, these highly expressed genes may exert physiological functions during lactation. Moreover, a series of transport processes occurs, meaning that many genes implicated in transportation are activated to meet the requirements for the synthesis of lactose, milk fat, and protein. In other species such as bovines (Finucane et al., 2008) and mice (Rudolph et al., 2003), genes involved in biosynthesis and transport processes have also been reported to be upregulated with stimulated lactation. Meanwhile, the expression of genes involved in cell cycle and division, DNA replication, and cell morphogenesis were downregulated in porcine mammary glands during lactation, similar to what reported in bovines and mice. The reasons accounting for this process have been well illustrated in bovine mammary glands by Finucane et al. (2008). We speculate that, similar to bovines, porcine mammary growth may be slower during lactation than in late pregnancy, due to the decreased expression of genes involved in cell division and proliferation, which agrees with previous results that the predominant growth in the porcine mammary gland occurs in middle and late pregnancy (Hacker and Hill, 1972; Kensinger et al., 1982). Even so, the sow's mammary gland still has tremendous potential for growth during early lactation (Hurley, 2000; Kim et al., 1999), our study also confirmed that the GO term of mammary gland development is important in the period from foremilk stage to peak lactation.
Furthermore, KEGG pathway analysis of the changes in gene expression from late pregnancy to peak lactation provided significant insight into the potential biological pathways activated or inhibited in response to lactogenesis and lactation in the porcine mammary gland. As the important pathway for upregulated genes during the foremilk stage compared to late pregnancy, steroid biosynthesis was also found upregulated from late pregnancy to peak lactation. Clarenburg and Chaikoff (1966) reported that approximately 16 mg cholesterol was secreted into milk by rat per day. Similar findings have been reported in pigs by Kensinger et al. (1986). Actually, although secretion of milk does not occur at pregnancy, synthesis of fatty acids, and cholesterol has been certified during pregnancy in rabbit mammary gland (Popjak and Beeckmans, 1950). Therefore, it is reasonable that the pathway of steroid biosynthesis is upregulated from late pregnancy to peak lactation in porcine mammary gland.
In addition, our results showed that the PPAR and mTOR signaling pathways were enriched with genes upregulated during the transition from late pregnancy to peak lactation. Genes enriched in PPAR pathway encode proteins involved in lipid metabolism and transport (Casey et al., 2009), consistent with the function and activity of the mammary gland during lactation. mTOR pathway positively regulates translation and ribosome biogenesis but negatively controls autophagy, and is believed to modulate protein synthetic rates depending on the availability of translational precursors (Dennis et al., 2001). Our finding of the activation of mTOR pathway in the transition of porcine mammary gland is consistent with recent work in rodents and ruminants that highlighted a role of mTOR in the regulation of milk protein synthesis (Prizant and Barash, 2008; Toerien et al., 2010).
Notably, we found that the regulation of actin cytoskeleton was the main pathway enriched with genes downregulated in the porcine mammary gland. Actin cytoskeleton is known to mediate a variety of essential biological functions in eukaryotic cells. In addition to providing a structural framework around which cell shape and polarity are defined, the dynamic properties of actin cytoskeleton provide the driving force for cells to move and divide (Hall, 1998). Due to the ductal morphogenesis in mammary gland primarily occurred during the pregnancy, downregulated activity of actin cytoskeleton is expected. During the transition period from late pregnancy to lactation, the mammary gland undergoes dramatic functional and metabolic changes in response to lactogenesis (Hurley, 2000). Nutrient uptake in the mammary gland is considered to be a rate-limiting step for milk production. Finucane et al. (2008) reported that during the onset of lactation, mammary requirements for glucose, amino acids, and other nutrients for milk synthesis increase dramatically. Solute transport across the lactating mammary epithelium appears to be mainly transcellular because the paracellular pathway is absent during lactation. Therefore, the upregulation of SLC genes at the onset of lactation is expected, hierarchical analysis in our study also showed that the transport of the substrate for milk component synthesis was one of the most important processes at the onset of lactation. In humans, 378 SLC genes have been identified and grouped into 51 subfamilies. Of these 378 genes, we identified 179 (47.4%) genes in the porcine genome from late pregnancy to peak lactation, including 64 genes that exhibited more than twofold change at one of the three time points examined by ANOVA together with SAM algorithms.
Glucose is the obligate precursor for lactose synthesis but is also used to synthesize amino acids and lipids in some species (Kronfeld, 1982). Furthermore, glucose transport across both the basolateral and Golgi membranes of secretory cells is an important process in milk secretion. Mammalian cells take up glucose through the facilitative glucose transporter (GLUT) family and the sodium-dependent transporter (SGLT) family. The glucose transporters expressed in the mammary gland have been primarily reported in rats (Camps et al., 1994), humans (Brown and Wahl, 1993) and bovines (Zhao and Keating, 2007). In this microarray study, only glucose transporter GLUT1 (SLC2A1) mRNA expression was upregulated more than twofold from 17 days before parturition to peak lactation with a gradual increase in GLUT1 gene expression during this period. This finding is similar to the twofold increase in GLUT1 mRNA expression observed in the bovine mammary gland in early lactation compared to late pregnancy (Finucane et al., 2008). Based on this result, we speculate that GLUT1 is the predominant glucose transporter in the porcine mammary gland, as in bovines. In addition, GLUT8 (SLC2A8), GLUT12 (SLC2A12), SGLT1 (SLC5A1), and SGLT3 (SLC5A4) were detected in the porcine mammary gland but had lower expression levels in the lactation stage, indicating that they are not the primary transporters in the porcine mammary gland. Interestingly, SGLT5 (SLC5A10), which belongs to the SLC5 family, was also found expression in the porcine mammary gland. SGLT5 has been described as an exclusively renal glucose transporter in some mammals (Wright and Turk, 2004; Zhao et al., 2005). To our knowledge, this is the first report of the expression of these glucose transporters in the porcine mammary gland. Information gained from this research will be useful in improving our understanding of the processes associated with glucose assimilation in the porcine mammary gland.
During lactation, the uptake of amino acid from blood into the mammary gland is enhanced to sustain the synthesis of milk proteins (Shennan and Peaker, 2000). Amino acid (AA) uptake by the mammary gland is performed by different transporters located in the plasma membranes of the mammary epithelial cells. The expression of amino acid transporter has been extensively studied in mammalian breast tissue (Aleman et al., 2009; Sloan and Mager, 1999). Laspiur et al. (2004) identified cationic AA transporter (CAT) CAT-1 (SLC7A1) and CAT-2B (SLC7A2), broad specificity transporter for neutral and cationic AA (ATB0,+) (SLC6A14) and alanine/serine/cysteine/threonine transporter 1 (ASCT1) (SLC1A4) as expressed in porcine mammary tissue during lactation. In this study, we observed that ASCT1 and ATB0,+ exhibited varying fold of change in expression at the onset of lactation compared to late pregnancy. Moreover, the transcriptional expression of ATB0,+ and ASCT1 increased until peak lactation, which agrees with a recent study (Laspiur et al., 2009). This is expected because protein synthetic capacity and amino acid uptake by porcine mammary tissue are crucial during peak lactation compared to other physiological stages (Nielsen et al., 2002). We also identified other 25 amino acid transporters that exhibited different levels of expression. Taken together, this data present the first expression profiling of the majority of the amino acid transporters in the porcine mammary gland.
The transport of lipids across mammary gland epithelial cells determines milk lipid content and composition. The predominant route of long-chain FA (LCFA) transport into cells is via a saturable, protein-mediated mechanism (Bonen et al., 2007). Our data show that SLC27A6, the predominant isoform of solute carrier protein 27A family, was expressed in porcine mammary tissues, but its expression level did not change over the course of the lactation stages, according to the ANOVA algorithm. However, SLC27A6 showed a fivefold increase in mRNA expression during the transition from late pregnancy (−15 days) through lactation (15 days) followed by a gradual decrease in bovines (Bionaz and Loor, 2008), suggesting the species differences during mammary triacylglycerol (TG) synthesis. Fatty acid binding proteins are among the main proteins that allow rapid diffusion and the selective targeting of LCFA toward specific organelles for metabolism (McArthur et al., 1999). Our microarray data confirmed the predominance of fatty acid binding protein 3 (FABP3) mRNA expression in the porcine mammary gland, as found in bovines (Bionaz and Loor, 2008) and mice (Rudolph et al., 2007). The expression of FABP3 was upregulated at the onset of lactation and experienced a continuous increase in expression until peak lactation relative to prepartum levels. This result was further validated by Q-PCR.
We found that other types of enzymes and nutrient transporters were also developmentally regulated. The acetyl-CoA transporter (AT-1) (SLC33A1) is a multiple transmembrane protein in the endoplasmic reticulum. Acetyl-CoA is transported to the lumen of the Golgi apparatus, where it serves as the substrate for acetyltransferases that modify the sialyl residues of gangliosides and glycoproteins (Hirabayashi et al., 2004). Our microarray results showed that Acetyl-CoA transporter 1, an exclusive member of acetyl-CoA transporter family, exhibited more than twofold upregulation at 1 day postpartum relative to −17 days. Recently, Jonas et al. (2010) reported that AT-1 is essential for cell viability, as its downregulation resulted in widespread cell death and the induction of features characteristic of autophagy. In addition, the peptide transport protein (PepT) PepT2 (SLC15A2) exhibited a complicated expression patterns over the three stages. In contrast, the expression level of PepT1 (SLC15A1), a predominant peptide transporter that transports di- and tri- peptides across brush border membranes into intestinal cells (Chen et al., 2002; Daniel and Kottra, 2004), did not change relative to the time points in this study.
Conclusions
In summary, in this study we characterized global changes in gene expression and functional categories of genes that contribute to lactogenesis and lactation from late pregnancy to peak lactation in porcine mammary glands. Moreover, we identified 64 members of the SLC family that were differentially expressed over the three stages. Although the functions of many of these genes are not yet thoroughly elucidated in the porcine mammary gland, our microarray analysis provides important insight into the molecular events during lactogenesis in porcine and will guide further investigation to enhance milk yield and piglet growth.
Footnotes
Acknowledgments
This study was supported by the National and Guangdong Province Joint Research Program of China (No. 2009B090300110 and No. 2009B091300079) and the Ph.D. Programs Foundation of Ministry of Education of China (20094404110008). The authors thank Dr. Y.Z. Chen and his colleagues from the Animal Hospital of South China Agricultural University for technical assistance with the biopsies.
Author Disclosure Statement
The authors declare that no conflicting financial interests exist.
References
Supplementary Material
Please find the following supplemental material available below.
For Open Access articles published under a Creative Commons License, all supplemental material carries the same license as the article it is associated with.
For non-Open Access articles published, all supplemental material carries a non-exclusive license, and permission requests for re-use of supplemental material or any part of supplemental material shall be sent directly to the copyright owner as specified in the copyright notice associated with the article.