
Abstract
Abstract
A mixture of acetic acid, furfural, and phenol (AFP), three representative lignocellulose-derived inhibitors, significantly inhibited the growth and bioethanol production of Saccharomyces cerevisiae. In order to uncover the mechanisms behind the enhanced tolerance of an inhibitor-tolerant S. cerevisiae strain (T), we measured the plasma membrane properties, which significantly influence cellular adaptation to inhibitors, of T strain and its parental strain (P) with and without AFP treatment. We integrated data obtained from multi-statistics-assisted phospholipidomics and parallel transcriptomics by using LC–tandem MS and microarray analysis. With the AFP treatment, the transcriptional changes of fatty acid metabolic genes showed a strong correlation with the increase of fatty-acyl-chain length of phosphatidylcholine (PC) and phosphatidylinositol (PI). This suggests a possible compensatory mechanism to cope with the increase of plasma membrane permeability and fluidity in both strains. Moreover, the absence of phosphatidylserine (PS) and phosphatidylethanolamine (PE) species from the most variable phospholipid species group was a discriminative feature of the T strain. This resulted from the decrease of CHO1 and increase of CHO2 levels of the T strain upon AFP treatment. These novel findings reveal that the coordinated transcription and phospholipid composition changes contribute to the increased robustness of the T strain and highlight potential metabolic engineering targets for mutants with higher tolerance.
Introduction
Moreover, changes of plasma membrane properties are intimately related to changes of cellular lipid composition. Previous studies of yeast adaptation to environmental stresses (such as salt, temperature, and organic solvent) suggest a strong linkage between lipid compositional modifications and the stress tolerance (Redón et al., 2009; Turk et al., 2007; You et al., 2003). Debaryomyces hansenii, a marine yeast strain tolerant to a wide pH range, has been found to decrease fatty acid unsaturation in response to the stress of low pH (Turk et al., 2007). A ΔOLE1 mutant S. cerevisiae strain that cannot synthesize monounsaturated fatty acids (MUFAs), has been shown to enhance the tolerance to ethanol by supplementing with oleic acid (18:1), suggesting the importance of long-chain MUFAs in compensating the fluidizing effect caused by organic stress (You et al., 2003). These studies showed the relationship between lipid composition and stress tolerance, but they focused on total fatty acids, without differentiating the free fatty acids and the fatty acids released from various glycerol lipids. Among all lipid classes, the phospholipid is the major building block of the membrane bilayer and maintains physicochemical properties and functions of biological membranes (Myers et al., 2011). Phospholipidomics, an important subdiscipline of metabolomics, has been applied in global analysis of the phospholipid species in fermenting S. cerevisiae, potentially leading to the development of more sustainable industrial biotechnological processes (Tian et al., 2010; Xia and Yuan, 2009; Zhou et al., 2010). We have previously established phospholipid profiling of industrial S. cerevisiae strains by using LC–MSn analysis (Xia and Yuan, 2009). By comparing the phospholipidomes of the parental S. cerevisiae strain and three tolerant strains, we have demonstrated that the alteration of PC, PI, and phosphatidic acid (PA) abundance were respectively important to improve the cell resistance to acetic acid, furfural, and phenol (Xia and Yuan, 2009). However, how the phospholipidome reacts to AFP, and how these reactions relate to the alteration of membrane properties, remain unclear.
As shown in our recent reports, compositional change of the phospholipids was indeed an important functional-level adjustment to lignocellulose-derived inhibitor-induced stress (Xia and Yuan, 2009). Generally, the functional alteration is intrinsically subjected to genetic modifications, making transcriptomics one potent tool to further reveal the underlying mechanisms contributing to functional changes. It has been reported that the treatment with different weak acids (such as acetic acid, propionic acid, and decanoic acid) of S. cerevisiae induced multiple adaptive responses at the transcriptome level, and that some of the general changes were further involved with the reconfiguration of lipid composition (Mira et al., 2010a). For instance, a majority of the ERG transcripts were elevated with general tolerance to weak acids, leading to an increase of ergosterol synthesis. Ma and Liu have reported that RSB1 and ICT1, two genes involved in phospholipid biosynthesis, were related to the adaptation to 5-hydroxymethylfurfural (5-HMF, another toxic furan aldehyde) during the lag phase (Ma and Liu, 2010). A genome-wide screen showed increased sensitivity to 2,4-diacetylphloroglucinol (2,4-DAPG), an antibiotic phenolic compound, in CHO1, FEN1, and LSB5 single-gene deletion mutants of S. cerevisiae (Kwak et al., 2011). These genes encode catabolic enzymes of lipid metabolism, suggesting the importance of lipid composition in phenolic compound tolerance. Our previous study has also shown that several lipid metabolic genes, such as EPT1 and POX1, were respectively involved in adaptation to furfural and to acetic acid (Li and Yuan, 2010). These studies illustrated how modifications in lipid metabolic gene expression altered in response to a single or a class of inhibitors; however, whether AFP tolerance can be similarly affected remains unknown. More importantly, how these transcriptomic responses to AFP treatment modulate the phospholipidome and plasma membrane properties also remains elusive.
Therefore, in order to uncover the underlying mechanisms of AFP tolerance, we examined the plasma membrane properties of two strains with different levels of tolerance to AFP. We obtained and integrated phospholipidomics and transcriptomics data of the parental S. cerevisiae strain (P), and inhibitor-tolerant strain (T), in the presence (+) and absence (−) of AFP by using an improved LC–tandem MS with complementary transcriptomic microarray analysis. This study will inform the construction of inhibitor-tolerant mutants for production of bioethanol via lignocellulosic biomass fermentation.
Materials and Methods
Materials
1,2-Dilauroyl-sn-glycero-3-phospho-(1′-rac-glycerol) (sodium salt) (PG12:0/12:0), 1,2-dilauroyl-sn-glycero-3-phosphoethanolamine (PE12:0/12:0), 1,2-dilauroyl-sn-glycero-3-phosphocholine (PC12:0/12:0), 1,2-dipalmitoyl-sn-glycero-3-phospho-(1′-myo-inositol) (ammonium salt) (PI16:0/16:0), 1,2-dilauroyl-sn-glycero-3-phospho-L-serine (sodium salt) (PS12:0/12:0), 1-myristoyl-2-hydroxy-sn-glycero-3-phosphoethanolamine (LPE14:0), and 1,2-dimyristoyl-sn-glycero-3-phosphate (sodium salt) (PA14:0/14:0) were obtained from Avanti Polar Lipids (Alabaster, AL, USA). Chloroform and methanol (HPLC grade) were obtained from Merck (Darmstadt, Germany). Ammonium hydroxide (28%) was procured from J&K Chemical (Beijing, China). All other chemicals used in this study were of the highest grade available commercially.
Strains and culture conditions
Two strains of S. cerevisiae were used in our experiments: the P strain (product no. 80000012; Angel Yeast Corp., Yichang, Hubei, China), and the T strain derived from P by random mutagenesis with phenotypic selection. The T strain was deposited in the China General Microbiological Culture Collection (CGMCC) Center (no. 2757). Two-stage seed culture and fermentation were carried out as previously described (Ding et al., 2012). Briefly, the primary seed culture was performed by inoculating the cells into 250-mL conical flasks containing 50 mL yeast extract peptone dextrose (YPD) liquid medium (2% glucose, 2% peptone, and 1% yeast extract, w/v) at an OD600 of 0.2, and incubating for 10 h (30°C, 150 rpm). The secondary seed culture was performed by transferring the cells from primary culture to high-glucose YPD medium (10% glucose, 2% peptone, and 1% yeast extract, w/v) at an OD600 of 0.5, and incubating overnight (30°C, 150 rpm). To perform phospholipidomic and transcriptomic investigation for both strains, the cells were grown under fermentative conditions by inoculating the secondary seed culture into 5-L fermenters (1.5BG-4-3000; Baoxing Bio-Engineering Equipment Co., Ltd., Shanghai, China) containing 3 L high-glucose YPD medium at an OD600 of 1.0 (30°C, 300 rpm), with or without AFP, and the combination of 5.3 g•L−1 acetic acid, 1.3 g•L−1 furfural, and 0.5 g•L−1 phenol. Notably, the concentrations of acetic acid and furfural used here were approximately their average level in lignocellulosic hydrolysates (Almeida et al., 2007; Martinez et al., 2001). The phenol concentration used was lower than the average level of total phenols (∼2.5 g•L−1), because phenol is the most toxic phenolic compound and a higher concentration of phenol was not suitable for fermentation due to the extremely long lag-phase by the P strain. This condition was chosen to mimic the situation in batch culture using lignocellulosic hydrolysates, as well as to be suitable for fermentation. The mid-lag phase cells of P−, T−, P+, and T+ were collected for further studies.
Membrane integrity, permeability, and fluidity assay
The cells were washed twice and resuspended in PBS for the integrity assay using propidium iodide staining (Villas-Bôas et al., 2005). Approximately 5×10⁶ cells in 0.9 mL PBS were added with 0.1 mL propidium iodide stock (0.5 mg•mL−1), incubated for 10 min on ice in the dark, and were inspected using fluorescence microscopy (Eclipse E800; Nikon, New York, NY, USA). For the permeability assay, the washed cells were resuspended in PBS in the absence or presence of AFP for 30 min as previously described (Hammer et al., 2004). The release of nucleotides was then measured at an optical density of 260 nm. The membrane fluidity was measured by applying 1,6-diphenyl-1,3,5-hexatriene (DPH) as a fluorescence probe as previously described (Laroche et al., 2001). Briefly, the washed cells were incubated in DPH at a final concentration of 2 μM, then shaken in the dark at 30°C for 40 min. After incubation, the unincorporated DPH was removed by washing with PBS twice. The cells were resuspended in PBS to get a final density of OD600=0.2 for the measurement of fluorescence anisotropy on a spectrofluorometer. The wavelengths were 342 nm and 432 nm and slit widths were 5 nm and 10 nm for excitation and emission light, respectively. The fluorescence anisotropy, which was negatively correlated with membrane fluidity, was calculated as previously described (Laroche et al., 2001).
Phospholipid extraction
The total phospholipid was extracted as previously described (Xia and Yuan, 2009). Collected cells with the appropriate amounts of the internal standards (i.e., PG12:0/12:0, PE12:0/12:0, PC12:0/12:0, PI16:0/16:0, PS12:0/12:0, PA14:0/14:0, and LPE14:0) were added to 0.6 mL 0.05% acetic acid. Then 3 mL chloroform/methanol (2:1 v/v) with 0.01% butylated hydroxytoluene (BHT) was added. After vigorous vortexing followed by centrifugation (94 g for 5 min), the bottom layer was transferred to a new tube. This two-phase extraction step was repeated thrice. The combined collection of the organic layer was washed (once with 0.5 mL of 1 M KCl, and once with 1 mL of ultrapure water), centrifuged (376 g for 3 min), and recovered under a gentle stream of nitrogen. The resulting lipid samples were stored at −40°C until they were redissolved in 1 mL chloroform/methanol (1:1 v/v) with 0.01% BHT for analysis. The cell residues were centrifuged (14,000 g for 10 min) to remove most of the aqueous part, then dried at 75°C overnight to achieve a constant dry weight. At least six replicates were prepared for the next analysis step.
LC–tandem MS analysis
The LC–tandem MS analysis of phospholipids was carried out on a Waters Alliance 2695e HPLC/autosampler system (Milford, MA, USA), coupled to a Waters Quattro micro API triple quadrupole MS system (Micromass, Manchester, U.K.). The total phospholipid was separated on a Venusil XBP Silica column (150×2.1 mm i.d., 5 μm) with the column temperature at 25°C. The mobile phase A was chloroform/methanol/28% ammonium hydroxide (89.5/10/0.5 v/v), and mobile phase B was chloroform/methanol/water/28% ammonium hydroxide (55/39/5.5/0.5 v/v). The linear gradient program was as follows: 0–7 min, 10–23% B; 7–10 min, 23% B; 10–15 min, 23–28% B; 15–20 min, 28–34% B; 20–25 min, 34–40% B; 25–45 min, 40–50% B; 45–50 min, 50% B; 50–60 min, 50–10% B; 60–70 min, 10% B. The injection volume was 5 μL, and the flow rate was 0.2 mL·min−1.
A direct infusion of the internal standards in chloroform/methanol (50/50 v/v) by the syringe pump at 30 μL•min−1 was used in both MS and tandem MS mode to determine the source and analyzer parameters and confirm the exact parent/daughter ion mass (±0.2 Da) for multiple reaction monitoring (MRM) scan. The MRM was used in both positive and negative electrospray ionization (ESI) mode with the capillary voltages of 3.5 and −3 kV, respectively. The extractor voltage and RF lens were 3 V and 0.1 V; the source and desolvation temperatures were 100°C and 350°C; nitrogen was used as the desolvation and cone gas at flow rates of 400 L•h−1 and 50 L•h−1, respectively. The dwell time, inter-scan delay, and inter-channel delay were 0.04 sec, 0.01 sec, and 0.1 sec, respectively. The parent/daughter ions, cone voltage, and collision energy for each phospholipid species are listed in Supplementary Table S1 (see online supplementary material at http://www.liebertonline.com). Each detected peak was integrated using ApexTrack™ peak detection algorithms in the Masslynx Quanlynx Applications Manager (version 4.1) package. The peak area of each species was then normalized to that of the corresponding internal standard and sample dry weight, and expressed as nmol phospholipids per mg dry weight.
Multi-statistics
The X108×24 matrix was defined as the content of 108 phospholipid species in 24 samples (6 replicates each for P−, P+, T−, and T+, respectively). The Y vector was defined as the mid-lag phase time point of each sample. The X and Y dataset were imported into SIMCA-P demo software for orthogonal partial least squares (OPLS) analysis with pareto-scaling as previously described (Yang et al., 2008).
RNA isolation, labeling, hybridization, and scanning
The procedure of RNA microarray analysis was applied as previously described (Li and Yuan, 2010). The isolation of total RNA was carried out by the hot phenol method (Schmitt et al., 1990), to yield a concentration of ∼40 μg/mL RNA. The purity and integrity of extracted RNA were assessed by the OD260/OD280 and by agarose gel electrophoresis. Double-stranded cDNA was then synthesized from the extracted RNA. Using purified cDNA as the template, the biotin-labeled cRNA was synthesized and purified with a QIAGEN RNeasy Total RNA Isolation kit (QIAGEN, Inc., Valencia, CA, USA). The OD260/OD280 was measured to evaluate the purity of cRNA. After dilution and fragmentation, cRNA was hybridized to a GeneChip® Yeast Genome 2.0 Array (Affymetrix, Inc., Santa Clara, CA, USA), and scanned on a Genechip® Scanner 3000 with the GeneChip® Operating Software (GCOS) system (Affymetrix), at CapitalBio Corporation (Beijing, China), according to the Affymetrix protocol (www.affymetrix.com).
Statistical analysis
Lipid analysis data represent the mean of at least five tests, and for microarray analysis was run in duplicate. Both are expressed as mean±standard error of the mean (SEM). A value of p<0.05 was considered statistically significant using t-tests.
Results and Discussion
Bioethanol produced by lignocellulosic biomass fermentation is an attractive alternative energy source. However, several concomitant problems, including the adaptation of S. cerevisiae to inhibitors derived from lignocellulosic hydrolysates, have yet to be solved (Lin et al., 2009). Therefore, we have previously obtained a mutant strain T with higher tolerance to inhibitors by random mutagenesis from the parental industrial strain P. The growth and fermentation performance of strains both with and without AFP treatment have been characterized (Ding et al., 2012). In the presence of AFP, the mid-lag phase and mid-log phase of the P strain were delayed from 1.5 h to 19.5 h, and from 5.5 h to 70 h, respectively; and those of T strain were delayed from 2 h to 3 h, and from 6.5 h to 9.5 h, respectively. Compared to P+ cells, the growth cycle duration of T+ cells decreased by 12-fold, while the productivity of ethanol increased by fourfold. This suggests a more rapid adaptation to AFP and a sustained fermentation, which indicates profound genetic and phenotypic modifications of the T strain in correlation with higher inhibitor resistance (Ding et al., 2012). This also suggests that the P strain adapted well to AFP at the elongated lag phase. Therefore, four groups of mid-lag-phase cells (P−, T−, P+, and T+) were employed for the following studies.
Plasma membrane permeability, integrity, and fluidity studies
Several studies have shown that acetic acid, furfural, and phenol inhibited S. cerevisiae fermentation growth by affecting the properties of the plasma membrane or the membranes of several organelles (Allen et al., 2010; Guldfeldt and Arneborg, 1998; Palmqvist and Hahn-Hägerdal, 2000b). Herein plasma membrane integrity, permeability, and fluidity assays were carried out to learn how AFP affected these properties of the P and T strains (Fig. 1). First, the membrane integrity was assessed using propidium iodide, an indicator that can penetrate the damaged plasma membrane, forming a fluorescent complex with DNA or RNA. As shown in Figure 1a, propidium iodide did not permeate the plasma membrane of untreated cells, but did permeate and stain the AFP-treated cells. Compared to the T strain, the proportion of stained cells was higher in the P strain, suggesting a remarkable loss of membrane integrity due to AFP treatment. This finding was in agreement with reports of plasma membrane damage by three single inhibitors (Allen et al., 2010; Guldfeldt and Arneborg, 1998; Palmqvist and Hahn-Hägerdal, 2000b).

The integrity (
In addition, we measured plasma membrane permeability by detecting the leakage of OD260 material (predominantly nucleotides). As shown in Figure 1b, no significant difference was observed between the membrane permeability of P− and T−. The AFP treatment increased the plasma membrane permeability of P+ and T+ by 144% and 40%, respectively, compared to corresponding untreated cells, indicating an inverse correlation between membrane permeability and inhibitor resistance. This result was consistent with a previous study of acetic acid resistance, which showed that compared to S. cerevisiae, the less permeable Z. bailii is more resistant to long-term acetic acid treatment (Arneborg et al., 2000).
To evaluate plasma membrane fluidity, we analyzed the fluorescence anisotropy of DPH, which is negatively correlated to fluidity. As shown in Figure 1c, the anisotropy value of T− and T+ were respectively 2.26- and 1.79-fold of P− and P+, indicating much less plasma membrane fluidity of the T strain with and without AFP treatment. Moreover, the AFP treatment decreased the anisotropy values of the P and T strains by 0.22- and 0.38-fold, respectively, demonstrating an increase of plasma membrane fluidity in response to AFP. These anisotropy alterations were in accordance with the transcriptional changes of the ergosterol (ERG) gene (Supplementary Fig. S1; see online supplementary material at http://www.liebertonline.com). Both the ergosterol and phospholipid abundance have been suggested to influence the plasma membrane fluidity, which is important for stress tolerance of yeast (Turk et al., 2007). It has been reported that several transcripts of the ERG gene were required for acetic acid tolerance to exert a protective effect (Mira et al., 2010b). In contrast, the marine yeast Debaryomyces hansenii, which is tolerant to low pH, showed a much smaller sterol-to-phospholipid ratio and much higher membrane fluidity than S. cerevisiae (Turk et al., 2007). We suggest that the alterations of plasma membrane fluidity and changes of the abundance of ERG transcripts in response to AFP may be related to the interactive effect of these three inhibitors, which has also been demonstrated by our previous metabolomics study (Ding et al., 2011).
The above-discussed studies found differential alterations of plasma membrane properties in the AFP-treated T strain in correlation with the enhanced inhibitor-tolerance. Phospholipid composition has been reported to affect both the plasma membrane properties and the cell resistance to various stresses, such as vacuum, high inoculum size, and organic solvent (Ghosh et al., 2008; Tian et al., 2010; Zhou et al., 2010). In order to discover the phospholipid composition changes and underlying genetic modifications related to these altered membrane properties, we integrated phospholipidomics and transcriptomics data for an in-depth study.
The phospholipid profiling and multi-statistical modeling of two strains
Complementary approaches are powerful tools in “-omics” research. The integration of metabolomics and transcriptomics by mathematical methods (Bradley et al., 2009; Walther et al., 2010) showed a strong correlation between the datasets acquired from these two levels. To examine the changes of phospholipid profiling in relation to inhibitor-tolerance in the current study, a comparative phospholipidomics with OPLS analysis was applied to uncover the most variable phospholipid species. We first identified a total of 108 phospholipid species based on our previous profiling of the P strain at exponential-phase (Xia and Yuan, 2009), and further quantified them by MRM scanning (the MS parameters and the corresponding retention time for each MRM transition are shown in Supplementary Table S1; see online supplementary material at http://www.liebertonline.com). The content of each species in P+, T−, and T+ was normalized to that of the corresponding species in P−, and expressed by a heat map (Fig. 2). The dark red and dark green squares were dominant in T−, which indicated similar phospholipid compositions in the two strains. Interestingly, we observed a tight correlation between the phospholipid fatty-acyl-chain length and the changes in the content of PE, PC, and PI species: AFP treatment decreased the content of PE, PC, or PI species that attached with shorter fatty acyl chains (e.g., 24C and 26C), while it increased those with longer fatty acyl chains (e.g., 34C and 36C). The heat map revealed some of the alterations of phospholipid profiling in P and T with AFP treatment, but a more precise examination by multi-statistical analysis is needed to better understand and interpret this large dataset.
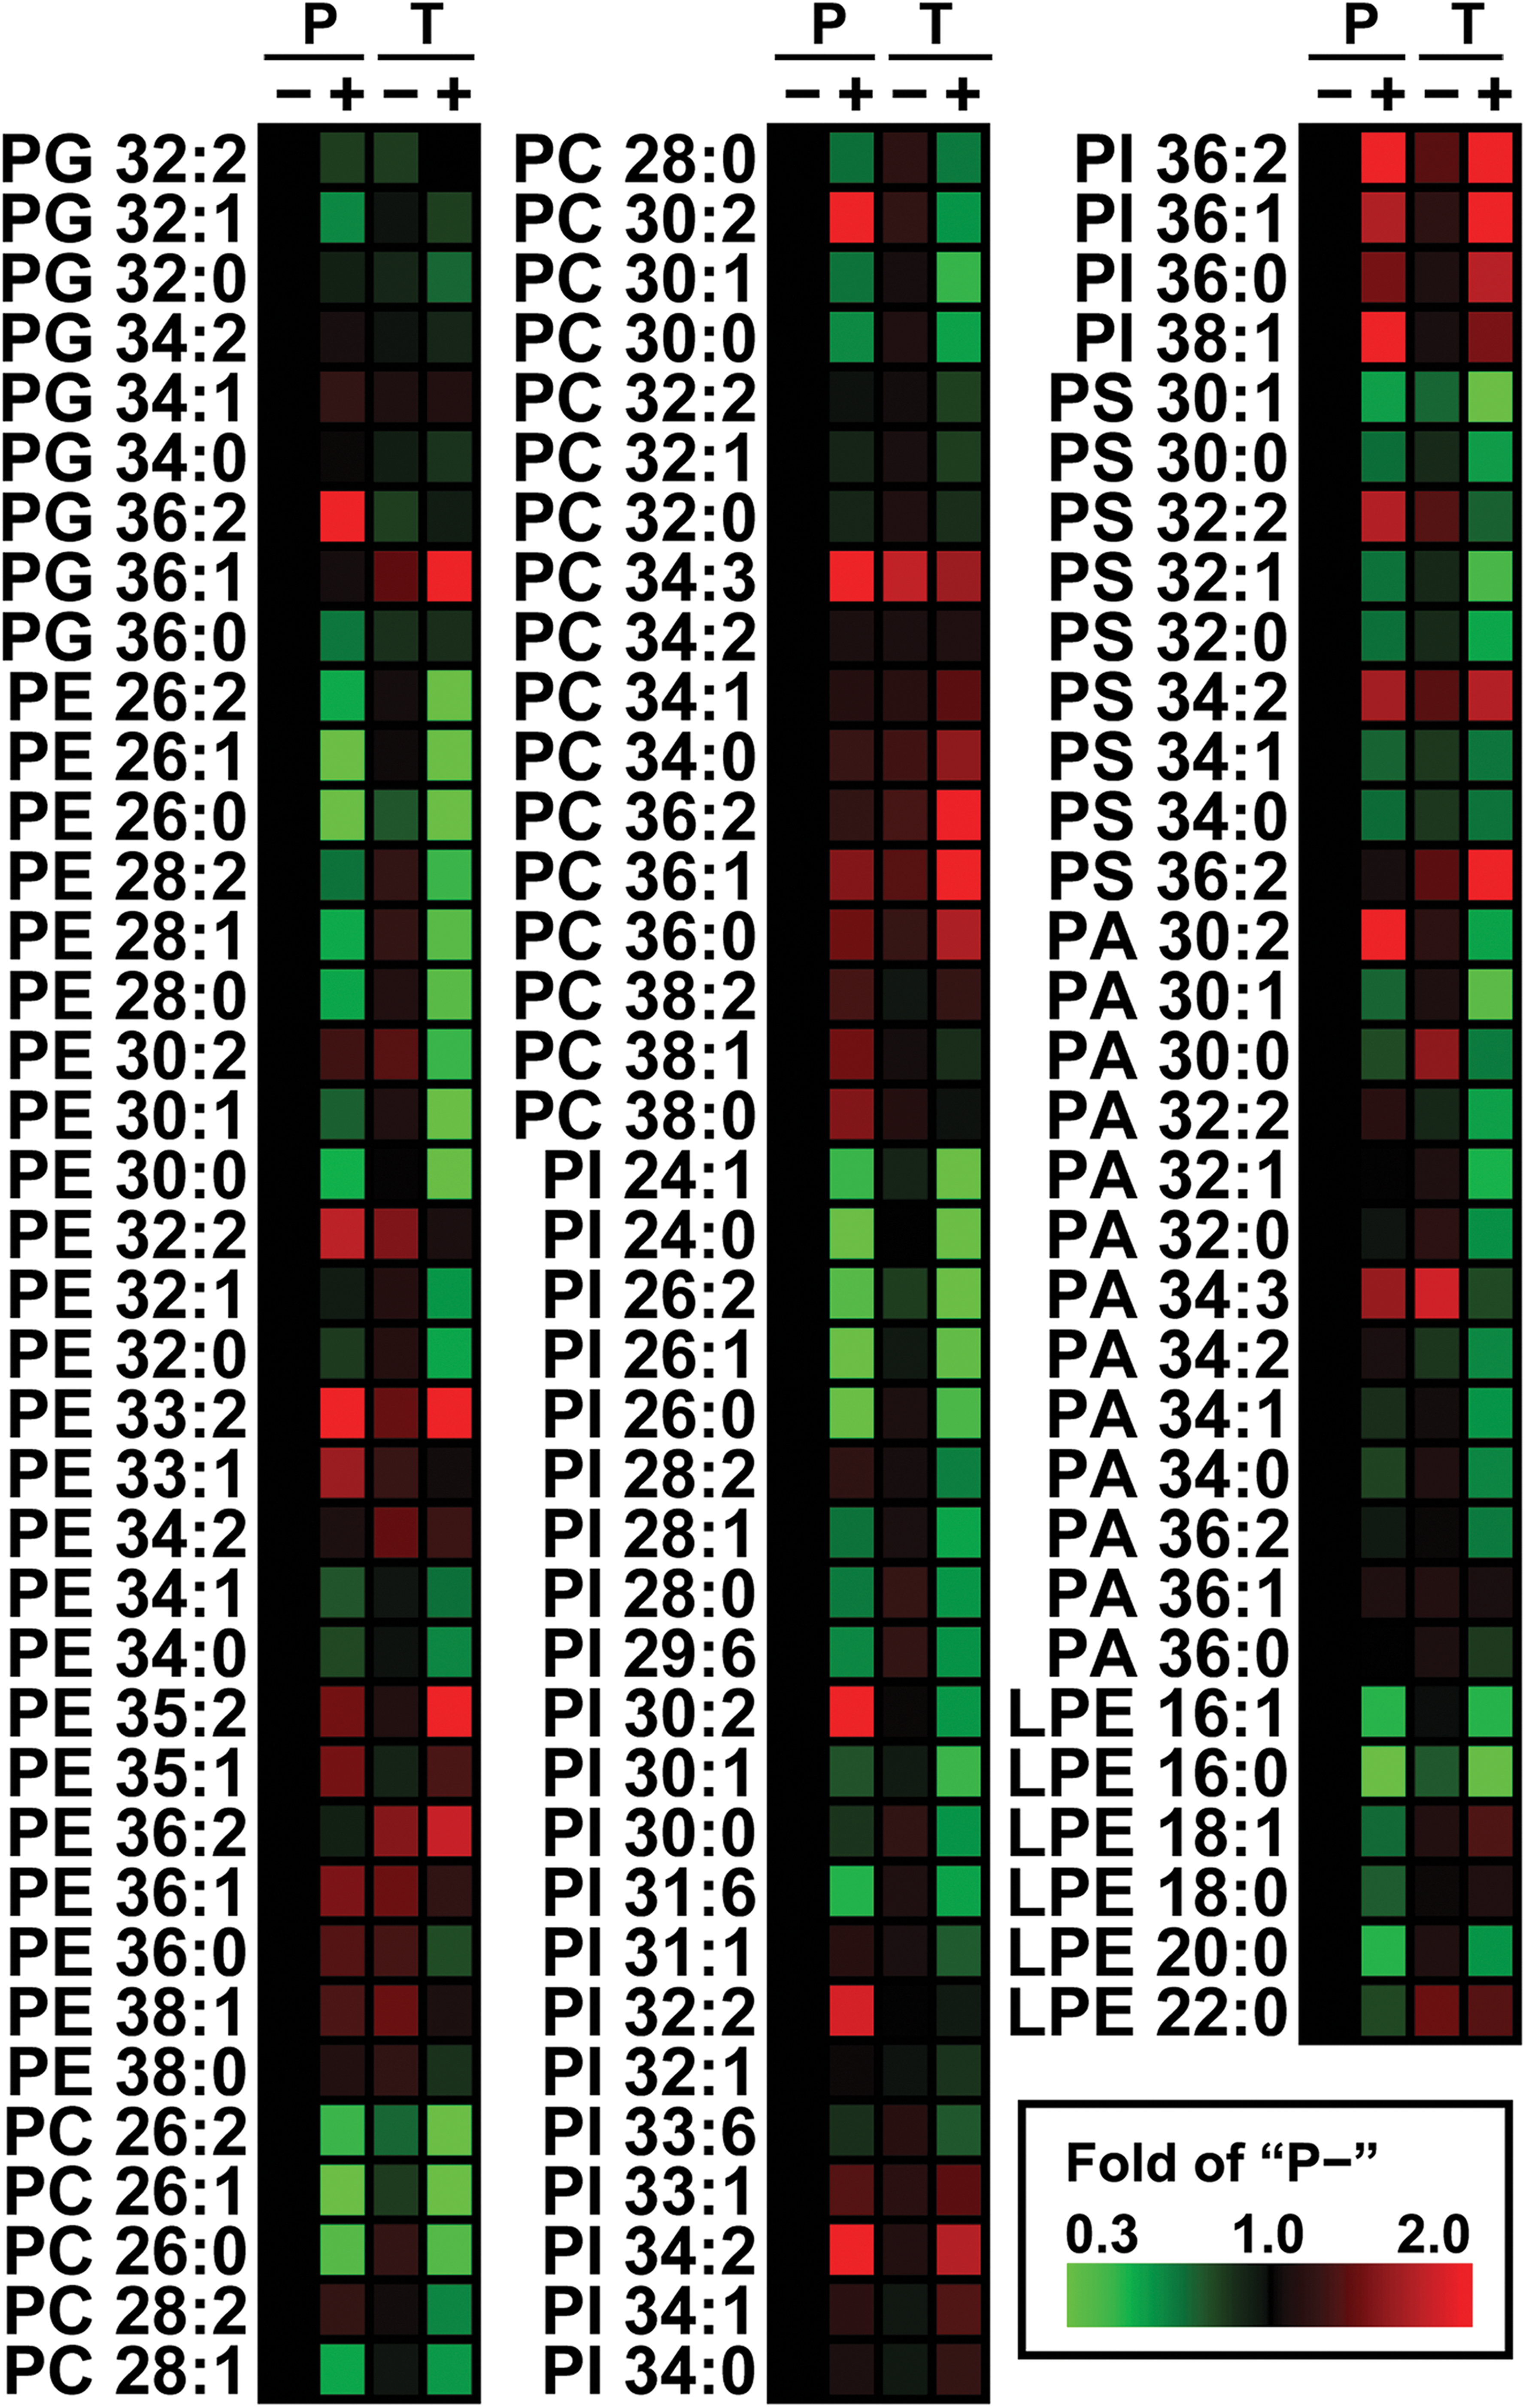
Heat map of phospholipid profiles from parental (P) and inhibitor-tolerant (T) strains of industrial S. cerevisiae yeast in the absence (–) and presence (+) of combined inhibitors (AFP; acetic acid, furfural, and phenol) at mid-lag phase. The content of each molecular species is expressed by fold changes compared to P– value. The structure of each lipid was expressed as “X m:n”, where X stood for its phospholipid class, and m and n referred to total acyl chain lengths and carbon double bonds for the two acyl chains together. The scale of fold changes are indicated by the color squares at the bottom right of the map. The bright red and green colors represent the most elevated and reduced molecules.
We then processed the profiling data using OPLS analysis for a clearer visualization and interpretation of the raw data from all samples and phospholipid molecules. The OPLS output consisted of a score-plot and an S-plot. The score-plot (t[1]P/u[1]P) optimized the classification of different samples, and the S-plot (w*c[1]P/p(corr)[1]P) extracted the most variable species, which discriminated sample groups by the correlation between their phospholipid composition and lag-phase duration. In the score-plot of the P−/T−/P+/T+ OPLS model (Fig. 3), the clustering of P− and T− demonstrated the similarity of the phospholipid profiles of these two sample groups. The greater distance of P+ from the other three sample groups indicated a large difference in phospholipid composition. Moreover, the distribution of the four sample groups along the upward diagonal of the score-plot indicated a tight correlation of the lag-phase duration and phospholipid composition, suggesting that the alteration of the phospholipidome upon AFP treatment was closely related to the differential inhibitor-tolerance of these two strains.

Score plot of the orthogonal partial least squares (OPLS) model. A total of 24 spots corresponded to these 24 samples in 4 groups, including parental strains with (P+, ♦) and without (P−, ⋄) AFP, and tolerant strains with (T+, ▴) and without (T−, ▵) acetic acid, furfural, and phenol (AFP). The distance between two spots indicates the biochemical similarity between the two samples. The phospholipid compositions are more similar in spots that are in closer proximity than in those that are farther apart.
The P− versus P+ and T− versus T+ OPLS models (Fig. 4) resembled the score-plots. Both P− and T− spots were distributed at the bottom left, while the corresponding P+ and T+ spots were distributed at the top right of the plots (Fig. 4a and 4d). To compare the different responses of the two strains to AFP, we extracted the 20 most variable lipid species from each S-plot, which were the most contributive molecules in the discrimination of P− from P+, and T− from T+ (Fig. 4b and 4e, labeled by the ellipses). The most variable lipid species in groups I and II (Fig. 4c) were positively correlated to P− and P+, respectively. Similarly, the 20 most variable lipid species in groups III and IV (Fig. 4f) were positively correlated to T− and T+, respectively.

The orthogonal partial least squares (OPLS) model of parental strain P (
First, the groups I and III included the PC and PI species with saturated or monounsaturated shorter acyl chains, such as PC26:0 and PI28:1. The groups II and IV included the PC and PI species with mono- or di-unsaturated longer acyl chains, such as PC36:2 and PI34:1. These results agreed with the increase of average length and average unsaturation degree of the cellular phospholipid fatty acyl chains of both strains upon AFP treatment (Supplementary Fig. S2; see online supplementary material at http://www.liebertonline.com). These findings suggest that changes in the fatty-acyl-chain length of PC and PI clearly discriminated the treated and the untreated cells. Second, the PE and PS species were included in the most variable lipid species groups I, II, and III, but not group IV, which was positively related to T+. This observation suggests that the PS and PE metabolism were related to the differential inhibitor-tolerance of the two strains (i.e., the presence and absence of certain PS and PE molecules after AFP treatment clearly discriminated the T and P cells).
According to previous studies, the phospholipid 16:1- and 18:1-fatty acyl chains are important for ethanol tolerance by decreasing cell plasma membrane permeability (Lei et al., 2007). The supplementation of oleic acid (18:1) to an S. cerevisiae mutant strain compensated the fluidizing effect induced by ethanol stress and enhanced the tolerance of the cells (You et al., 2003). These studies and our results together imply that the increase of PCs and PIs with long fatty acyl chains is an important compensatory mechanism for the increase of plasma membrane permeability and fluidity when subjected to AFP. Notably, the increment of average fatty-acyl-chain length was higher in the T strain (Supplementary Fig. S2; see online supplementary material at http://www.liebertonline.com), suggesting a correlation between inhibitor resistance and phospholipid fatty acyl chain composition. More importantly, the most variable species acquired from OPLS analysis showed that among all phospholipid classes, changes of the fatty-acyl-chain composition of PCs and PIs (Fig. 4c and 4f) were most contributive in discriminating treated from untreated cells.
Taken together, compared to the heat map, which showed increased fatty-acyl-chain length of PE, PC, and PI, the OPLS model provided more precise information and suggests a more significant correlation between the increase of lag-phase duration and a selective increase of fatty-acyl-chain length of PC and PI. The change of fatty-acyl-chain length of PC and PI was an important self-defense mechanism that compensated for the increase in permeability and fluidity in response to AFP. In addition, the OPLS model demonstrated that the PE and PS molecules could be used to discriminate two stains (i.e., P and T) with different inhibitor-tolerance, which could not easily be discerned from the raw data or the heat map results. To further explore the underlying reasons for the higher increments of the phospholipid fatty-acyl-chain length and the absence of the most variable PE and PS species of the T strain, we analyzed the data from a parallel transcriptomic study.
Alterations of phospholipid metabolism-related transcriptomic data
Fatty acid metabolic genes modulated differentially-increased phospholipid fatty-acyl-chain length of two strains
In order to explore the reasons for the increase of the content of long-chain PC and PI species upon AFP treatment (a discriminative feature of treated cells from untreated cells), we took a closer look at the transcripts of fatty acid biosynthesis, elongation, and degradation catalytic genes (Fig. 5). Compared to the T strain, treatment with AFP decreased the transcript levels of ELO1, FEN1, SUR4, ACC1, FAS1, and FAS2 of the P strain significantly (the transcript IDs are listed in Supplementary Table S3; see online supplementary material at http://www.liebertonline.com). These genes encode three fatty acid elongases, the acetyl-CoA carboxylase, and the α- and β-subunits of fatty acid synthase complex (Rössler et al., 2003; Shirra et al., 2001; Tehlivets et al., 2007). In addition, the treatment with AFP increased the transcript signal of FAT1 of the T strains. The FAT1 gene encodes a fatty acid transport protein which is responsible for the activation of acyl-CoA and the homeostasis of intracellular fatty acids (Zou et al., 2002). These combined results suggest a higher ability of the T strain in elongation, synthesis, and transportation of fatty acids upon AFP treatment, which results in the higher increment of average phospholipid fatty-acyl-chain length of T+ (Supplementary Fig. S2; see online supplementary material at http://www.liebertonline.com). In particular, the transcript signals of POX1 of P+ and T+ cells were respectively increased by ∼48-fold and ∼0.48-fold, compared to the corresponding untreated cells. The POX1 encodes the fatty-acyl-CoA oxidase, the rate-limiting enzyme of fatty acid β-oxidation (Gurvitz et al., 2001), suggesting that the fatty acid degradation (β-oxidation) was intensely activated in P+ cells, and also plays a role in the modulation of phospholipid fatty-acyl-chain length in this case.

The transcript levels of ELO1, FEN1, SUR4, ACC1, FAS1, FAS2, FAT1, and POX1. Results are expressed as the mean of duplicate signal/1000±standard error of the mean (*p<0.05, **p<0.01 for “+” compared to “−”).
CHO1 and CHO2 respectively modulated the compositional changes of PS and PE of the T strain
In order to examine the reasons for the absence of PS and PE species from the most variable lipid species group IV (a differentiating feature of the T strain from the P strain), we examined the metabolic pathways of the major phospholipid classes. As shown in Figure 6, the CDS1 and PAH1 encoding metabolic enzymes respectively catalyzed the production of CDP-DAG and DAG from PA. The PGS1, PIS1, CHO1, PSD1, PSD2, CHO2, and OPI3 genes encoding key enzymes catalyze the de novo biosynthesis of PG, PI, PS, PE, and PC from CDP-DAG. The synthesis of PS from CDP-DAG and serine is catalyzed by PS synthase (Cho1p, encoded by CHO1). The transcript signal of CHO1 was elevated in P and reduced in T when treated with AFP (Fig. 6), suggesting similar alterations of the PS synthesis rate. To test this hypothesis, we examined the data from parallel metabolite profiling (cluster_3, Fig. 2a from Ding et al., 2012) and found that the serine concentration respectively decreased and increased in P and T upon AFP treatment. The transcript and metabolite data strongly correlate with each other, suggesting respectively increased and decreased PS synthesis in the P and T strains. These results show that the transcript signal of CHO1 affected PS abundance by tightly modulating PS synthesis.
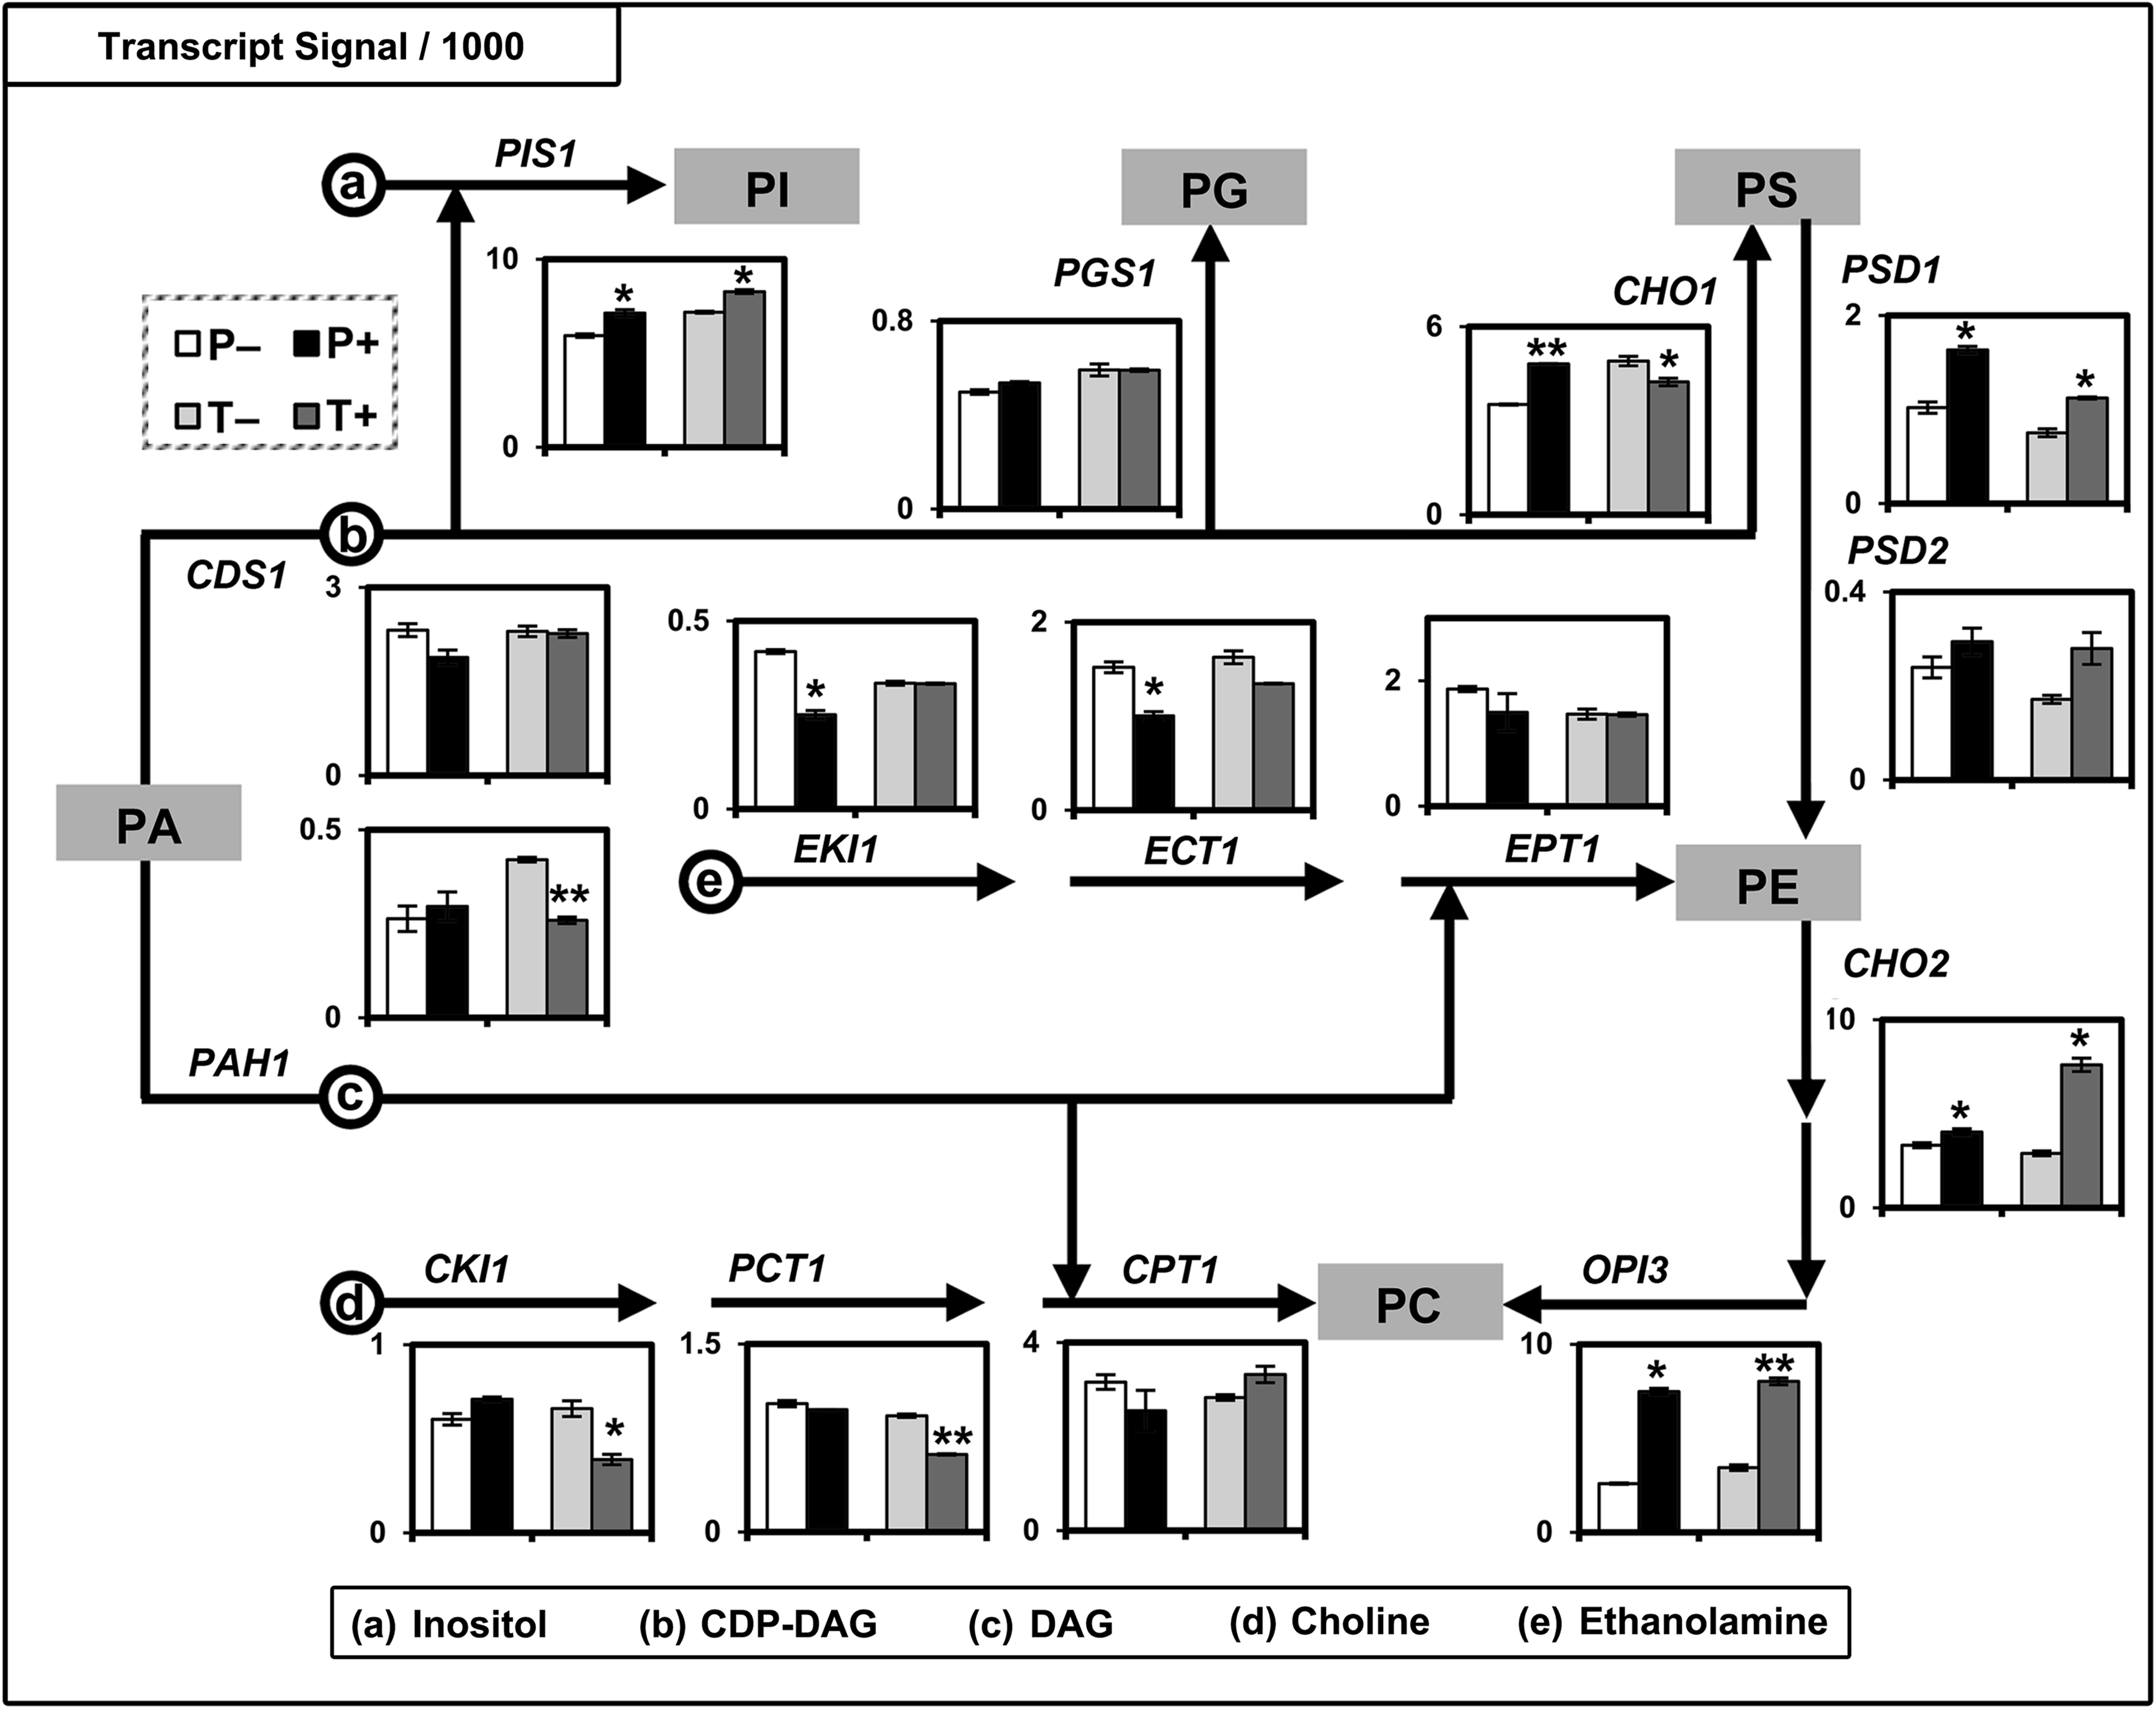
Transcriptional regulation of phospholipid biosynthesis in S. cerevisiae. Results are expressed as the mean of signal/1000±standard error of the mean (n=2; *p<0.05, **p<0.01 for “+” compared to “−”).
In addition, the PS abundance was also affected by its conversion to PE catalyzed by PSD1 and PSD2, which encode PS decarboxylases 1 and 2 (Psd1p and Psd2p). Psd1p is the major catalytic enzyme (Birner et al., 2001) of PS conversion to PE. The levels of PSD1 and PSD2 were both in the order of T− < P− < T+ < P+ (Fig. 6), suggesting a relatively slow conversion of PS to PE in the T strain, both with and without AFP treatment, compared to the P strain. In addition, the PS abundance decreased upon AFP treatment in the order of T+ < T− < P+ < P− (Supplementary Table S2; see online supplementary material at http://www.liebertonline.com). Collectively, compared to the P strain, the T strain showed a lower PS abundance with respect to the slower PS conversion to PE upon AFP treatment, suggesting that the PS abundance of the T strain is largely determined by its synthesis, which is controlled by the CHO1 level. Collectively, the decrease of the CHO1 level resulted in the decrease of PS abundance of the T strain upon AFP treatment, and the absence of PS molecules in the most variable species group IV, which positively correlated with T+ cells.
Compared to PS, the case of PE abundance is more complex, as it is predominantly influenced by PS decarboxylation, CDP-ethanolamine formation (Kennedy pathway), and PE methylation to PC. First, the rate-limiting step of the CDP-ethanolamine pathway is catalyzed by ethanolaminephosphate cytidylyltransferase (Ect1p, encoded by ECT1; Sundler and Åkesson, 1975). In the current study, we observed a significant decrease (∼34%) of ECT1 in the P strain, and a slight decrease (∼17%) in the T strain upon AFP treatment (Fig. 6), suggesting the CDP-ethanolamine pathway did not positively contribute to the increased PE abundance of both strains. In addition, in the absence of exogenous supplementation of ethanolamine or choline, PE is mainly synthesized through PS decarboxylation (Choi et al., 2004). Taken together, these observations suggest that the Kennedy pathway does not play an essential role in modulating PE synthesis of the T strain in response to AFP treatment. Second, the levels of PSD1 and PSD2 (T− < P− < T+ < P+; Fig. 6) suggested higher PE biosynthesis through PS decarboxylation of the P strain than the T strain, and of treated cells than untreated cells. Meanwhile, the PE abundance of the T strain decreased, while that of the P strain increased upon AFP treatment, suggesting that PS decarboxylation positively contributed to the AFP-induced increase of PE abundance of the P strain.
Lastly, we looked into the three-step methylation of PE generating PC. The first and rate-limiting step is catalyzed by PE methyltransferase (Cho2p, encoded by CHO2), while the second and third steps are catalyzed by phospholipid methyltransferase (Opi3p, encoded by OPI3) (Boumann et al., 2004). With AFP treatment, CHO2 signal increased slightly (∼1.2-fold) in P, and significantly (∼2.6-fold) in T (Fig. 6). This result is consistent with the significant decrease of PE and increase of PC abundance in the T strain (Supplementary Table S2; see online supplementary material at http://www.liebertonline.com), and suggests that CHO2-controlled PE methylation was one determinant of PE abundance. This also explains the absence of PE molecules from the most variable species group IV, which is positively correlated with T+ cells.
CHO2 level affected differential PE-to-PC ratios of two strains
Furthermore, based on the above analysis, the abundance of PC is mainly modulated by the rate of PE methylation instead of CDP-choline formation (Kennedy pathway). Accordingly, the level of CHO2 affects the PE-to-PC ratio, which increased in P and decreased in T (inset in Fig. 7). Surprisingly, when we examined each PE-to-PC ratio with the same fatty acyl chains, only the shift of the PE32:2-to-PC32:2 ratio was consistent with the change of the PE-to-PC ratio in P upon AFP treatment (Fig. 7). This result clearly demonstrates that the increase of the PE32:2-to-PC32:2 ratio resulted in the increase of the PE-to-PC ratio. This distinctive increase of the PE32:2-to-PC32:2 ratio is in accord with the selective methylation of PE 32:2 to PC 32:2 species by Cho2p (Boumann et al., 2004).
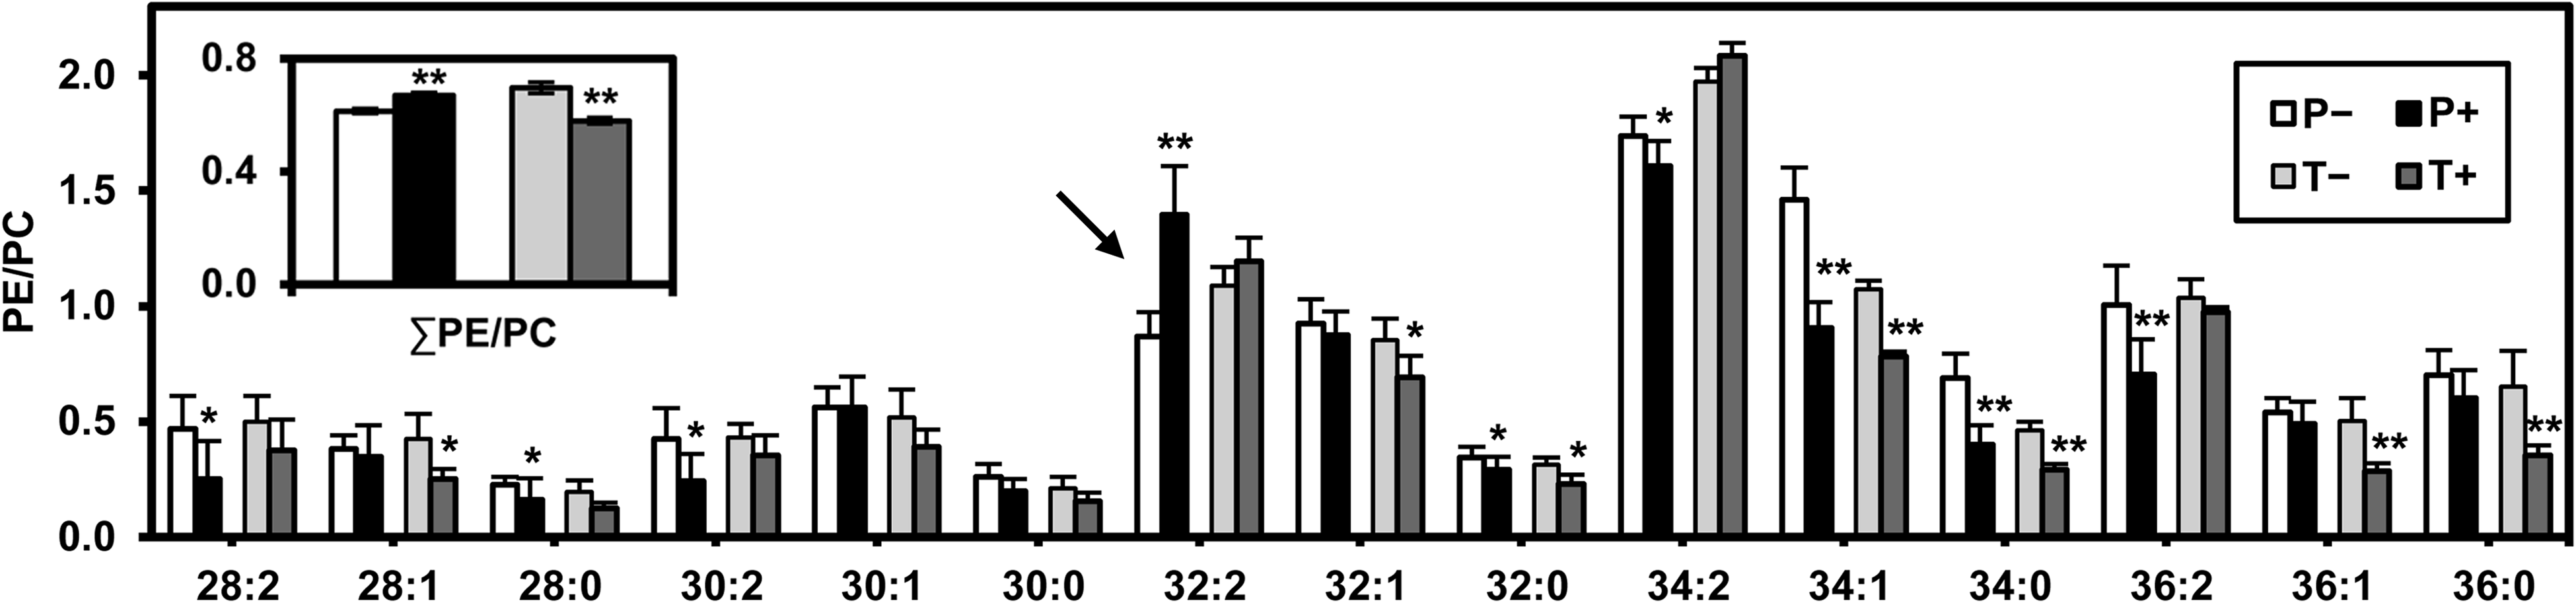
Ratios of PE to PC with the same fatty acyl chains. The ratio of total PE to total PC is shown in the inset. Results are expressed as mean±standard error of the mean (n≥5; *p<0.05, **p<0.01 for “+” compared to corresponding “−”).
The PE-to-PC ratio has been reported to be intimately related to the intrinsic curvature of the cell membrane. Unlike the other major phospholipid classes, PE has an inverted-cone shape rather than a cylindrical shape (i.e., PC molecules), due to its relatively small polar head group, and it tends to form a monolayer instead of a bilayer (De Kroon, 2007). Therefore, the PE-to-PC ratio has been implicated in the modulation of membrane curvature and porosity (Boumann et al., 2006). Moreover, the increase of the average length and degree of unsaturation of phospholipid fatty acyl chains (Supplementary Fig. S2; see online supplementary material at http://www.liebertonline.com) can enhance the non-bilayer tendency of PE (McMahon and Gallop, 2005). The membrane curvature affects cell division, movement, formation of compartment, and vehicle budding (McMahon and Gallop, 2005). Our previous study has shown that the PE-to-PC ratio is intimately correlated with glucose consumption. The 424A strain with a higher PE-to-PC ratio consumed glucose more slowly than the 4124 strain, and had a lower PE-to-PC ratio (Xia et al., 2011). Another study of liver cells showed an increase of the PE-to-PC ratio during liver failure, and this ratio caused a loss of plasma membrane integrity (Li et al., 2006). In contrast, the weak coupling between lipid shape and membrane curvature has been reported in artificial small unilamellar vesicles composed of egg-PC and various N-nitrobenzoxadiazole (NBD)-labeled phospholipids (Kamal et al., 2009). The phospholipids with NBD substituents attached to the polar head group, however, to some extent have different shapes from those of the natural biological membrane. In the present study, the decrease of the PE-to-PC ratio (Fig. 7) may be compensatory for the increase of phospholipid fatty-acyl-chain length and degree of unsaturation (Fig. 4c and f and Supplementary Fig. S2; see online supplementary material at http://www.liebertonline.com) to maintain the curvature and porosity of the T strain upon AFP treatment. In addition, the loss of plasma membrane integrity of P+ cells might be also subject to the increase of the PE-to-PC ratio.
Conclusion
We observed a differential loss of plasma membrane integrity, and increases of permeability and fluidity, between P and T, two S. cerevisiae strains with different inhibitor-tolerance. When treated with AFP, the increase of the average phospholipid fatty-acyl-chain length compensated for the altered plasma membrane permeability and fluidity in both strains. The inhibitor-tolerant strain T had a higher chain length due to the transcriptional modulation of the fatty acid metabolic genes. Furthermore, compared to the P strain, the levels of CHO1 and CHO2 of the T strain respectively decreased and increased upon AFP treatment, leading to the compositional changes of PS and PE, which served as a discriminating feature of the T strain. More importantly, the PE-to-PC ratio, which is an indicator of the membrane spontaneous curvature, was affected by the levels of CHO2. Collectively, the plasma membrane properties of the T strain were maintained by the fatty acid metabolic gene levels modulating the increase of phospholipid fatty-acyl-chain length, as well as the CHO1 level modulating PS abundance, and the CHO2 level modulating PE abundance and the PE-to-PC ratio. This series of genetic-to-functional adjustments were important cellular modifications that increased the robustness of the T strain.
Footnotes
Acknowledgments
The authors are grateful for the financial support from the National Basic Research Program of China (“973” Program: 2011CBA00802), and the National Natural Science Foundation of China (Major International Joint Research Project: 21020102040). We also thank Amanda L. Smith (University of Washington, Department of Chemical Engineering) for English editing.
Author Disclosure Statement
No competing financial interests exist.
References
Supplementary Material
Please find the following supplemental material available below.
For Open Access articles published under a Creative Commons License, all supplemental material carries the same license as the article it is associated with.
For non-Open Access articles published, all supplemental material carries a non-exclusive license, and permission requests for re-use of supplemental material or any part of supplemental material shall be sent directly to the copyright owner as specified in the copyright notice associated with the article.