
Abstract
Abstract
Drug design is crucial for the effective discovery of anti-cancer drugs. The success or failure of drug design often depends on the leading compounds screened in pre-clinical studies. Many efforts, such as in vivo animal experiments and in vitro drug screening, have improved this process, but these methods are usually expensive and laborious. In the post-genomics era, it is possible to seek leading compounds for large-scale candidate small-molecule screening with multiple OMICS datasets. In the present study, we developed a computational method of prioritizing small molecules as leading compounds by integrating transcriptomics and toxicogenomics data. This method provides priority lists for the selection of leading compounds, thereby reducing the time required for drug design. We found 11 known therapeutic small molecules for breast cancer in the top 100 candidates in our list, 2 of which were in the top 10. Furthermore, another 3 of the top 10 small molecules were recorded as closely related to cancer treatment in the DrugBank database. A comparison of the results of our approach with permutation tests and shared gene methods demonstrated that our OMICS data-based method is quite competitive. In addition, we applied our method to a prostate cancer dataset. The results of this analysis indicated that our method surpasses both the shared gene method and random selection. These analyses suggest that our method may be a valuable tool for directing experimental studies in cancer drug design, and we believe this time- and cost-effective computational strategy will be helpful in future studies in cancer therapy.
Introduction
With multiple OMICS datasets, such as the Connectivity Map (cmap) (Lamb, 2007; Lamb et al., 2006), DrugBank (Wishart et al., 2006, 2008), Comparative Toxicogenomics Database (CTD; Davis et al., 2009), the Kyoto Encyclopedia of Genes and Genomes (KEGG; Kanehisa and Goto, 2000; Wixon and Kell, 2000), and NCBI PubChem (Sayers et al., 2009), leading compounds can be selected from among these large-scale candidate small-molecule libraries. Computational methods have recently been developed to identify the strongest candidate leading compounds from these abundant resources. These computational methods are indirect but powerful in their ability to mine leading compounds from large lists of small-molecule candidates. Some of the existing computational methods select leading compounds for designing cancer treatment drugs based on their connection to cancer-related genes (Davis et al., 2009). However, because cancer pathogenesis at the cellular level can often result from the perturbation of a group of genes that collectively perform some biological function, such methods may limit the ability to identify valuable leading compounds. Another existing framework, cmap, assesses small molecules with effects on a specific phenotype based on genome-wide transcriptional expression data from cultured human cells treated with bioactive small molecules (Lamb, 2007). The simple pattern-matching algorithms used in this method depend heavily on the expression patterns of each tagged gene, but the functional relevance of these genes is largely disregarded.
Here we developed a computational method for prioritizing small-molecule drug candidates by integrating transcriptomics and toxicogenomics data. The results of a case study on breast cancer demonstrate that our OMICS data-based method performs well in comparison with the permutation tests mentioned above. Furthermore, 11 known therapeutic small molecules were found among the top 100 candidate molecules of our OMICS data-based priority list, compared to just 6 of the top 100 candidates produced by the shared gene method. To further validate our method, we also applied the algorithm to a prostate cancer dataset. The results of this analysis suggested that our method performs better than the shared gene method and random selection in generating a list of the top 20 prioritized small molecules. These results suggest that our method can provide a valuable complement to experimental studies aimed at designing and developing therapeutic cancer drugs.
Materials and Methods
A compendium of validated therapeutic and candidate small molecules
The rigorous evaluation of a prediction method requires a “gold standard”; in this study, we used a set of small molecules with known functions related to breast cancer or prostate cancer. The data used in this study included a transcriptome dataset and a genomics dataset. The gold standard small molecule-disease associations were obtained from the CTD, and the transcriptome data used in our analyses were obtained from GEO and the cmap database. The candidate small molecules were retrieved from the cmap database (http://www.broadinstitute.org/cmap/), which consists of more than 7000 gene expression profiles generated by cultured human cell lines (the breast cancer epithelial cell lines MCF7 and ssMCF7, the prostate cancer epithelial cell line PC3, the leukemia non-epithelial cell line HL60, and the melanoma non-epithelial cell line SKMEL5), treated with 1309 small molecules. Among these small molecules, 1294 were used to treat MCF7 cells; therefore, these 1294 small molecules were used to construct the priority list from MCF7 cell line data in this study. The small-molecule candidates for breast cancer therapy were compiled from the CTD database (http://ctd.mdibl.org/). Overall, 34 of these therapeutic molecules were present in both the CTD database and the cmap database, and that set is regarded as the gold standard in this article. The PC3 cell line analysis included 1182 small molecules, 41 of which were considered gold standards for prostate cancer analysis.
Gene expression profile and pre-processing
The microarray data were downloaded from the Gene Expression Omnibus (GEO; http://www.ncbi.nlm.nih.gov/geo/). The accession number of this dataset is GSE5364 (GEO ID: GSE5364), and it includes six separate gene expression profile datasets. In this study, we used only the gene expression profiles for breast cancer, with 183 tumor tissues and 13 normal tissues. The dataset was used to mine breast cancer-related pathways (BCP) by Gene Set Enrichment Analysis (GSEA; Subramanian et al., 2005). The gene expression data set for prostate cancer, GSE6919, contains four subseries (GSE6604, GSE6605, GSE6606, and GSE6608). In our analysis, we used GSE6604 and GSE6606, which contain expression data from normal prostate tissue and primary prostate tumor tissue, respectively. The experimental data platform we used was GPL92. This dataset was used to mine prostate cancer-related pathways by GSEA.
The profiles of gene expression in response to small-molecule treatment were retrieved from cmap. We analyzed 3095 gene expression profiles from cells treated with the 1294 small molecules used to treat the MCF7 cell line. These expression profiles represent 3095 treatment/vehicle pairs, and include 12,633 genes, as described above. For the PC3 cell line, we obtained 1741 gene expression profiles for 12,718 genes treated with 1182 small molecules. Both of these expression datasets were used to mine small molecule-related pathways (SMPs) by pathway enrichment analysis.
For the gene expression profiles from cMap, the average expression value was calculated under the same concentrations for the treatment and vehicle pair of each small molecule, as the final expression value for the corresponding concentration of the small molecule. Hence, we were sometimes able to obtain gene expression values under different drug concentrations. For each expression profile processed, the differential expression threshold was set as a 1.5-fold change between the treatment and vehicle conditions.
Enrichment analysis for mining small molecule-related pathways
The biological pathways examined in this study were obtained from the KEGG database. To mine the SMPs with the breast cancer dataset, pathway-enrichment analysis was performed using the cumulative hyper-geometric test on gene expression datasets from cells treated with 1294 small molecules. The cumulative hyper-geometric test formula is as follows:
where N is the number of genes (12,633), n is the number of significantly differentially-expressed genes, M is the number of genes in a specific pathway among all genes, and m is the number of genes that are annotated in a specific pathway and are significantly-differentially expressed genes. For each small molecule, we defined the pathways obtained by performing pathway-enrichment analysis as SMPs. The intersections of the BCPs and SMPs were termed small molecule-related breast cancer pathways (SMBCPs).
Specificity and effect (SE) scores for candidate small molecules
In this study, we developed an OMICS data-based method using an SE score to measure the relationship between a small molecule and breast cancer. The SE scores for each of the 1294 small molecules were calculated as follows.
First, we obtained two pathway sets for each small molecule, the SMPs and the SMBCPs. The definitions of the all effect score (AES), and the disease effect score (DES), are given below:
where Pi and Pj are the P values obtained using the cumulative hyper-geometric test and represent the degree of relatedness between some small molecule and the ith or jth pathway, N is the number of SMPs, and n is the number of SMBCPs. We did not consider pathways in which the corresponding cumulative hyper-geometric test p value was zero; i.e., each pathway included in the computation of the AES and DES scores had a cumulative hyper-geometric test p value between 0 and 0.05 (0<p value<0.05).
Due to the broad effects of signaling pathways on the physiological activities of cells (Seti et al., 2009), W was assigned a value of 1 if the ith or jth pathway was a metabolic pathway, and a value of 2 if the ith or jth pathway was a signaling pathway. The AES value indicates the effect of the small molecule on all possible related pathways, while the DES value indicates its effect on the pathways related to breast cancer. Finally, the SE scores for each small molecule were calculated using AES and DES. After we obtained the AES and DES values for all small molecules, we calculated the SE score:
where min and max are the minimum and maximum values of DES among all 1294 small molecules. In addition, we defined DES and AES as the effect factors for SMBCPs and SMPs, respectively. Thus, the DES/AES ratio indicates the specific effect of the small molecule on breast cancer.
It is unclear whether the effect observed when prioritizing the small molecules based on breast cancer-related genes would persist if the objects targeted directly by the small molecules were proteins. Therefore, we also considered a shared gene approach for purposes of comparison. A similar SE score for each small molecule was calculated as follows:
where DEnum is the number of differentially-expressed genes affected by a small molecule, IDEnum is the size of the intersection of the differentially-expressed genes affected by some small molecule and the 221 genes related to breast cancer selected from the CTD, and min and max are the minimum and maximum of IDEnum among all 1294 small molecules. The variable values were also changed to the prostate cancer corresponding values in prostate cancer data set analysis.
In our analysis, higher SE scores are associated with stronger candidate leading compounds for designing and developing therapeutic drugs for breast cancer. The process of prioritizing candidate small molecules is shown in Figure 1.

Flow chart for prioritizing candidate small molecules based on OMICS data. The first step in prioritization is to obtain two pathway sets. One is cancer-related pathways determined by performing Gene Set Enrichment Analysis (GSEA), and the other is small molecule-related pathways (SMPs) for each candidate small molecule determined by performing pathway-enrichment analysis. The second step is to compute the SE scores for each of 1294 small molecules using the two pathway sets and to rank the prioritizing small-molecule list according to the SE scores (GEO, Gene Expression Omnibus; cmap, Connectivity Map; SE, specificity and effect).
Results and Discussion
Identifying breast cancer-related pathways
A pathway is a functional set of genes, and organization into pathways provides a basis for analyzing the functions of gene sets (Ogata et al., 1999). We aimed to construct a priority list of therapeutic small molecules predicted to affect breast cancer based on OMICS data, and we obtained 23 involved pathways by performing GSEA on the gene expression profiles of breast cancer from GEO. The pathways are regarded as BCPs. A total of 13 signaling pathways and 10 metabolic pathways were included in our analysis set. Recent reports identified the pathways ‘CELL_CYCLE’ (KEGG ID: HSA04110) and ‘P53_SIGNALING_PATHWAY’ (KEGG ID: HSA04115) as important in many types of cancer. The biosynthesis of pyrimidine is also associated with breast cancer (Sigoillot et al., 2004), suggesting that the ‘PYRIMIDINE_METABOLISM’ pathway (KEGG ID: HSA00240) could be related to breast cancer. Thus these pathways were considered good candidate pathways for small-molecule targeting.
Prioritization results of candidate small molecules for breast cancer
Our method can be used to calculate the SE score for each small molecule. In cases for which expression data were available for cells treated with different concentrations for the same small molecule, the max SE score was determined as the final SE score for the small molecule. Next, all of the small molecules were sorted in descending order of SE score. The list includes 34 therapeutic small molecules from the CTD. The SE score was zero if the small molecule was not related to any of the BCPs. Therefore, the differentially-expressed gene sets that were affected by 432 of the 1294 small molecules were all significantly enriched in the BCPs. We found that 23 of the 34 therapeutic small molecules were included in these 432 small molecules. Molecules with the same score were given the same rank; thus, the max rank was 433. The SE scores and ranks of the 23 therapeutic small molecules with non-zero scores are presented in Table 1. We found 11 therapeutic small molecules (32% of the therapeutic small molecules) among the top 100 molecules in our list (7% of the 1294 candidate small molecules), and 2 of these known therapeutic small molecules were among the top 10 molecules in our list.
To further refine the overall ranking of the 34 gold standard therapeutic small molecules from the 1294 candidate molecules, a global measure called the mean enrichment value was defined. The enrichment value for each molecule is represented by the ratio of half of the max rank value (433) to the rank of the small molecule (Kohler et al., 2008). The mean enrichment values for all 1294 small molecules and the 34 therapeutic small molecules were 1.442 and 8.795, respectively.
In addition, we searched the DrugBank database (http://www.drugbank.ca/; Wishart et al., 2008) for the top 10 small molecules in our priority list. We found that 5 of the small molecules, including the 2 therapeutic small molecules with ranks 1 and 10, are closely related to cancer treatment according to DrugBank. The small molecule daunorubicin (rank 5) is used to treat leukemia and other neoplasms, and mercaptopurine (rank 6) is an antimetabolite antineoplastic agent. Furthermore, mycophenolic acid (rank 2) is described as an immunosuppressant drug and a potent anti-proliferative that can be used in place of the older anti-proliferative azathioprine. We also found that all of the top 10 small molecules in our analysis target both the cell cycle pathway and the p53 signaling pathway, both of which are closely connected to cancer biology.
Comparison of the OMICS data-based method and permutations
The area under the curve (AUC) of the receiver operating characteristic (ROC) curve, an integrated evaluation indicator, was calculated. To evaluate the significance of our prioritization results based on OMICS data, we estimated the distribution of the AUC and the relative mean enrichment values of 23 pathways randomly chosen from all KEGG pathways for each permutation. The relative mean enrichment value is defined as the value of the difference between the mean enrichment values of the 34 therapeutic small molecules and all 1294 candidate small molecules. We performed 1000 permutations, and the estimated distribution is shown in Figure 2. p Values were calculated for the fraction of the AUC values or the relative mean enrichment values obtained in random conditions, which was greater than the corresponding value in the real condition. The p values for the AUC value and the relative mean enrichment value were 0.008 and 0.026, respectively.
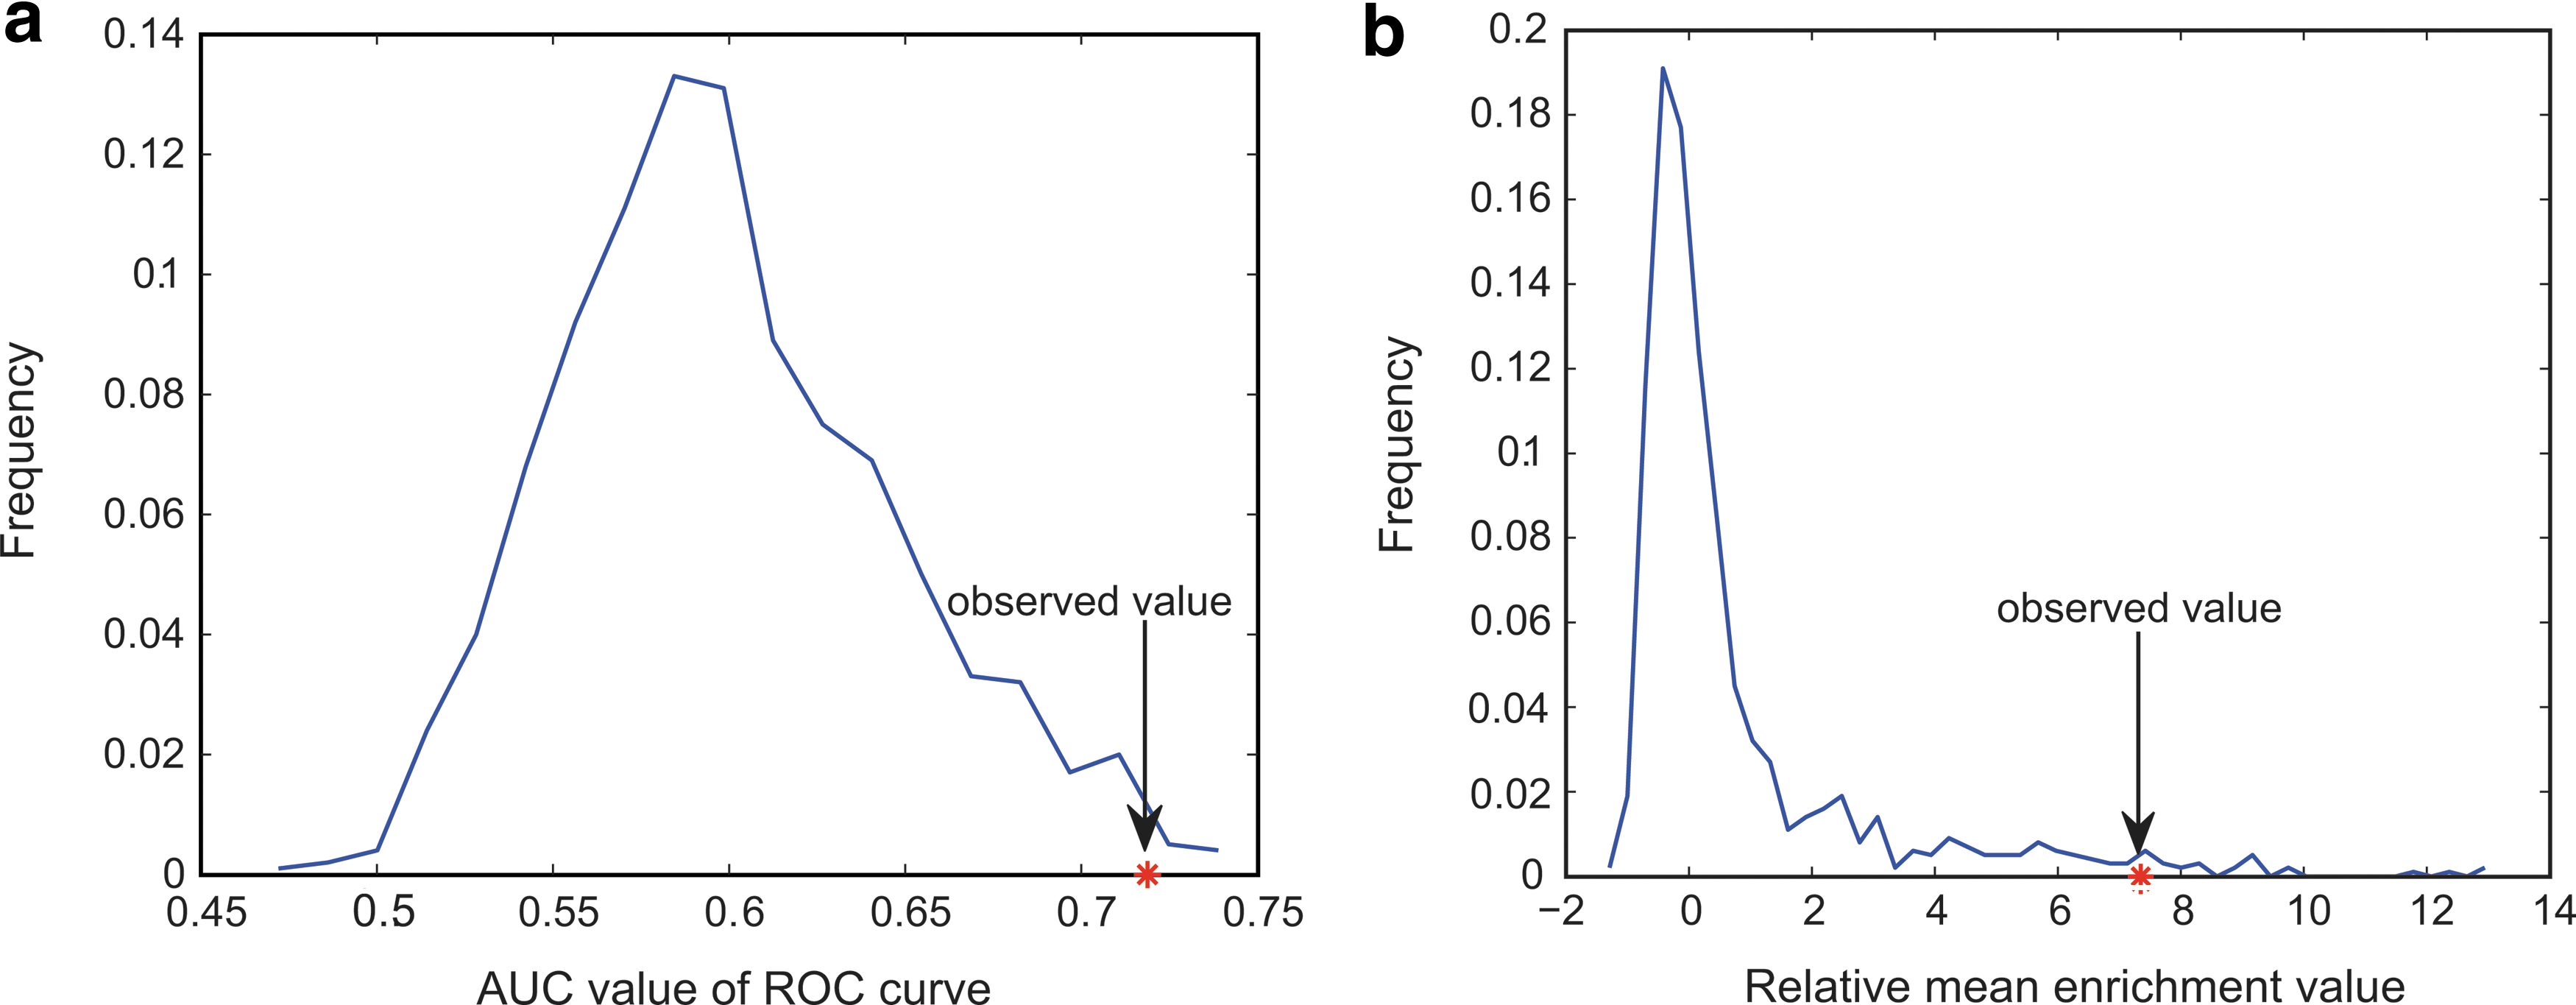
Distribution of the AUC and relative mean enrichment values. This distribution was estimated by 1000 random samplings of 23 pathways from KEGG. The red dots in
If the differentially-expressed genes affected by the small molecules are significantly enriched in some BCPs, these pathways may potentially be targeted by those small molecules, especially the small molecules at the top of the priority list, which have a higher probability of being a good candidate leading compound. More importantly, we can study the effects of small molecules on breast cancer from a pathway-based perspective. As is evident from the results of the permutations, disease-related pathways are crucial to support prioritized small-molecule results.
Comparison of the OMICS data-based and shared gene methods
To compare methods based on OMICS data, an SE score was also calculated for each small molecule by applying a shared gene algorithm to obtain a list of small molecules in descending order, including the 34 therapeutic small molecules from the CTD. Of the 1294 small molecules evaluated, 440 had a non-zero score, and the max rank was 441. Using this method, 23 of the therapeutic small molecules were included among these 440 small molecules. The SE score values and ranks of the 23 therapeutic small molecules with non-zero scores are presented in Table 2, which shows that only 6 of these therapeutic small molecules were in the top 100 of the 1294 compounds, and none of the therapeutic small molecules were in the top 10. Indeed, the therapeutic small molecules tended to fall in the bottom half of the priority list.
The AUC of the ROC curves were calculated as 0.69 and 0.72 for the shared gene and OMICS data-based methods, respectively. The mean enrichment values of the 34 therapeutic small molecules were calculated as 1.978 and 8.795 for the shared gene and OMICS data-based methods, respectively.
In our analysis, the small molecules with higher SE scores were more likely to be candidate leading compounds for the design of therapeutic drugs for breast cancer. We found that the relative mean enrichment value in the OMICS data-based method was more significant than that in the shared gene method, and there were no known breast cancer therapeutic small molecules among the top 10 molecules ranked using the shared gene method. The empirical cumulative distribution of the top 300 small molecules among the 1294 compounds (Fig. 3a) indicates that the OMICS data-based method is more powerful than the shared gene method for prioritizing candidate small molecules for breast cancer drug design and development. A comparison of the AUC between the two methods is shown in Figure 3b. All of these data demonstrate the advantages of our OMICS data-based method.

Comparison of the OMICS data-based and shared gene methods. (
Although these small molecules affect their target proteins directly, the anti-cancer effects are caused by the resulting cascade of changes in biological processes. Therefore, the mechanisms of the effects of small molecules can be explained more systematically and comprehensively using pathway-based analyses. In general, the association between small molecules and pathways is stronger than that between small molecules and genes. This relationship underlies the feasibility of our OMICS data-based method.
Prostate cancer dataset analysis
We used gene expression datasets from GEO and CMAP to identify the prostate cancer-related pathways and small molecule-related pathways in the PC3 cell line in CMAP. We obtained 31 prostate cancer-related pathways using the GEO expression profile. Among the 31 prostate cancer-related pathways identified, 30 were signaling pathways and 1 was a metabolic pathway. As described above, the ‘CELL_CYCLE’ (KEGG ID: HSA04110), ‘P53_SIGNALING_PATHWAY’ (KEGG ID: HSA04115), and ‘PYRIMIDINE_METABOLISM’ pathways (KEGG ID: HSA00240) were proved as cancer-related pathways. Furthermore, ‘APOPTOSIS’ (KEGG ID: HSA04210) and ‘PROSTATE_CANCER’ (KEGG ID: HSA05215) were also included in the prostate cancer-related pathway set.
In the priority list of 1182 small molecules, three small molecules in the gold standard set were ranked in the top 10 (trichostatin A, rank 1; azacitidine, rank 4; and vorinostat, rank 8). In addition, we searched for the remaining small molecules in the top 10 in the DrugBank database. We found that ‘8-azaguanine’ (rank 2) has antineoplastic activity, ‘vidarabine’ (rank 3) has some antineoplastic properties, and ‘irinotecan’ (rank 5) is used to treat colorectal cancer.
Performance evaluation of the top 20 small molecules in the priority lists from the MCF7 and PC3 datasets
The major purpose of our study is to reduce the high costs of cancer therapeutic drug development by providing an optimized list of leading compounds. The small molecules closer to the top of the optimization list are of vital significance for guiding cancer therapeutic drug development. Considering the experimental scale and high costs of drug development, we particularly wanted to analyze the top 20 ranked drugs on the prioritized breast cancer and prostate cancer lists.
We compared the top 20 small molecules of both the breast cancer and prostate cancer lists generated by our OMICS data-based method with those generated using the shared gene method. We obtained 408 prostate cancer-related genes from the CTD database. We expected that these small molecules would rank near the top of the priority list; the inclusion of more small molecules from the gold standard list among the top ranking 20 represents better performance. We defined the “sum enrichment value” as the sum of the enrichment values for small molecules in the gold standard among the top 20 molecules on each priority list. The sum enrichment values of the OMICS data-based method and the shared gene method are shown in Table 3. The sum enrichment value of the OMICS data-based list was significantly higher than that of the list of the shared gene method for both the breast cancer and prostate cancer datasets.
Similarly to the breast cancer dataset study, we performed 1000 randomizations of the prostate cancer dataset (randomly selecting 31 prostate cancer-related pathways in each randomization). The estimated distributions of the sum enrichment values in the breast cancer and prostate cancer dataset studies are shown in Figure 4a and 4b. The p value is the fraction of the sum enrichment value obtained in random conditions, which was greater than the corresponding value in the real condition. The p values for the breast cancer and prostate cancer datasets were 0.037 and 0.005, respectively.
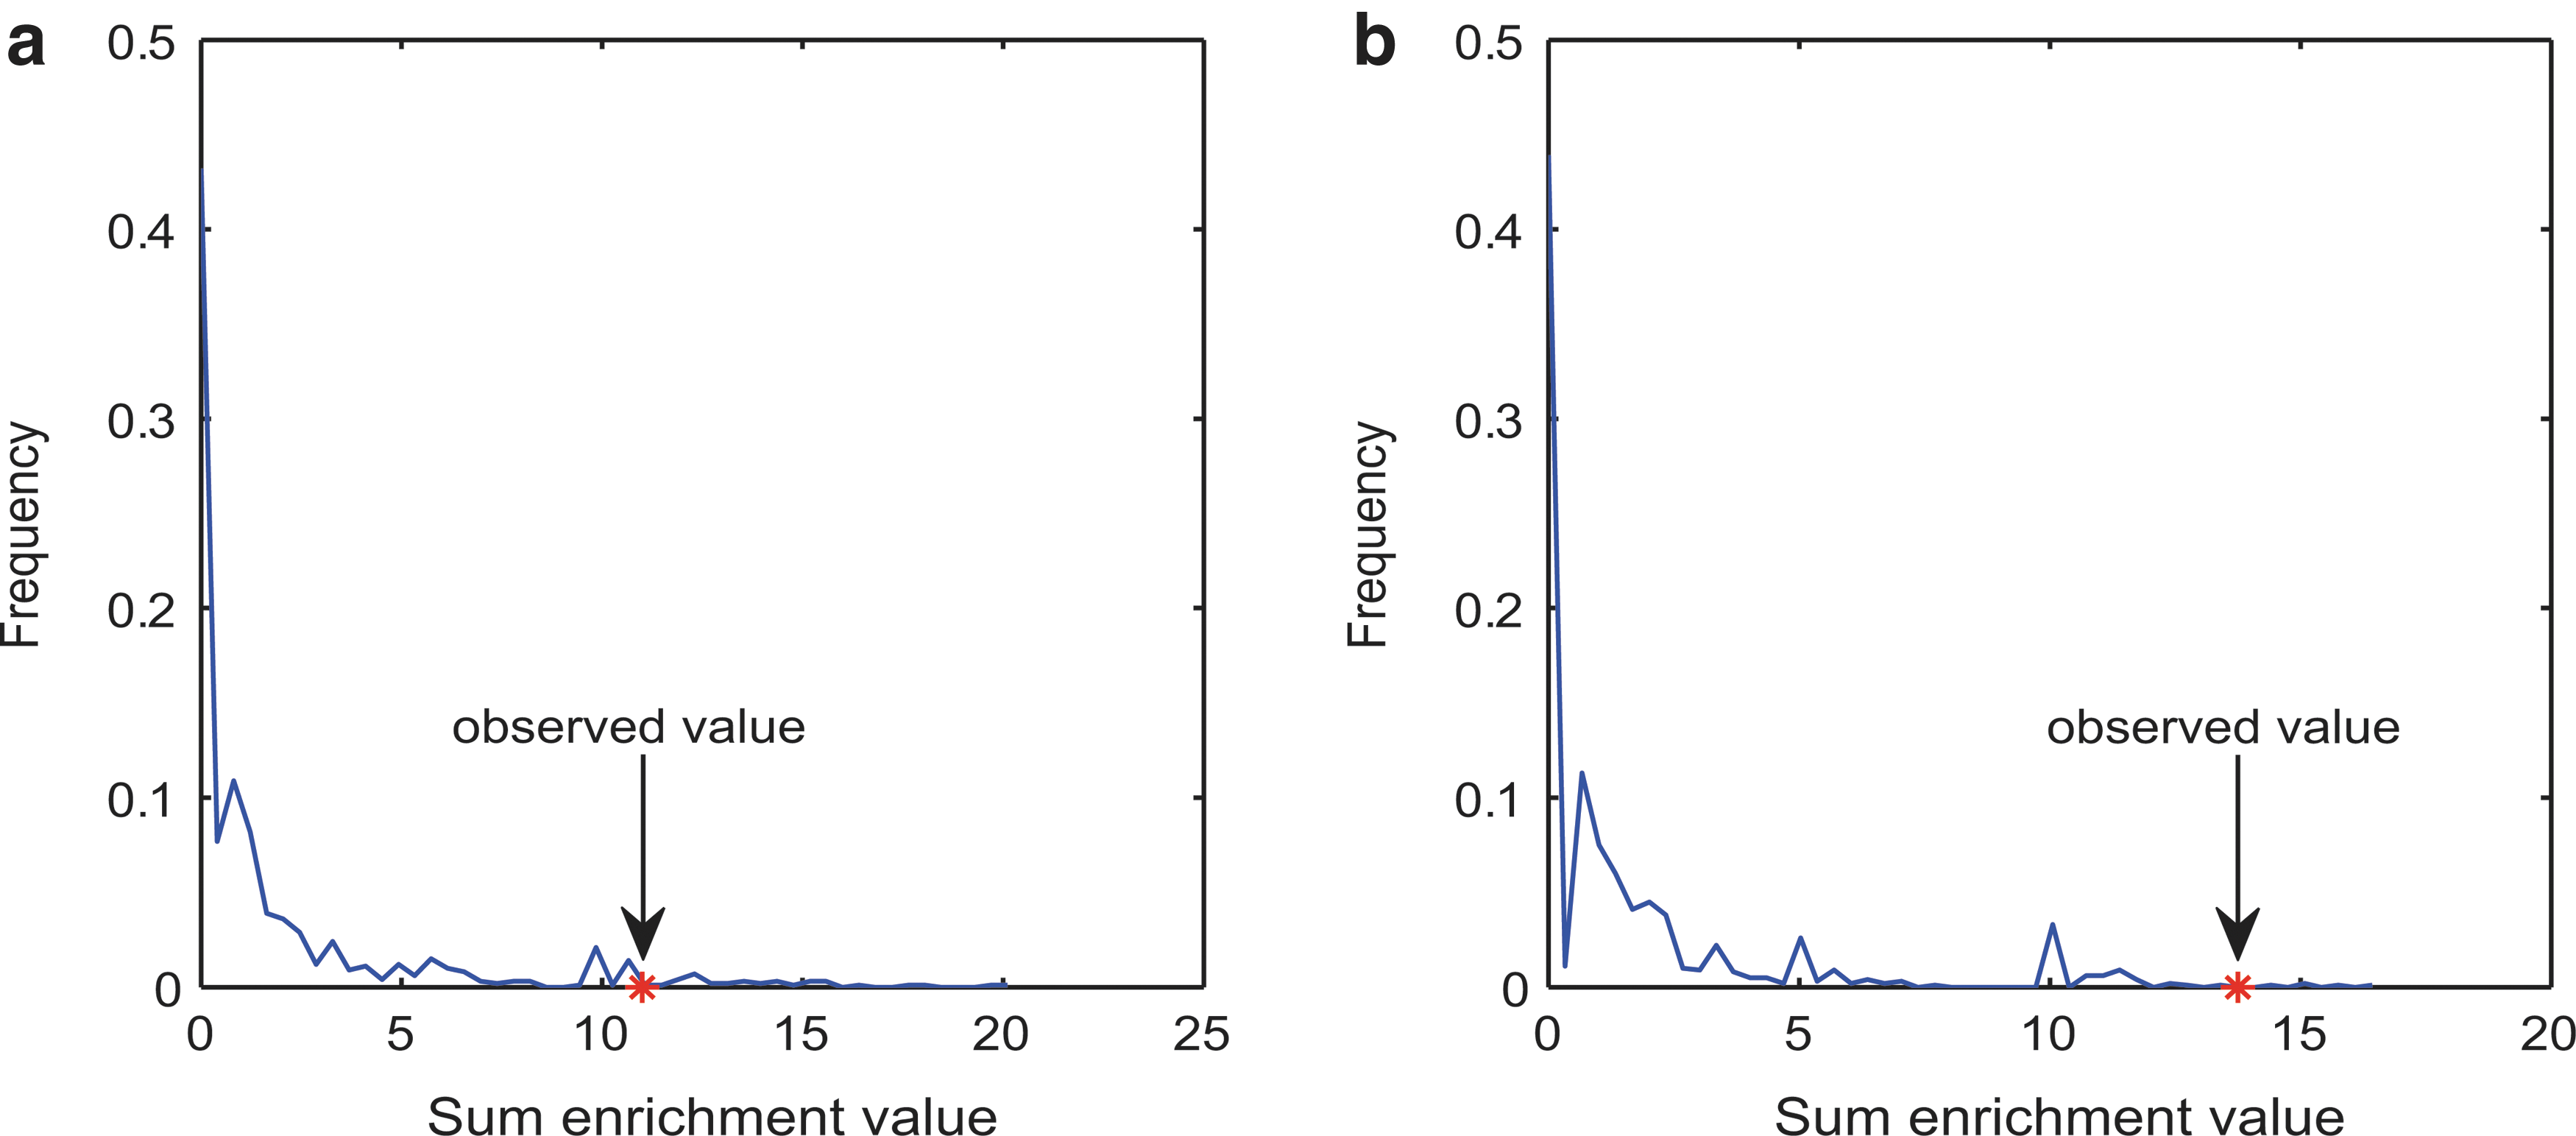
Distribution of the sum enrichment values for the breast cancer dataset (
In conclusion, our OMICS data-based method to prioritize candidate small molecules related to breast cancer or prostate cancer achieved better results than shared gene methods. In the future, with increasing knowledge of small therapeutic molecules and of cancer-related cellular pathways, we will be able to improve the prioritization strategy for screening candidate small molecules, and provide a more accurate list of candidate small molecules. We will also expand the types of cancers analyzed, ultimately providing a creative approach to the design and development of new and specific cancer drugs.
Conclusions
To enable the rapid and efficient selection of leading compounds for drug design from candidate small-molecule libraries, we developed a method to prioritize candidate small molecules based on multiple OMICS datasets. A priority list was generated based on the SE score for each candidate small molecule. For the breast cancer dataset, approximately one-third of the known therapeutic small molecules are listed in the top 100 molecules in our ranking; 2 are in the top 10, and another 3 of these molecules were found to be closely related to cancer treatment. Furthermore, all of the top 10 small molecules in the priority list target the cell cycle pathway or the p53 signaling pathway, both of which are closely connected to breast cancer. In addition, we applied our method to a prostate cancer dataset, ranking 3 gold-standard small molecules in the top 10. The results reveal that our proposed method can not only identify prioritized drug candidates, but also discover the pathways that they target. This could reduce the time required for drug design and provide an important theoretical support for subsequent experiments. We believe that our method provides a novel approach to the integrative analysis of OMICS data.
Footnotes
Acknowledgments
This work was supported in part by the Funds for Creative Research Groups of The National Natural Science Foundation of China (grant no. 81121003), the National Natural Science Foundation of China (grants no. 61170154 and 31100948), the Natural Science Foundation of Heilongjiang Province (grants no. QC2009C23 and D201114), and the Graduate Innovation Fund of Heilongjiang Province (grant no. YJSCX2009-226HLJ).
Author Disclosure Statement
The authors declare that no conflicting financial interests exist.