
Abstract
Abstract
Imatinib mesylate (IM) is a potent tyrosine kinase inhibitor used as front-line therapy in chronic myeloid leukemia, a disease caused by the oncogenic kinase Bcr-Abl. Although the clinical success of IM set a new paradigm in molecular-targeted therapy, the emergence of IM resistance is a clinically significant problem. In an effort to obtain new insights into the mechanisms of adaptation and tolerance to IM, as well as the signaling pathways potentially affected by this drug, we performed a two-dimensional electrophoresis-based quantitative- and phospho-proteomic analysis in the eukaryotic model Saccharomyces cerevisiae. We singled out proteins that were either differentially expressed or differentially phosphorylated in response to IM, using the phosphoselective dye Pro-Q® Diamond, and identified 18 proteins in total. Ten were altered only at the content level (mostly decreased), while the remaining 8 possessed IM-repressed phosphorylation. These 18 proteins are mainly involved in cellular carbohydrate processes (glycolysis/gluconeogenesis), translation, protein folding, ion homeostasis, and nucleotide and amino acid metabolism. Remarkably, all 18 proteins have human functional homologs. A role for HSP70 proteins in the response to IM, as well as decreased glycolysis as a metabolic marker of IM action are suggested, consistent with findings from studies in human cell lines. The previously-proposed effect of IM as an inhibitor of vacuolar H+-ATPase function was supported by the identification of an underexpressed protein subunit of this complex. Taken together, these findings reinforce the role of yeast as a valuable eukaryotic model for pharmacological studies and identification of new drug targets, with potential clinical implications in drug reassignment or line extension under a personalized medicine perspective.
Introduction
In recent years, there has been a steady increase in the use of high-throughput strategies in model systems for the identification of candidate drug targets and its functional validation, as well as to gain mechanistic insights into the action of drugs and drug resistance (Wang and Weinshilboum, 2008). The yeast Saccharomyces cerevisiae is a well-characterized eukaryotic model that has been particularly in evidence in this field (Botstein and Fink, 2011; dos Santos et al., 2012; Hoon et al., 2008; Karathia et al., 2011; Menacho-Marquez and Murguia, 2007; Smith et al., 2010). Yeast possesses a high degree of functional conservation of its basic cellular processes within the human genome, and indicators such as alterations of global gene expression and protein abundance can be easily analyzed. The value of S. cerevisiae as a powerful tool for pharmacogenomics studies with imatinib has been previously illustrated by our group (dos Santos and Sá-Correia, 2009), when a systematic genome-wide screen of a yeast deletion collection identified several determinants of resistance to imatinib with 80% conservation in the human genome. The vacuolar proton-translocating ATPase (V-ATPase) was identified as an imatinib target in that study; this proton-pump complex was shown to be required for imatinib resistance, and subsequent studies suggested that imatinib might act as an effective inhibitor of V-ATPase function in yeast.
The present study was designed to characterize the response of yeast cells to a mildly inhibitory concentration of imatinib mesylate. A drug may exert multiple effects on different proteins, leading to changes in protein expression, post-translational modifications, and protein-protein interactions. To address these issues, we used a quantitative proteomics strategy based on two-dimensional gel electrophoresis (2-DE), combined with the use of specific fluorescent stains, to monitor changes in protein content and in phosphorylation status of possible substrates involved in imatinib-dependent pathways. Protein phosphorylation is a ubiquitous key regulator of cellular signaling pathways, controlling biological processes such as proliferation and apoptosis (Thingholm et al., 2009). Imatinib is a kinase inhibitor, and the elucidation of novel pathways that might be affected (directly or indirectly) by its action can be achieved with the analysis of the phosphoproteome. The present study resulted in the identification of 18 proteins in total with alterations at the content or phosphorylation level. All possess human homologs and are involved in such mechanisms as glycolysis, translation, protein folding, ion homeostasis, and nucleotide and amino acid metabolism, providing mechanistic insights into the underlying global response to imatinib in yeast.
Materials and Methods
Yeast strains, media, and growth conditions
The haploid parental strain Saccharomyces cerevisiae BY4741 (MATa, his3Δ1, leu2Δ0, met15Δ0, and ura3Δ0) was obtained from the EUROSCARF collection (Frankfurt, Germany) (http://web.uni-frankfurt.de/fb15/mikro/euroscarf/index.html). Imatinib (IM, mesylate salt, STI571, Gleevec®, MW 589.72) was provided by Novartis Pharmaceuticals (Basel, Switzerland), and stock solutions were prepared in double distilled water. Cells were batch-cultured at 30°C, with orbital agitation (250 rpm) in selective MM4 growth medium (1.7 g/L yeast extract-peptone-dextrose [YPD] w/o amino acids or ammonium sulfate, from Difco Laboratories [Detroit, MI, USA]; 20 g/L glucose, 2.65 g/L (NH4)2SO4; 20 mg/L methionine; 60 mg/L leucine; 20 mg/L histidine; and 20 mg/L uracil). Inocula were prepared by cultivation of yeast cells in MM4 medium until the mid-exponential growth phase (OD600≈0.6), and used to prepare main cultures in MM4 with an initial OD600 of 0.2±0.05. This basal medium either was or was not supplemented with 400 mg/L of IM, and growth was followed by measuring the culture OD600, and the concentration of viable cells (assessed as the number of colony-forming units [CFU]) on YPD solid medium, following incubation for 2 days at 30°C. These experiments were carried out under standardized growth conditions and the resulting curves were highly reproducible.
Sampling and protein extraction for 2-DE
The BY4741 proteomes were compared based on culture samples A and B. Both samples were obtained using the same inoculum, after pre-cultivation of a yeast cell population in MM4 medium until the mid-exponential growth-phase. These cells were used to inoculate the same MM4 medium, supplemented (sample A: the imatinib-stressed sample) or not (sample B: the control sample) with 400 mg/L of IM at an initial OD600 of 0.2±0.05 and incubated for 4 h at 30°C. Culture samples were harvested by centrifugation (2500 g for 5 min at 4°C), and washed with cold distilled water. Independent growth experiments were carried out to obtain cell replicates. The cell pellets were immediately stored at −80°C until use.
Cell pellets from the same culture condition were thawed on ice and pooled together by resuspension in lysis buffer containing Tris-base 10 mM supplemented with protease inhibitors (10 mg/mL leupeptine; 1 mg/mL pepstatine A; 20 mg/mL aprotinin; 1.5 mg/mL benzamidine; 2 mg/mL trypsin/quimotrypsin inhibitor; 1 mM PMSF). Briefly, cell lysis was carried out by consecutive steps of vortexing and ice cooling with an equal volume of glass beads (f=425–600 mm). The mixture was centrifuged at 15,300 g at 4°C for 5 min to separate cell debris and glass beads from the supernatant, after which the cell pellets were disrupted again as described above. The resulting supernatant was mixed with the one obtained before, and the mixture was clarified by centrifugation at 15,300 g at 4°C for 10 min. Protein concentration of the resulting cell extracts was quantified using the Pierce BCA protein assay kit (Thermo Scientific, Pittsburgh, PA, USA). Total protein (75 μg for analytical gels or 500 μg for preparative gels) was precipitated using the 2D-CleanUp kit (GE Healthcare, Pittsburgh, PA, USA), and the protein pellets were resuspended in 100 μL of loading solution (8 M urea, 4% w/v CHAPS, 1% w/v Pharmalytes 3–10, 15 mM DTT, and traces of bromophenol blue). The mixture was homogenized and left to stand at room temperature for 3 h. These protein samples were then centrifuged (15,300 g for 5 min) to remove insoluble material, and the supernatants transferred to clean 1.5-mL micro-centrifuge tubes. All reagents used in this study were of analytical grade.
2-DE and gel staining
The first dimension separation, isoelectric focusing (IEF), was performed using the Ettan IPGphor™ Cup Loading Manifold system (GE Healthcare). IPG strips (24 cm Immobiline DryStrips, pH 3–10; GE Healthcare) were rehydrated in 450 μL of rehydration solution (8 M urea, 4% w/v CHAPS, 0.5% w/v Pharmalytes 3–10, 1.2% v/v DeStreak™ reagent, and traces of bromophenol blue) using the Immobiline DryStrip Reswelling Tray. The IPG strips were allowed to rehydrate overnight (10–20 h), and were transferred to the Ettan IPGphor Cup Loading Manifold. A strip of cups was placed for anodic cup-loading and the protein samples were loaded. IEF was carried out at a maximum voltage of 8000 V for a total of 55 kVh, according to the manufacturer's instructions. After IEF, the strips were stored at −80°C or used for the second dimension separation. Strip equilibration was performed immediately prior to the second dimension run. Briefly, the strips were equilibrated in two sequential 15-min steps in the adequate buffer (2% w/v SDS, 75 mM Tris-HCl [pH 8.8], 6 M urea, 30% v/v glycerol, and traces of bromophenol blue) containing 1% w/v DTT (step 1), or 2.5% iodoacetamide (step 2). The equilibrated strips were then placed on top of 1.5-mm-thick 12% w/v SDS-PAGE gels and the PeppermintStick™ Phosphoprotein molecular weight standards were applied (Molecular Probes, Invitrogen, Carlsbad, CA, USA). Proteins were separated at 2 W/gel for 1 h and 13 W/gel for 5 h.
After the second dimension run, protein spots in the analytical gels were consecutively stained with two different fluorescent dyes. For phosphoprotein detection with Pro-Q® Diamond (Molecular Probes), the methodology optimized by Agrawal and Thelen (Agrawal and Thelen, 2005) was followed. Briefly, the gels were placed in a fixing solution (50% v/v methanol and 10% v/v acetic acid) two times for 30 min. The gels were then washed in double distilled water (two times for 15 min), and stained for 2 h in the dark in a threefold diluted solution of Pro-Q. After destaining (four times for 30 min in 20% v/v acetonitrile and 50 mM sodium acetate [pH 4]), the gels were washed two times for 5 min and immediately scanned in a laser imager with 532-nm excitation and a 580-nm bandpass emission filter (Typhoon Trio; Amersham Biosciences, Piscataway, NJ, USA). After gel imaging, a second staining for total protein detection took place using Flamingo™ (Bio-Rad Labs, Hercules, CA, USA). The gels were immersed in a 20-fold diluted stain solution overnight, and then re-scanned with 532-nm excitation and a 555-nm bandpass emission filter. For preparative gel protein detection, the hot Coomassie method was used. The gels were placed in fixing solution (10% v/v acetic acid and 30% v/v ethanol) for 1 h, and subsequently stained with a hot CBB R350 (Amersham Biosciences) solution (0.5% w/v CBB R350 in 10% v/v acetic acid) overnight. The stained gels were washed in 10% v/v acetic acid solution for at least 24 h, and scanned with 633-nm excitation and no emission filter. The gels were stored in a 5% v/v acetic acid solution at 4°C.
Analysis of protein expression and phosphorylation levels
In total, three 2-DE gels for each experimental condition (IM treatment and control, samples A and B, respectively), corresponding to triplicates of two biological samples per condition, were analyzed. The triplicates were performed to reduce technical variations that may occur across different separations. Each biological sample was prepared by pooling together cell samples obtained from two independent growth experiments to reduce biological variation. The scanned gel images were analyzed using Progenesis SameSpots (Nonlinear Dynamics, Durham, NC, USA) software. Protein spots were identified by an automatic spot detection algorithm. Individual spot volumes were normalized against total spot volumes for a given gel. Averages for each growth condition were then compared by their normalized volume using one-way analysis of variance (ANOVA) between-group testing. Statistically significant spots (p<0.05) were selected for analysis, with two exceptions (highlighted in Tables 1 and 2), for which spots with p values between 0.05 and 0.08 were also analyzed. Differential expression or phosphorylation between the two experimental conditions was quantified in terms of total fluorescence variation, and only fold-variations within a threshold of at least a 1.5-fold increase or a 0.66-fold decrease between averaged gels were considered. Spots that showed evidence of saturation were not included for further analysis, nor were spots that the automatic detection algorithm did not identify. PeppermintStick standards are a mixture of phosphorylated and non-phosphorylated proteins that serve as both molecular weight markers and as positive and negative controls: detected phosphoprotein spots on 2-D gels were normalized against positive and negative phosphoprotein markers to eliminate false-positive spots.
Spot numbers are arbitrarily assigned by the Progenesis SameSpots image analysis software. Proteins with p values above 0.05 are underlined. Accession numbers represent entries in the NCBI database. Protein molecular function and theoretical pI (isoelectric point) and Mr (molecular weight in kDa) were obtained from the SGD (http://www.yeastgenome.org) and CYGD-MIPS (http://mips.gsf.de/genre/proj/yeast) databases.
Spot numbers are arbitrarily assigned by the Progenesis SameSpots image analysis software. Proteins with p values above 0.05 are underlined. Accession numbers represent entries in the NCBI database. Protein molecular function and theoretical pI (isoelectric point) and Mr (molecular weight in kDa) were obtained from the SGD (http://www.yeastgenome.org) and CYGD-MIPS (http://mips.gsf.de/genre/proj/yeast) databases.
Protein identification
Identification of the selected spots of possible interest was performed by PMF in the proteomics unit at the Centro Nacional de Investigaciones Cardiovasculares Carlos III, Madrid, Spain (CNIC Foundation). Protein spots were excised manually from polyacrylamide gels and then digested automatically using a Proteineer DP protein digestion station (Bruker-Daltonics, Bremen, Germany). The digestion protocol used was that of Shevchenko and colleagues. (Shevchenko et al., 2006) with minor variations. Gel plugs were submitted to reduction with 10 mM DTT (GE Healthcare) in 50 mM ammonium bicarbonate (99.5% purity; Sigma Chemical, St. Louis, MO, USA), and alkylation with 55 mM iodoacetamide (Sigma Chemical), in 50 mM ammonium bicarbonate. The gel pieces were then rinsed with 50 mM ammonium bicarbonate and ACN (gradient grade; Merck, Darmstadt, Germany), and dried under a stream of nitrogen. Modified porcine trypsin (sequencing grade; Promega, Madison, WI, USA), at a final concentration of 13 ng/mL in 50 mM ammonium bicarbonate, was added to the dry gel pieces and the digestion proceeded at 37°C for 6 h. Finally, 0.5% v/v TFA (99.5% purity; Sigma Chemical) was added for peptide extraction. An aliquot of the above digestion solution was mixed with an aliquot of CHCA (Bruker-Daltonics) in 33% v/v aqueous ACN and 0.1% v/v TFA. This mixture was deposited onto a 600-mm AnchorChip MALDI probe (Bruker-Daltonics) and dried at room temperature. MALDI-MS(/MS) data were obtained using an Ultraflex TOF mass spectrometer (Bruker-Daltonics) equipped with a LIFT-MS/MS device (Suckau et al., 2003).
Spectra were acquired in the positive-ion mode at 50-Hz laser frequency, and 100–1500 individual spectra were averaged. For fragmentation analysis in the tandem TOF/TOF mode, precursors were accelerated to 8 kV and selected in a timed-ion gate. Fragment ions generated by laser-induced decomposition of the precursor were further accelerated by 19 kV in the LIFT cell, and their masses were analyzed after passing the ion reflector. Measurements were in part performed using post-LIFT metastable suppression, which allowed removal of precursor and metastable-ion signals produced after extraction out of the second-ion source. Detailed analysis of peptide mass mapping data was performed using flexAnalysis software (Bruker-Daltonics). Internal calibration of MALDI-TOF mass spectra was performed using two trypsin autolysis ions with m/z=842.510 and m/z=2211.105. For MALDI-MS/MS, calibrations were performed with fragment-ion spectra obtained for the proton adducts of a peptide mixture covering the 800–3200 m/z region. MALDI-MS and MS/MS data were combined through the MS BioTools program (Bruker-Daltonics) to search the NCBInr database using MASCOT software (Matrix Science, London, U.K.; Perkins et al., 1999).
Data analysis
The identified protein dataset was clustered according to biological process gene ontology (GO) assignments, and subsequent manual adjustment in compliance with SGD reports (www.yeastgenome.org and the MIPS functional catalogue, http://www.helmholtz-muenchen.de/en/ibis). Database searches for interrogation of MS-derived phosphorylation data were performed at Phosphopep (http://www.phosphopep.org/) and Phosphogrid (http://www.phosphogrid.org/). Theoretical pI (isoelectric point) and Mr (molecular weight in kDa) data were obtained from the SGD and CYGD-MIPS (http://mips.gsf.de/genre/proj/yeast) databases. The documented regulators of genes encoding proteins whose abundance was altered in response to imatinib in S. cerevisiae were obtained using the information and tools available in the YEASTRACT database (www.yeastract.com; Teixeira et al., 2006). Interaction networks between proteins were obtained from STRING (http://string.embl.de/; von Mering et al., 2007), a web-based resource containing a database that encompasses known and predicted protein-protein interactions for 373 organisms, including S. cerevisiae and humans. Human proteins with sequence homologs that were found to be involved in the response to imatinib in S. cerevisiae were identified by BLASTP sequence homology searches at NCBI (http://www.ncbi.nlm.nih.gov/). Pathway queries for yeast and human proteins were performed at SGD and NCBI.
Results and Discussion
Alteration of yeast growth curves and proteomes in response to imatinib
Under the experimental conditions used in this study, when an unadapted exponential-growth phase population of wild-type S. cerevisiae cells was exposed to 400 mg/L imatinib, no detectable effect was registered on the growth curves for an initial period of approximately 3–4 h (Fig. 1). After this time, both the OD600 and the concentration of viable cells decreased compared with control populations. Imatinib-challenged cells displayed a specific growth rate lower than the specific growth rate registered in unsupplemented medium, and growth stopped after 7 h of incubation. This altered growth pattern in response to imatinib is possibly a reflection of the time required for all of the molecular targets of imatinib in yeast to be completely inactivated. Moreover, preliminary quantitative proteomics studies with yeast cells collected after only 30 min of incubation revealed no significant alterations in the proteome (results not shown). Samples A and B were collected after a 4-h growth period as described above (Fig. 1), and the proteomes of these yeast cells grown in the presence or absence of IM were separated by 2-DE. The resulting 2-D gels were stained with both phosphoprotein-selective and total protein stains and compared to identify differentially expressed or phosphorylated proteins. Approximately 1600 protein spots were consistently separated in each gel within a pI range from pH 3–10, and molecular mass between 12 and 140 kDa. Representative gels are shown in Figure 2.

Growth curves of parental strain S. cerevisiae BY4741 in MM4 medium that was supplemented (solid diamonds) or not (open diamonds) with 400 mg/L imatinib. Growth was followed by measuring culture OD at 600 nm, or by determining the viable cell concentration, assessed as the number of CFU/mL of cell culture (the results are representative of at least three independent growth experiments). The arrows indicate the times of culture sample harvest for 2-DE.

Representative 2-DE gels of S. cerevisiae BY4741 cell proteomes. The normalized intensities were compared to controls in order to estimate the imatinib-relative variations (protein content and phosphorylation). Spots that were differentially abundant with statistical significance in all replicates were identified by Progenesis SameSpots image analysis. The spot numbers match the corresponding proteins in Tables 1 and 2. The 2-DE gels shown correspond to proteomes of cell cultures cultivated for 4 h in the presence of 400 mg/L imatinib. (
This expression proteomics analysis identified a total of 18 proteins across samples A and B that were either differentially expressed (total protein content analysis, n=10 proteins), or had differential phosphorylation levels with no protein content alteration (n=8 proteins), from control to imatinib samples. The proteins whose relative abundance or phosphorylation was considered to vary in response to IM (applying a±1.5-fold cut-off) with statistical significance (p<0.05) were identified by MALDI-MS/MS (Tables 1 and 2; See Supplementary Material at www.liebertpub.com/omi). Interestingly, the majority of the proteins identified were either underexpressed (the protein content was decreased in 8 of 10 proteins; Table 1), or under-phosphorylated (in all 8 proteins identified; Table 2). Three low-abundance spots failed to be identified by MALDI-MS/MS and consequently could not be included in this analysis. The limited number of proteins identified is consistent with the inherent specificity of imatinib and the corresponding low number of known molecular targets, as well as with the limited coverage of the proteome that is intrinsic to 2-DE and the low-inhibitory concentrations used. Moreover, it should be noted that this analysis might fail to identify several proteins of interest, due to the automatic spot detection algorithm used by the analysis software. Also, proteins whose expression is negligible, leading to a non-visible spot in a given experimental condition, are not considered statistically significant by the software and thus are not analyzed.
Gene ontology (GO) analysis of the resulting protein dataset, in compliance with SGD and MIPS reports, showed that the most statistically relevant molecular functions are protein folding and stabilization, and translation and cellular carbohydrate metabolic processes (Fig. 3). The pathways in which these proteins are involved are summarized in Table 3. Carbohydrate metabolic processes represent the most prominent functional category in the entire dataset (30.4%), for which glycolysis and glucose metabolic pathways are strongly represented, especially in the differential phosphorylation analysis (Fig. 3).
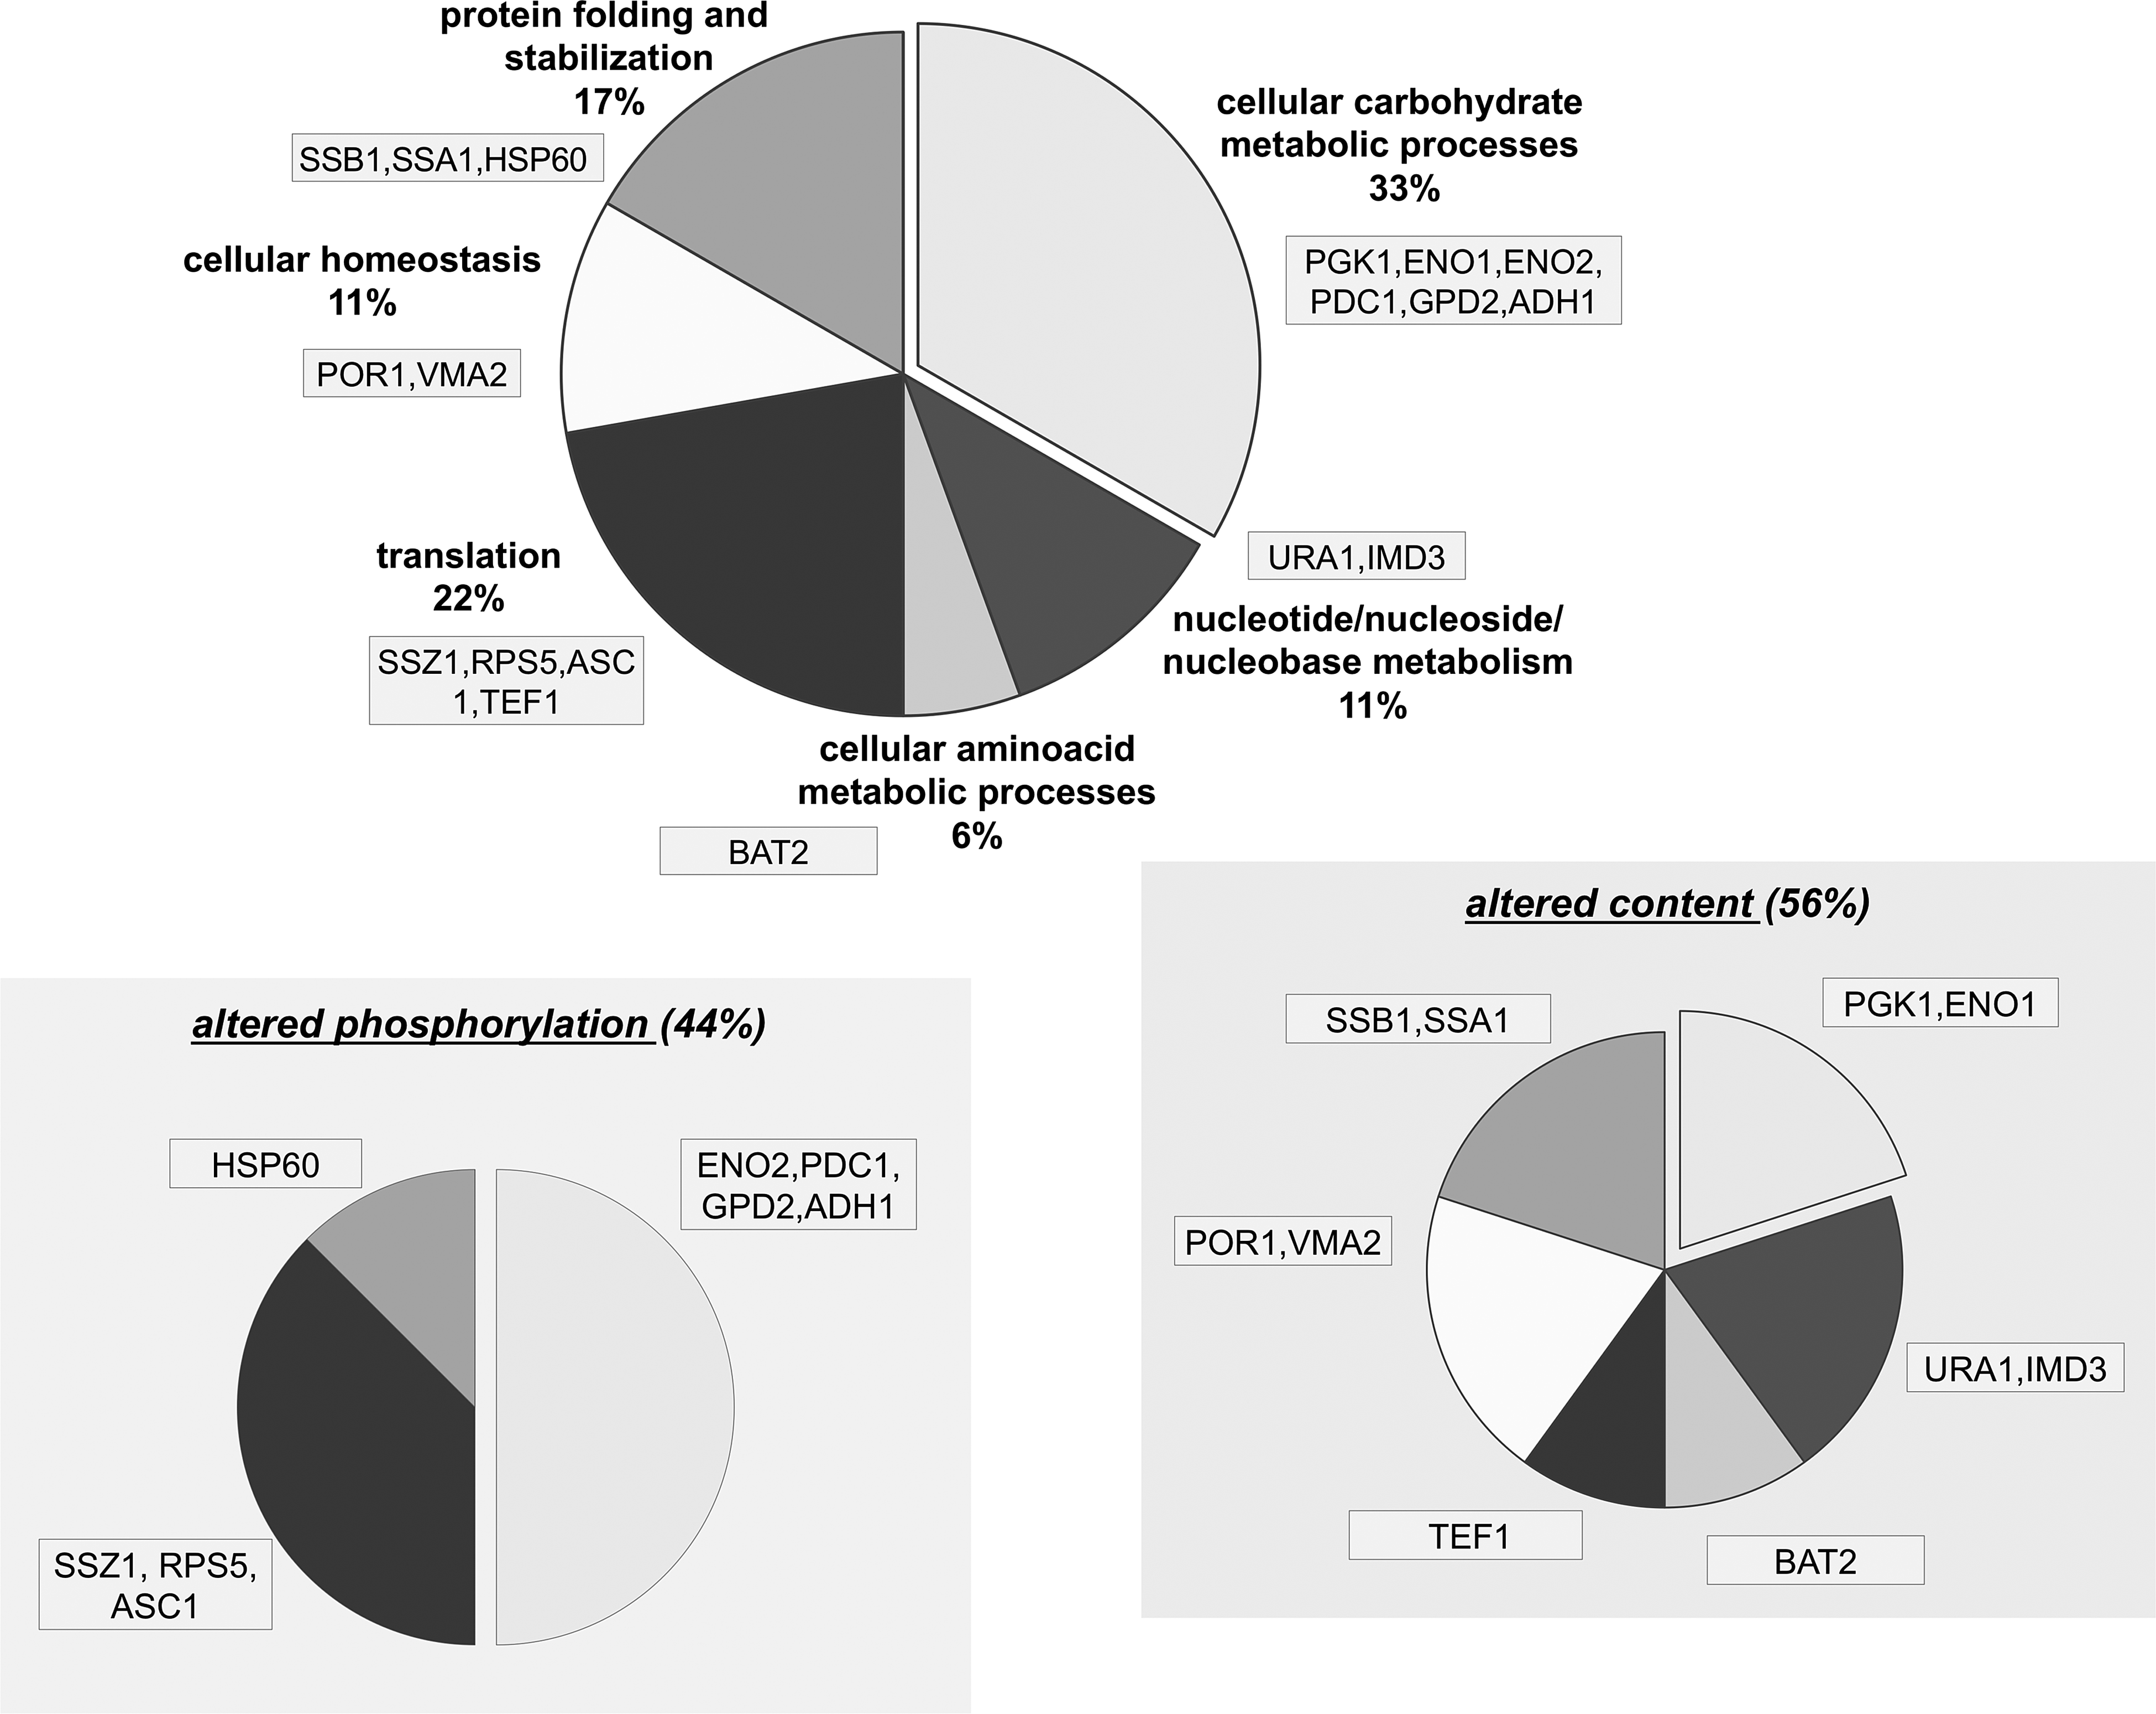
Functional categorization of proteins that are differentially expressed and/or phosphorylated in response to imatinib. The entire dataset of proteins showing a variation greater than 1.5-fold or below 0.66-fold was clustered into functional categories based on the GO resource (Ashburner et al., 2000), with manual adjustments (top panel). The same analysis is shown for each subset, corresponding to proteins that were either differentially expressed or phosphorylated in response to imatinib (bottom panel).
The results were obtained using NCBI-available BLAST tools (http://www.ncbi.nlm.nih.gov/). Descriptions for gene products and the pathways involved were obtained at the SGD and NCBI databases.
n.a., none available.
Conservation in the human genome and protein-protein interaction networks
The results obtained in this yeast model can be tentatively extended to human cells in the context of imatinib therapy. The yeast proteins identified bear a remarkable conservation in human cells; all 18 proteins possess a functional homolog in the human proteome (Table 3). This 100% of dataset homology is even more striking when we consider that the whole yeast genome includes an estimated 30% proteins with human homologues (Botstein et al., 1997). As described in Table 3, some of these human protein homologs have well defined roles (amino acid metabolism [BCAT1], glycolysis and gluconeogenesis [ENO3, PGK1, and ENO1], RNA degradation [HSPD1], translation [RPS5 and EEF1A1], and nucleotide metabolism [DPYD and IMPDH1]) and will be discussed in further detail in the following sections. Some of these results are consistent with insights previously obtained in human studies with imatinib, namely in the context of a previously proposed role for HSP70 proteins in the response to imatinib (Colavita et al., 2010; Guo et al., 2005; Pocaly et al., 2007, 2008), as well as in the importance of glycolytic metabolic pathways as markers of imatinib action (Ferrari et al., 2007; Kominsky et al., 2009; Mason et al., 2010; Zhao et al., 2010).
Although several human disease-causing mutations lead to loss or gain of protein-protein interactions, the protein interaction network in human cells is still very poorly known and difficult to investigate. Studies on yeast orthologs and their protein-protein associations have already generated significant insights into human diseases (Hsu et al., 2007). A map of known and predicted protein-protein associations was obtained for the dataset of yeast proteins altered in response to imatinib, as well as for the correspondent human orthologs (Table 3). Both networks are depicted in Figure 4, and were predicted using the STRING database, which includes interactions derived from direct (physical) and indirect (functional) associations (von Mering et al., 2007). A higher number of interactions was predicted for the yeast dataset, in which proteins involved in protein folding, glycolysis, glucose fermentation, and gluconeogenesis pathways are in evidence. In spite of all yeast proteins having a human counterpart, the interactions predicted for the human dataset are considerably less numerous, but still find a correspondence for the aforementioned pathways. The complete conservation of the yeast dataset in the human proteome, together with the analogies observed for the main interactions in the two biological systems, suggest that the indications obtained in this study might be helpful to gain insights into the mechanisms of imatinib's action in human cells.

Protein interactions established within the entire imatinib-responsive yeast protein dataset and in the corresponding dataset of human functional homologs. The protein interaction network maps shown were adapted from the output of STRING database tools, using the default parameters (http://string.embl.de; von Mering et al., 2007). The 18 yeast proteins (Tables 1 and 2) were submitted to obtain the S. cerevisiae map, whereas for the Homo sapiens map a list of 16 homologs was analyzed (3 yeast proteins, Ssa2, Ssb1 and Ssz1, share HSPA8 as the highest-identity homologue; Table 3). Proteins involved in human and yeast glycolysis/gluconeogenesis and protein folding pathways are highlighted (light circles, protein content variation; dark circles, phosphorylation level variation).
Imatinib affects the abundance of proteins with functions in glycolysis, protein folding, amino acid metabolism, nucleotide metabolism, and cellular ion homeostasis
Adaptation of S. cerevisiae BY4741 cells to 400 mg/L IM involves a decrease in content of 8 proteins, with only 2 proteins being overexpressed (Table 1 and Fig. 3). Eno1 and Pgk1, two proteins that are involved in glycolytic pathways, were downregulated. Eno1 is an enolase that functions as dimeric phosphopyruvate hydratase complexes (McAlister and Holland, 1982), while Pgk1, a phosphoglycerate kinase, is a key enzyme in glycolysis and gluconeogenesis (Hitzeman et al., 1980). Both Eno1 and Pgk1 have human functional homologs involved in glycolysis/gluconeogenesis pathways (Table 3), ENO3 and PGK1, respectively. Interestingly, glucose uptake, glycolysis, and metabolism, have been recently been associated with the response to imatinib (Kominsky et al., 2009; Mason et al., 2010; Zhao et al., 2010). Most cancer cells exhibit enhanced glycolytic activity and impaired mitochondrial metabolism. This mechanism represents one of the most fundamental metabolic alterations in cancer cells, and is known as the Warburg effect (Levine and Puzio-Kuter, 2010; Pelicano et al., 2006). Glycolysis can be upregulated by activation of the serine/threonine kinase AKT, an important downstream effector of Bcr-Abl (Elstrom et al., 2004), and there is evidence that the control of glucose-substrate flux is an important mechanism of imatinib's action in gastrointestinal stromal KIT-positive tumors (Van den Abbeele and Badawi, 2002). In fact, and unlike standard chemotherapeutics, imatinib possesses no cytocidal activity but is still able to reverse the Warburg effect in cancer cells, by switching from glycolysis to mitochondrial glucose metabolism (Gottschalk et al., 2004). Conversely, increased glucose uptake and non-oxidative glycolytic activity are metabolic markers for the early detection of imatinib resistance (Klawitter et al., 2009; Kominsky et al., 2009). 2-DE proteomic studies in human cell lines have also corroborated these findings, and attributed an important function in imatinib resistance to metabolism (Boren et al., 2001; Ferrari et al., 2007; Pocaly et al., 2008), while ENO1, a human homologue of yeast Eno1 and Eno2, was found to be overexpressed in imatinib-sensitive cell lines (Ferrari et al., 2007). Our present findings suggest that imatinib promotes a decrease in the glycolytic rate of yeast cells. While in human cells this effect is thought to occur via the AKT kinase downstream of Bcr-Abl inhibition (Elstrom et al., 2004), in yeast cells there are probably alternative pathways involved. In fact, yeast cells do not possess close homologs of Bcr-Abl or AKT.
The present study has also highlighted the importance of chaperones and protein folding in the yeast adaptive response to imatinib and tolerance to this drug, with the identification of 2 downregulated proteins, Ssb1 and Ssa2, members of the heat shock protein 70 family (Bukau and Horwich, 1998; Table 1). Protein folding and translation have been previously shown to be involved in imatinib-resistance mechanisms in human CML cell lines (Colavita et al., 2010; Ferrari et al., 2007; Pocaly et al., 2007, 2008), where overexpression of Hsp70 proteins can lead to both in vitro and in vivo resistance to imatinib, including in imatinib-resistant K562 and KCL22 cell lines, where none of the Bcr-Abl-dependent mechanisms of resistance have been detected (Colavita et al., 2010; Pocaly et al., 2007, 2008). Hsp70 proteins were found to be underexpressed in imatinib-sensitive K562 cells in the presence of imatinib (Balabanov et al., 2007). Similar results in KCL22 cells point to an indirect effect of Hsp70 proteins in imatinib resistance (Colavita et al., 2010). Among those human Hsp70 proteins is HSPA8 (Pocaly et al., 2008), a protein that shares significant homology with Ssa2 and Ssb1.
Tef1, an EF-1 alpha translational elongation factor (Schirmaier and Philippsen, 1984), was found to be downregulated in this study (Table 1). Interestingly, the translation elongation factors EEF1D, EEF1G, and TCEA1 (the latter a functional homolog of Tef1), were identified in human proteomic studies (Colavita et al., 2010; Ferrari et al., 2007; Pocaly et al., 2008), while the transcription elongation factor-encoding gene TEF4 was identified as a determinant of resistance to imatinib after a screen of the yeast deletion collection (dos Santos and Sá-Correia, 2009). Moreover, human elongation factors including EEF1D are involved in the positive regulation of the NF-κB cellular pathway, which in turn is activated independently of Bcr-Abl in imatinib-resistant patients (Donato et al., 2004).
Another relevant molecular function identified was nucleotide metabolism. Ura1, a dihydroorotate dehydrogenase involved in biosynthesis of pyrimidines (Lacroute, 1968), and Imd3, an inosine monophosphate dehydrogenase (Escobar-Henriques and Daignan-Fornier, 2001), were up- and downregulated by imatinib, respectively (Table 1). IMPDH2, the human homolog of Imd3p, is also overexpressed in imatinib-resistant cell lines (Colavita et al., 2010; Pocaly et al., 2008), and its expression is increased in CML blast phase patients (Nowicki et al., 2003). Furthermore, overexpression of IMPDH in CML cells is included in the panel of cellular modifications induced by Bcr-Abl, and a synergistic pro-apoptotic action by IMPDH inhibitors and imatinib has also been reported (Gu et al., 2005).
Maintenance of cellular ion homeostasis was also found to be important in the yeast response to imatinib. Por1, a mitochondrial porin (anion channel; Lee et al., 1998) was upregulated, while the content of Vma2, the catalytic subunit of the highly conserved V-ATPase complex (Jefferies et al., 2008), was reduced upon imatinib treatment (fold change −1.8; Table 1). This result is of special interest because deletion mutants lacking the encoding genes for several subunits of the V-ATPase have been found to be hyper-susceptible to imatinib, which was further shown to inhibit V-ATPase activity and vacuolar function in vivo (dos Santos and Sá-Correia, 2009).
Using the information gathered in the YEASTRACT database (Abdulrehman et al., 2011; Teixeira et al., 2006), and since 8 of 10 proteins were underexpressed in response to imatinib, we tried to find transcriptional regulators that might be involved in gene repression, and learn how those regulators are regulated themselves, particularly at the post-transcriptional level through phosphorylation. From this analysis we singled out Rfx1p, a transcriptional repressor of DNA-damage-regulated genes (Huang et al., 1998), that acts on Ssb1p and Ssa2p. Another interesting regulator is Gcr1p, a transcriptional activator of genes involved in glycolysis (including Pgk1p and Eno1p), with a role in maintaining a basal glycolytic rate (Uemura and Jigami, 1992). Gcr1p itself is regulated by phosphorylation, and a negative regulation of its activity might partially account for the indications of decreased glycolysis that were obtained in this study.
Imatinib leads to differential phosphorylation of yeast proteins involved in glycolysis, translation, protein folding, and cell signaling
Alterations in phosphoproteins were detected in samples A and B by Pro-Q Diamond staining. Altered phosphorylation levels were observed in a total of 8 proteins after a 4-h treatment with imatinib, with all 8 showing a negative variation in their respective phosphorylation levels (Table 2 and Fig. 3). Interestingly, none of these 8 proteins were identified as being differentially expressed in response to imatinib. Comparisons of Flamingo and Pro-Q staining of the same 2-DE gel also indicated that highly abundant protein spots were not stained with Pro-Q, suggesting high specificity of Pro-Q to phosphoproteins. Phosphorylation-specific stains such as Pro-Q Diamond are particularly interesting, because it is a high-sensitivity methodology, and phosphoproteins tend to be a lot less abundant. Moreover, it is fully compatible with other staining methods and MS-based analysis. The use of Pro-Q Diamond has been reported with success for various biological models (Kang et al., 2007; Orsatti et al., 2009; Thingholm et al., 2009).
Glycolysis and glucose metabolic pathways are highly represented among the few differentially phosphorylated proteins identified in this study. Eno2, Pdc1, and Adh1 all showed reduced levels of phosphorylation in response to imatinib (Table 2). Eno2 is an enolase enzyme similar to Eno1p (McAlister and Holland, 1982), Adh1p is an alcohol dehydrogenase required for the last step in the glycolytic pathway, and Pdc1p is a key enzyme in alcoholic fermentation, also involved in amino acid catabolism (Dickinson et al., 2003). Eno1 and Pdc1 possess human homologs in glycolysis/gluconeogenesis pathways (Table 3); the important role of glycolysis in the response to imatinib was discussed in the previous section, as well as the implications in a human imatinib-therapy context. The only differentially phosphorylated protein included in the carbohydrate metabolic processes category that is not involved in glycolytic pathways is Gpd2. A glycerol 3-phosphate dehydrogenase (Eriksson et al., 1995), Gpd2 and its human homologue GPD1 may also be correlated with imatinib resistance. Pathways of phospholipid metabolism, where functional human homologs of the correspondent yeast genes are involved, were shown to be highly predictive for cell responses to imatinib in a metabolic characterization study of imatinib resistance in CML cell lines (Klawitter et al., 2009). This study also described a decrease in glycolytic activity in sensitive cells.
Protein folding and translation is another relevant function in this dataset (Table 2 and Fig. 3). The human ortholog of the yeast protein Ssz1 is HSPA8, whose role in imatinib-resistant cell-line proteomic studies has already been discussed. Similarly to HSPA8 (Matsuoka et al., 2007), Ssz1 phosphorylation is also dependent on DNA damage checkpoint kinases (Smolka et al., 2007). Interestingly, imatinib had been previously hypothesized to promote DNA damage in yeast cells, although it was not known whether it could be a primary or a secondary cause of imatinib toxicity in yeast (dos Santos and Sá-Correia, 2009). In that same study, Ssz1p was identified as a determinant of resistance to imatinib in yeast, where the deletion mutant Δssz1 is hyper-susceptible to imatinib (dos Santos and Sá-Correia, 2009). The conserved protein Hsp60, from the heat shock 60 family (Bukau and Horwich, 1998), is also under-phosphorylated, but to our knowledge the HSP60 family has never been associated with imatinib resistance.
Asc1 is a G-protein beta subunit and a core component of the small (40S) ribosomal subunit (Gerbasi et al., 2004) whose phosphorylation levels decrease in response to imatinib. Interestingly, Rps5, a component of the small (40S) ribosomal subunit (Planta and Mager, 1998), was also shown to be differentially phosphorylated under imatinib stress (fold change −3.8; Fig. 5). To our knowledge, there is no described relation between imatinib resistance and S5 ribosomal proteins. However, a newly described pathway in Bcr-Abl signal transduction was recently identified, involving activation of the mammalian target of rapamycin (mTOR; Joha et al., 2011; Ly et al., 2003) pathway, and resulting in constitutive phosphorylation of S6 ribosomal proteins (Ly et al., 2003), which can be dramatically downregulated when imatinib is used in synergy with an IMPDH inhibitor (Gu et al., 2005). Moreover, a recent proteomics analysis of candidate downstream effectors of imatinib detected imatinib-repressed phosphorylation of the ribosomal S6 protein kinase RSK1 (Breitkopf et al., 2010). Identification of Asc1 and Rps5 as differentially phosphorylated proteins might suggest involvement of the S5 ribosomal proteins in the yeast response to imatinib.
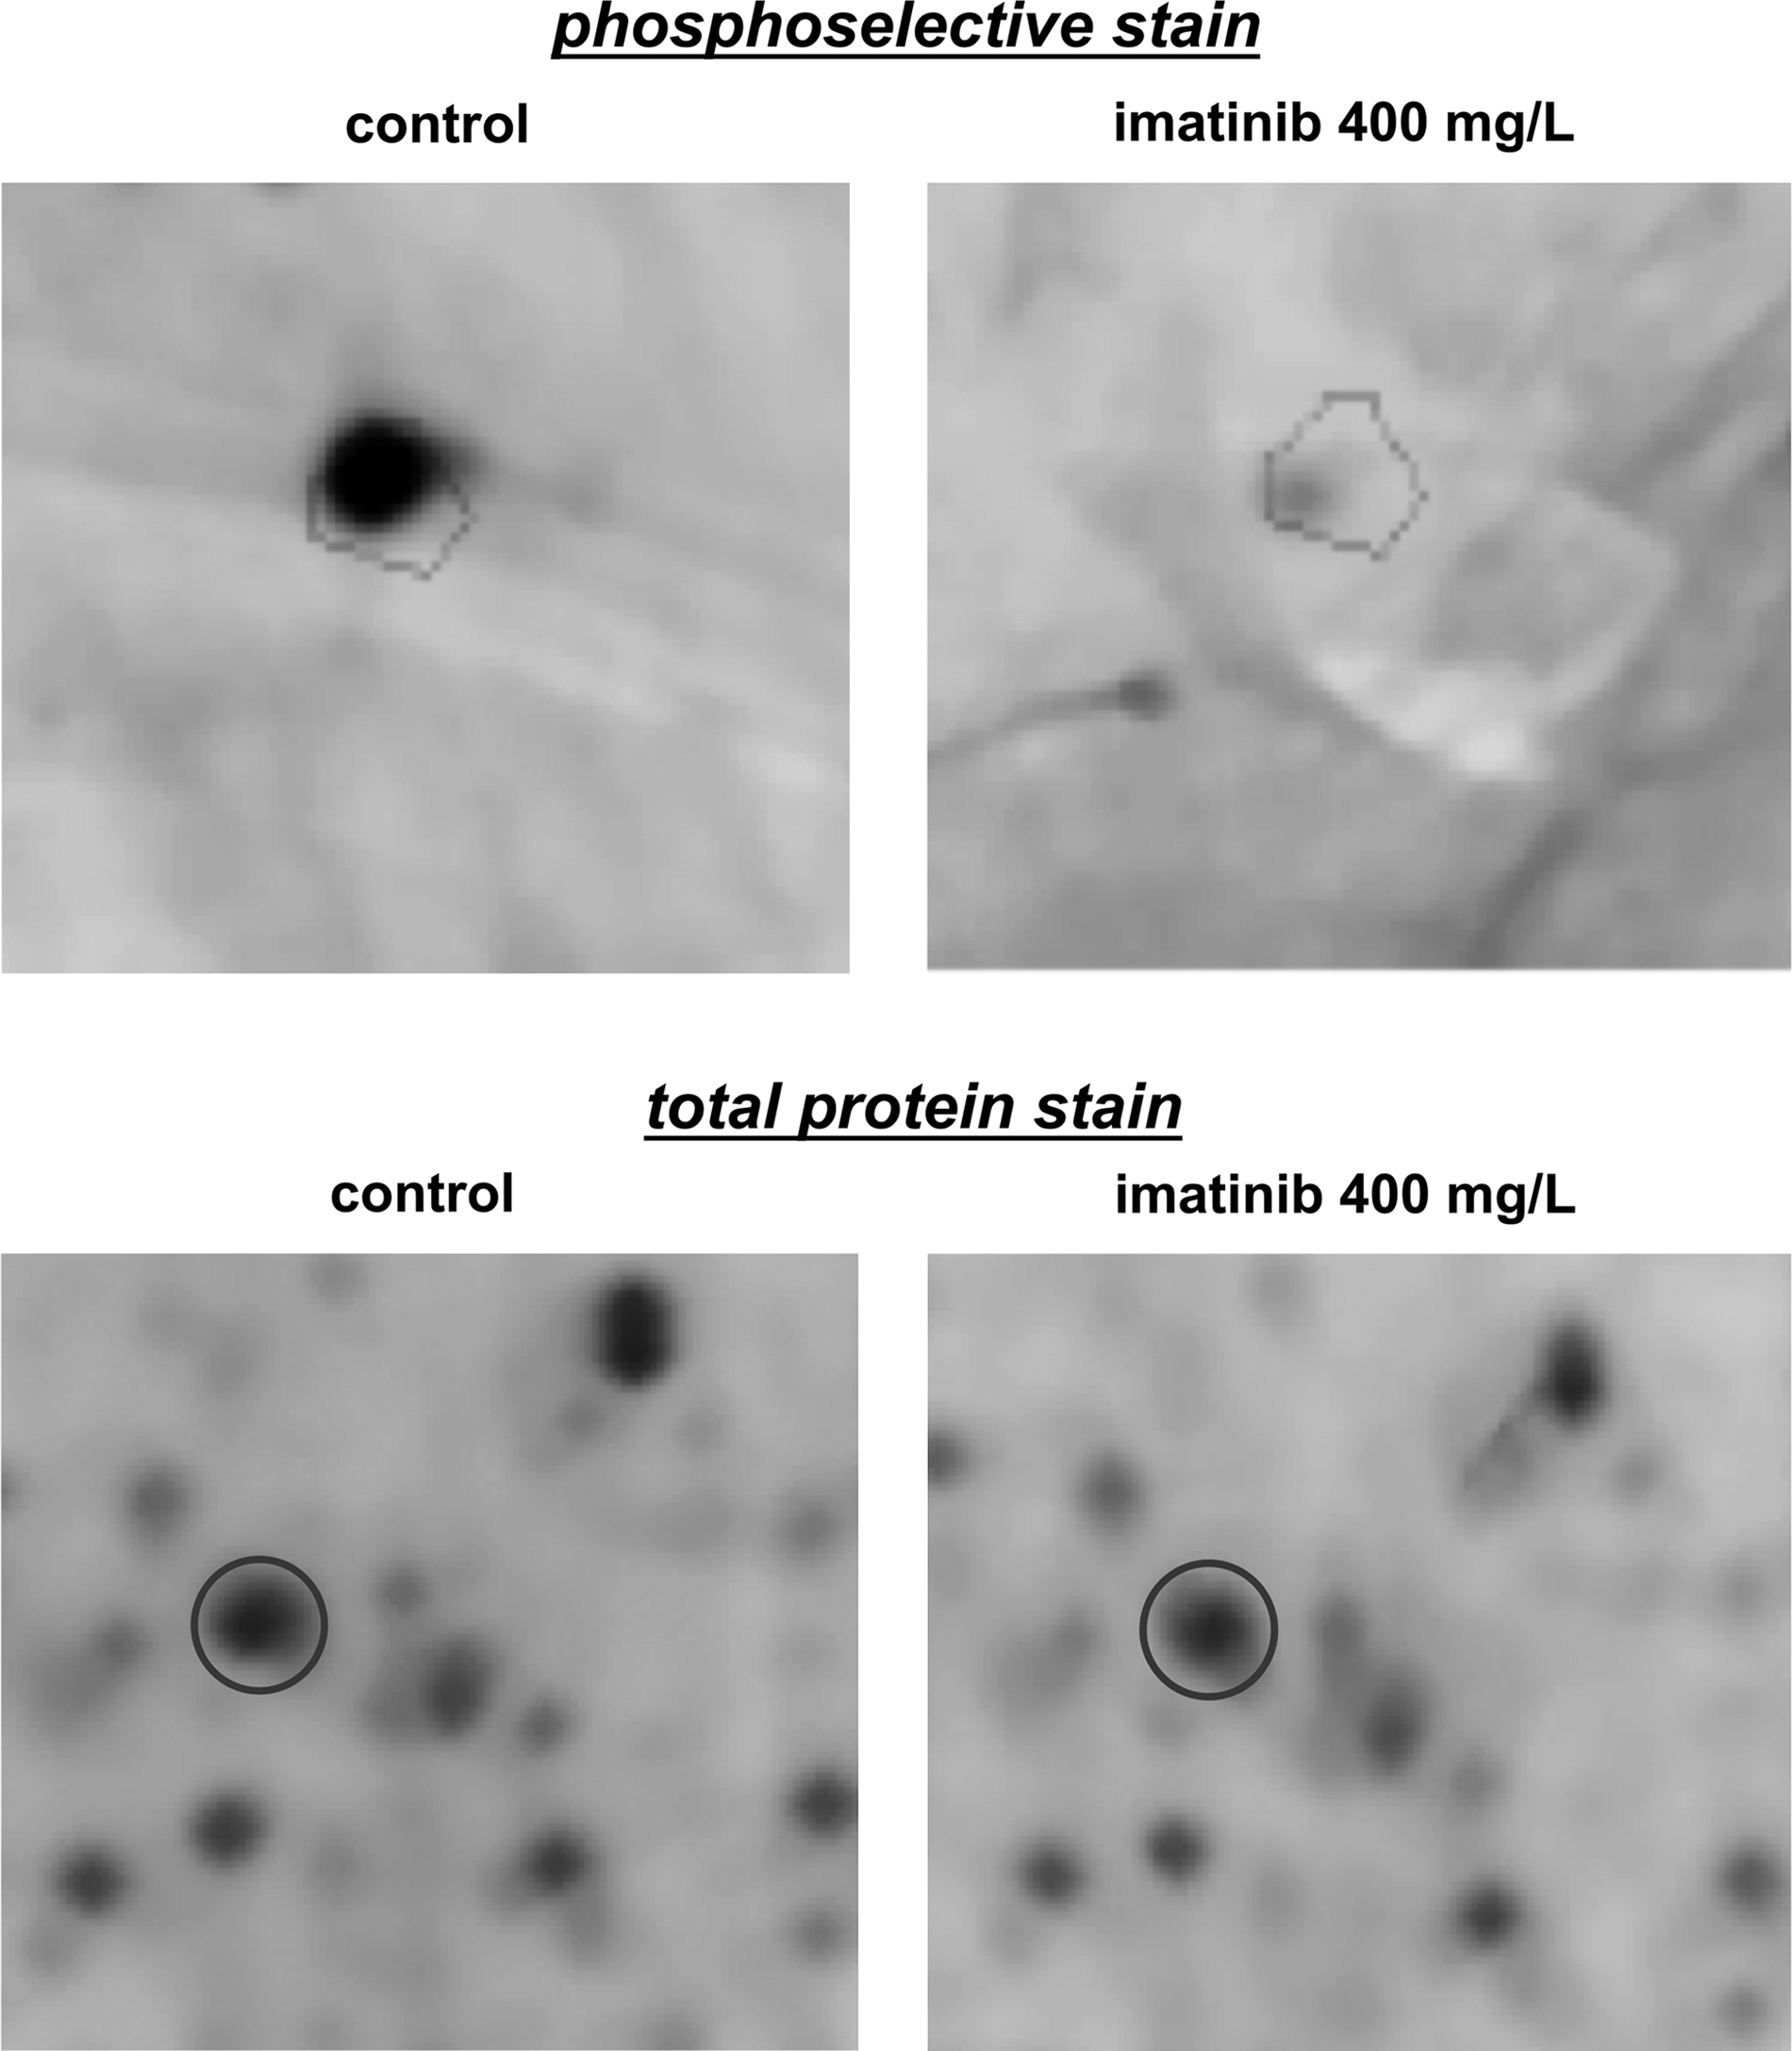
Example of a protein (Rps5) whose phosphorylation level was decreased in response to imatinib, while no significant difference was detected in total protein content. The specified areas of the 2-DE gels are shown for control and imatinib-stress experimental conditions after phosphoselective staining (top panel), and total protein staining (bottom panel).
Looking at the set of proteins displaying imatinib-repressed phosphorylation, as well as the list of transcriptional activators of the underexpressed proteins identified in this study (obtained from YEASTRACT; Abdulrehman et al., 2011; Teixeira et al., 2006), we find several protein kinase motifs in their sequences. In particular, the 8 under-phosphorylated proteins contain binding motifs for casein kinase I and II, glycogen synthase kinase 3 (GSK3), cAMP-dependent protein kinase (PKA), and the cell cycle cyclin-dependent kinase 1 (CDK1). The same motifs can be found in the list of transcriptional activators. Casein kinase II (CK2), a serine/threonine kinase with roles in cell growth and proliferation (Glover et al., 1994), is a multiprotein complex comprising 2 alpha catalytic subunits, Cka1 and Cka2, and 2 beta regulatory subunits, Ckb1 and Ckb2. Interestingly, our previous study identified the deletion mutants Δckb1 and Δckb2 as determinants of resistance to imatinib (dos Santos and Sá-Correia, 2009). Unfortunately, because CKA1 and CKA2 are essential genes, the corresponding deletion mutants could not be tested. Although the nature of this association between CK2 and imatinib action is not clear, these two independent works suggest that the CK2 kinase is involved in the action and response to imatinib in yeast cells.
Conclusions
Imatinib resistance is the result of multiple mechanisms, including the activation of pathways downstream of Bcr-Abl, or even independent of its kinase activity (Jiang et al., 2007; Quintás-Cardama et al., 2009; Tipping et al., 2003). Assuming that imatinib affects not only the Bcr-Abl kinase, but also other related proteins and molecular networks that can contribute to imatinib resistance and be conserved in yeast, we designed this quantitative and phospho-proteomics study to monitor the response of yeast cells to a low-inhibitory concentration of imatinib, with the main objective of identifying new molecular mechanisms and signaling pathways potentially involved in the response and increased tolerance to this drug. Eighteen proteins that showed significant changes in total content or phosphorylation level were identified, with a significant functional enrichment in cellular carbohydrate and metabolic processes, more specifically glycolysis and gluconeogenesis. The data obtained provided mechanistic insights into the underlying global response to imatinib in yeast, and is remarkably 100% conserved in the human genome. The results highlighted the importance of the gluconeogenesis and glycolysis pathways, which have recently been associated with the mechanisms of imatinib action in human cell line studies (Hickey and Cotter, 2006; Kominsky et al., 2009; Zhao et al., 2010), protein folding, which also has a correlation in imatinib-resistant human cell lines, in which comparative proteomic approaches have identified several proteins from the heat shock 70 families (Colavita et al., 2010; Ferrari et al., 2007; Guo et al., 2005; Pocaly et al., 2008), and also protein translation. Our results also include indications of the involvement of S5 ribosomal protein phosphorylation and imatinib-dependent reduced expression of Vma2, the catalytic ATP-binding subunit of the V-ATPase complex. The latter corroborates our previous results from a phenotypic study of imatinib in yeast (dos Santos and Sá-Correia, 2009), in which vacuolar function and V-ATPase activity were proposed as putative imatinib targets in yeast.
The small 18-protein dataset here identified is a reflection of the low drug-inhibitory concentrations used, in an effort to obtain a set of results that would represent a specific action of imatinib and not be obscured by general cellular toxicity mechanisms. In agreement with this objective, we have found several parallels between our results and insights previously obtained in human cell studies with imatinib, namely concerning the role of HSP70 proteins and of glycolytic metabolic pathways. It should be noted that the concentrations of imatinib used in this study are over 100 times higher than those used to study the effect of imatinib in human cell lines. In fact, and despite its numerous advantages, pharmacogenomics studies in yeast have a number of limitations, one of which is the high drug concentration that is usually required to produce a biological response. This is likely due to the barrier presented by the cell wall, as well as the expression of numerous active efflux pumps and detoxification mechanisms that are highly abundant in yeast cells, which together make it virtually impossible to know the real concentration that is acting on the drug targets (Cowen and Steinbach, 2008; Leppert et al., 1990; Sá-Correia et al., 2009; Smith et al., 2010). However, one of the main advantages of using yeast as a model in pharmacogenomics is that yeast is currently the only system for which it is possible to assess all targets in the cell simultaneously and in vivo (dos Santos et al., 2012; Smith et al., 2010). Yeast allows a genome-wide perspective on the action of drugs, making use of global approaches to identify candidate drug targets and off-target effects (Ruderfer et al., 2009; Swen et al., 2007; Wang and Weinshilboum, 2008). These strategies are important not only to identify novel targets for further development, but also to find new uses for already approved drugs with established safety profiles, as is the case of imatinib. In the present work, the remarkable conservation of the altered proteins in the human proteome, as well as the parallels established, further highlight the potential of S. cerevisiae as a model system for pharmacological studies, and may have clinical ramifications in the identification of novel applications for targeted therapy with imatinib in diseases that are not characterized by the Bcr-Abl kinase, but possess alternative imatinib targets.
Footnotes
Acknowledgments
This work was supported by Fundação para a Ciência e a Tecnologia: contract PTDC/SAU-FCF/71760/2006, doctoral and postdoctoral grants to S.C.S. (SFRH/BD/32479/2006 and SFRH/BPD/75483/2010), and a postdoctoral grant to N.P.M. (SFRH/BPD/46982/2008).
Author Disclosure Statement
The authors declare that no conflicting financial interests exist.
References
Supplementary Material
Please find the following supplemental material available below.
For Open Access articles published under a Creative Commons License, all supplemental material carries the same license as the article it is associated with.
For non-Open Access articles published, all supplemental material carries a non-exclusive license, and permission requests for re-use of supplemental material or any part of supplemental material shall be sent directly to the copyright owner as specified in the copyright notice associated with the article.