
Abstract
Abstract
Breast cancer, especially ER positive/HER2/neu negative IDC, is the predominant subtype of invasive ductal carcinoma. Although proteomic approaches have been used towards biomarker discovery in clinical breast cancer, ER positive/HER2/neu negative IDC is the least studied subtype. To discover biomarkers, as well as to understand the molecular events associated with disease progression of estrogen receptor positive/HER2/neu negative subtype of invasive ductal carcinoma, differential protein expression profiling was performed by using LC-MSE (MS at elevated energy). A total of 118 proteins were identified, of which 26 were differentially expressed. These identified proteins were functionally classified and their interactions and coexpression were analyzed by using bioinformatic tools PANTHER (Protein Analysis THrough Evolutionary Relationships) and STRING (Search Tool for the Retrieval of Interacting Genes). These proteins were found to be upregulated and were involved in cytoskeletal organization, calcium binding, and stress response. Interactions of annexin A5, actin, S100 A10, glyceraldehyde 3 phosphate dehydrogenase, superoxide dismutase 1, apolipoprotein, fibrinogen, and heat shock proteins were prominent. Differential expression of these proteins was validated by two-dimensional gel electrophoresis and Western blot analysis. The cluster of these proteins may serve as a signature profile for estrogen receptor positive/ HER2/neu negative subtype.
Introduction
Proteomics-based studies enable comparative and quantitative investigation of cellular protein expression, which helps in discovery of biomarkers, drug targets, and understanding signaling pathways that govern tumorigenesis (Simpson et al., 2001). In view of this, many comparative proteomic studies in breast cancer have been reported (Zhang et al., 2005; Rezaul et al., 2010). Although HER2/neu positive tumors are more aggressive phenotype, they account for only 25% to 30% of all IDCs (Slamon et al., 1989), whereas the ER positive/HER2/neu negative subgroup numerically comprises about two-thirds of all breast cancers and in fact is the dominant subtype. Very few proteomics studies have been carried out in ER positive/HER2/neu negative IDC breast clinical tissues till now. Only one such study has been reported, where upregulation of peptidyl prolyl cis-trans isomerase B, GDP inhibitor, and tropomyosin alpha 4 were observed consistently (Weitzel et al., 2010). Therefore, it is important to study this subtype of IDC, which may be useful in better cancer management. Here we have studied the proteomic profile of ER positive/HER2/neu negative IDCs. Further interaction and coexpression of proteins were analyzed by using bioinformatic tools. In addition, the expressions of key differentially expressed proteins were validated by two-dimensional electrophoresis and Western blot analysis.
Materials and Methods
Chemicals
All chemicals were procured from Sigma-Aldrich (St. Louis, MO, USA), unless mentioned. Glu-fibrinopeptide and polyethylene glycol were procured from Waters (Waters Corporation, Milford, USA). All the primary antibodies were purchased from Abcam (Abcam, UK).
Clinical breast tumor tissue
A total of six malignant breast tissue biopsy specimens and corresponding adjacent normal breast tissue from the same patients without any signs of malignant transformation were obtained from Jehangir Hospital, Pune, India. Collected samples were immediately snap-frozen in liquid nitrogen and were stored at −80°C until further use. All these cases were diagnosed between the year 2006 and 2008; and had given their informed consent in accordance to the guidelines of the hospital/institutional scientific and ethical committee approval prior to inclusion into the study. The percentage of epithelial cells in tumor and normal tissue with more than 90% were subjected to proteomic analysis. Clinical information about the samples is listed in Table 1 and histology microphotographs are shown in Figure 1.
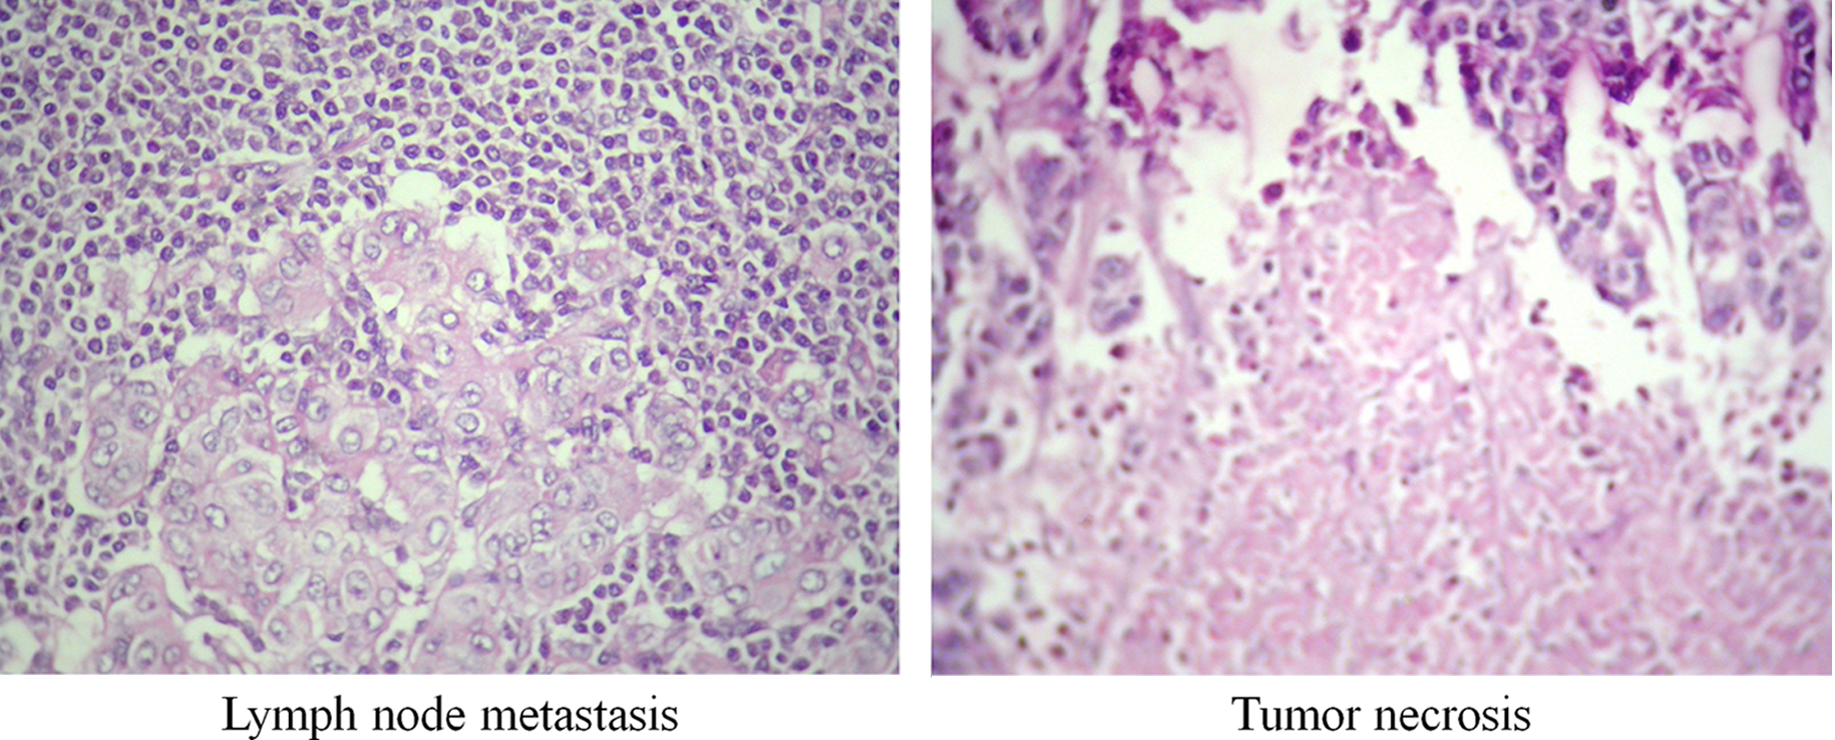
Hematoxylin and eosin stained histological 40× microphotographs showing lymph node metastasis and tumor necrosis.
NA*, not available.
Sample preparation
For analysis of LC-MSE (MS at elevated energy), pooled samples of six IDC clinical tissues and a pooled six adjacent control tissue samples were analyzed in three technical replicates. For two-dimensional electrophoresis (2DE) analysis and Western blot analysis, six individual IDC clinical samples and a pooled adjacent control tissue samples were independently analyzed. The frozen clinical IDC breast tissue samples were thoroughly washed with phosphate buffered saline (PBS), followed by homogenization by using hand-held tissue tearor (BioSpec Pvt. Ltd., USA) in protein extraction buffer containing 8 M urea, 2 M thiourea, 4% CHAPS, 70 mM DTT, 1% N-Deconoyl N-methylglucamide and 50 μL of mammalian protease inhibitor cocktail. Protein extract was centrifuged at 50,000 g for 1 h at 20°C. Protein concentration was determined by using a quick start Bradford protein assay (Bio- Rad, Hercules, CA, USA).
In-solution tryptic digestion for LC-MSE analysis
Extracted protein sample was precipitated by TCA/acetone. 10 μg of complex protein mixture was washed and solubilized in 50 mM ammonium bicarbonate buffer containing 0.1% RapiGest (Waters Corporation, MA, USA). Protein solution was subjected to reduction by using 100 mM DTT at 60°C for 15 min, followed by alkylation by using 200 mM iodoacetamide in dark at room temperature for 30 min. The proteins mixture was digested overnight with proteomic grade trypsin at 37°C.
LC-MSE analysis
Prior to LC-MSE acquisition, for proteome quantification predigested internal standard (yeast alcohol dehydrogenase, Waters Corporation) was spiked with 50 fmol per 2 μL of protein digest. The 2 μL of protein digest with final concentration of 100 ng/μL was analyzed by LC-MSE workflow by using nanoACQUITY (UPLC) online coupled to Q-TOF mass spectrometer, Synapt HDMS system (Waters Corporation) equipped with a nanolockspray ion source with flow rate of 300 nL/min (external lockmass standard: Glu-fibrinopeptide (GFP) (m/z 785.8426)). Sampling of the lock spray channel was performed every 30 s, and the system was tuned for a minimum resolution of 10000 and calibrated using GFP infusion. Both tumor and corresponding control digests were acquired in three technical replicates. Peptide samples were injected online onto a 5 μm Symmetry C18 trapping column (180 μm×2 cm length) at a flow rate of 15 μL/min. Peptides were separated by in-line gradient elution onto BEH (Bridged Ethyl Hybrid) 130 C18 1.7 μM×75 μM×150 mm nanoACQUITY analytical column, at a flow rate of 300 nL/min using a linear gradient from 5% to 40% B over 35 min (A. 0.1% formic acid in water, B. 0.1% formic acid in acetonitrile). Acquisition was performed in positive V mode in a mass range of 50–1990 m/z with a scan time of 1 s with alternating low (5 eV) and high (20 to 40 eV) collision energy. A capillary voltage of 3.2 kV, source temperature of 80°C, and cone voltage of 32 V were maintained during the analyses.
Data processing and database searching
LC-MSE data were processed by using ProteinLynx Global Server (PLGS version 2.4. Waters Corporation) to generate charge state reduced and deisotoped precursor mass lists as well as associated product ion mass lists for subsequent protein identification and quantification. The processed data were allowed to search against reviewed human subset of UniProt database.
Prior to searching, the internal standard yeast alcohol dehydrogenase sequence (UniProt) was added to the human database. Default search parameters were used, including the “automatic” setting for mass accuracy, a minimum of 1 peptide match per protein, a minimum of 3 consecutive product ion matches per protein, a minimum of 7 total product ion matches per protein, and 2 missed tryptic cleavage site were allowed. A fixed modification of carbamidomethylation of cysteine residues and variable modifications as oxidation of methionine residue were used during search. False positive rate (FPR) for protein identification was set to 4%, and the absolute protein quantification functionality was enabled using yeast alcohol dehydrogenase as an internal standard.
Protein–protein interaction and coexpression analysis of IDC proteome
IDC proteome identified by LC-MSE were uploaded onto STRING (Search Tool for the Retrieval of Interacting Genes) database search (Szklarczyk et al., 2011). STRING database version 9.0 (http://www.string-db.org) covers 5,214,234 proteins from more than 1100 completely sequenced organisms. It provides comprehensive protein–protein interaction and coexpression analysis with a confidence score using both experimental evidence and predicted interaction information.
Functional analysis of IDC proteome
IDC proteome identified by LC-MSE were analyzed by PANTHER (Protein Analysis THrough Evolutionary Relationships; http://www.pantherdb.org) (Mi et al., 2010). This software allows predicting protein functions using experimental evidence and evolutionary relationships. The classified proteins were then categorized and visualized by a biological process, molecular function, protein class, and pathway ontology terms.
2DE and image analysis
For 2DE analysis, 11 cm nonlinear 4–7pH gradient IPG strips (Bio-Rad Laboratories, Richmond, CA, USA) were rehydrated with protein (270 μg), solubilized in rehydration buffer 8 M urea, 2 M thiourea, 30 mM Tris-HCl, 4% CHAPS, 70 mM DTT, 0.11% N-deconoyl N-methylglucamide, 0.1% 3-(decyldimethylammonio) propane sulfonate, and 0.1% of ampholytes (GE Healthcare Bio-Sciences, Sweden). First dimension isoelectric focusing was performed using Protean IEF cell (Bio-Rad Laboratories) followed by reduction with DTT (2%) and alkylation with iodoacetamide (2.5%) prepared in 6 M urea, 2% SDS, 0.375 M Tris-HCl (pH 8.8), 20% glycerol. Second dimension separation on to 12.5% SDS PAGE was performed using either SE 600 Ruby (GE Healthcare Bio-Sciences, Sweden) or Protean II xi Cell (Bio-Rad Laboratories), and resolved proteins were visualized by staining with CBB R250. Gel images were acquired by using GS800 calibrated densitometer (Bio-Rad Laboratories) and image analysis was performed by using PDQuest Advanced software (Bio-Rad Laboratories).
In-gel tryptic digestion
Excised protein gel spots were destained in solution containing 50 mM ammonium bicarbonate/50% acetonitrile. Gel spots were dehydrated in 100% acetonitrile followed by drying in a vacuum concentrator. Gel spots were reduced for one hour in 10 mM DTT at 45°C and subsequently alkylated with 55 mM iodacetamide in the dark at room temperature. Gel spots were again dehydrated, dried, and rehydrated in proteomic grade trypsin solution at 20 μg/mL enzyme concentrations. After about 20 h of incubation at 37°C, the peptides were extracted with 5% formic acid in 50% acetonitrile. Supernatants of protein digest were dried in vacuum centrifuge at room temperature. Evaporated digest samples were stored at −80°C until further analysis.
MALDI MS/MS analysis
MALDI MS/MS analysis was performed on the SYNAPT HDMS system (Waters Corporation). Peptide digests were reconstituted in 5% ACN containing 0.1% TFA and premixed with equal volume of 10% CHCA matrix and applied on to 96-well MALDI plate. All samples were acquired on 200 Hz solid state UV laser in V mode by MassLynx 4.1. The quadrupole profile was set to 500 m/z for 5% of the scan time and then ramped to 1500 m/z for remaining period of the scan. The instrument mass calibration was performed by using polyethylene glycol. Proteins were identified by MALDI survey method, involving peptide mass fingerprinting (PMF) and MS/MS. In the MS survey method, spectra were recorded in the mass range of 800–4,000 m/z for 60 s. MS/MS analysis was performed in a data-dependent manner for the top 7 peptides with higher relative intensity for 30 s each and product ion mass range was set to 100 to 1,500 m/z. For protein identification, data were processed by PLGS software, searched against a UniProt human database with mass tolerance set to 100 ppm, carbamidomethylation as fixed modification and methionine oxidation as variable modification. Further, amino acid sequences corresponding to tryptic peptide masses were identified and subjected to BLAST homology searches to rule out alternative protein identifications.
Western blot analysis
The total protein extract (10 μg) from both normal and IDC samples were resolved onto 12.5% SDS-PAGE gels by using Mini PROTEAN™ Tetra cell (Bio-Rad, Hercules, CA, USA). The proteins were then transferred on to PVDF membranes and blocked for 1 h with 5% membrane blocking agent (GE Healthcare UK Limited) prepared in TBS, and then incubated with antibodies either 1:3000 annexin A5 (ab14196, Abcam), 1:500 HSP70 (ab31010, Abcam), 1:5000 GAPDH (ab8245, Abcam), 1:3000 alpha-1-antitrypsin (ab7633, Abcam), 1:4000 fibrinogen (ab6666, Abcam), 1:4000 apolipoprotein A1 (ab7613, Abcam), 1:5000 SOD2 (ab16956, Abcam), 1:5000 S100 A10 (ab52272, Abcam), or 1:7000 beta-actin (A1978, Sigma-Aldrich), followed by 1:5000 of the appropriate biotin conjugated secondary antibody and 1:2000 streptavidin conjugated HRP. Protein bands were visualized using SIGMAFAST™ DAB peroxidase substrate. Blot images were acquired by using GS800 calibrated densitometer (Bio-Rad) and images were analyzed by using Quantity One software (Bio-Rad). In addition, Western blots were stained with coomassie stain to assess protein load in Western blot analysis as described by Welinder et al. (2011).
Statistical analysis
LC-MSE data were analyzed according to Cheng et al. (2009). Scatter plot comparison of log2 transformed peptide peak intensities obtained from technical replicates of representative four proteins produced a correlation coefficient of 0.981 (Supplementary Fig. S1: Supplementary data are available online at www.liebertpub.com/omi). A Students t-test was performed for the proteins that showed fold change of 1.5 and above. The fold change was considered significant if p value is less than 0.05 by Students t-test. For 2DE analysis, the density of each protein was expressed as mean±SD. The statistical significance was established by Student's t-test. Differences were considered significant if p<0.05.
Results
Protein identification by LC-MSE method
A total of 118 protein hits were identified from a pooled sample of six IDC tissues by LC-MSE method and details are listed in Table 2 and Supplementary Table 1. Of these, 26 proteins (22%) were overexpressed in tumor in comparison with the pooled control tissue samples; details of overexpressed proteins are listed in Table 2. Average fold change of overexpressed protein was 2.01 with expression range between 1.5 to 3.24. Annotated MS/MS spectra of two peptides for each of the differentially expressed proteins, as well as unique peptide sequence have been provided in Supplementary Files 1 and 2.
LC-MSE
Serial numbers (Sl. N) from 1–26 proteins were differentially expressed and are arranged from highest fold-expression to lowest. aAccession number of protein is from UniProt database; bFE, fold expression calculated as ratio of tumor to control samples; cMW, molecular weight of protein in daltons; dPI, protein isoelectric point; ePlgs score, PLGS score (software generated score that defines the confidence of protein identification); fSC, sequence coverage (identified peptides sequence coverage with protein's full sequence in database).
Protein–protein interaction and coexpression study
The IDC proteome interaction was generated as evidence-based prediction (Fig. 2a). The global STRING generated protein network showed high connectivity among stress-related, cytoskeletal, and glycolysis pathway proteins. The prominent interaction network was found to be within proteins including SOD1, SOD2, HSP70, thioredoxin, peroxiredooxin1, triosphosphate isomerase, GAPDH, annexins, beta-actin, and apolipoprotein A1. Further, IDC interactome was analyzed for coexpression mapping (Fig. 2b) where S100 A10 coexpress with annexins. The significant coexpression was found between aldolase and GAPDH, as well as SOD1 and peroxiredoxin 1. Additionally, actin was also found to be coexpressed with tubulin, cofilin, aldolase and GAPDH.

Prediction of
Functional analysis of IDC proteome
The majority IDC proteomes were related to ontology of cytoskeletal, stress response, and binding. In biological processes, the proteins related to metabolism, stress response, signal transduction, and developmental process were significantly enriched (Fig. 3a). In molecular function, the proteins belonging to structural molecule activity, protein binding, oxidoreductase activity, receptor activity, and hydrolase activity were selectively enhanced emphasizing on the biological process they are involved (Fig. 3b). In the protein class, cargo protein, cytoskeletal protein, signaling molecule, receptor, transferase, structural protein, and isomerase classes were enriched (Fig. 3c). In the pathway category, cytoskeletal regulation, glycolysis, integrin signaling pathways were enriched (Fig. 3d).

PANTHER classification of IDC proteins based on
Validation experiments
Protein identification by 2DE method
In the IDC proteome, a total of 30 proteins were identified, of which 25 proteins were found to be differentially regulated across all six samples (Fig. 4a and 4b). Average fold changes of upregulated proteins was found to be within the range of 1.5 to 3.31. Amongst differentially expressed proteins, 24 proteins were upregulated and one protein was downregulated, the details are listed in Table 3. Only five proteins including alpha-1-antitrypsin, actin, fibrinogen, annexin A5, and apolipoprotein A1 were found to be differentially expressed in both LC-MSE and 2DE analysis. Some of these proteins were further validated by Western blotting.

Serial numbers in table corresponds to spot numbers in Figure 4a.
Western blot analysis
Western blot analysis was performed using antibodies against alpha1 antitrypsin, annexin A5, HSP70, apolipoprotein, fibrinogen, GAPDH, SOD2, beta-actin, and S100 A10. The differential expression of these proteins was found to be prominent across all tumor samples in comparison with the pooled control sample. Upregulation of these proteins in tumor was statistically significant with p value less than 0.01 as shown in Figure 5a and 5b.

Discussion
Breast cancers are characterized based on protein expression profile, such as ER, PR hormone receptors, and HER2/neu oncogenes. Such characterization will aid in effective therapy (e.g., hormone therapy and Herceptin therapy). However, the lone protein expression status of ER or HER2/neu does not represent the ER dependent or HER2/neu dependent signaling pathways. Moreover, different subtypes of IDC differ in their morphology, clinical course, and response to therapy. Therefore, the objective of the present study was to identify differentially expressed proteins associated with ER positive and HER2/neu negative subtype that may serve as useful information in understanding the molecular mechanisms of carcinogenesis and progression. Widely used gel-based approaches have limitations such as being laborious and time consuming; several other liquid chromatography (LC) based quantification methods have been developed (Gygi et al., 1999; Ong et al., 2002; Ow et al., 2008). The evolved LC-MSE is a parallel, unbiased, and continuous process where all peptide precursors are simultaneously separated and fragmented, regardless of intensity enabling identification of low abundant peptides that provide enhanced peptide coverage for identification. LC-MSE technique uses an internal spiked standard with alternating cycles of scans at low and elevated collision energy to obtain both protein quantification and identification data set in a single LC-MS run (Silva et al., 2006).
LC-MSE based quantification was performed to obtain comparative proteomic data set of six patients with ER positive, HER2/neu negative subtype IDC, and a corresponding pooled control sample. This study identified a total of a 118 proteins, of which 26 were differentially expressed. Out of these 26 proteins identified by LC-MSE analysis, only five proteins including alpha-1-antitrypsin, actin, fibrinogen, annexin A5, and apolipoprotein A1 were also found to be differentially expressed in 2DE analysis with a similar trend of fold change as that of LC-MSE (Table 3). Validation experiments employing Western blot analysis also confirmed the expression of proteins including beta-actin, alpha-1 antitrypsin, annexin A5, HSP70, apolipoprotein A1, fibrinogen, GAPDH, SOD2, and S100 A10. This proteomic study indicates upregulation of specific proteins involved in cytoskeletal organization, metabolism, and stress.
Cytoskeleton organization proteins
The actin and associated protein of cytoskeleton organization is critical for cell motility and migration. In this study, the IDC proteome consists of about 15% cytoskeletal-associated proteins, including beta actin, collagen alpha 1, collagen alpha 2, desmin, fibrinogen alpha, fibrinogen beta, fibrinogen gamma, gelsolin, lumican, mimecan, myosin, decorin, prolargin, profilin, transgelin, tubulin beta2A, tubulin beta, and vimentin. Beta actin is associated with cell migration in breast cancer (Vandermoere et al., 2007). Similarly, an abundance of fibrinogen and transgelin is associated with structural integrity and stabilization of actin cytoskeleton, respectively (Costantini et al., 1991; Gimona et al., 2003). Further, transgelin promotes migration and invasion of cancer stem cells (Lee et al., 2010). Many of these cytoskeletal proteins have been reported in IDC. However, the implication of cytoskeletal proteins in carcinogenesis is obvious in general, but their expression specificity for ER positive and HER2/neu negative IDC is not well defined in particular. In addition, actin binding protein tropomyosin mutations and their expressions are associated with neoplastic phenotype (Marleen et al., 2008), and actin-based cell migration is a result of complex interaction network of proteins in the tumor microenvironment (Marleen et al., 2008), which also supports the STRING interaction network and coexpression as shown in Figure 2a and 2b. Hydrolysis of extracellular matrix facilitates cell migration and evidently the hydrolase activity is significantly enriched in molecular function (Fig. 3b). The migratory mode from epithelial to mesenchymal transition is considerably dependent on cytoskeletal reorganization, and such reorganizations may be facilitated by coexpression (Fig. 2b) and expression levels of actin interacting proteins including cofilin, gelsolin, profiling, and transgelin. Many of these proteins are reported to be deregulated in different cancers (Marleen et al., 2008), indicating their potential role in regulation of actin-cytoskeleton.
Proteins involved in stress response
In this study, upregulation of HSP27, HSP20, HSP70 cognate, heat shock factor binding protein 1, calreticulin, protein disulfide isomerase, superoxide dismutase Cu Zn, superoxide dismutase Mn mitochondrial, catalase, thioredoxin, peroxiredoxin 1, and peroxiredoxin 6 was observed in tumor tissues. Heat shock proteins (HSPs) during stress prevent aggregation and promote refolding of damaged proteins. HSPs are overexpressed in many of human cancers and are implicated in tumor cell proliferation, differentiation, invasion, and recognition by the immune system (Ciocca et al., 2005). In ER-positive breast cancers, ER-regulated HSP27 is implicated in co-localization with ER in the cell nucleus (Ciocca et al., 1990) and is associated with both good and poor prognosis, as well as been proposed to be a marker of estrogenic endometrial response (Ciocca et al., 1993). Further, protein disulfide isomerase (PDI) is overexpressed on the cancer cell surface due to oxidative stress (Uehara et al., 2000). Apart from catalysis of isomerase activity, PDI is a molecular chaperone assisting in protein folding (Puig et al., 1994; Quan et al., 1995). Generation of reactive oxygen species (ROS) has been implicated in the etiology of many human diseases, including cancer. Estrogen-induced ROS are associated with transducing signals through redox sensitive transcription factors including Trx-1 and NF-kB, which have been implicated in cell migration and invasion of the breast cancer (Okoh et al., 2010). Many proteins are expressed as a cellular defense mechanism against agents that induce oxidative stress, including superoxide dismutase (SOD). SOD Mn gene polymorphism is associated with increased breast cancer risk and survival (Mitrunen et al., 2001), and such biologically active SOD mimicking compounds would be valuable in understanding signal mechanisms implicated in the progression of disease (Jenney et al., 1999). The conversion of H2O2 into water and oxygen is catalyzed by catalase and peroxiredoxins, the latter dominates catalysis in cytosol (Finkel et al., 1998).
Calcium binding proteins
Oxidative stress response triggers the activation of different intracellular pathways, resulting significant changes in calcium ions, pH homeostasis, and production of lipid second messengers (Finkel et al., 1998). These changes are sensed by annexins, which interact with specific lipid and protein moieties at the plasma membrane, thus contributing to stress response via regulation of various signaling pathways (Monastyrskaya et al., 2009). In this study, annexin A1 and annexin A5 were upregulated and these proteins have been implicated in signal transduction pathways associated with inflammation, cell differentiation, and cell proliferation of both glandular epithelium and squamous epithelium (Lim et al., 2007). Annexin A1 is functionally involved in basal-like breast cancer metastasis by regulating TGF-β signaling and actin cytoskeletal reorganization (de Graauw et al., 2010). Annexin A5 is involved in the development of skeletal muscles (Arcuri et al., 2002), and proteomic studies with clinical breast cancer tissues have already reported the overexpression of annexin A1 and annexin A5 (Hondermarck et al., 2001; Weitzel et al., 2010). However, other reports indicate the distinctive loss of annexin A1 in breast cancer (Cao et al., 2008; Shen et al., 2005). Similar to annexins, S100 proteins are calcium binding proteins associated with intracellular and extracellular functions in diseases. These S100 proteins interact with many other proteins, including kinases and actin etc., and are involved in signaling to regulate cell proliferation and differentiation (Miwa et al., 2000). Coexpressed annexin A2 and S100 A10 form a heterotetrameric complex and interaction of cathepsin B with such complex on the surface of tumor cells could facilitate tumor invasion and metastasis (Mai et al., 2000). Further, the annexin A2 and S100 A10 complex is directly involved in reduction reactions and is a substrate for thioredoxin (Kwon et al., 2005). Interaction of S100 A10 and 14-3-3 proteins with BAD could attenuate the pro-apoptotic signals (Hsu et al., 1997), and annexin A1 through interaction with IKK (IkB kinase enzyme complex) is associated with the activation of transcription factor NF-kB-mediated metastasis in breast cancer (Bist et al., 2011). In the absence of HER2/neu, we speculate the interaction of S100 A10 and RAGE may play a key in tumorigenesis via ROS generation and NF-kB activation (Korwar et al., 2012).
Metabolic process
Elevated glycolysis is a characteristic phenomenon of tumors for energy requirement as survival, growth, and invasion is concerned. A significant percentage of proteins associated with metabolic processes were enriched in PANTHER classification by their biological process as shown in Figure 3a. Glycolytic proteins including ENOA, ALDOA, GAPDH, TPIS, and PGK1 were found to be upregulated in IDC tumors as reported in earlier studies (Hondermarck et al., 2001; Weitzel et al., 2010). Further, LDHB is overexpressed to produce NAD+, which is essential for glycolysis by converting pyruvate to lactate. These upregulated metabolic proteins have been related to additional functions in tumour, such as GAPDH, which is associated with oxidative stress, tubulin binding, mRNA stability, vesicular secretory transport, and DNA repair (Durrieu et al., 1987; Sirover et al., 2005; Zhou et al., 2008).
In conclusion, proteomic profiling of IDC resulted in the identification of 118 proteins, of which 26 proteins were differentially expressed. STRING interaction analysis revealed the prominent interaction of annexins with HSP27, beta-actin, S100 A10, and apolipoprotein A1. These proteins, along with S100 A10, may serve as a signature for IDC with ER positive/HER2/neu negative subtype.
Footnotes
Acknowledgment
The authors are grateful to Dr. Rama Sivaram for helping in procuring clinical breast cancer samples from Jehangir Hospital, Pune. This work was supported by CSIR network project NWP0004. We would also like to thank Dr. Surekha Zingde, ACTREC, for improving the quality of the manuscript, Dr. Uttara Joshi, Dr. N S. Jalnapurkar for helping in histological analysis, and Dr. Jomon Joseph, NCCS, for his generous donation of anti-actin antibody. AMK would like to thank UGC, New Delhi for research scholarship, Yashwant Kumar for helping in acquiring LC-MSE data, and Dr. Bhushan B. Dholakia for critical reading of manuscript.
Author Disclosure Statement
The authors have no conflict of interest to state.
References
Supplementary Material
Please find the following supplemental material available below.
For Open Access articles published under a Creative Commons License, all supplemental material carries the same license as the article it is associated with.
For non-Open Access articles published, all supplemental material carries a non-exclusive license, and permission requests for re-use of supplemental material or any part of supplemental material shall be sent directly to the copyright owner as specified in the copyright notice associated with the article.